Update for November 26, 2023: A new LCR/BFP+ chart generation server is currently in final stages of development and will go online soon. In the meantime, stay tuned to the LCR Twitter account for the latest charts and updates on when the new system goes online. Stay tuned! - Dan
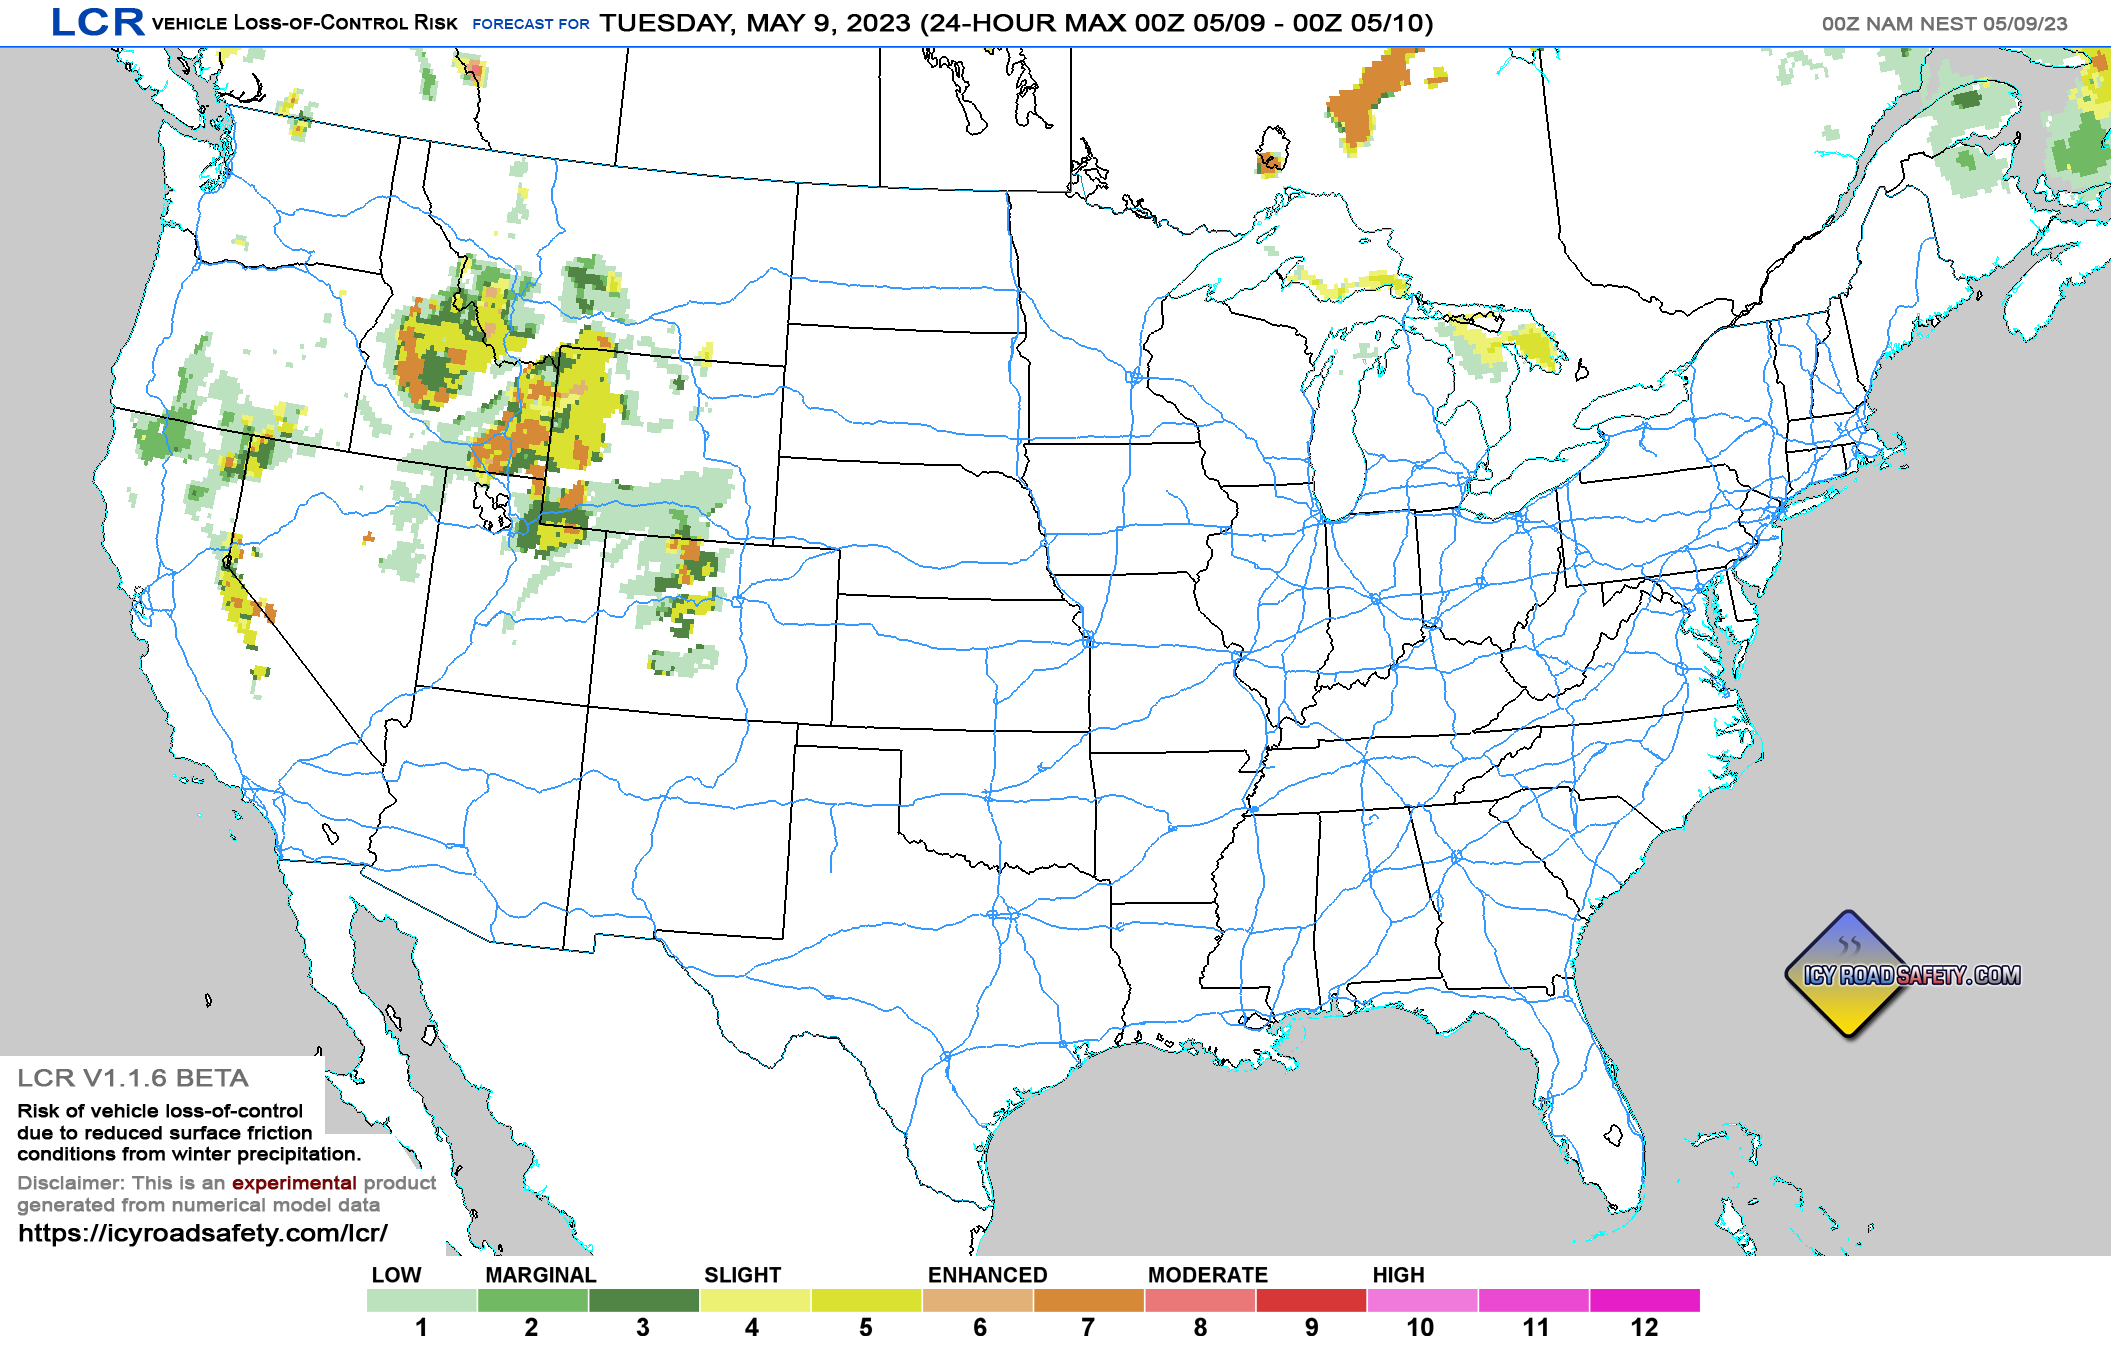
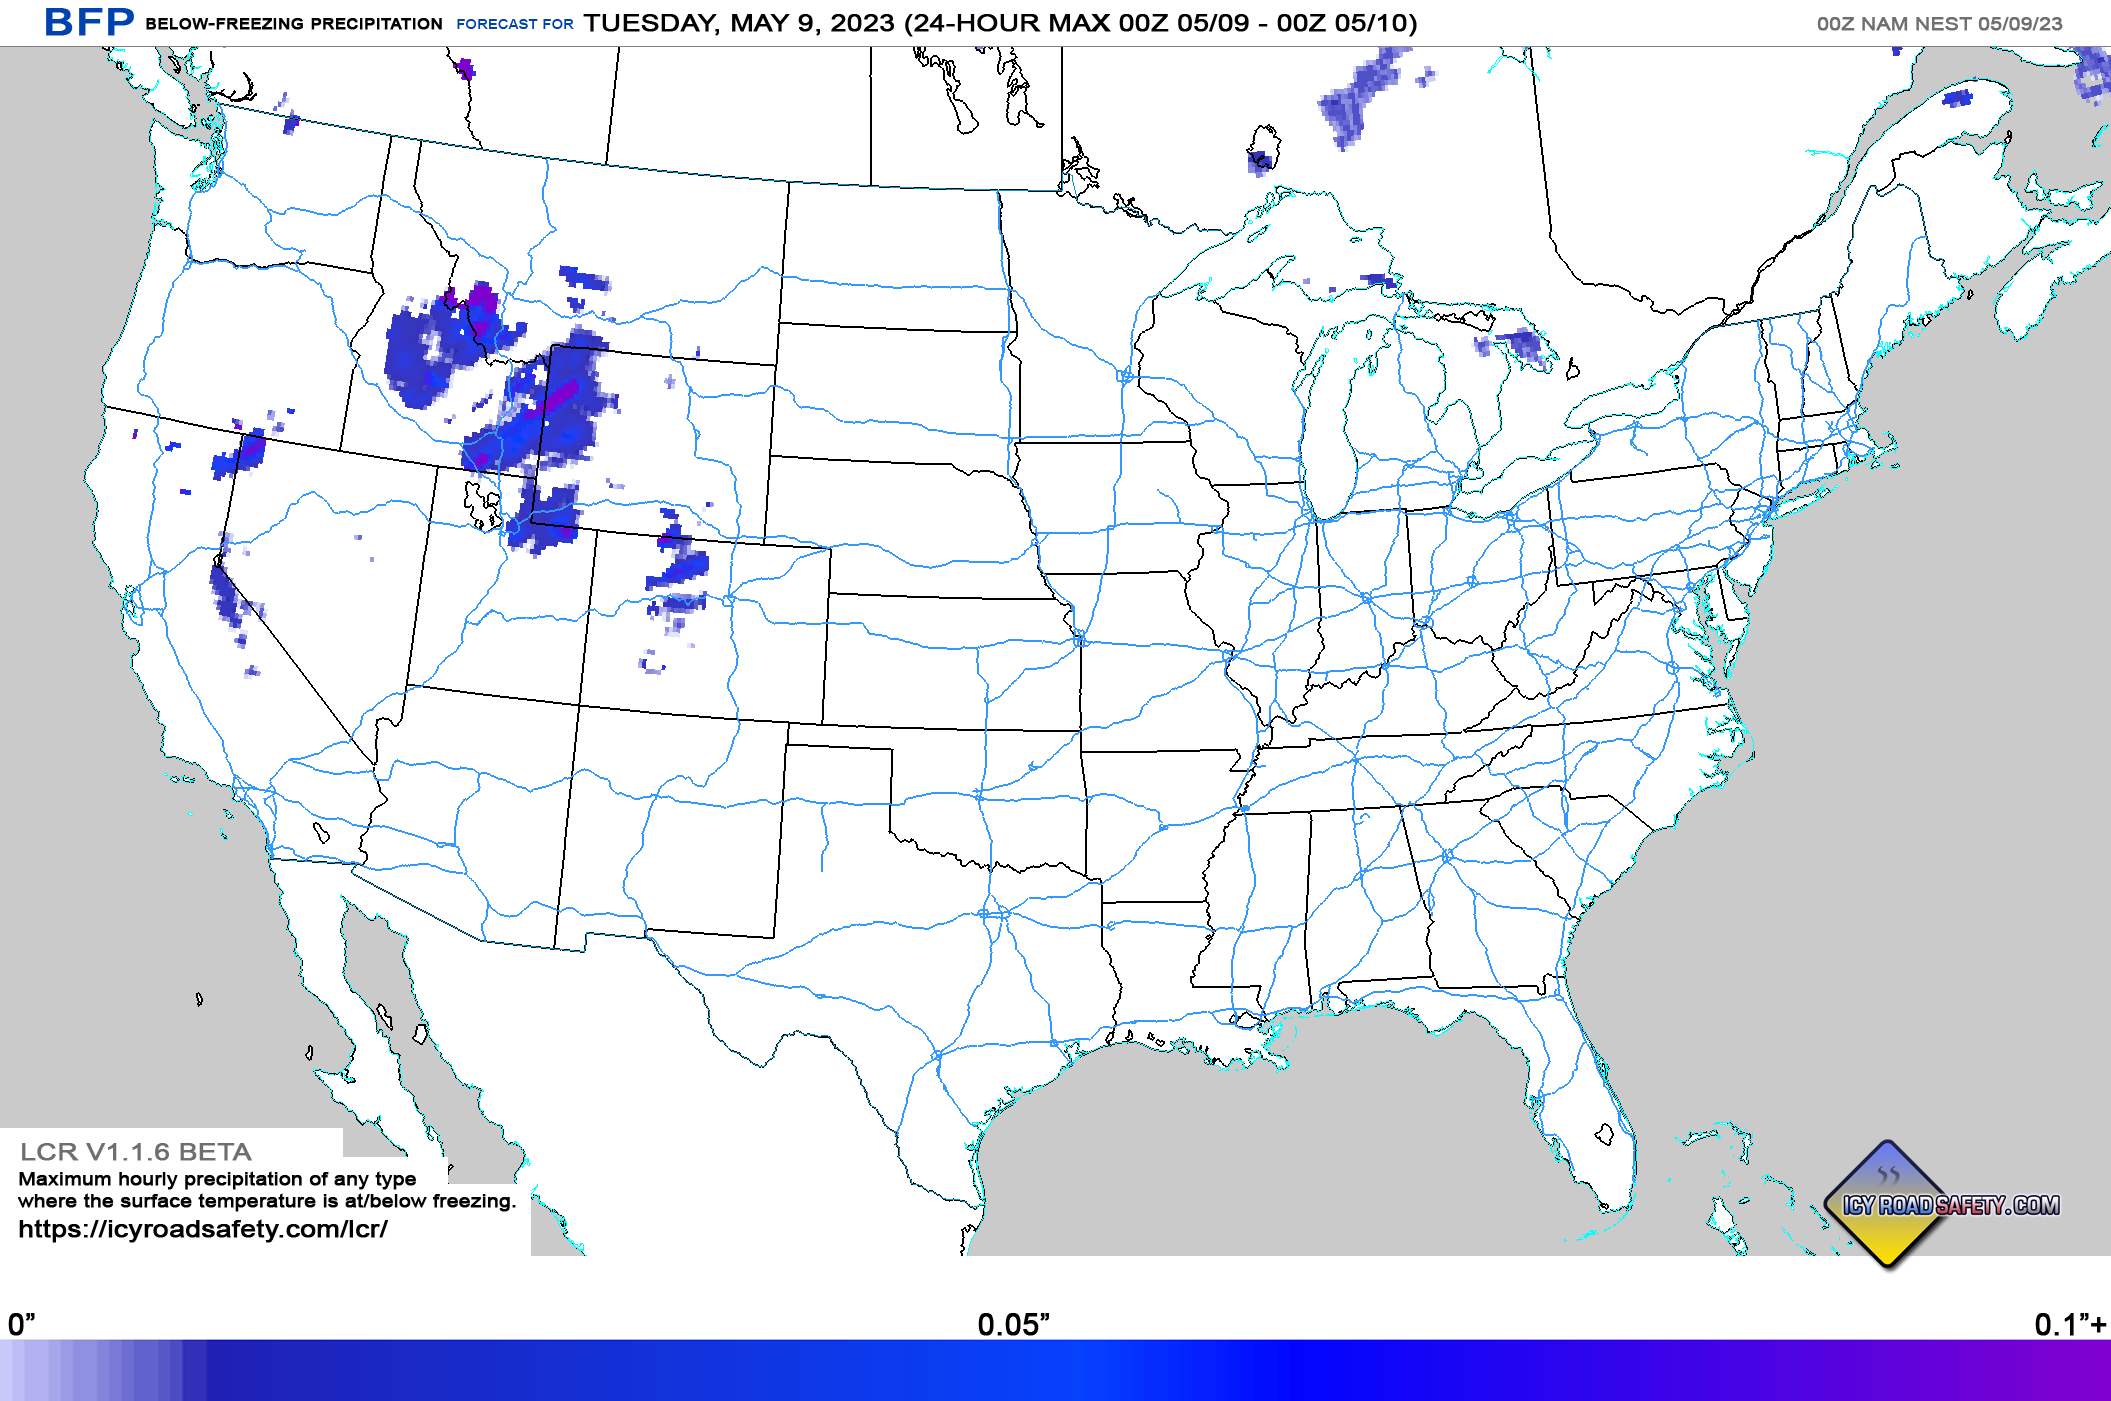
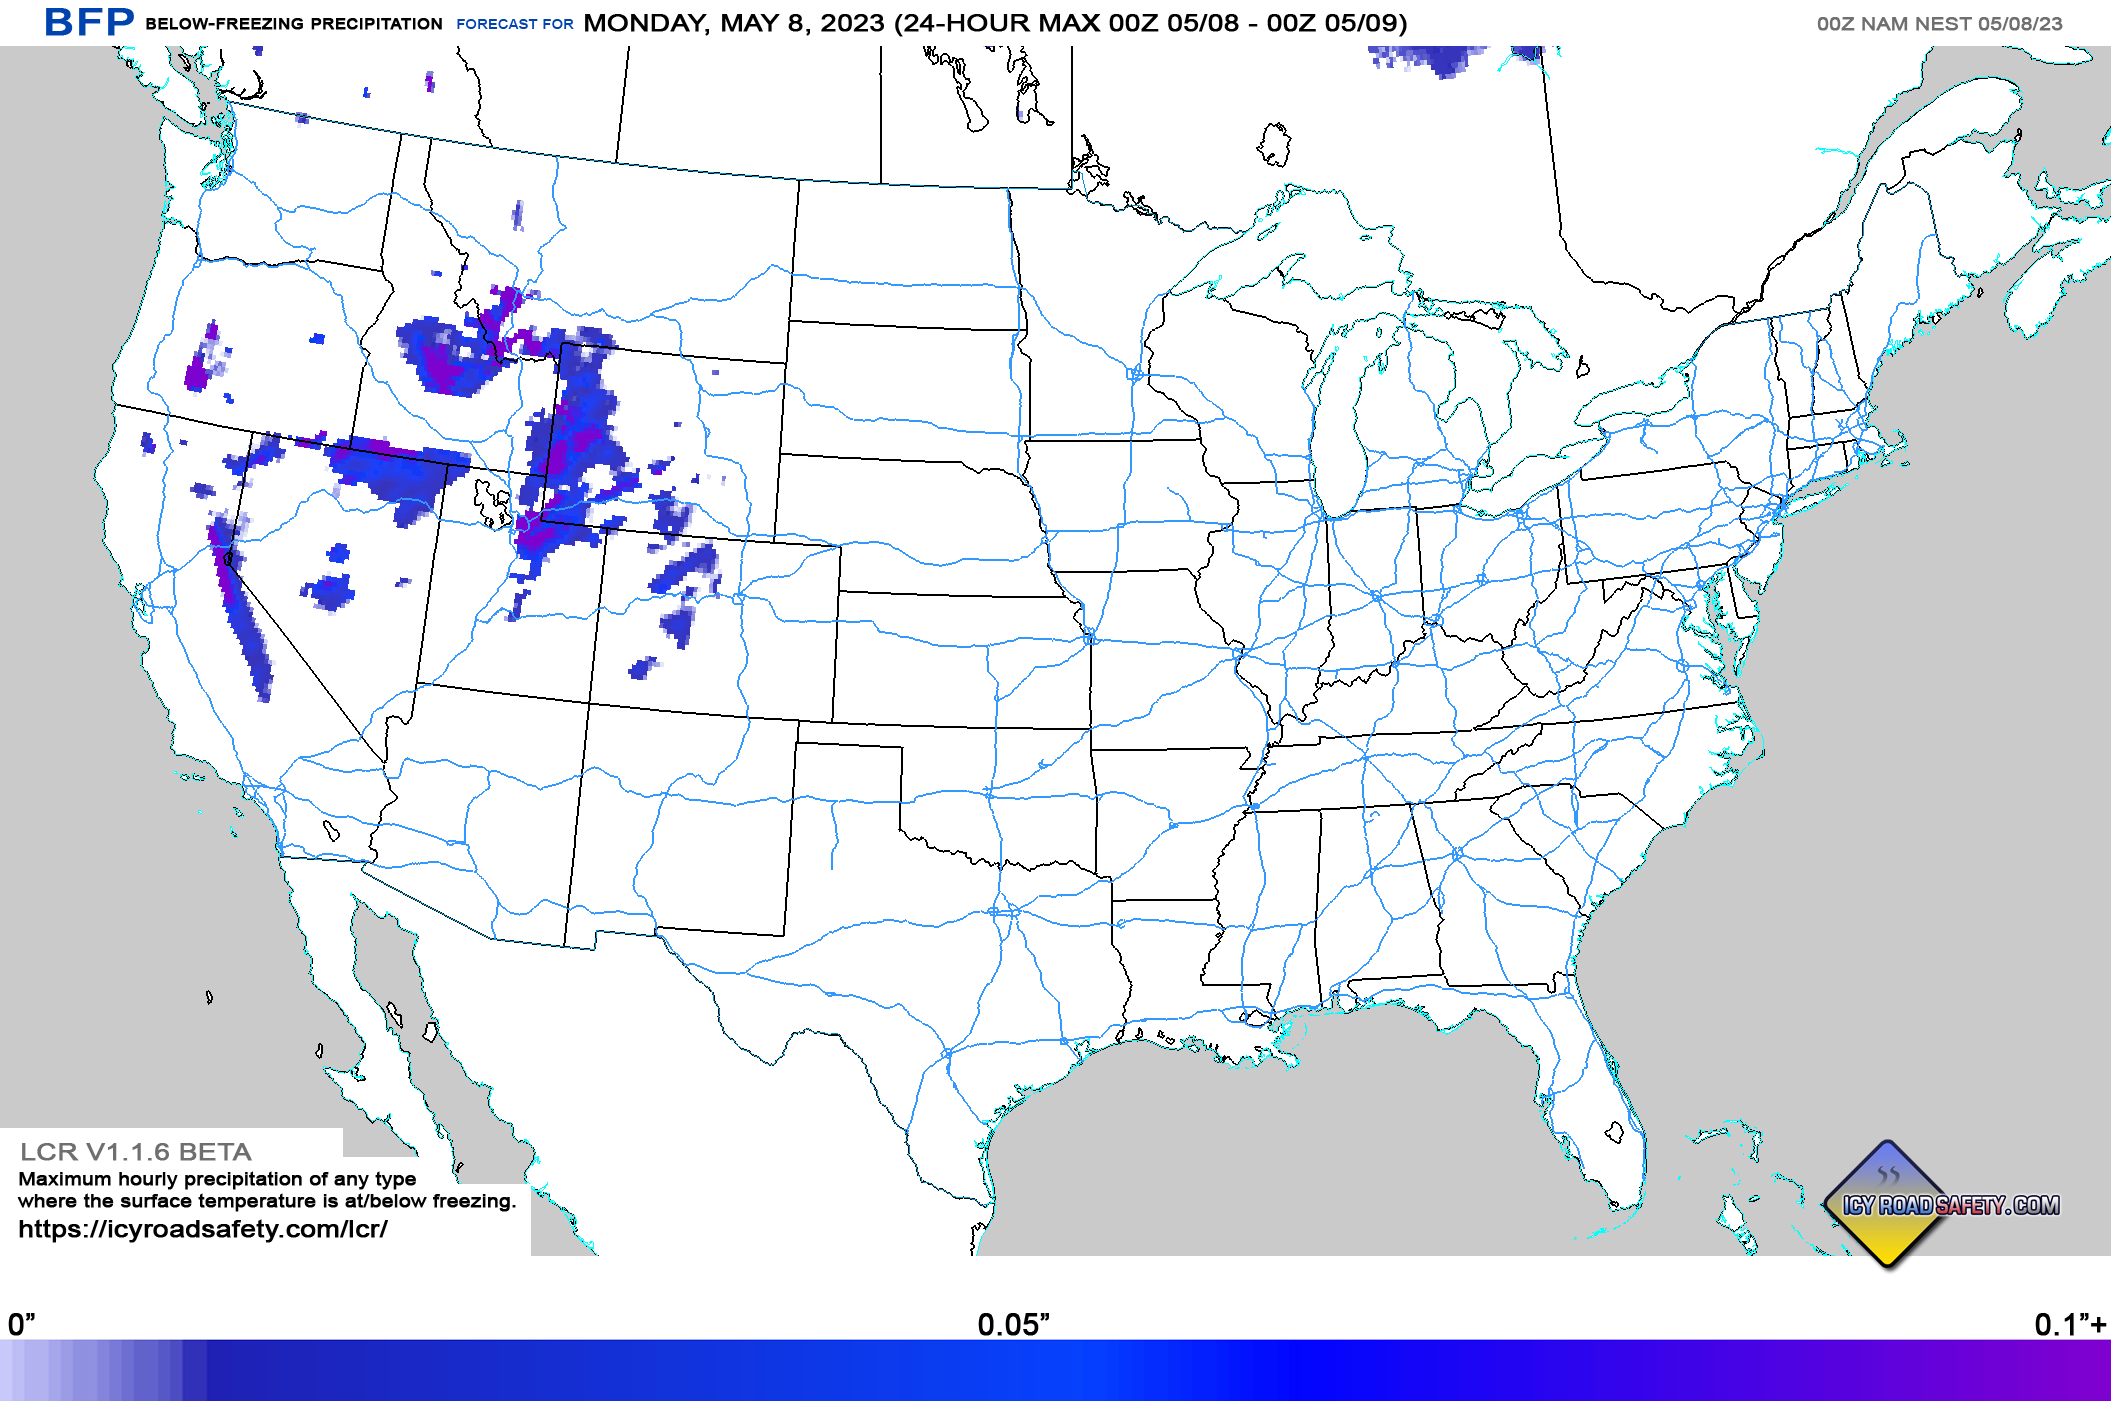
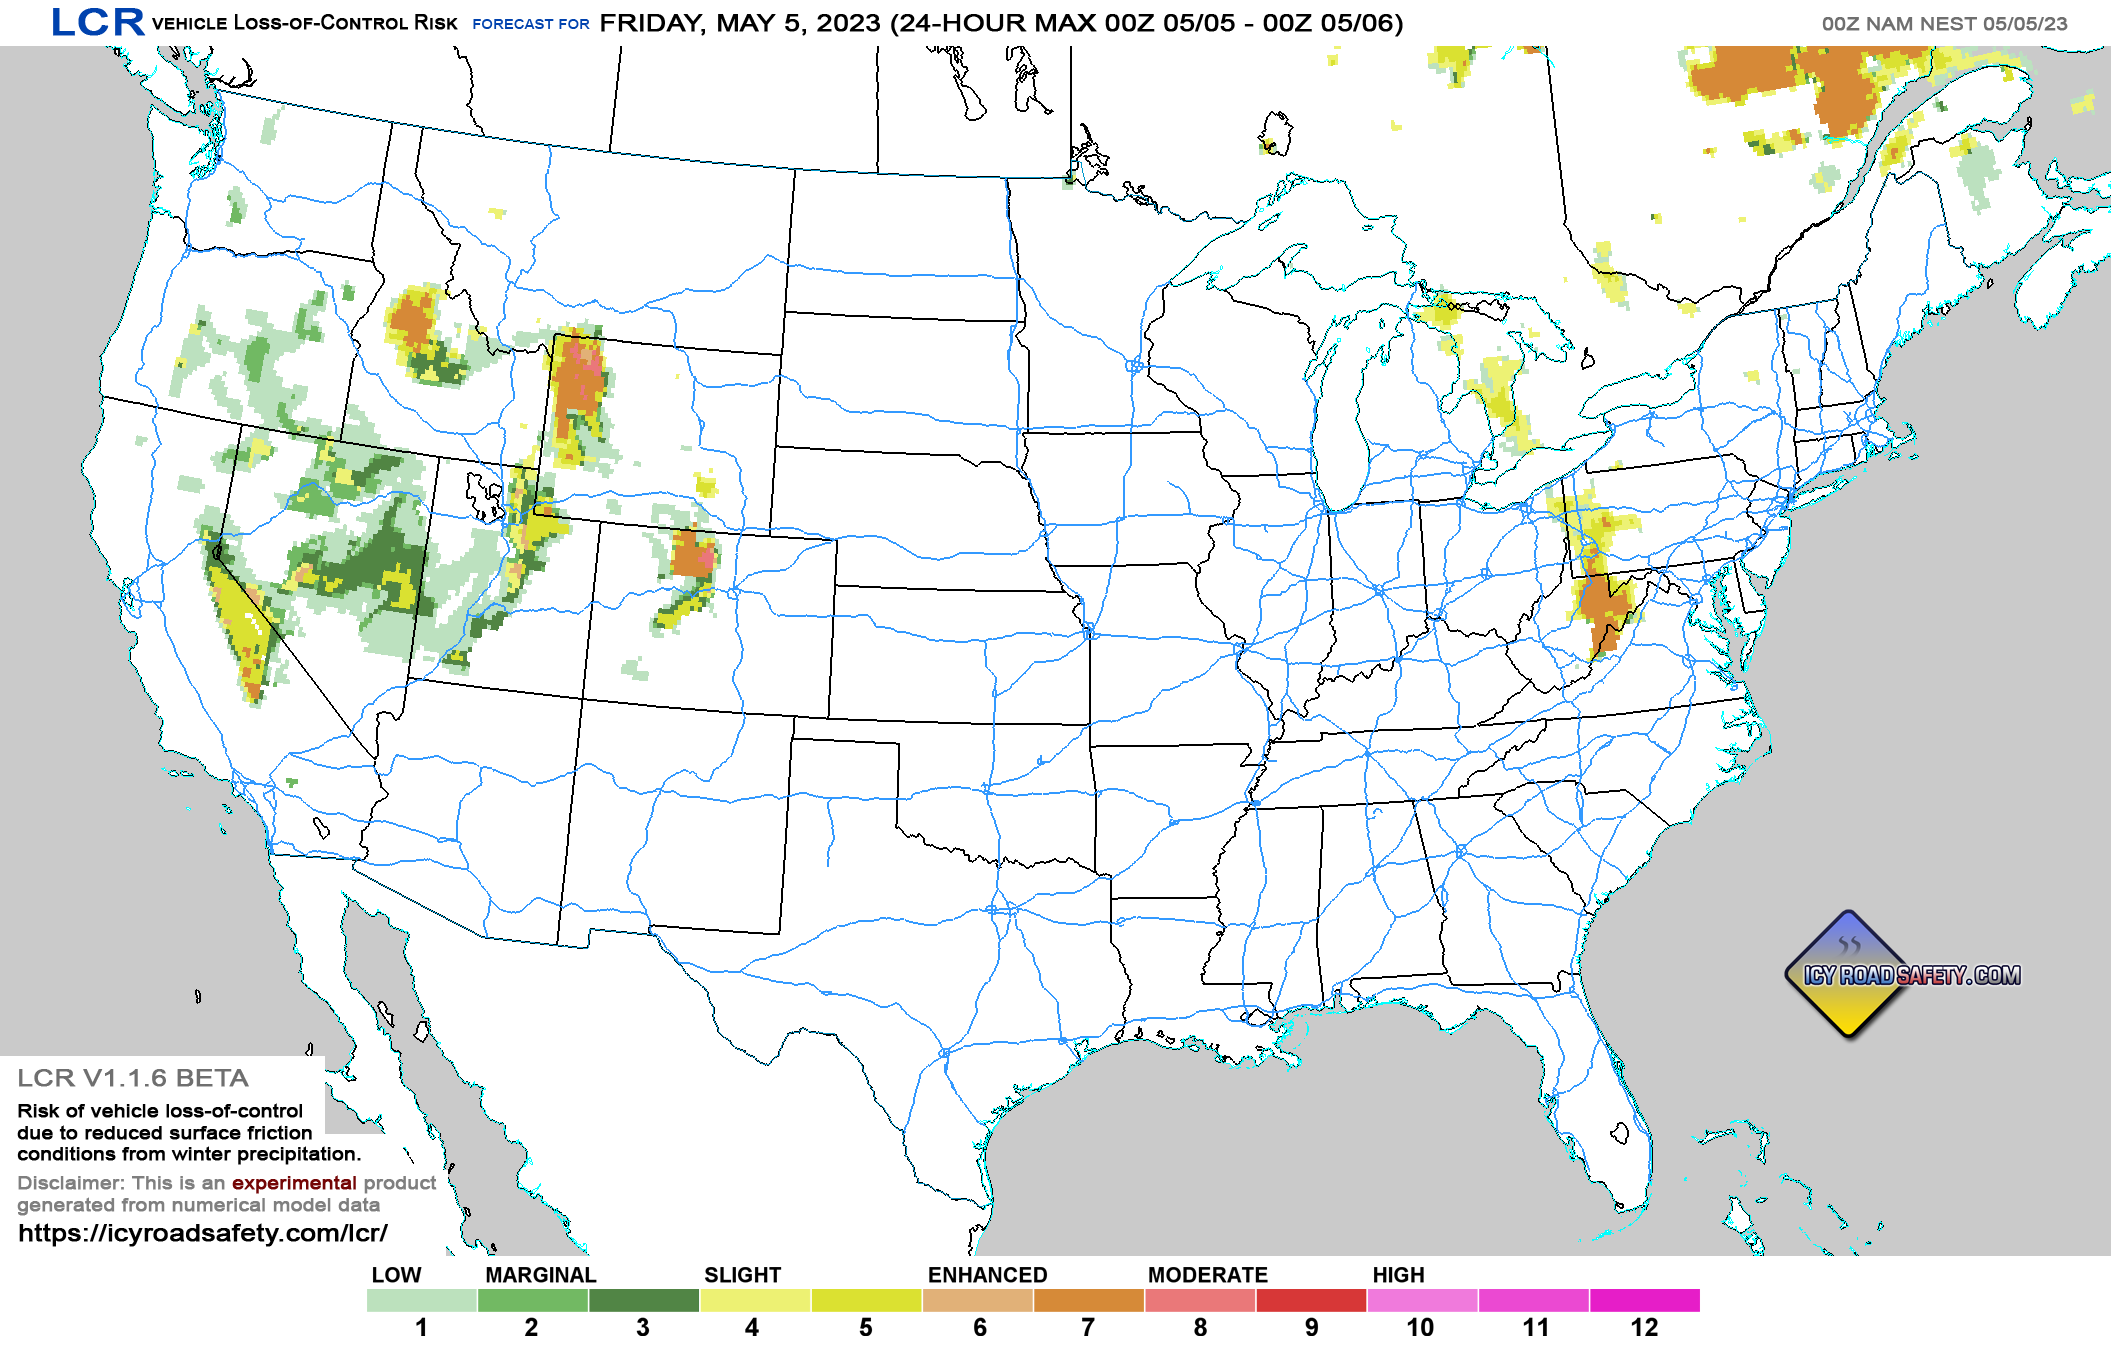
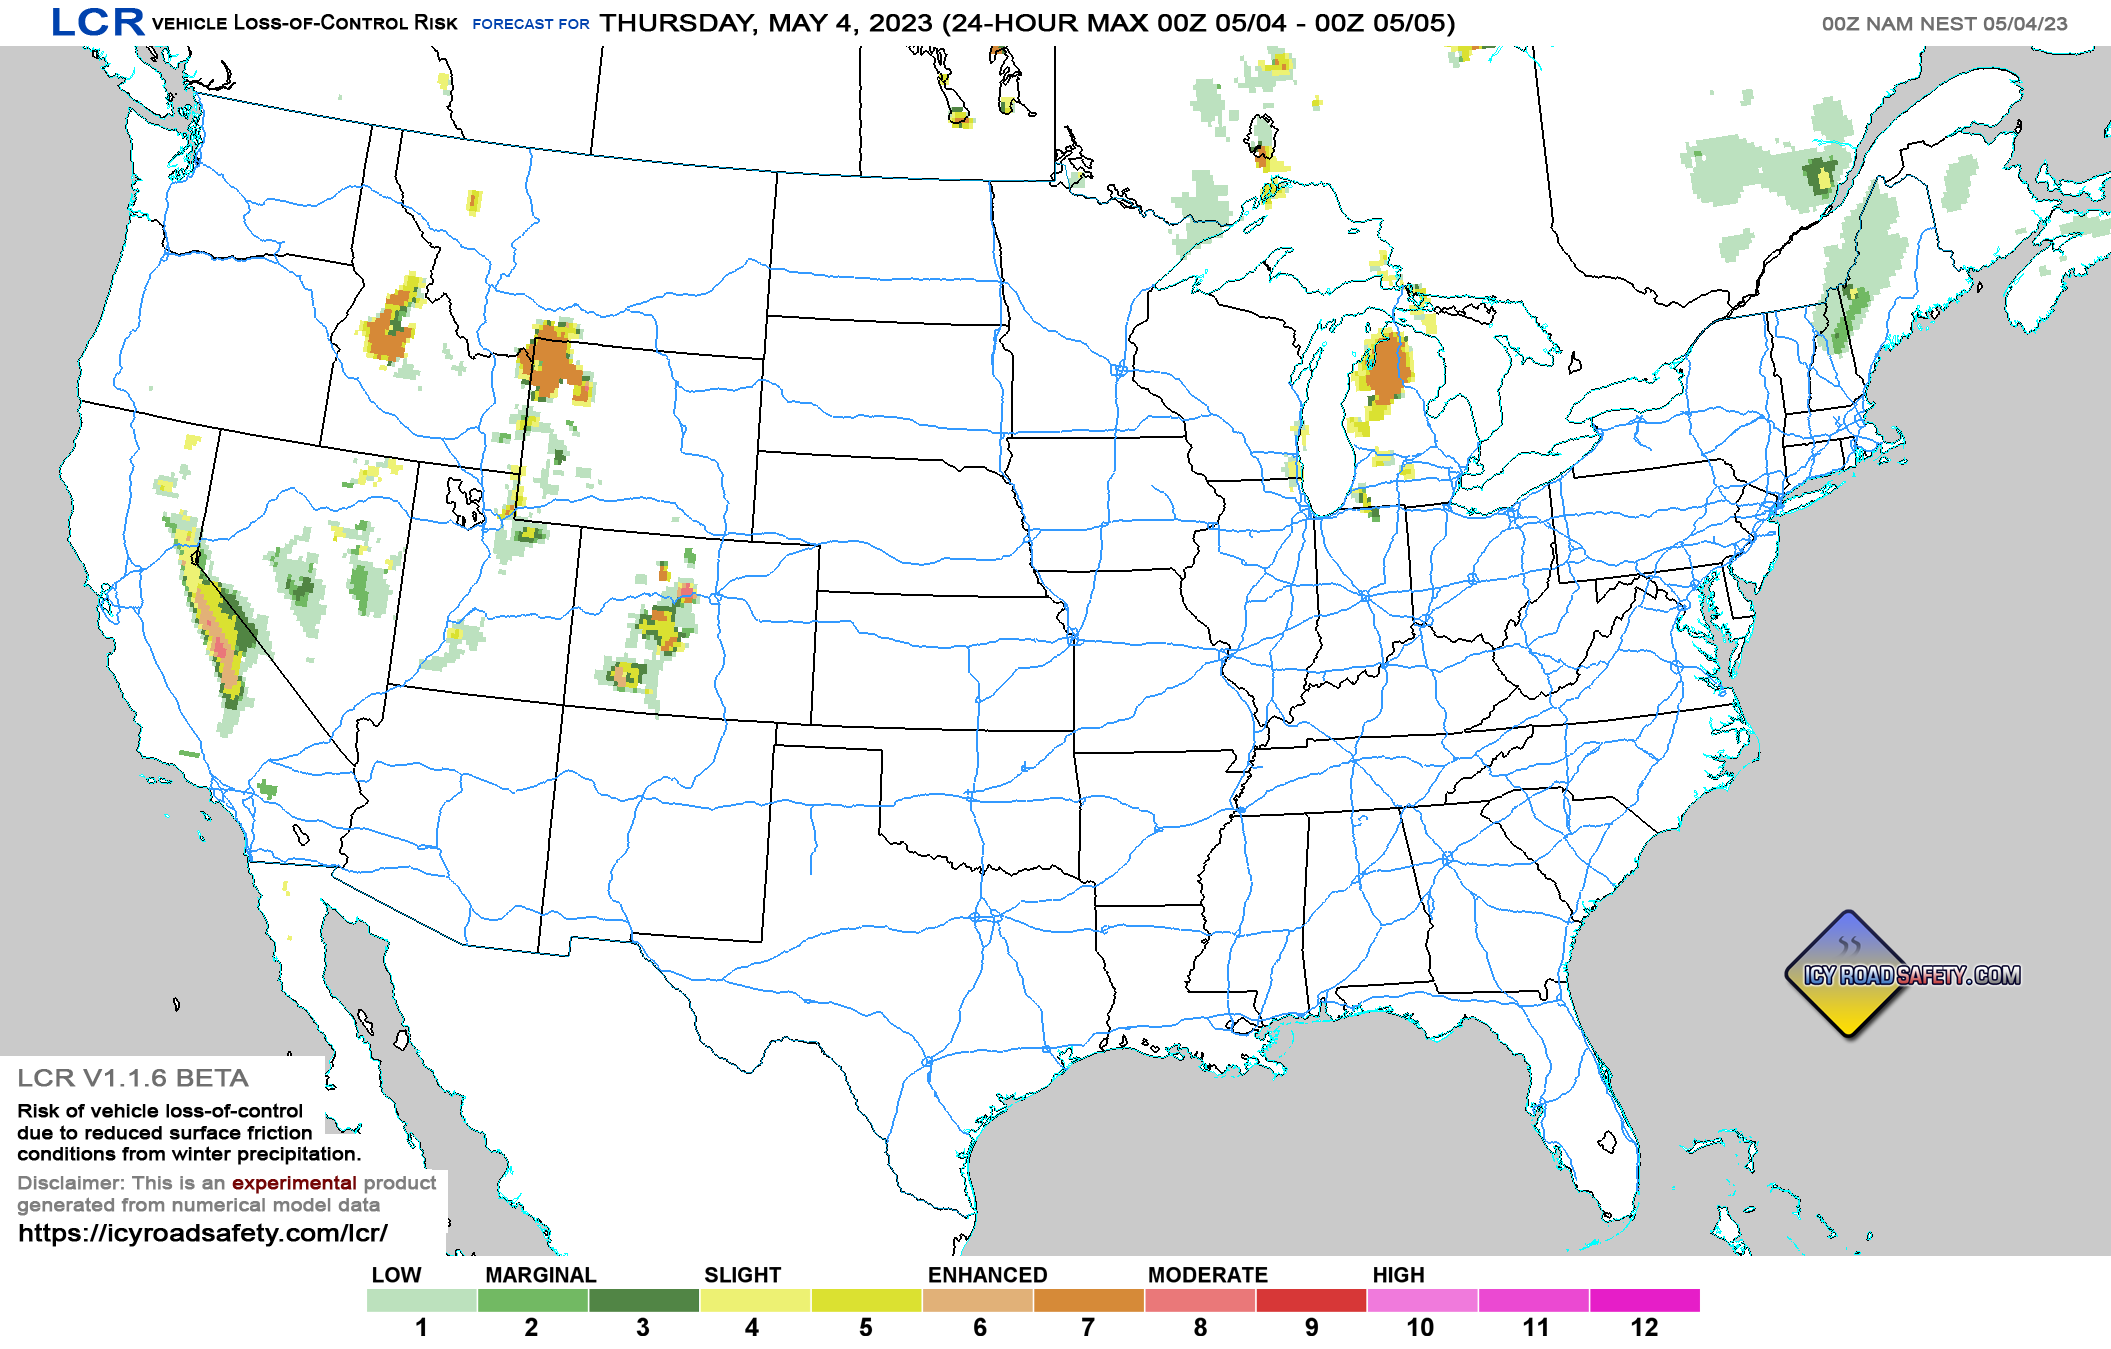
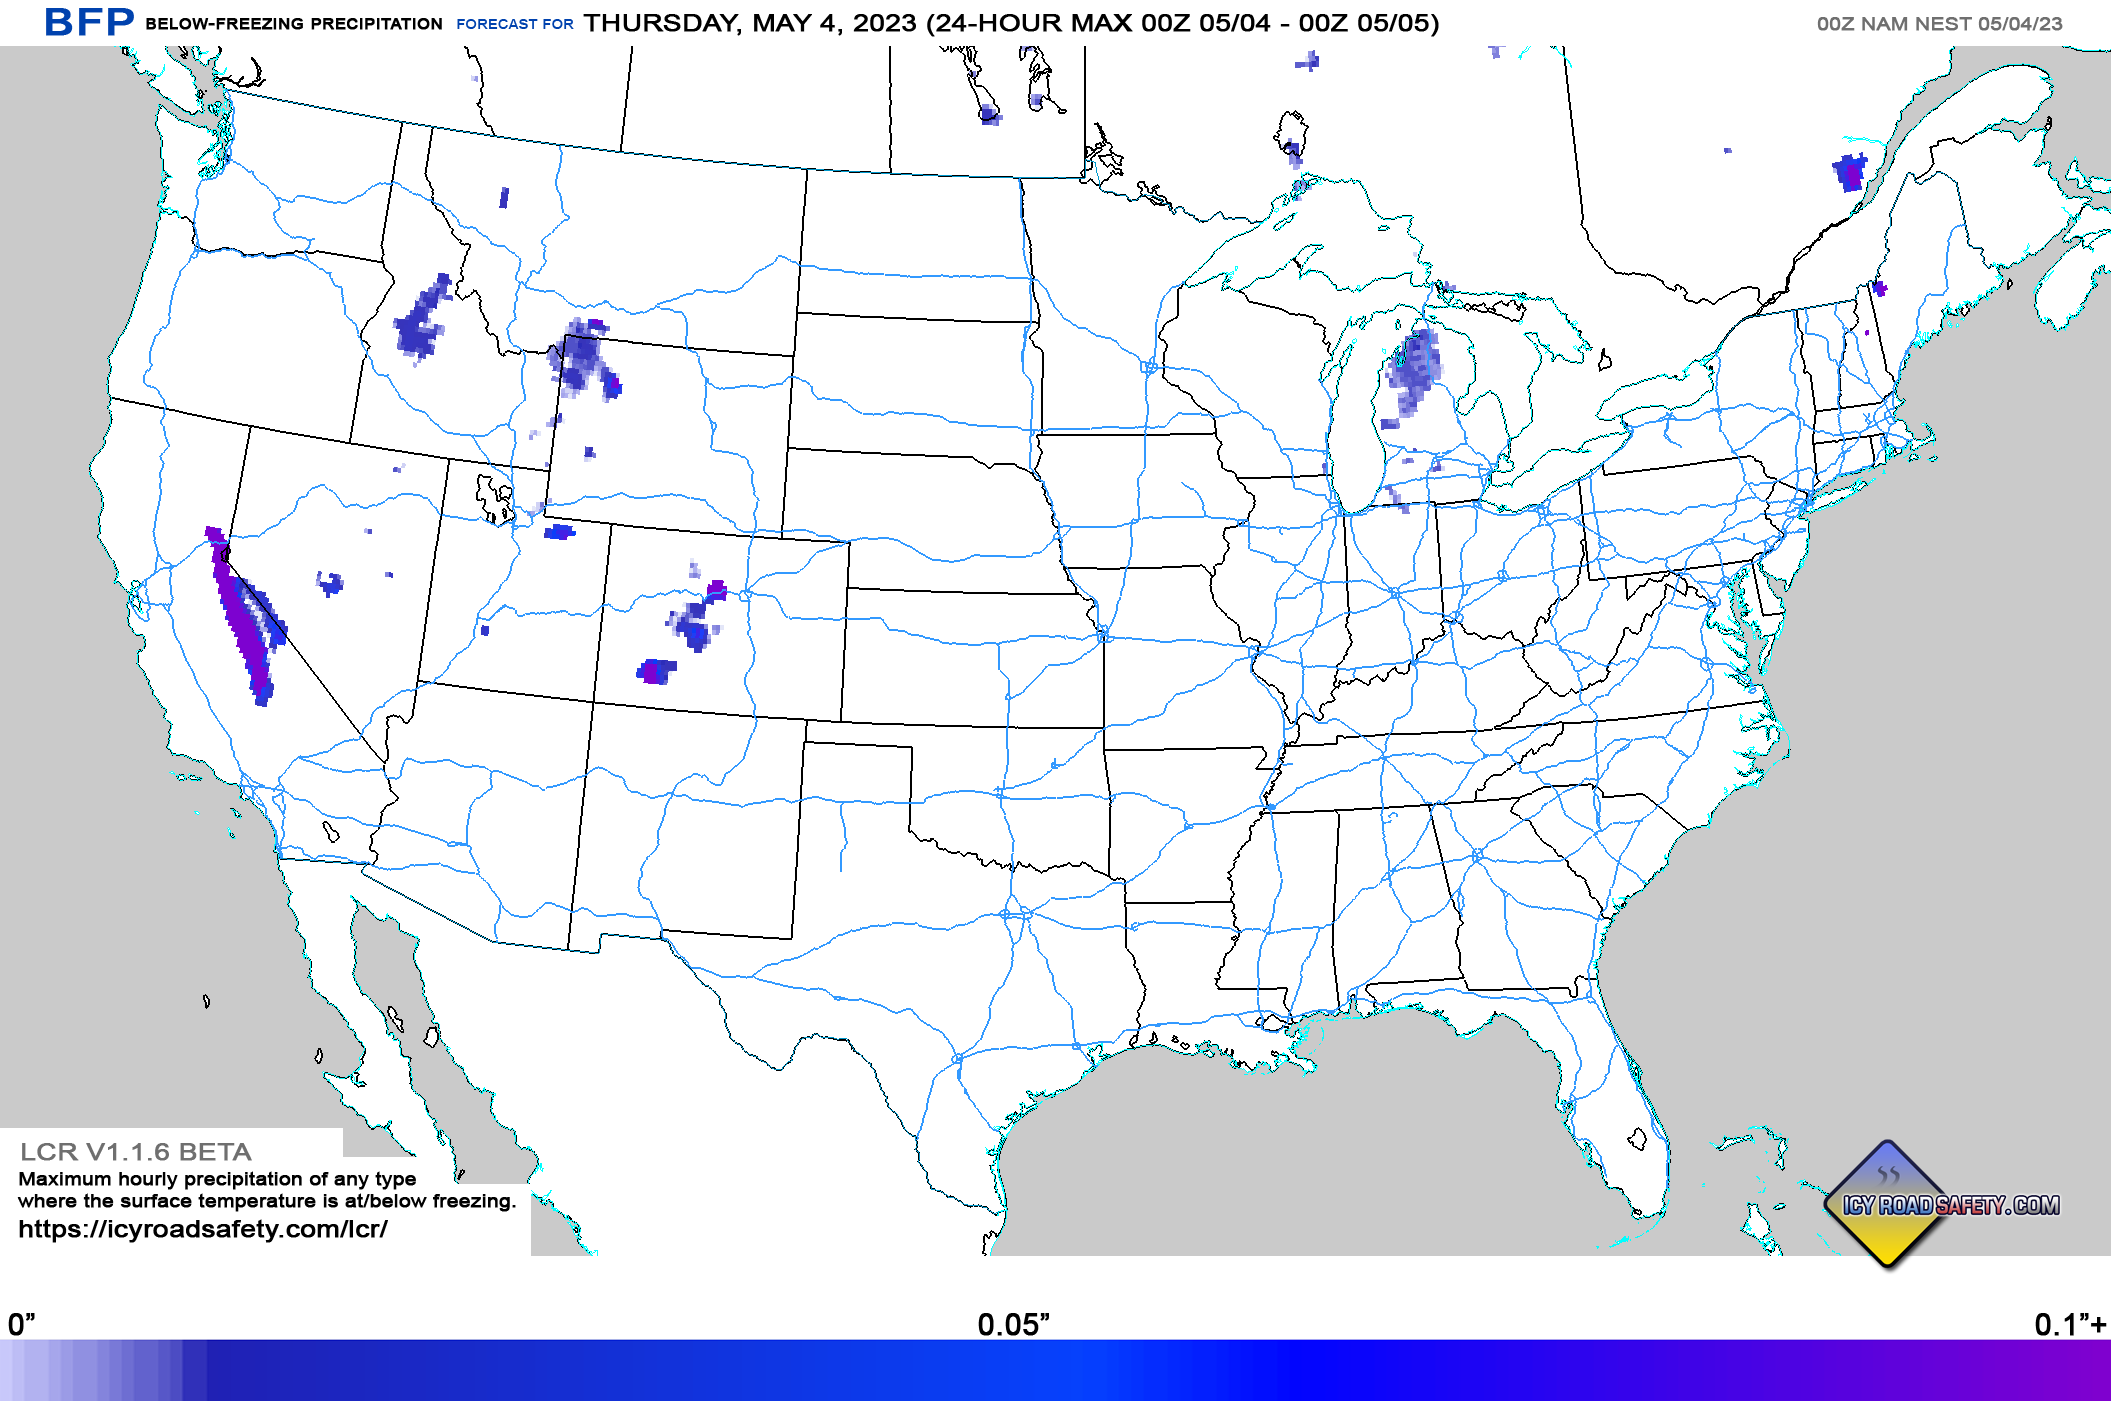
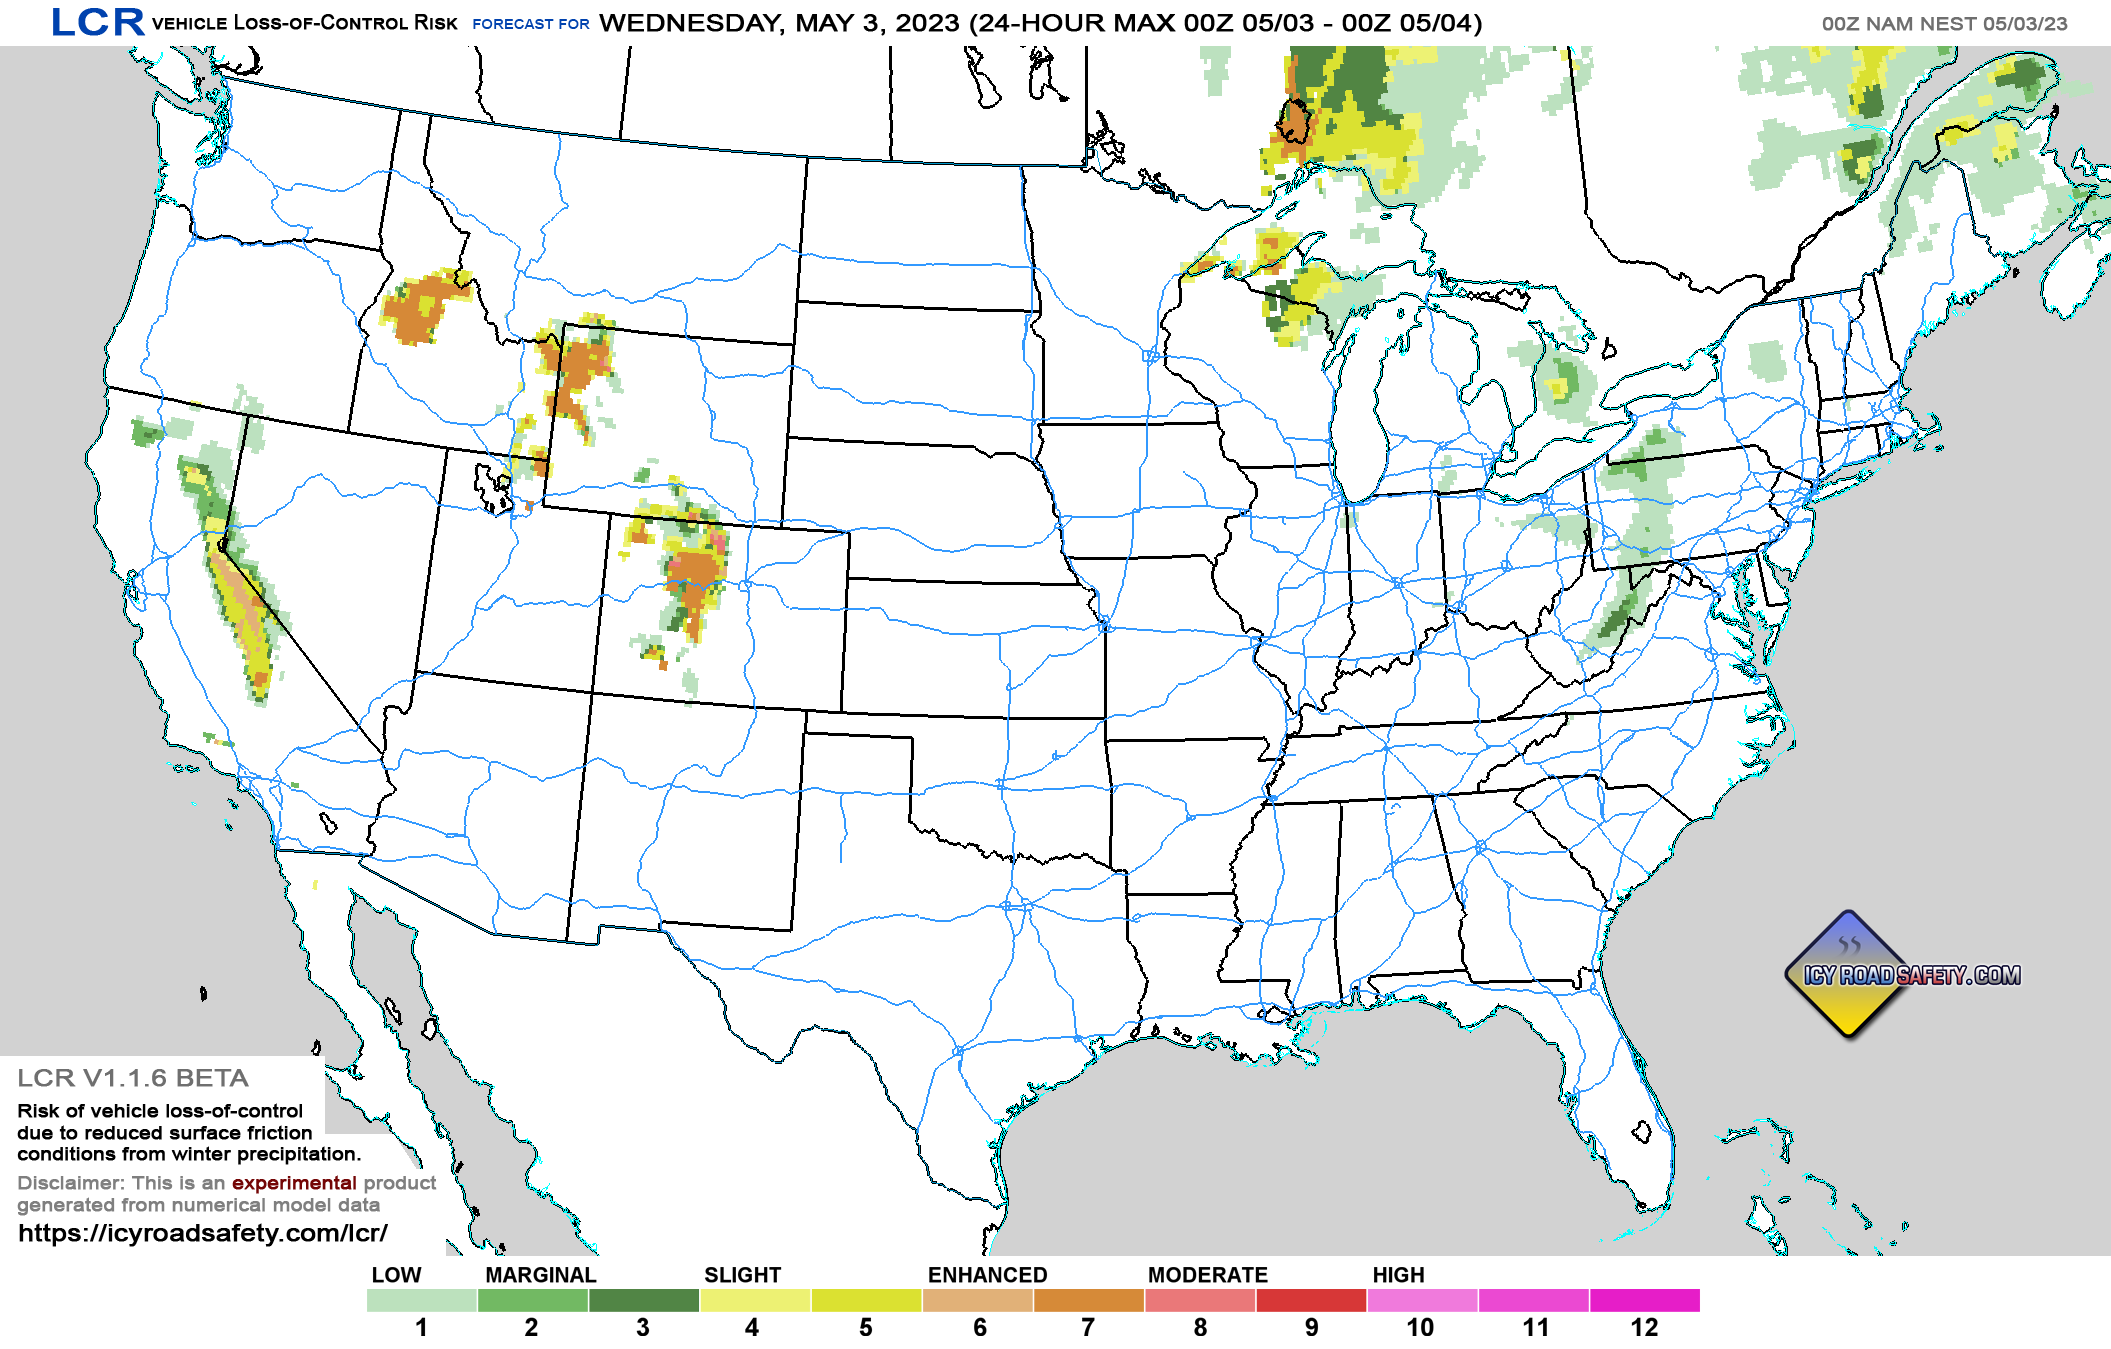
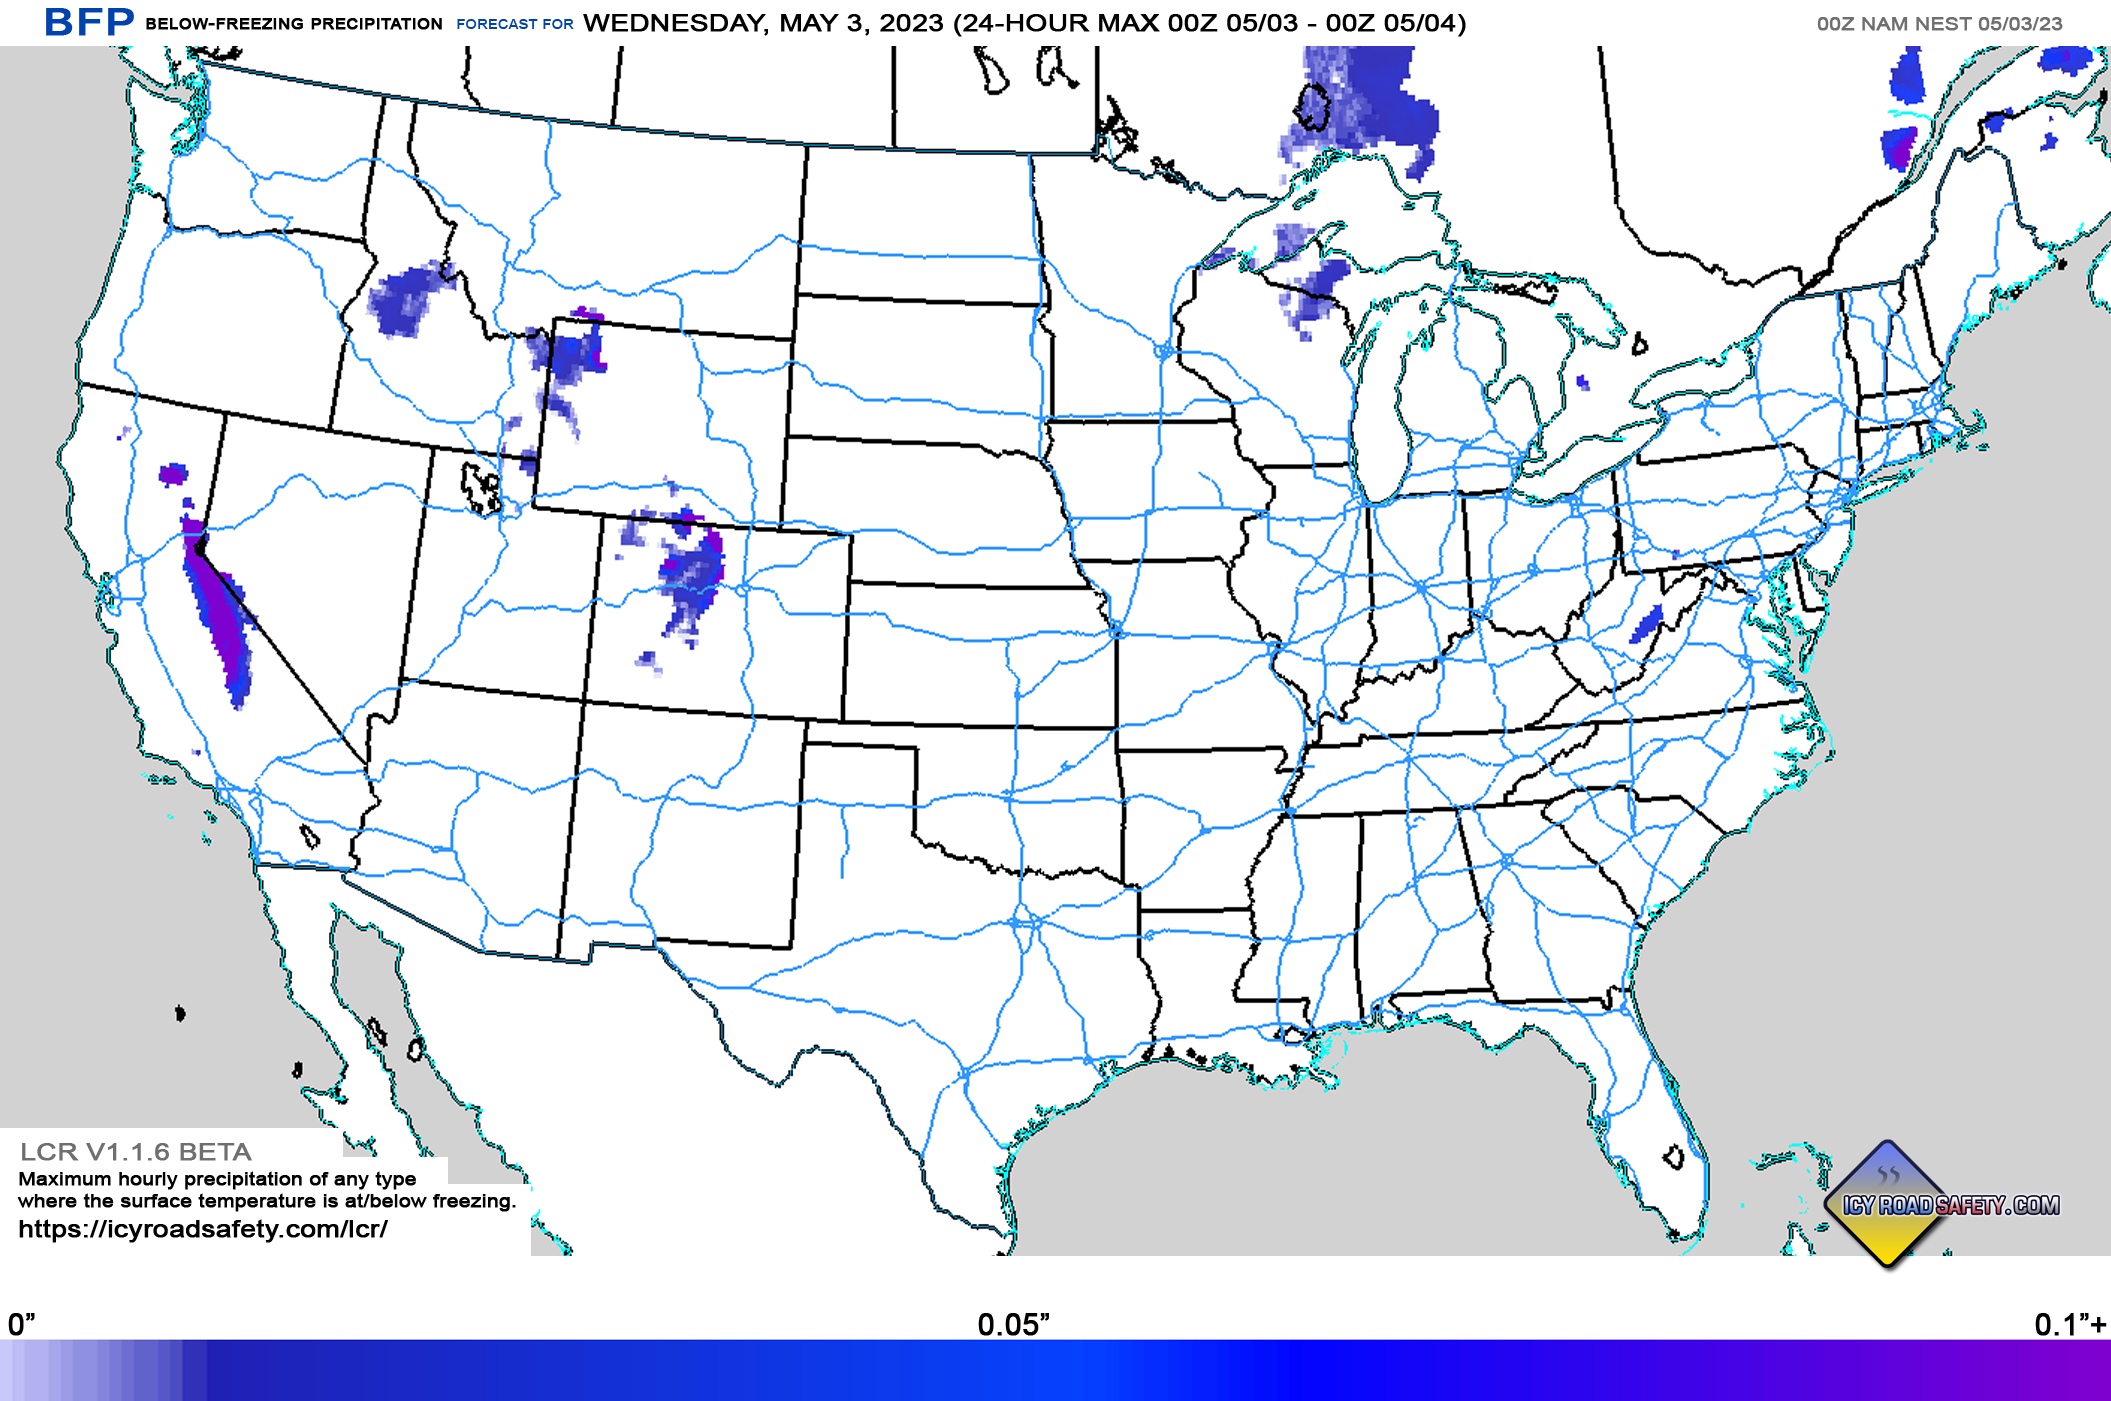
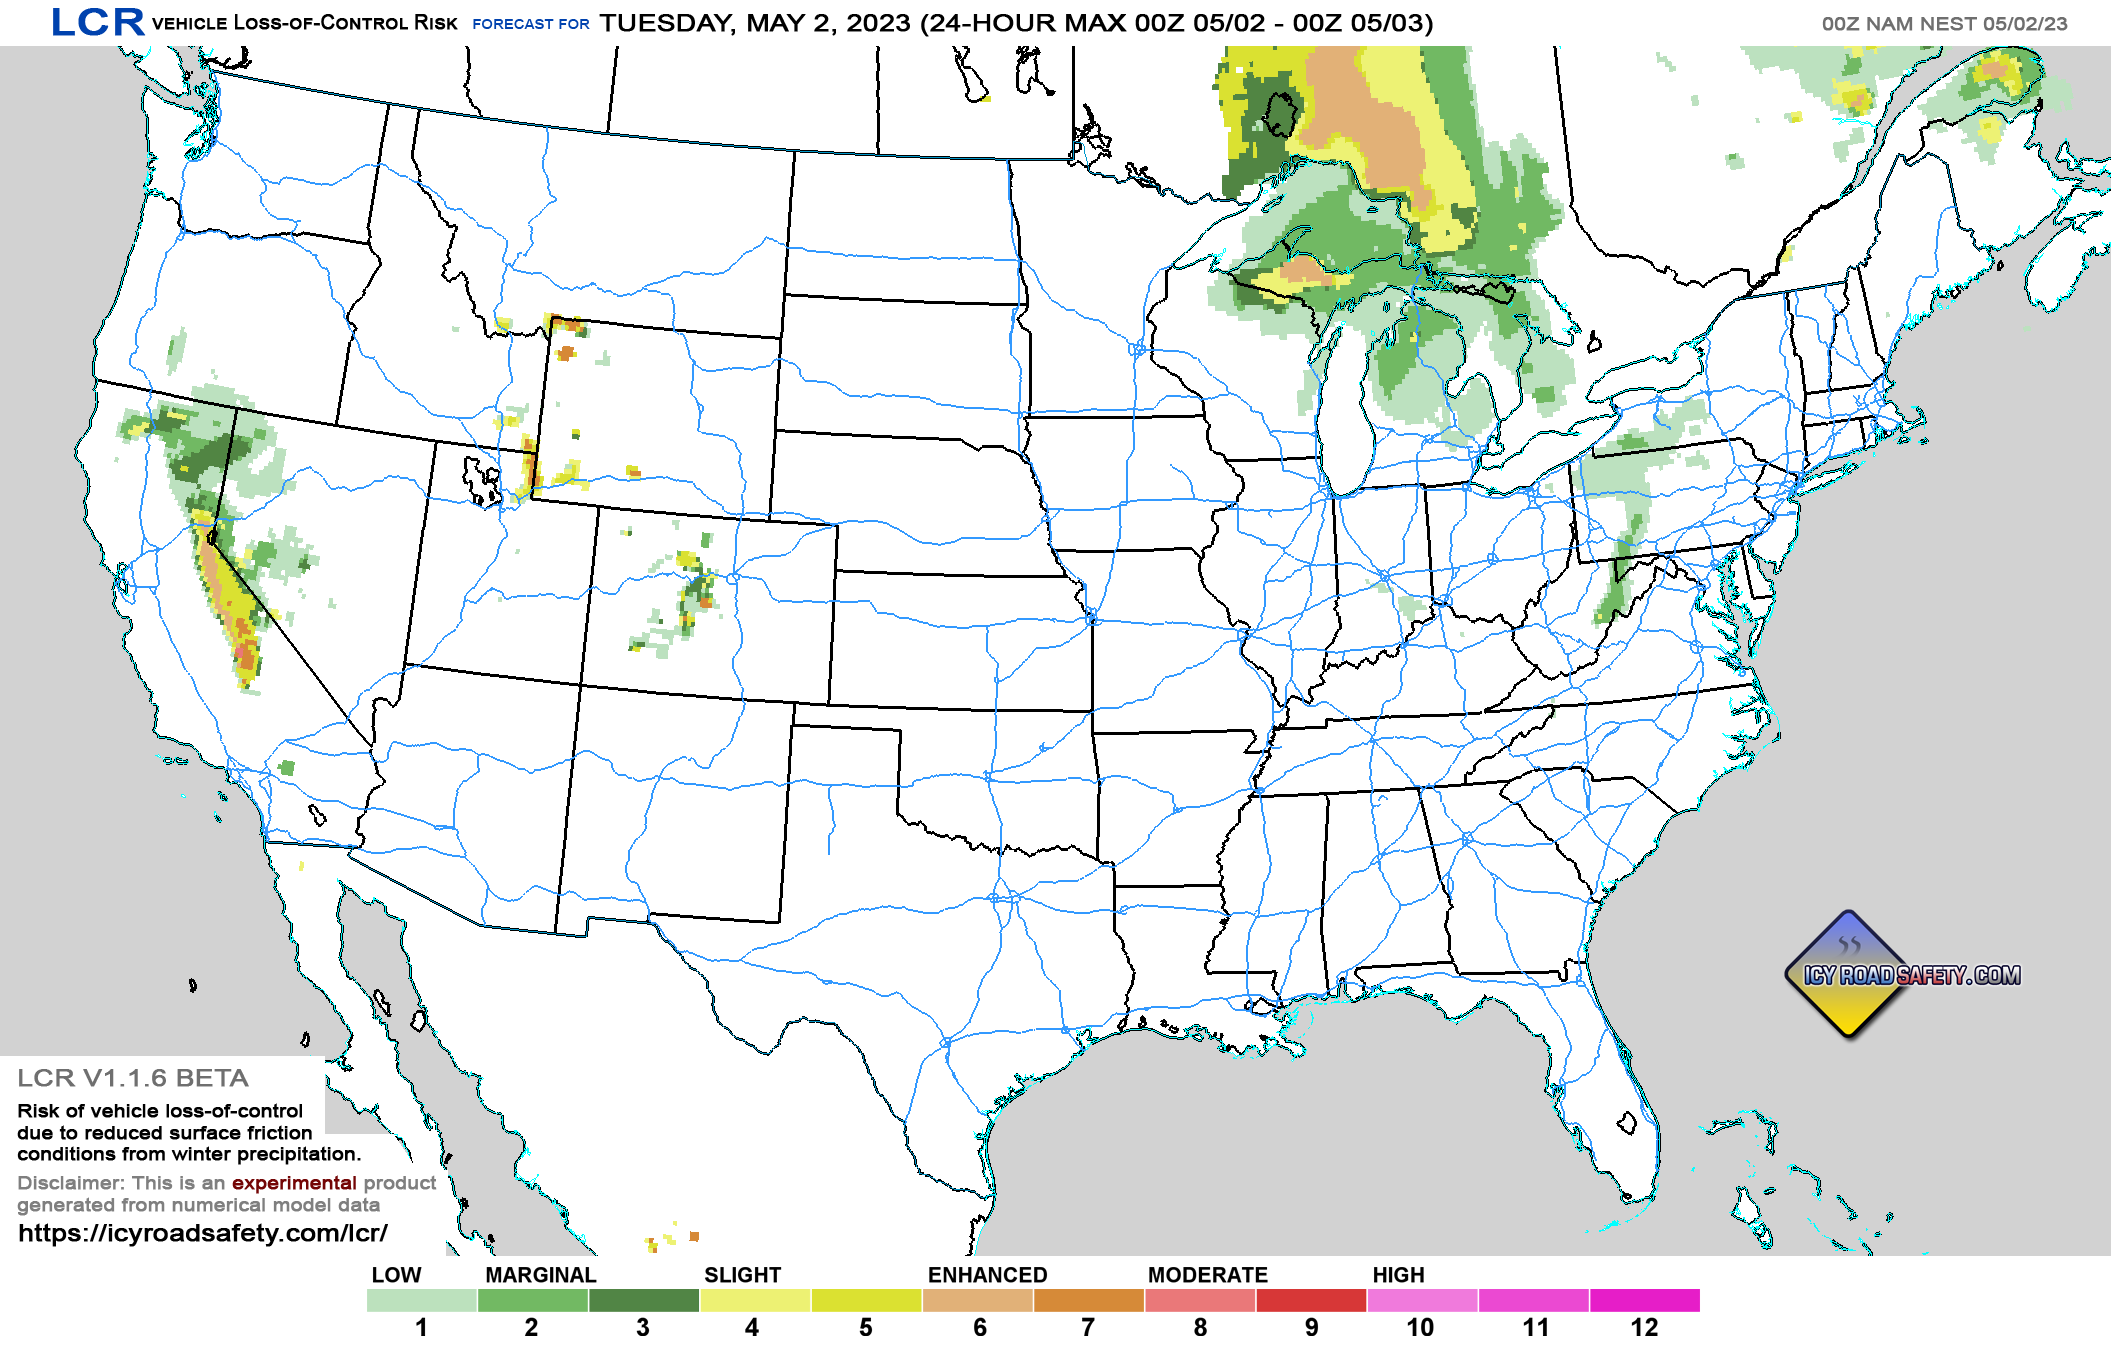
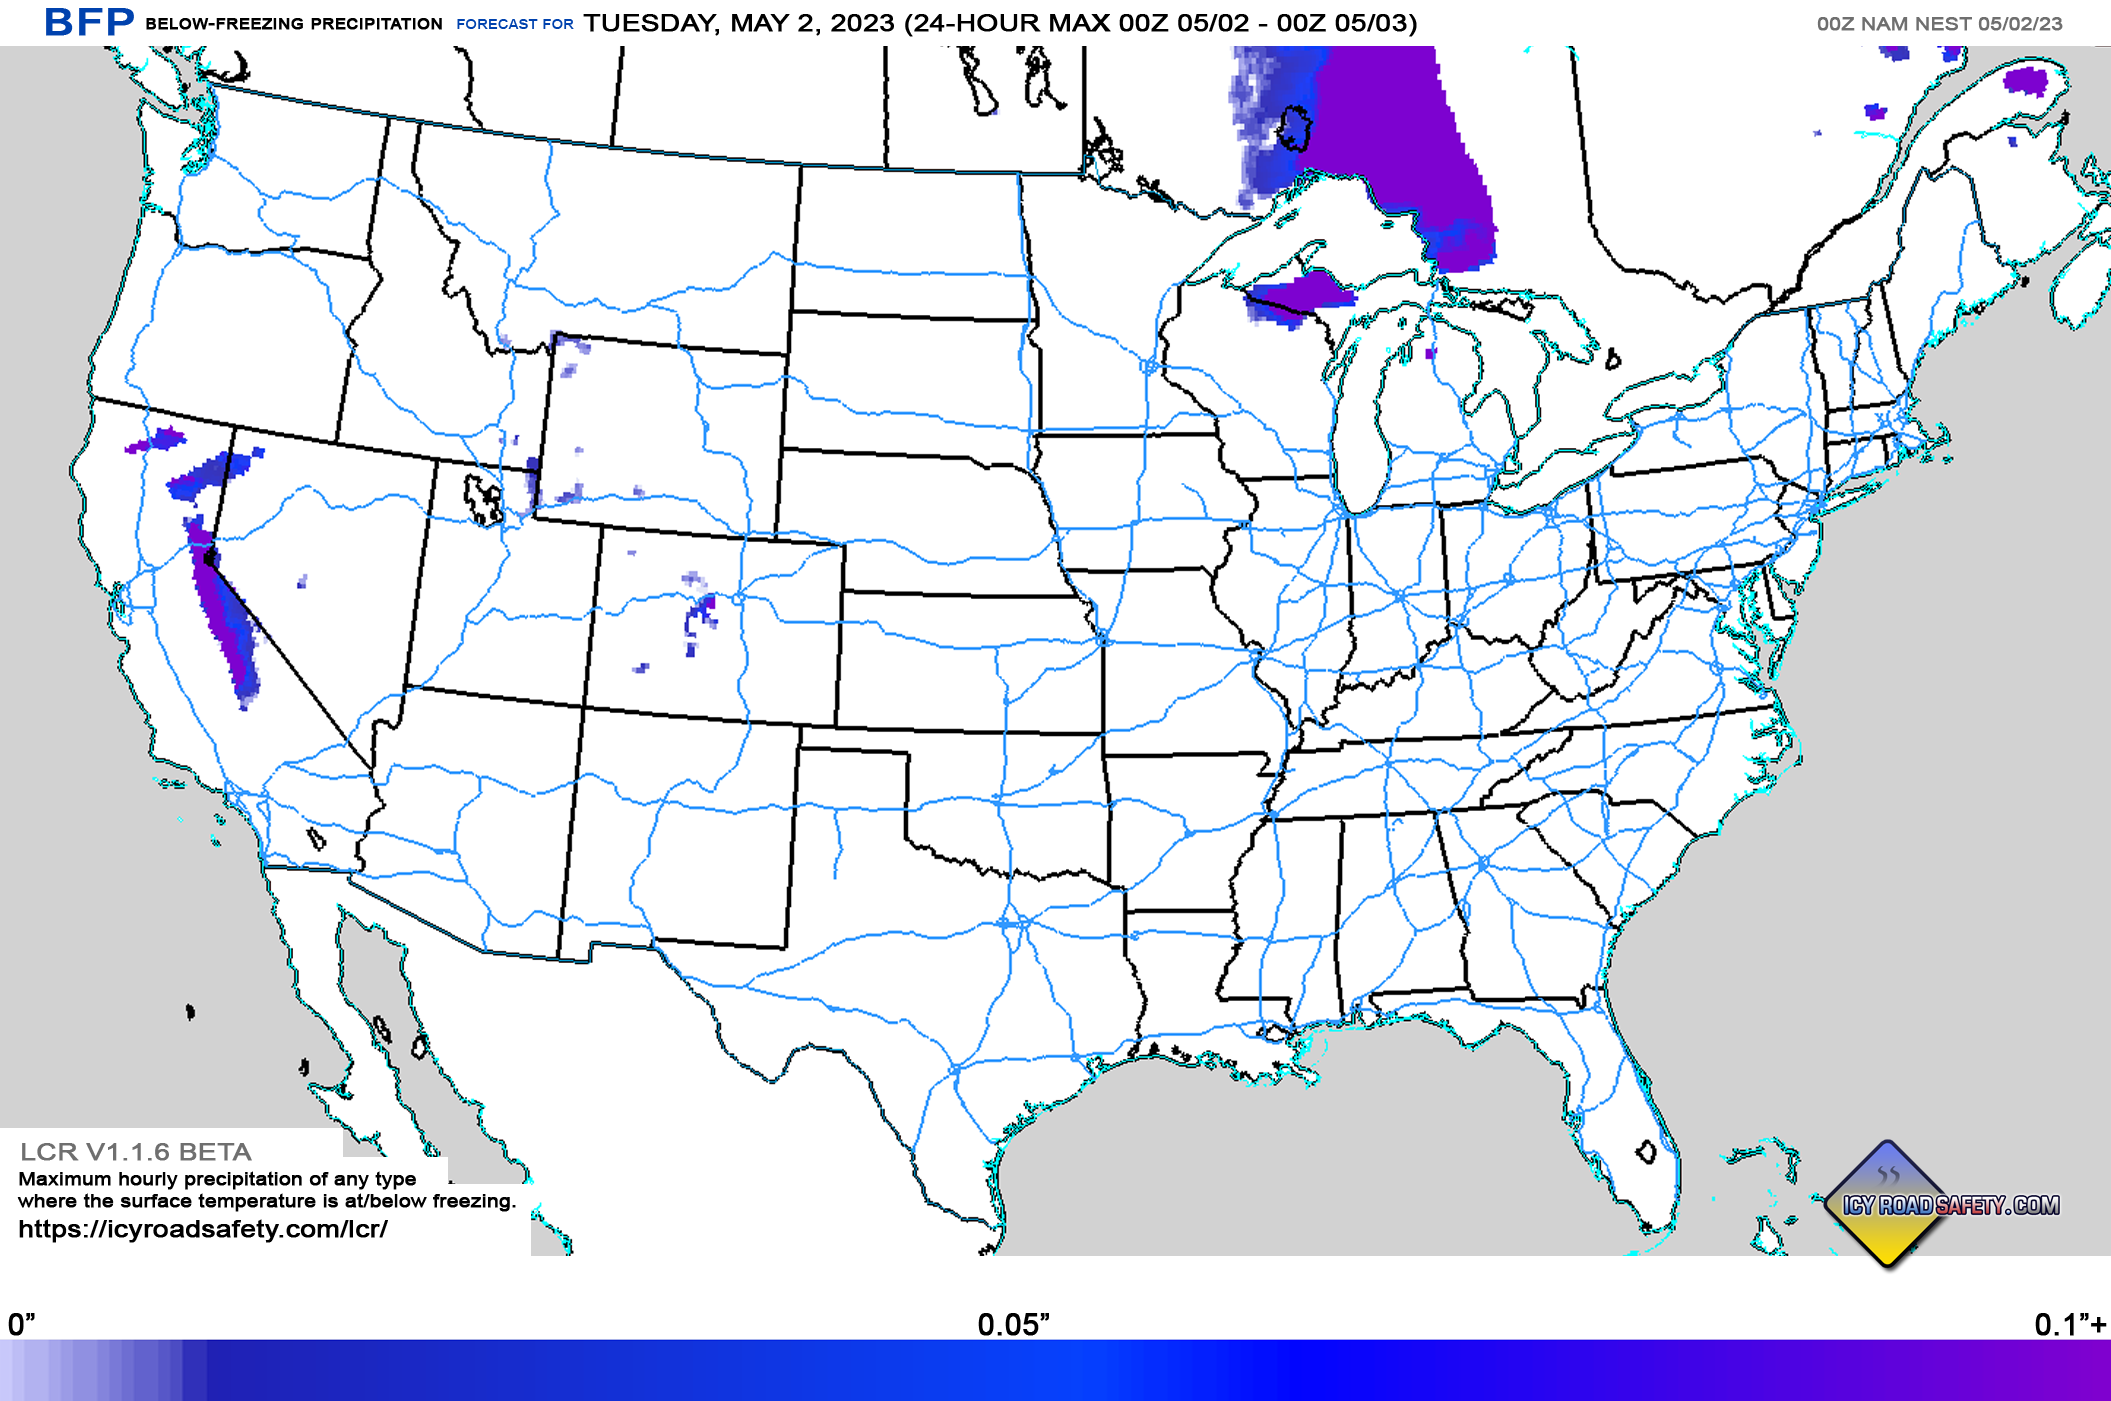
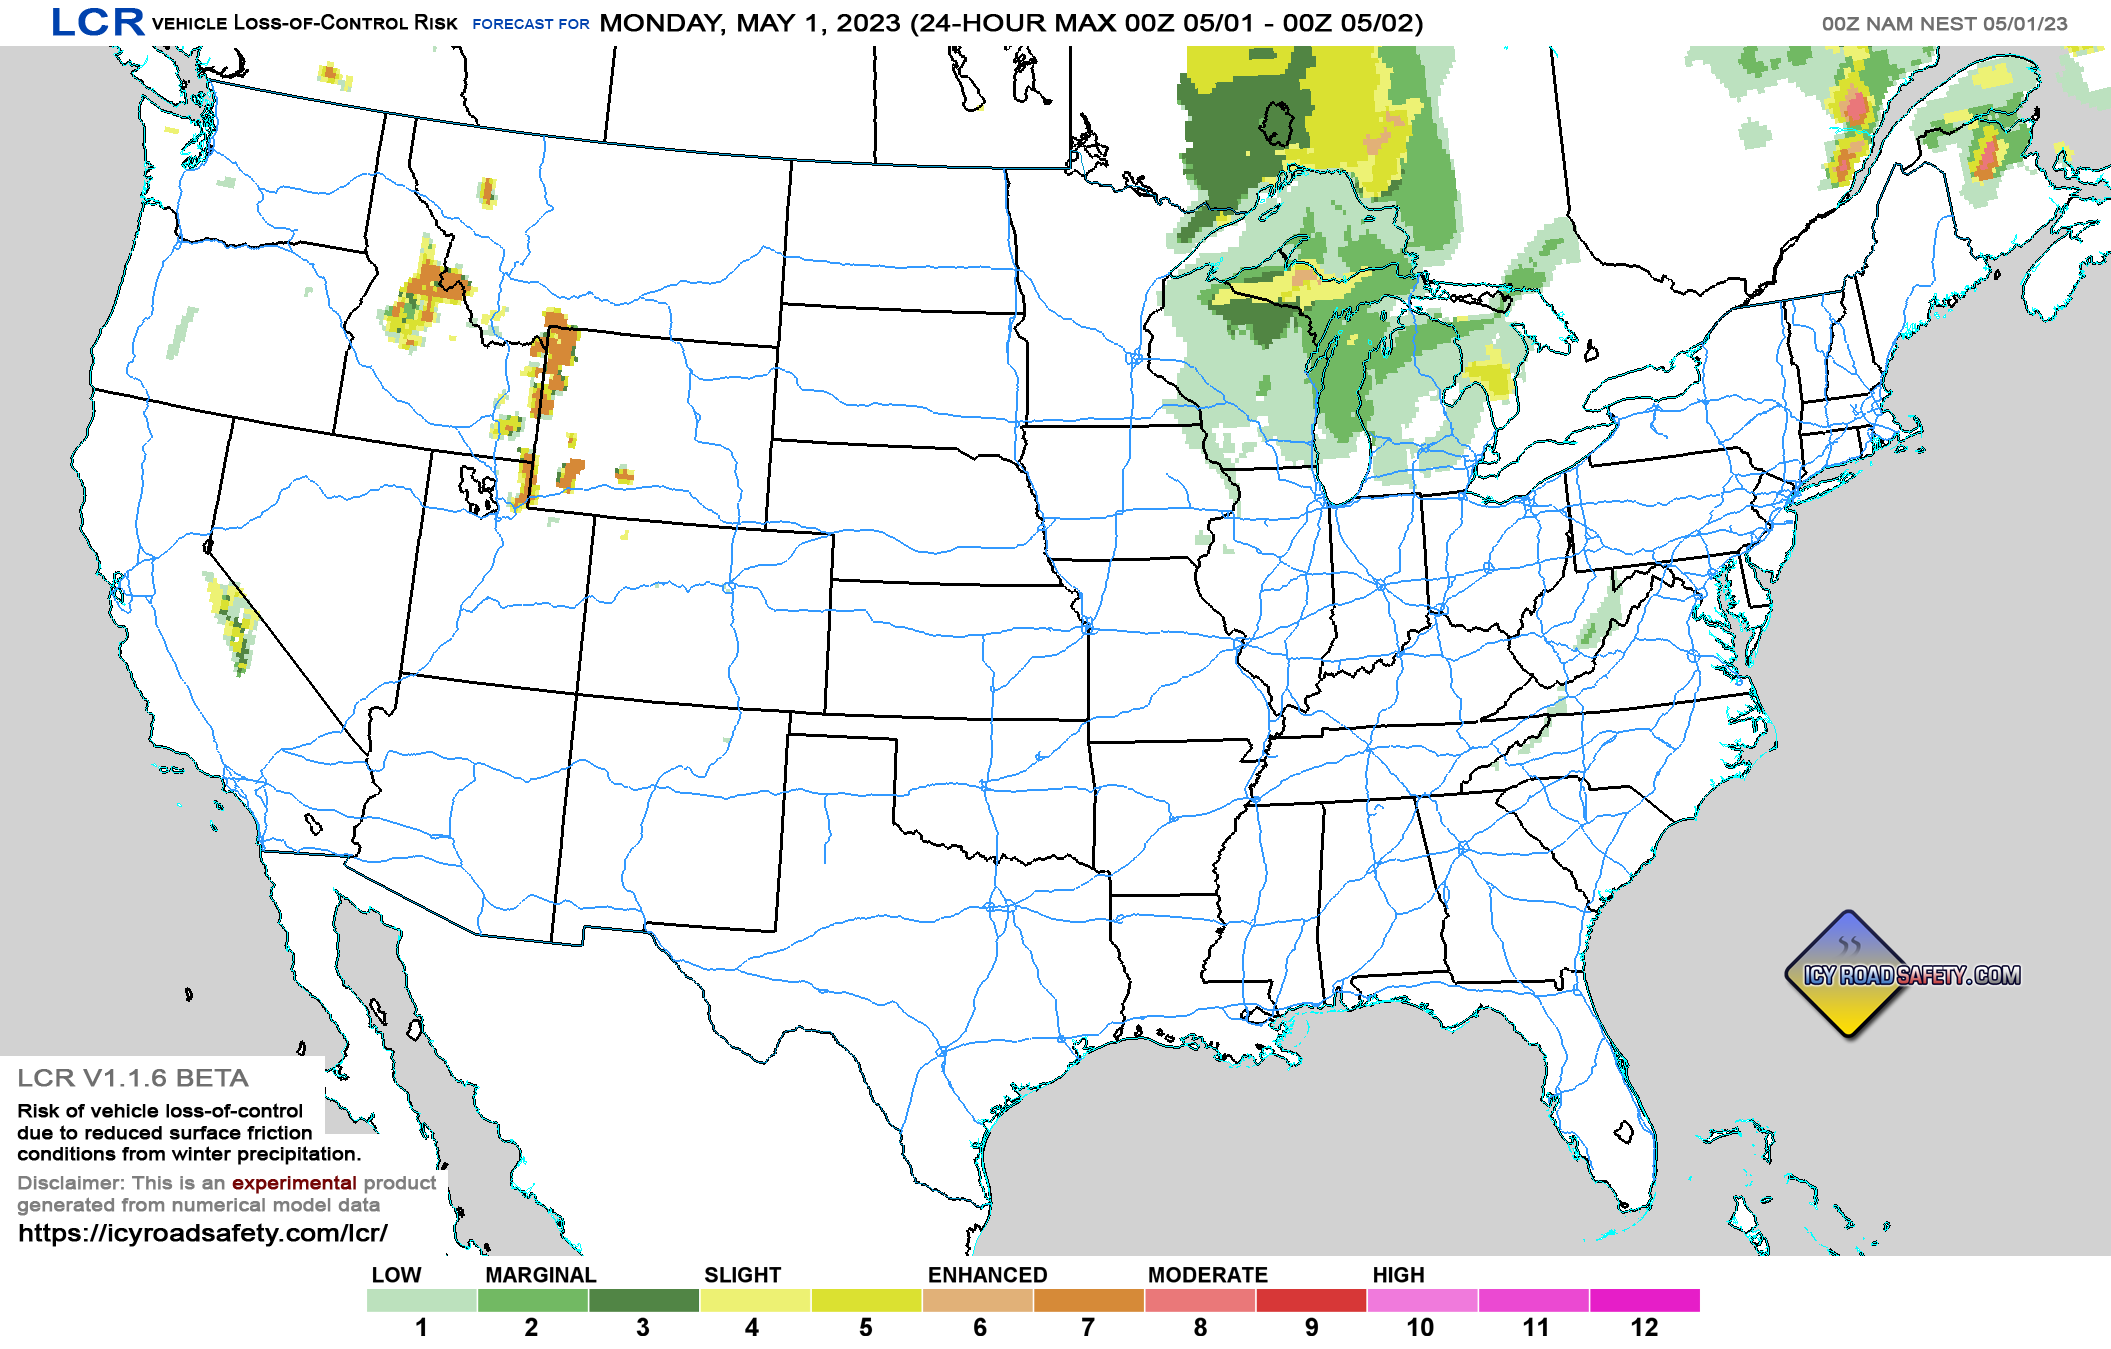
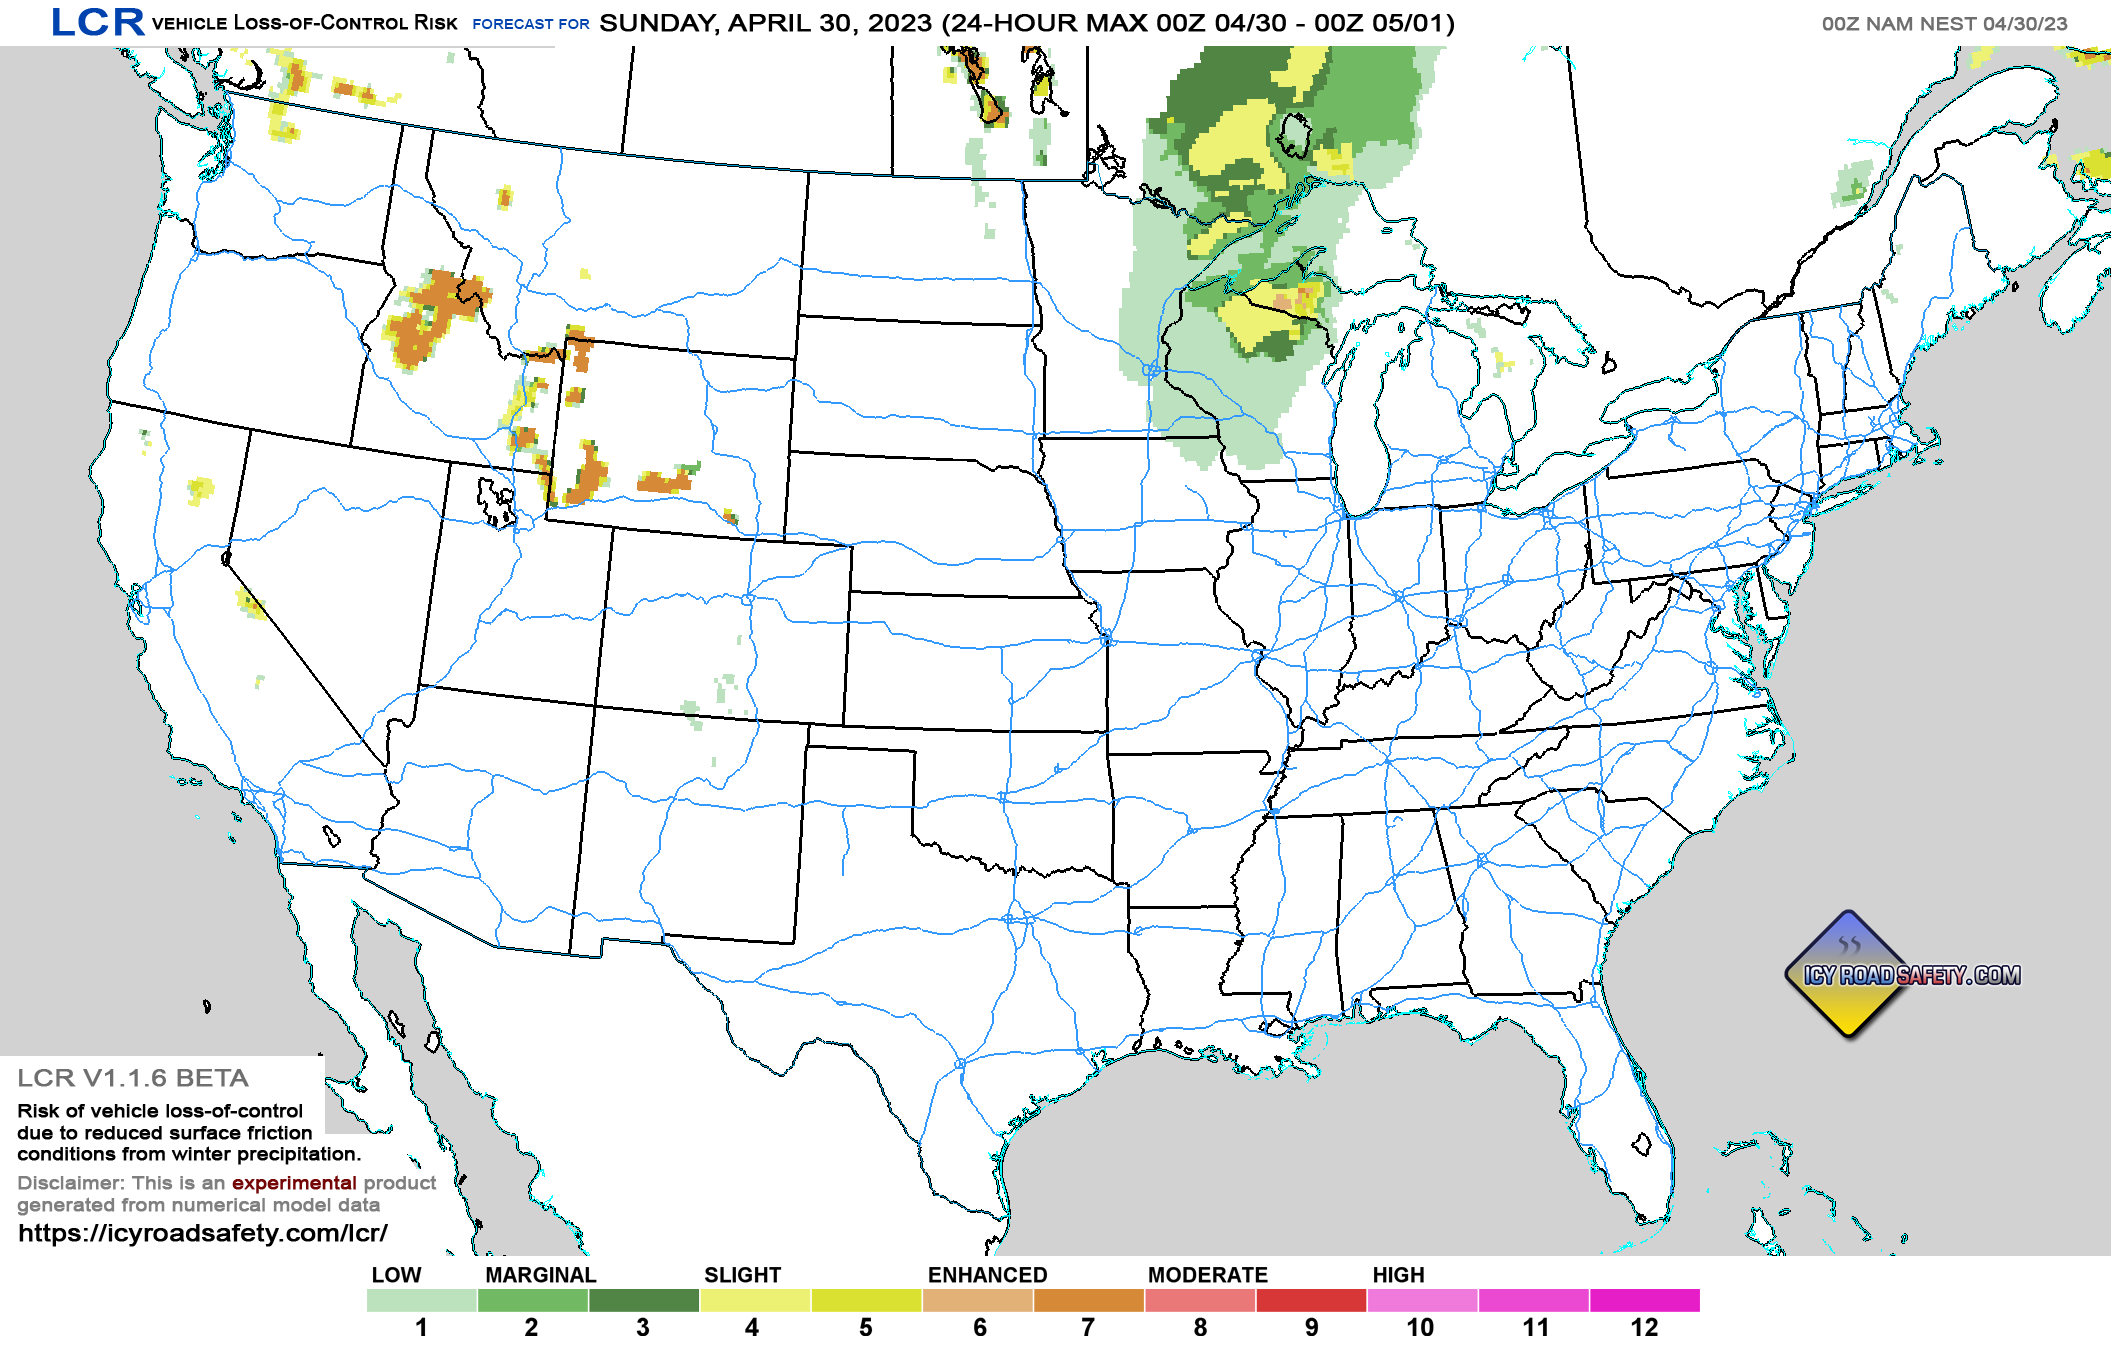
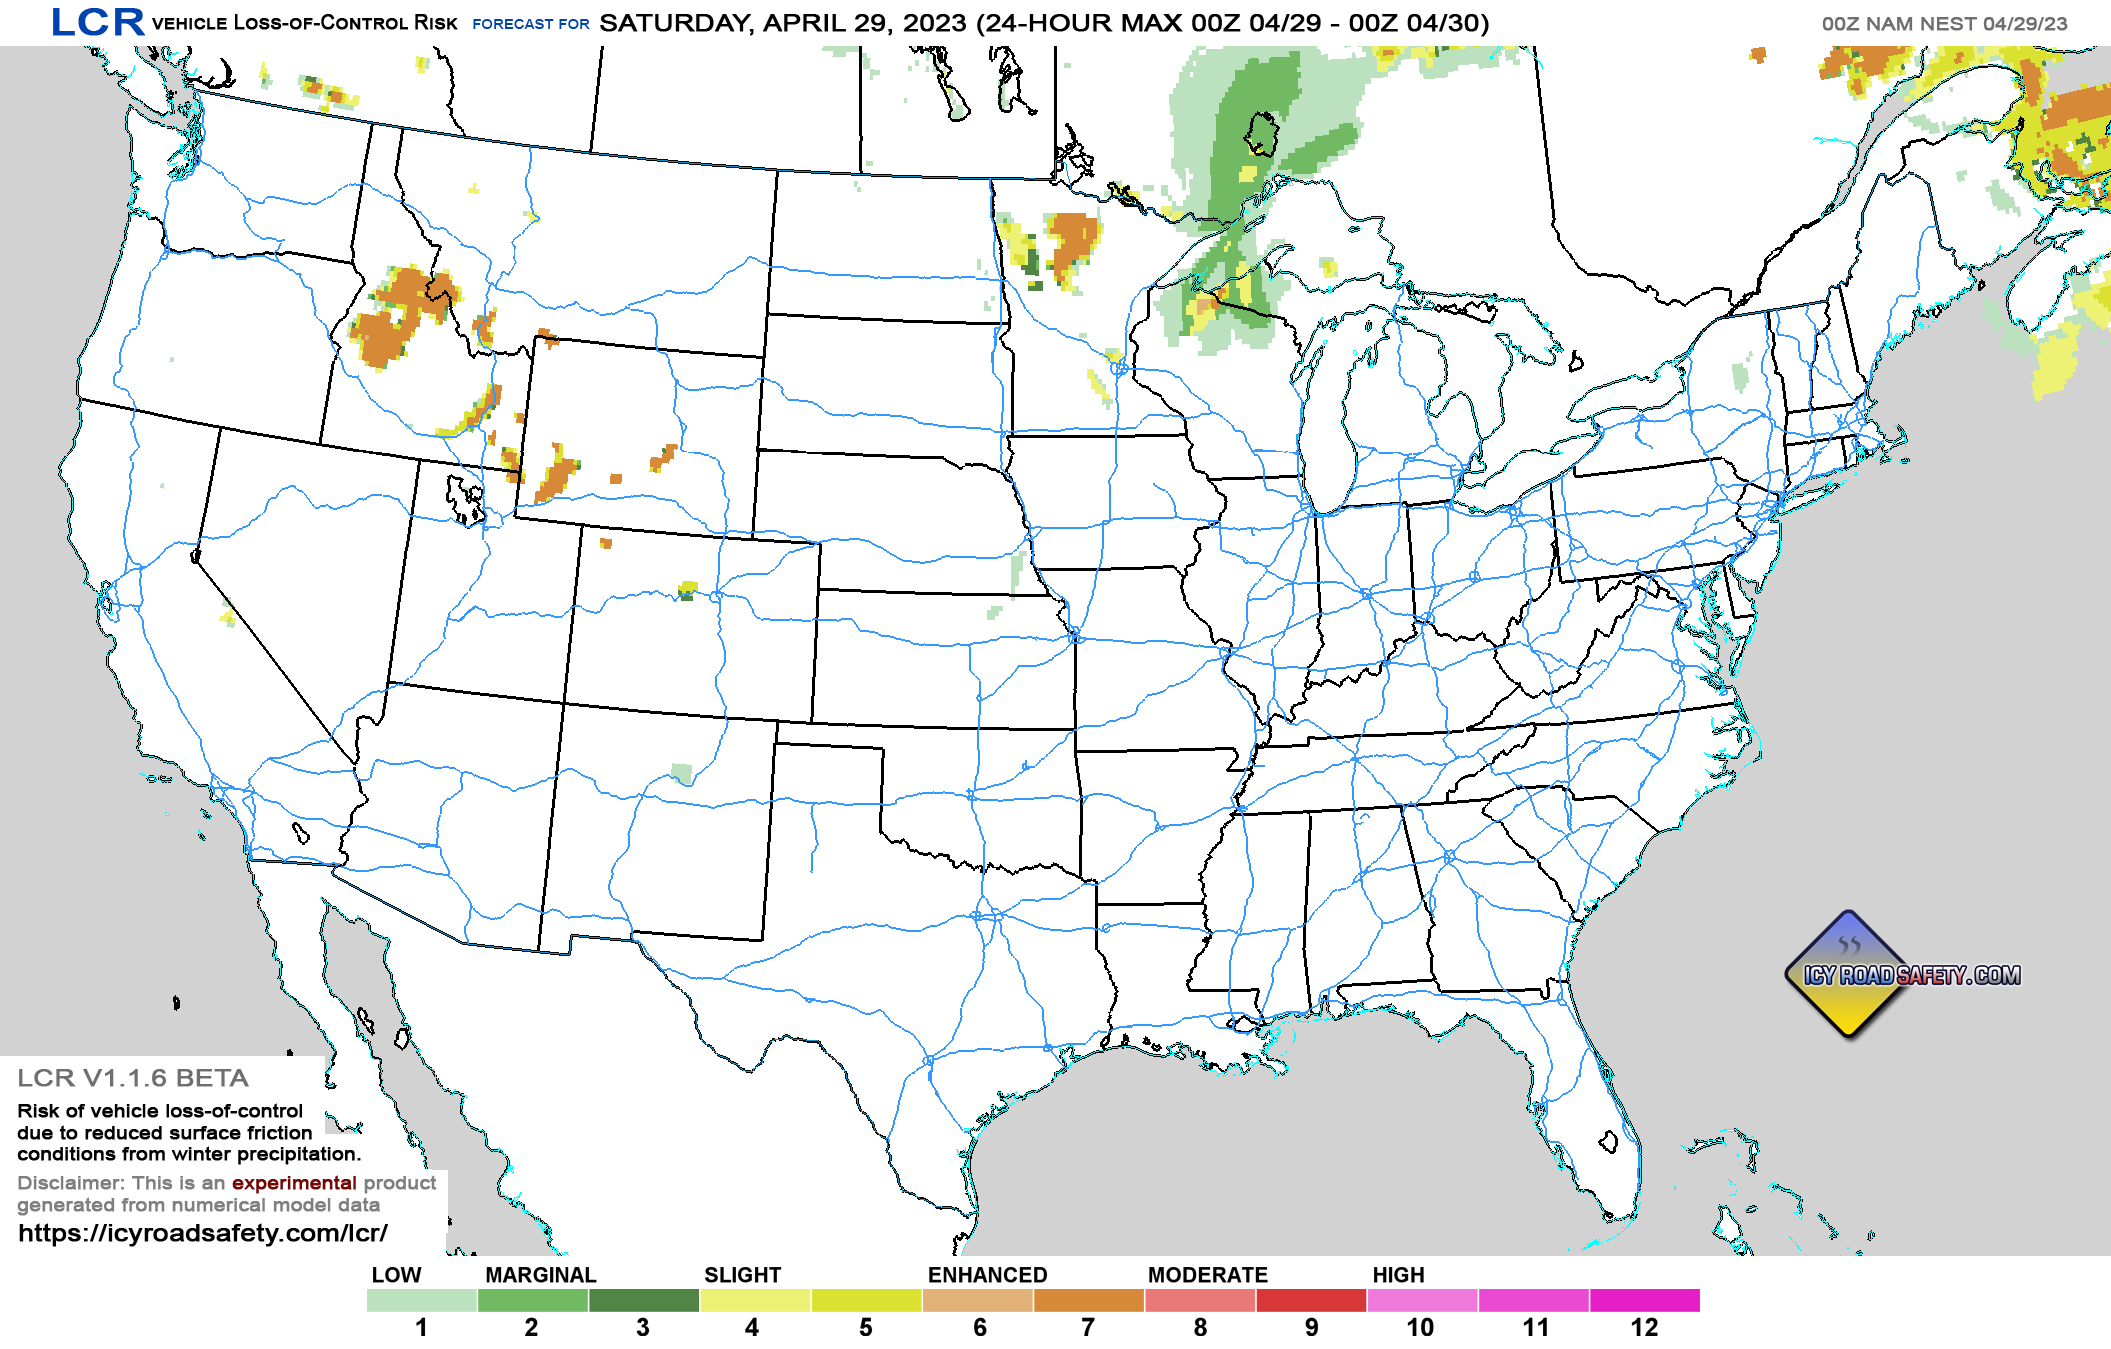
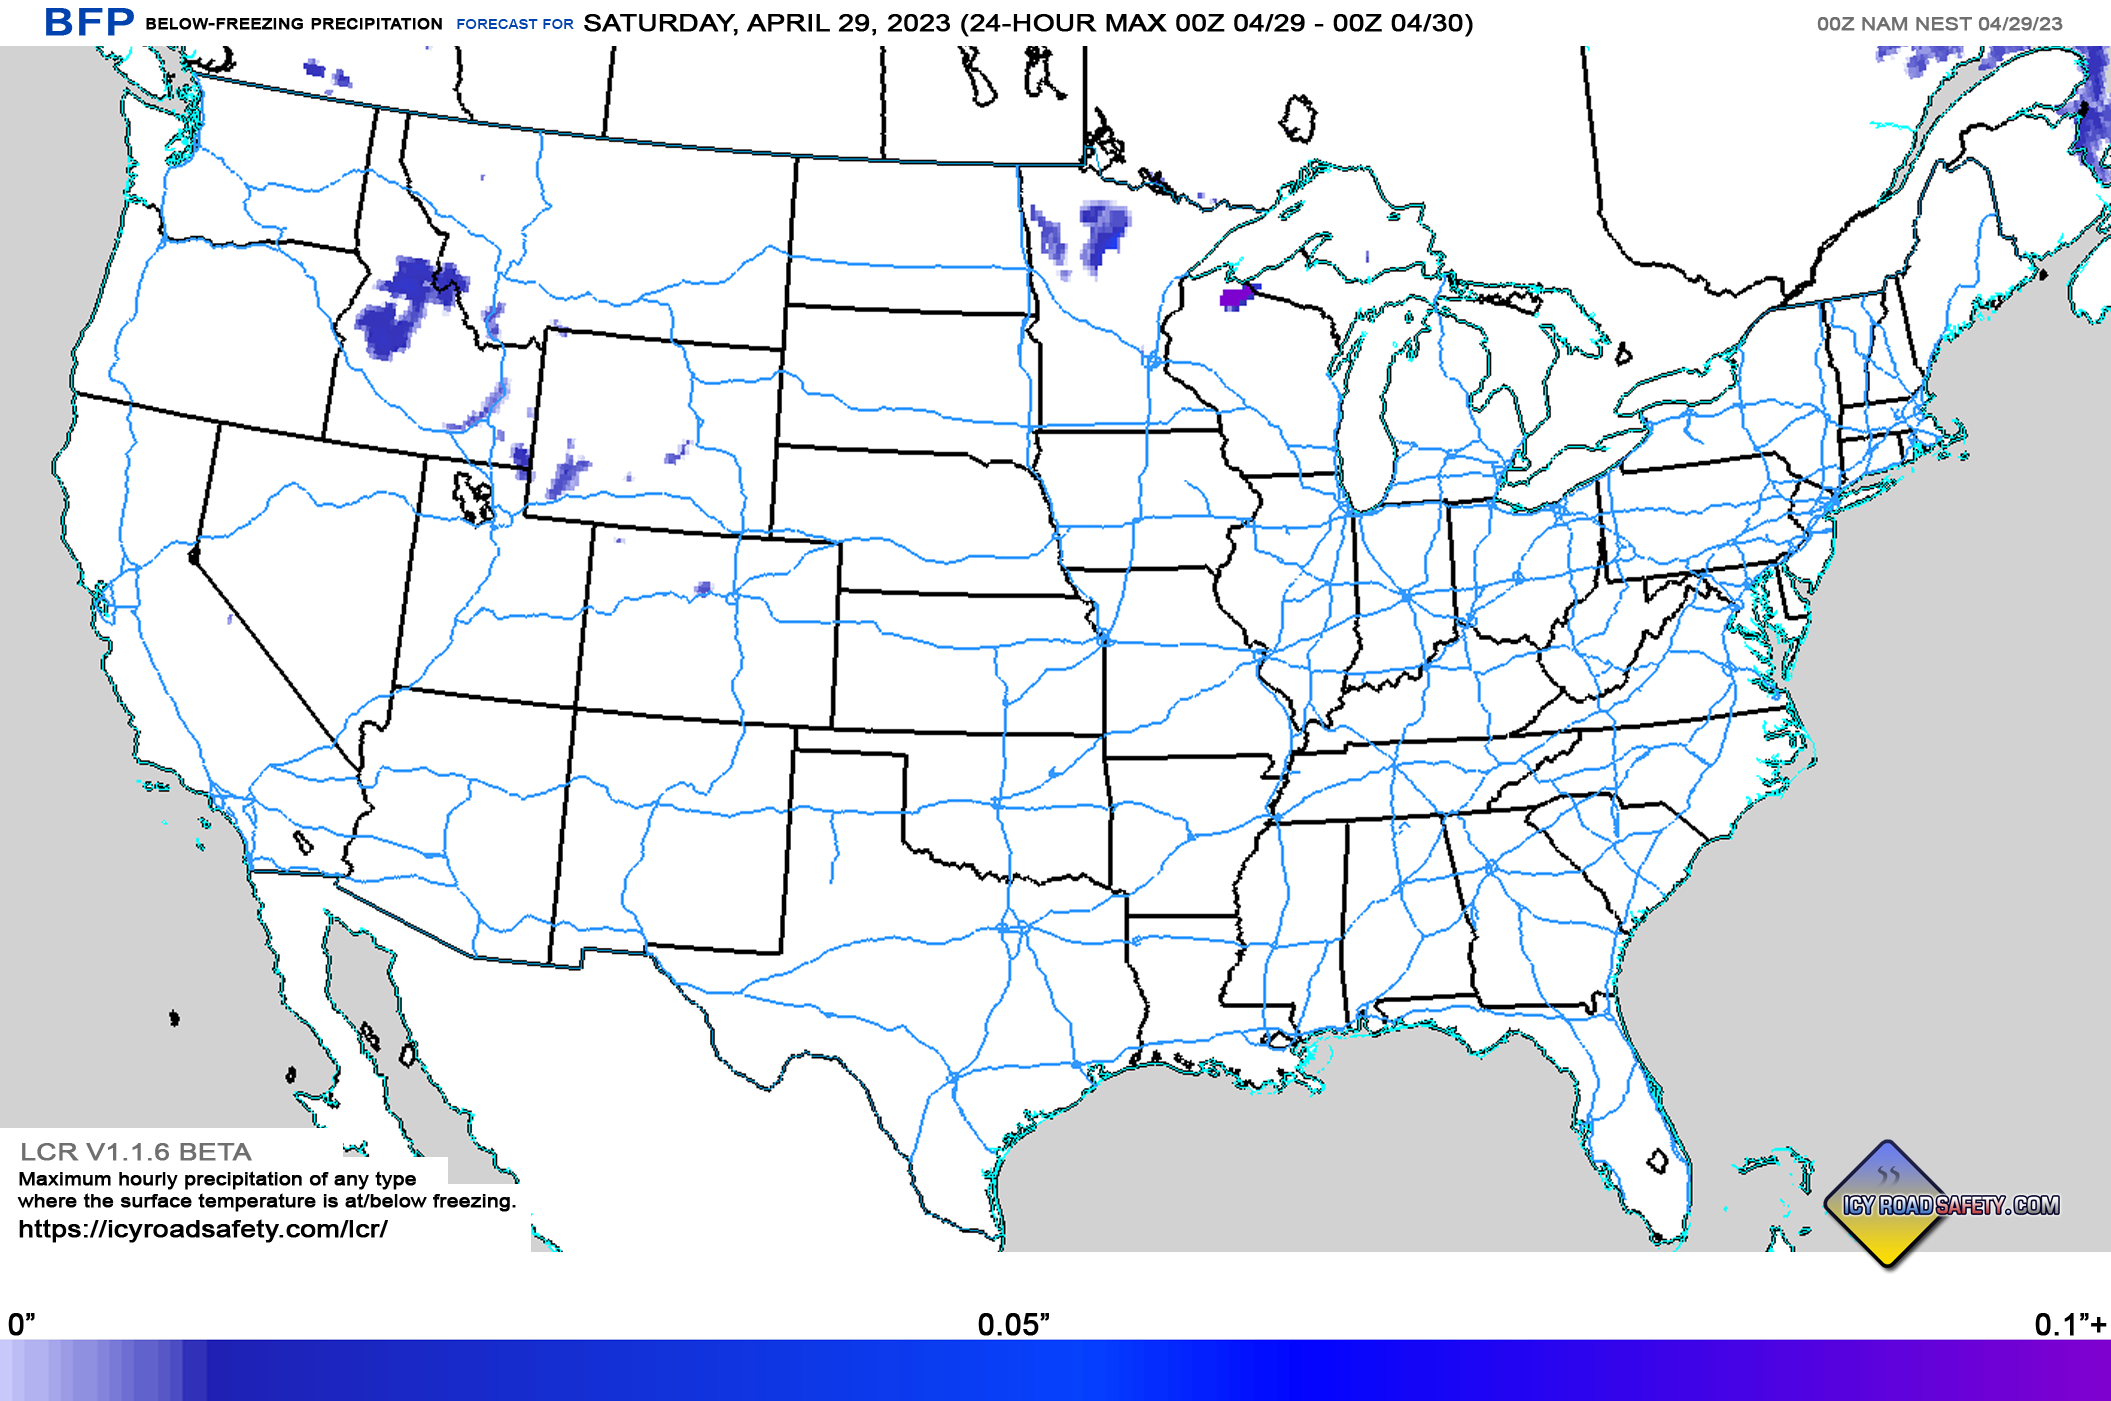
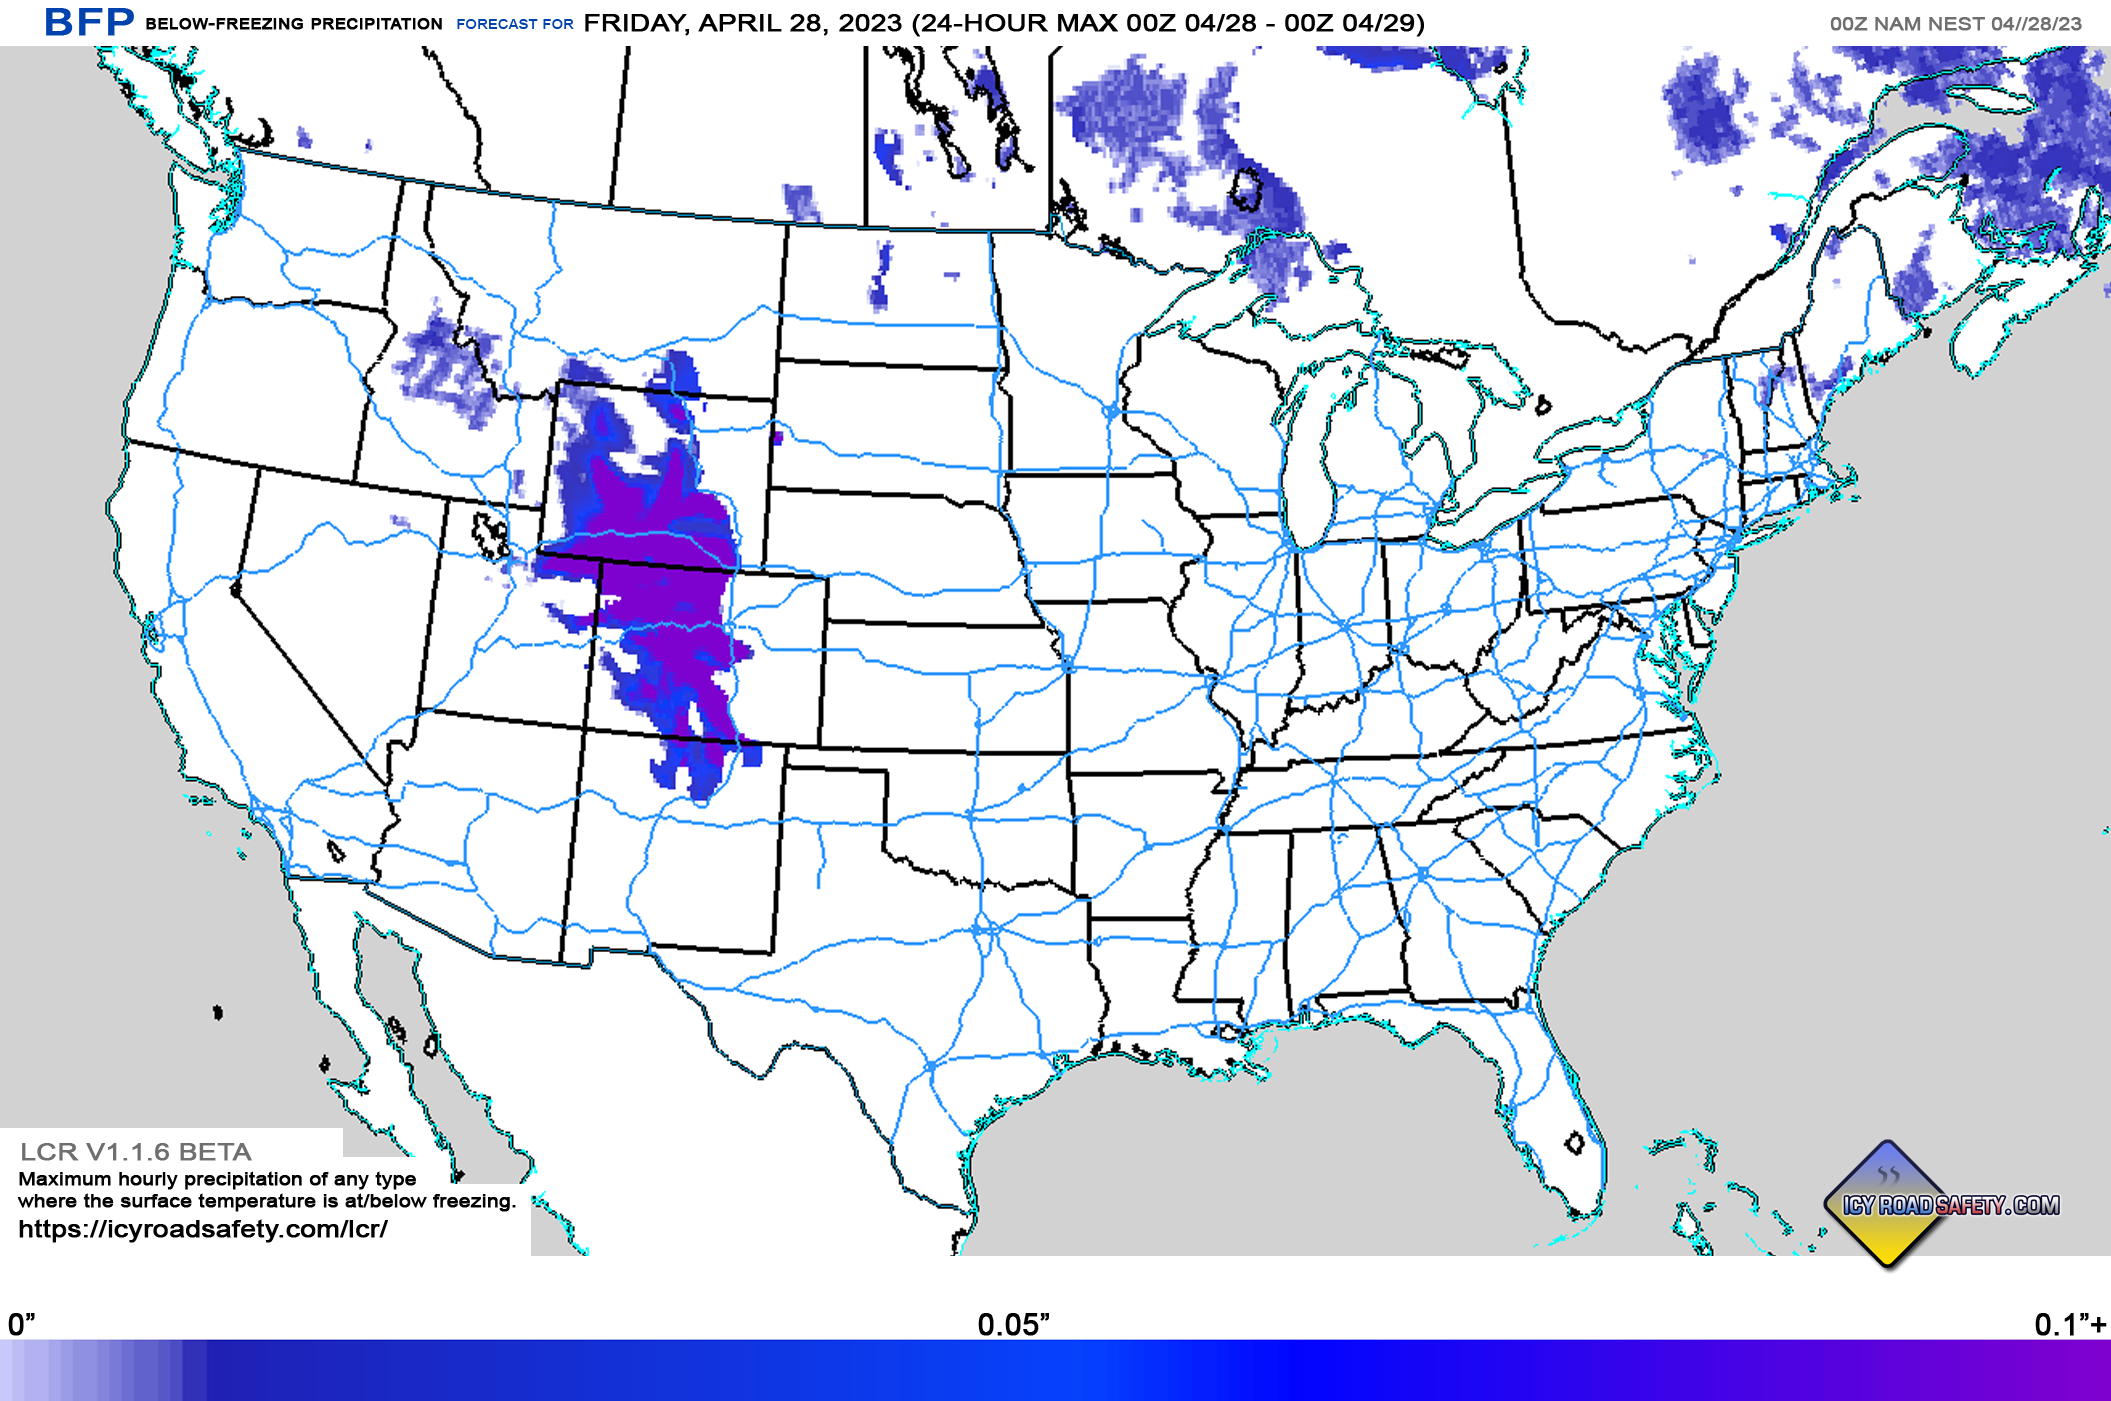
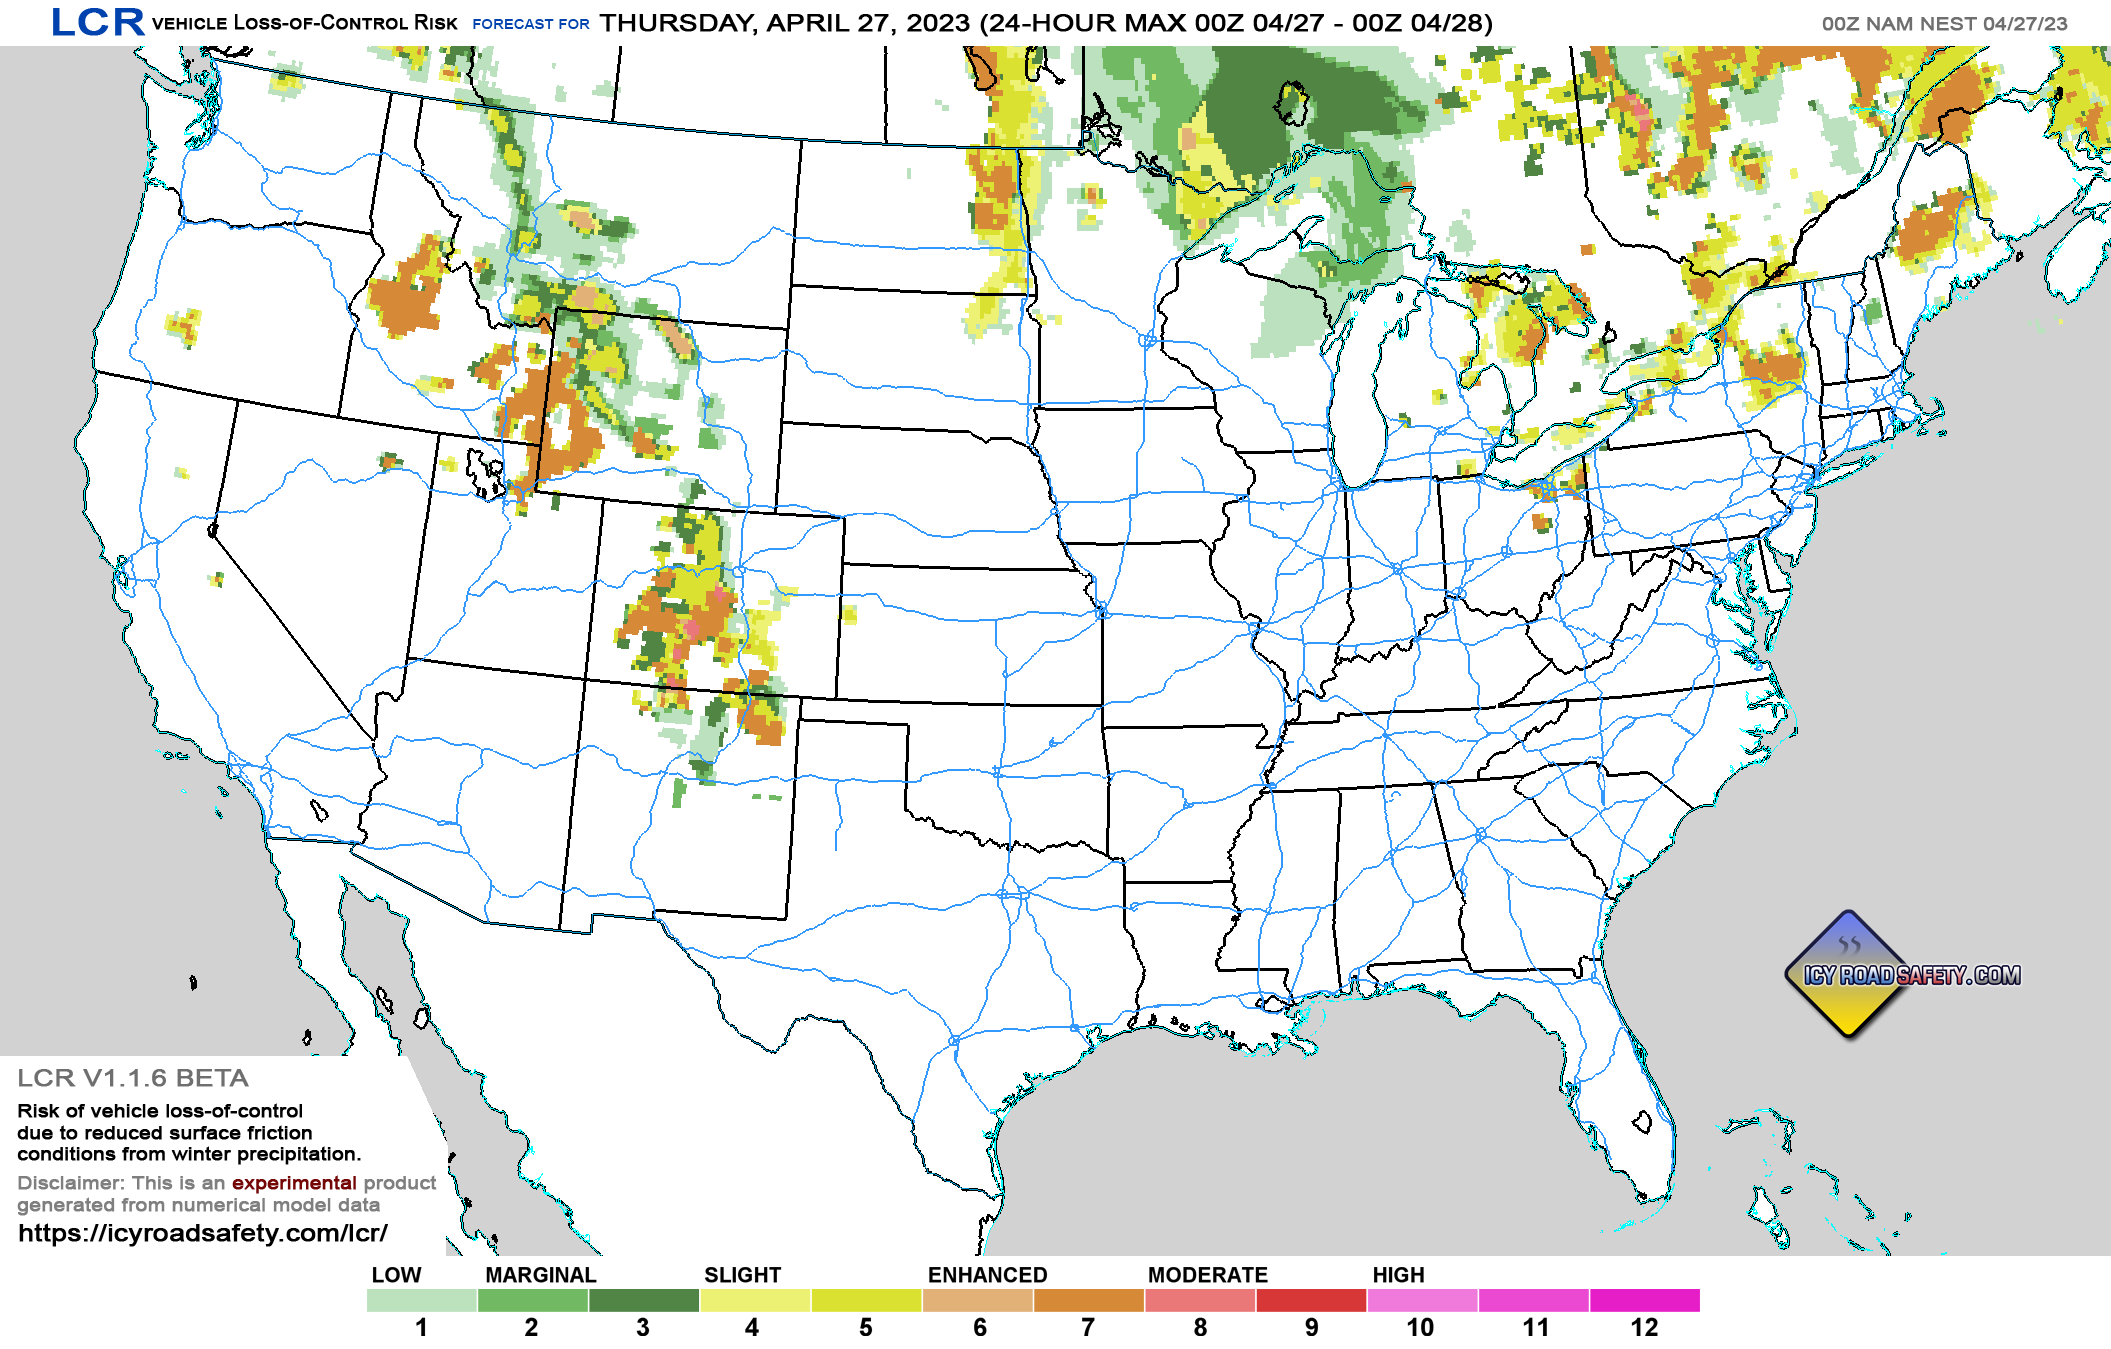
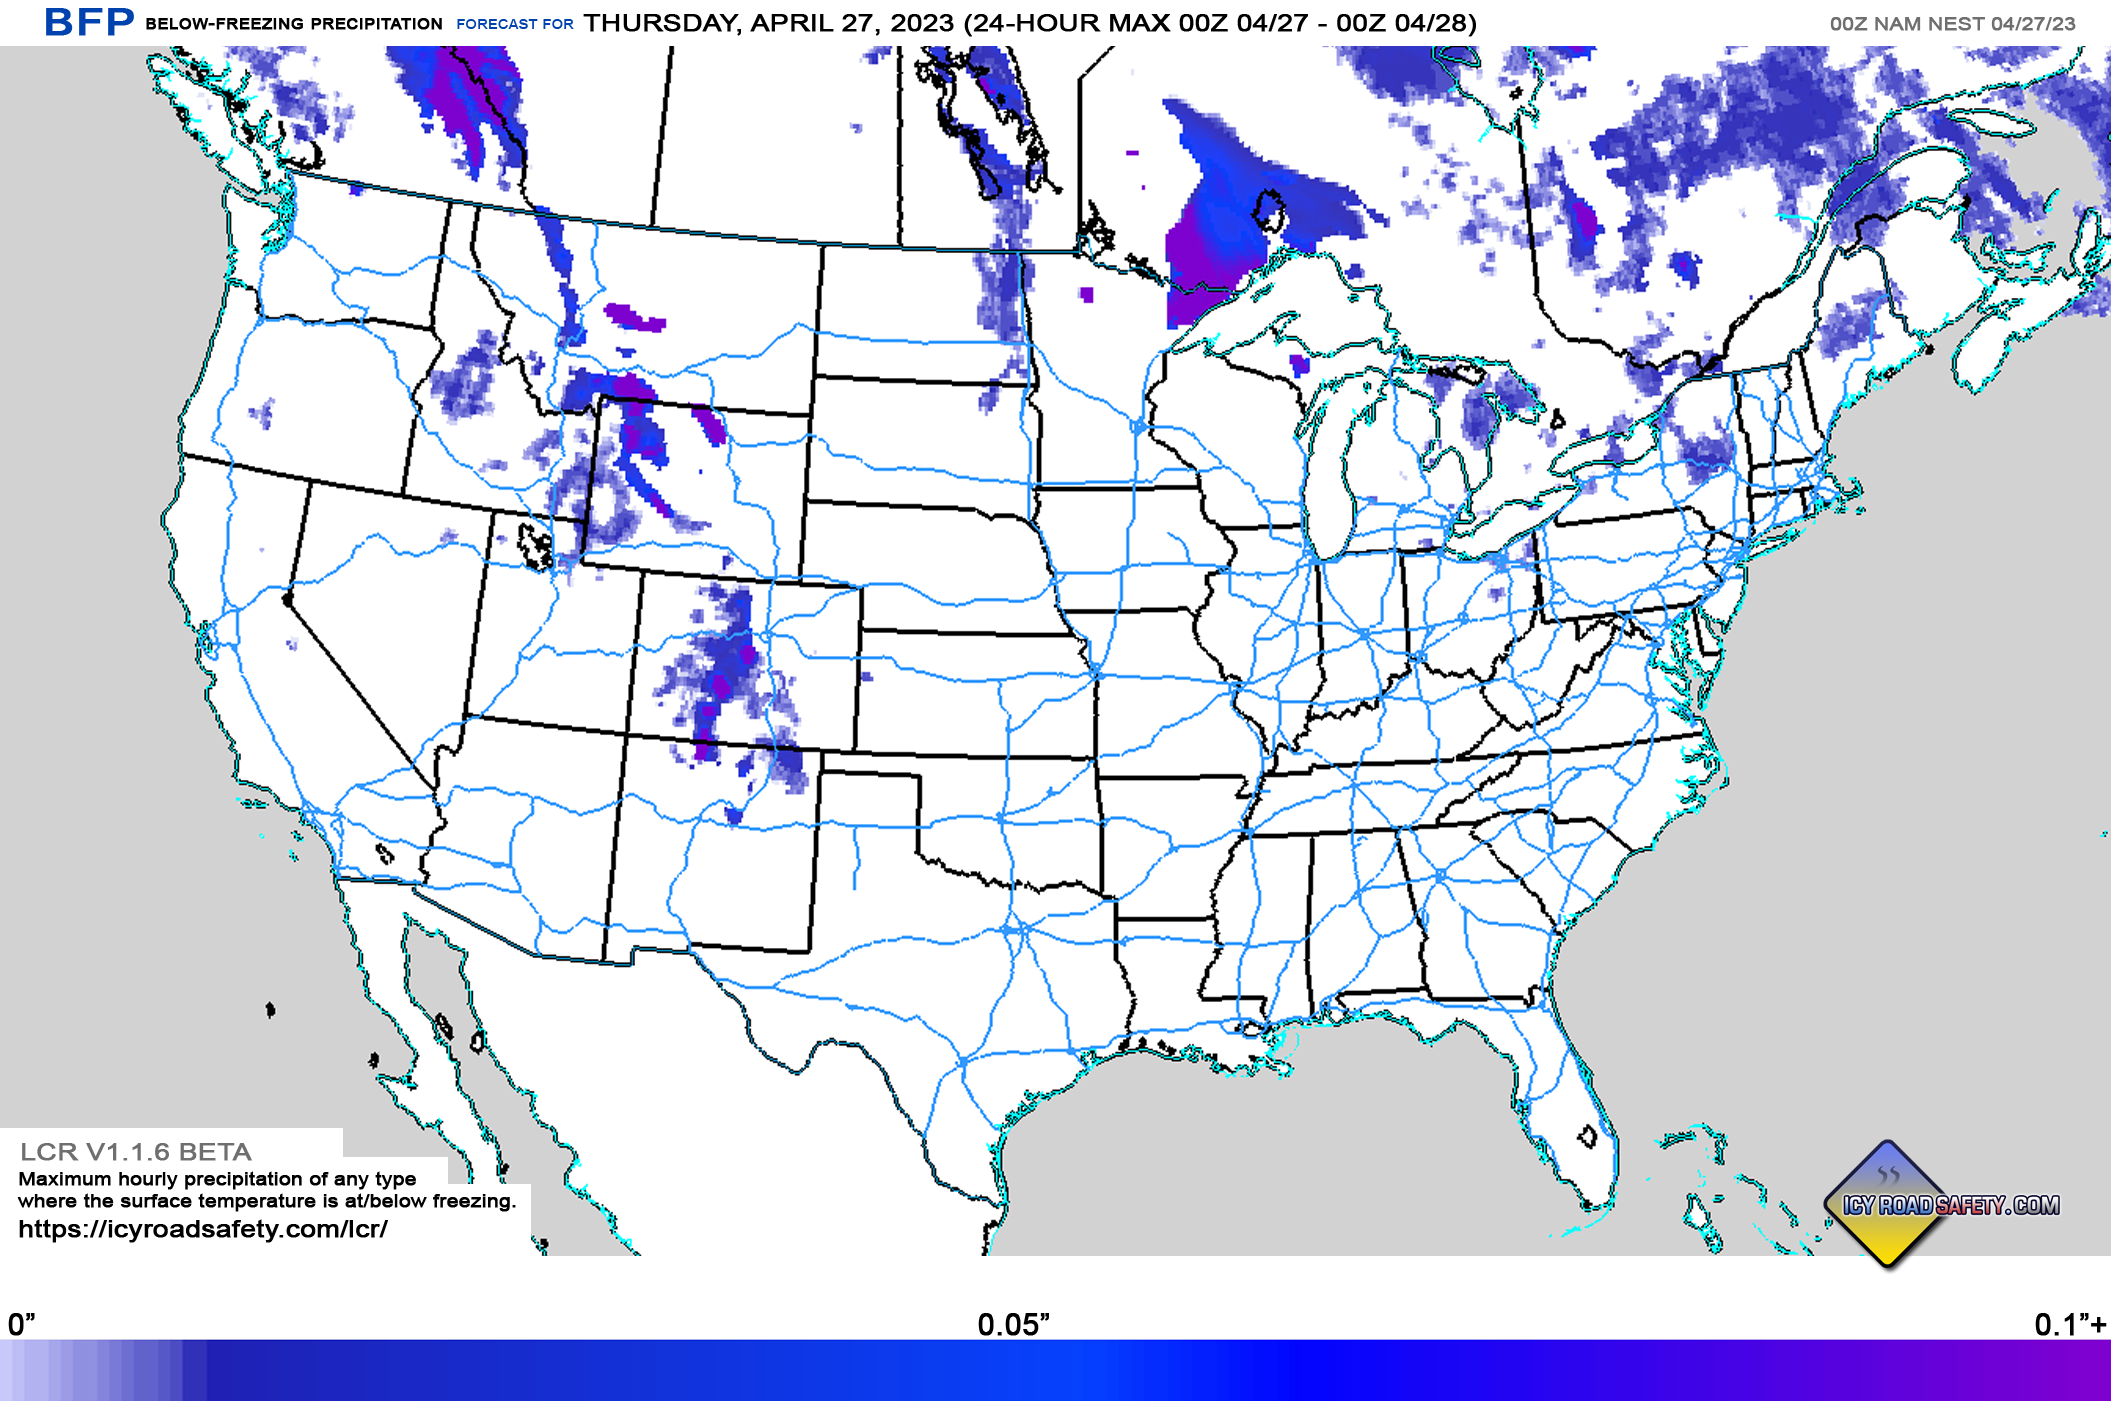
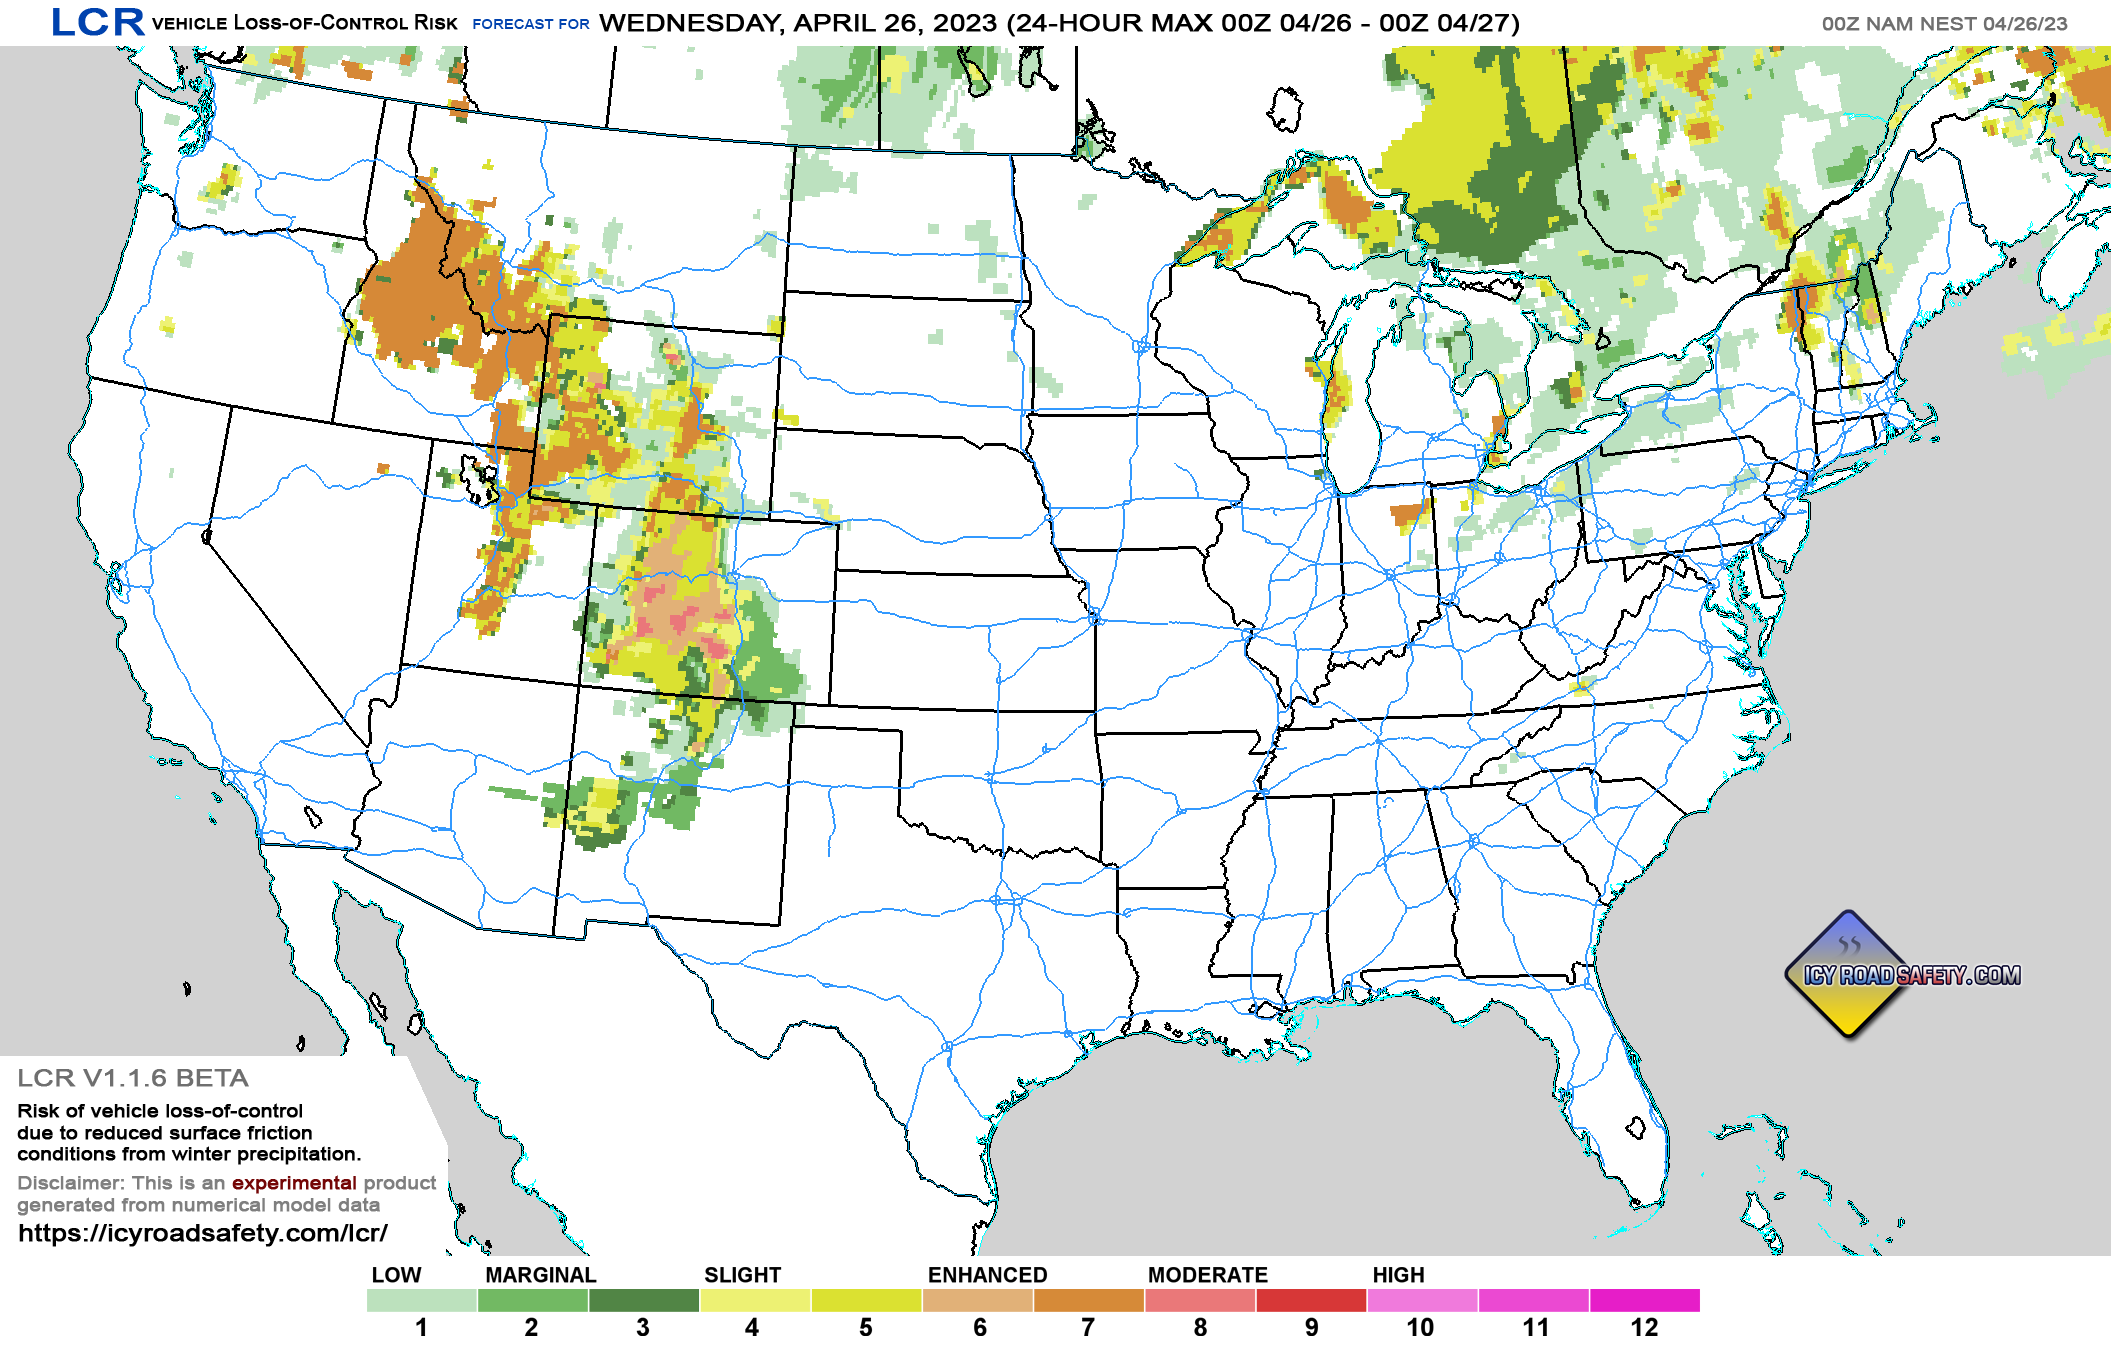
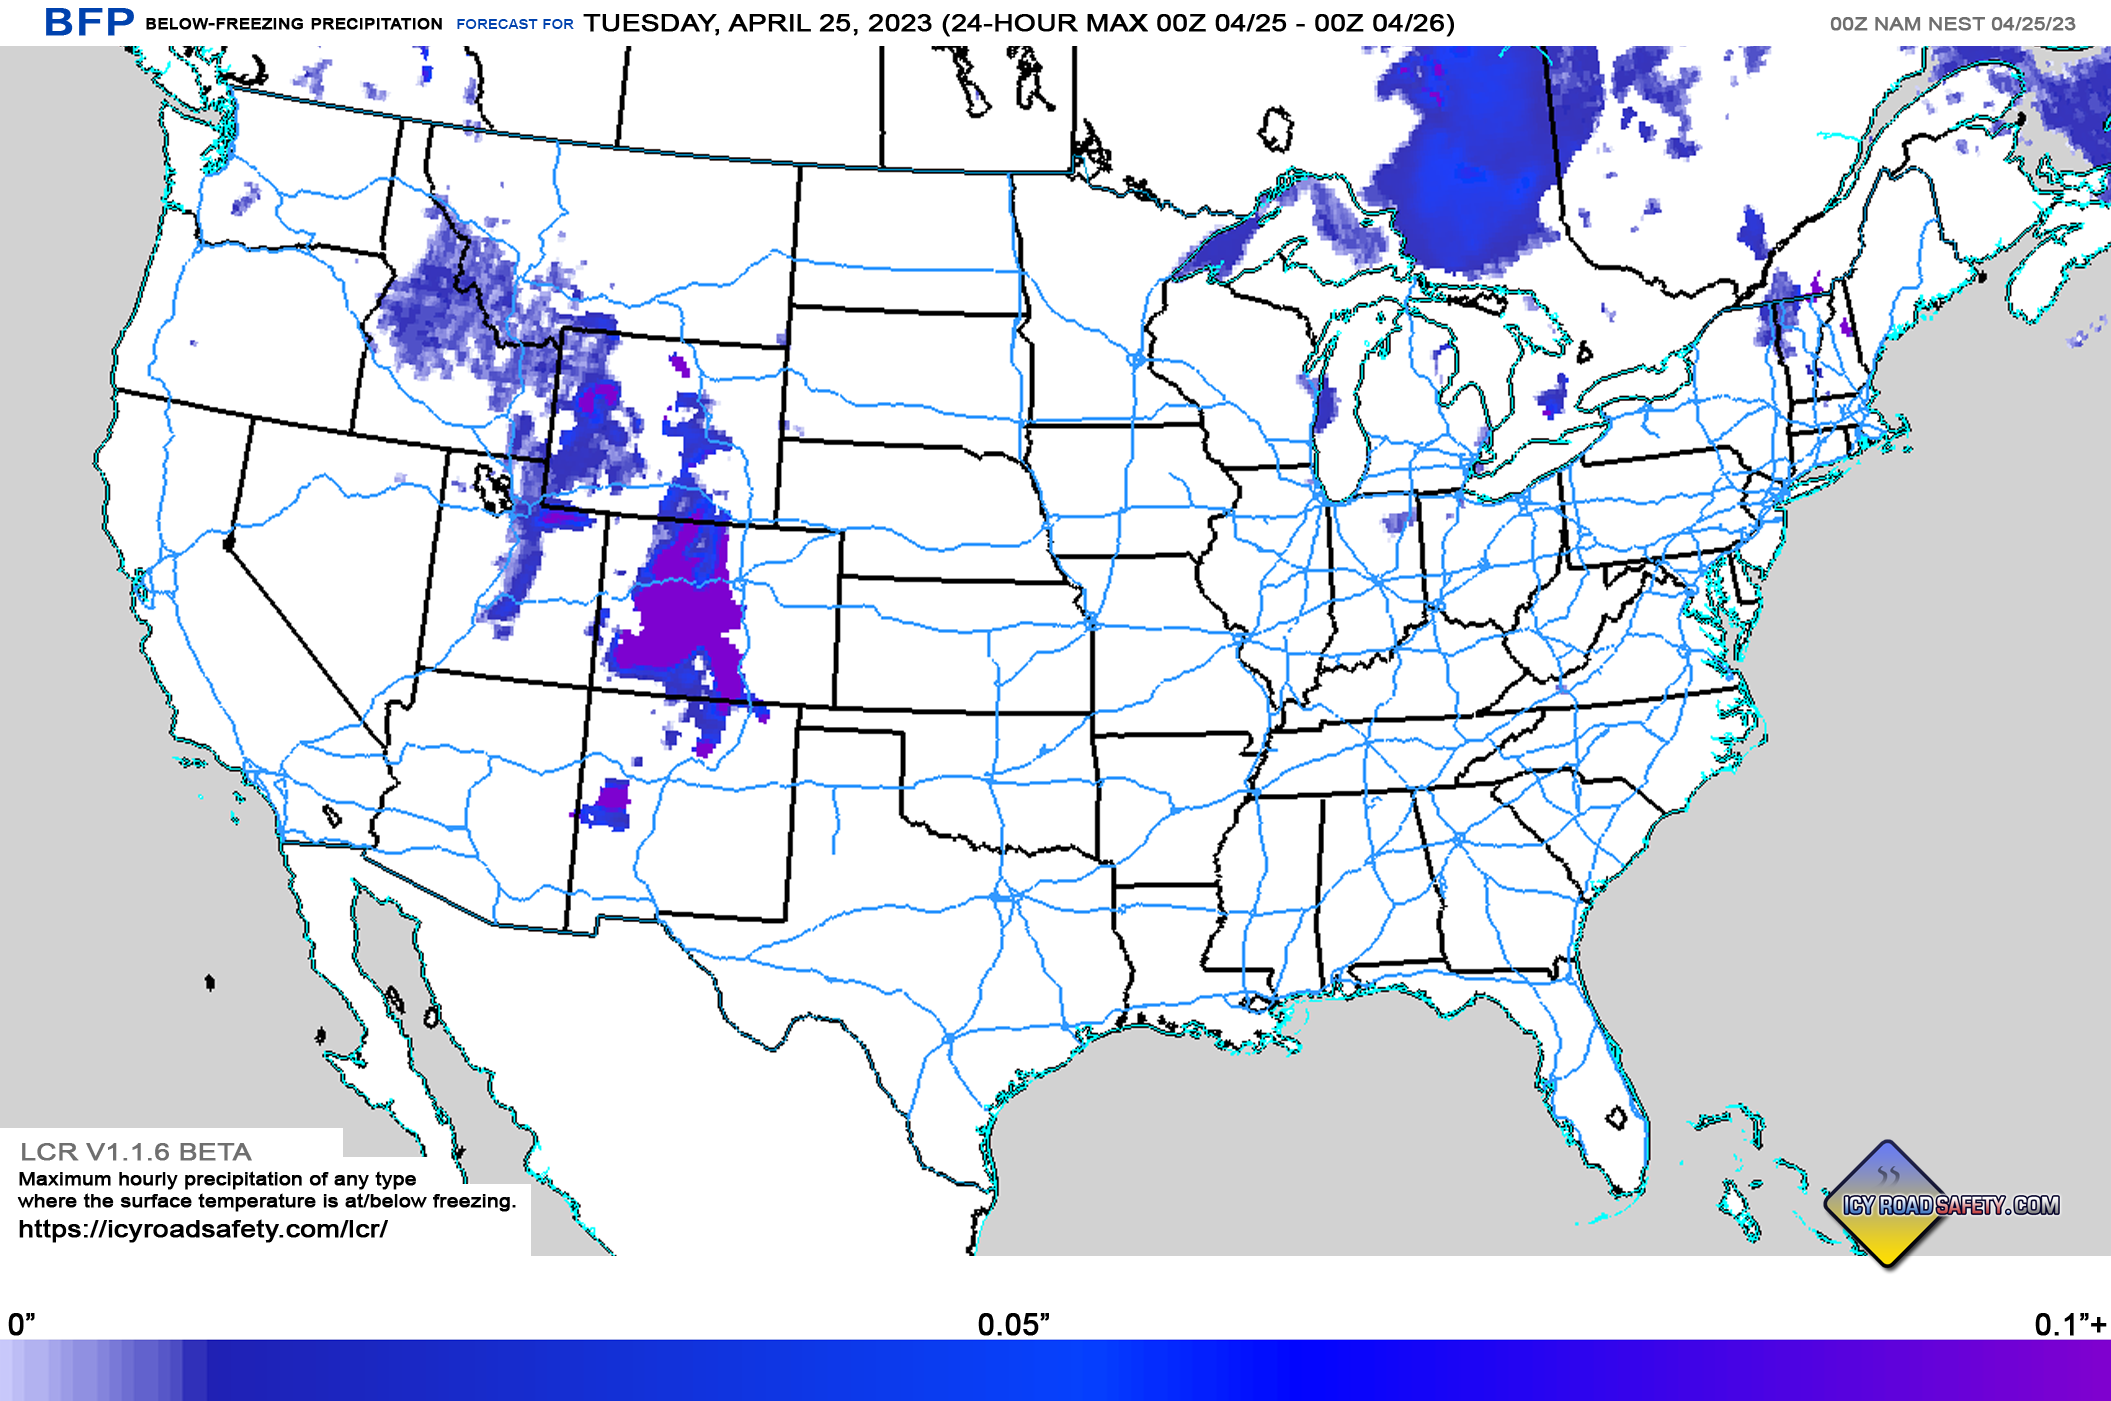
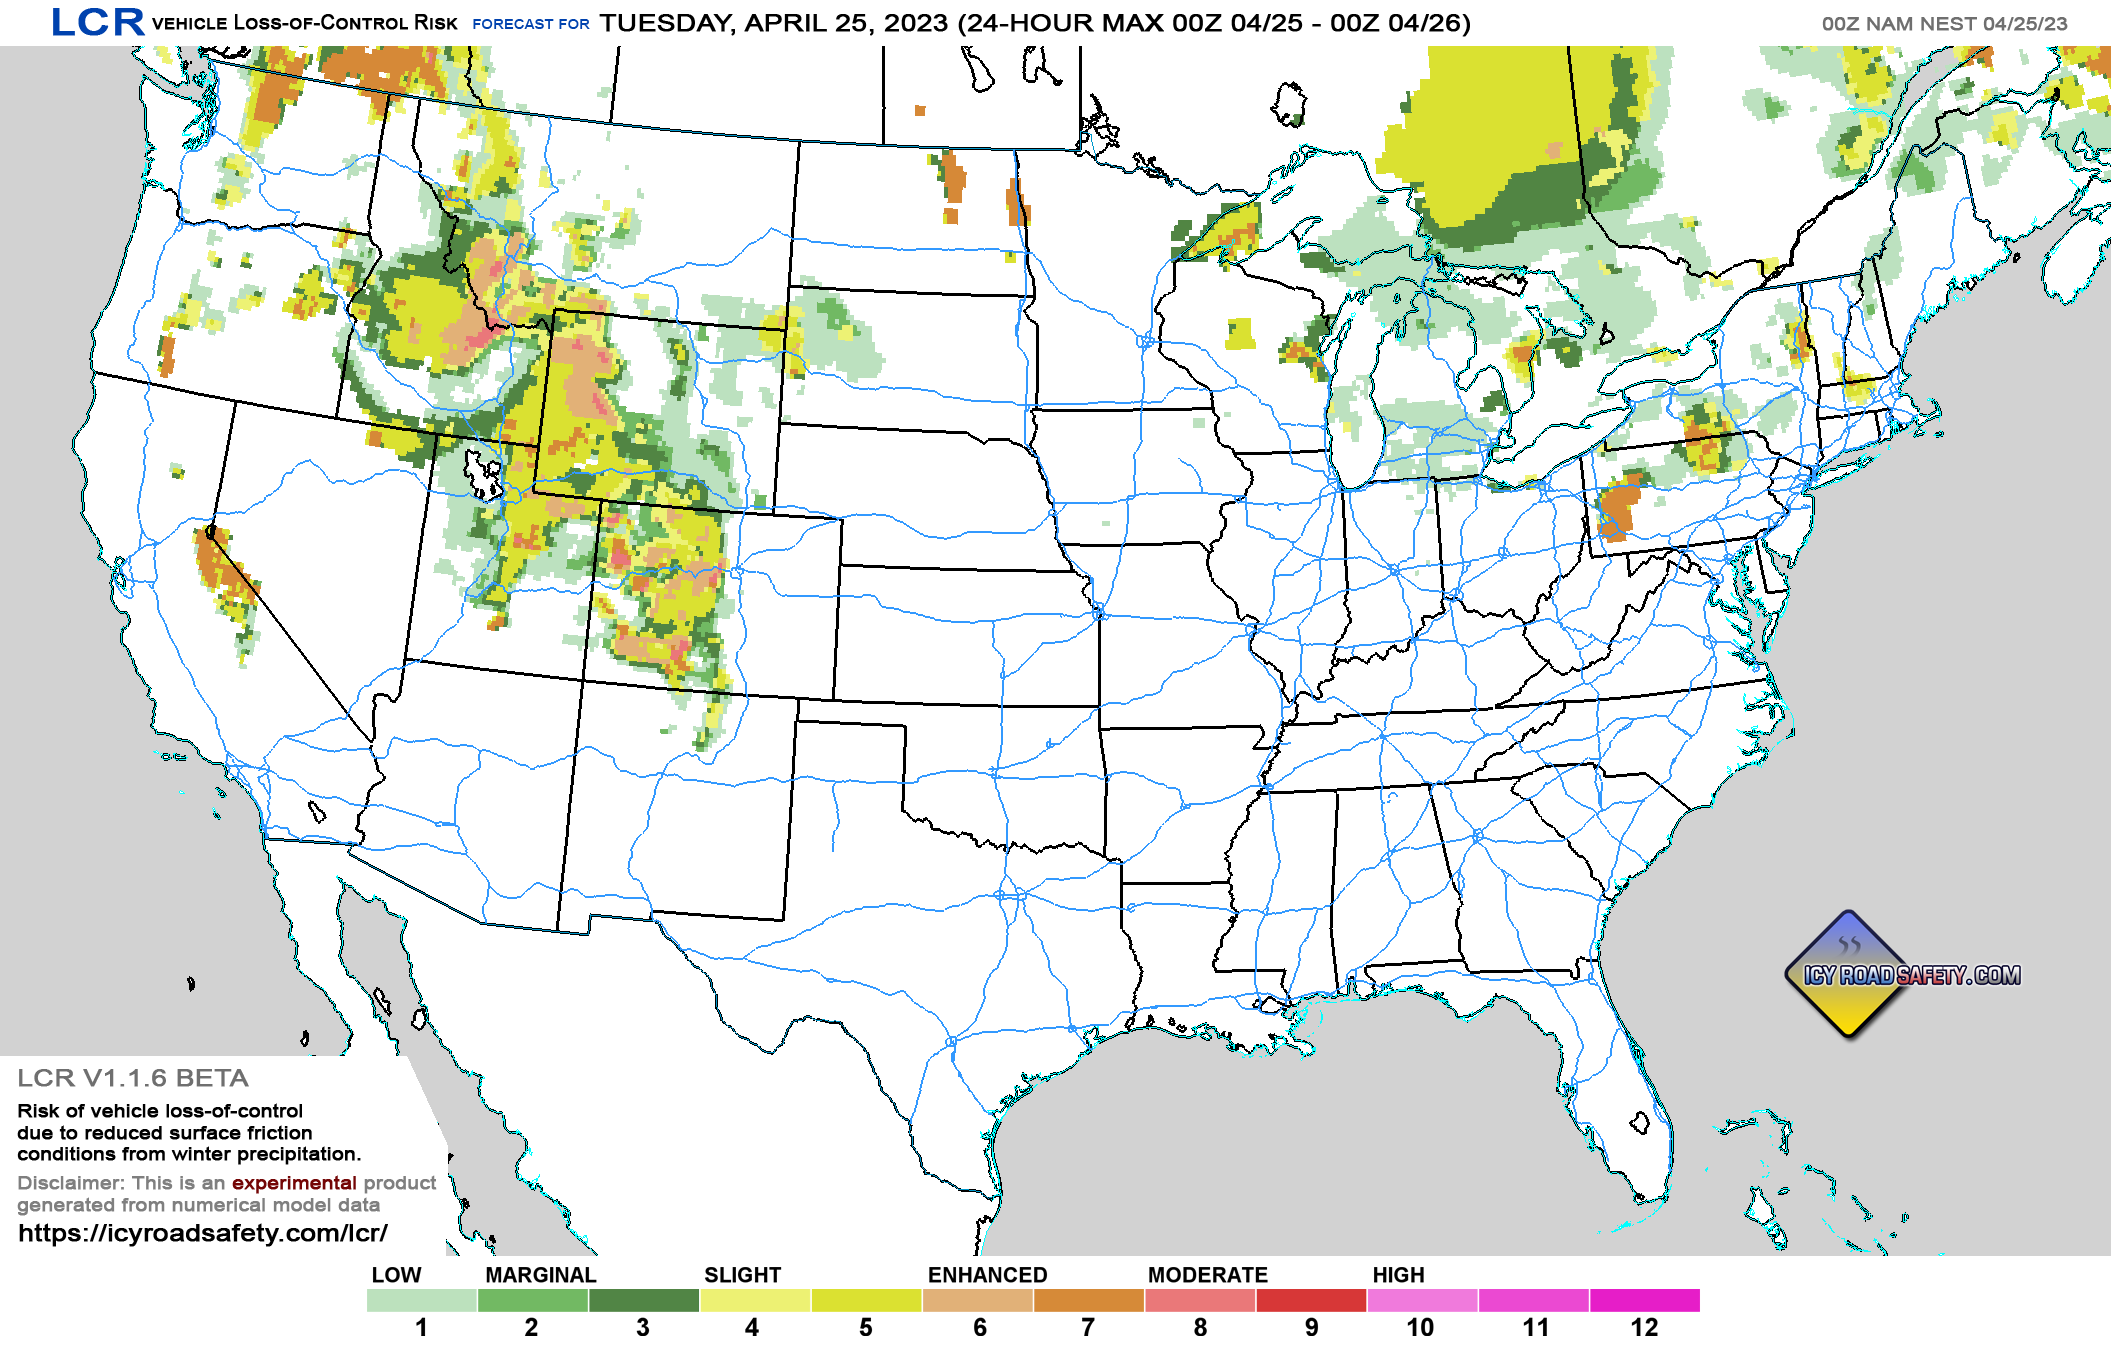
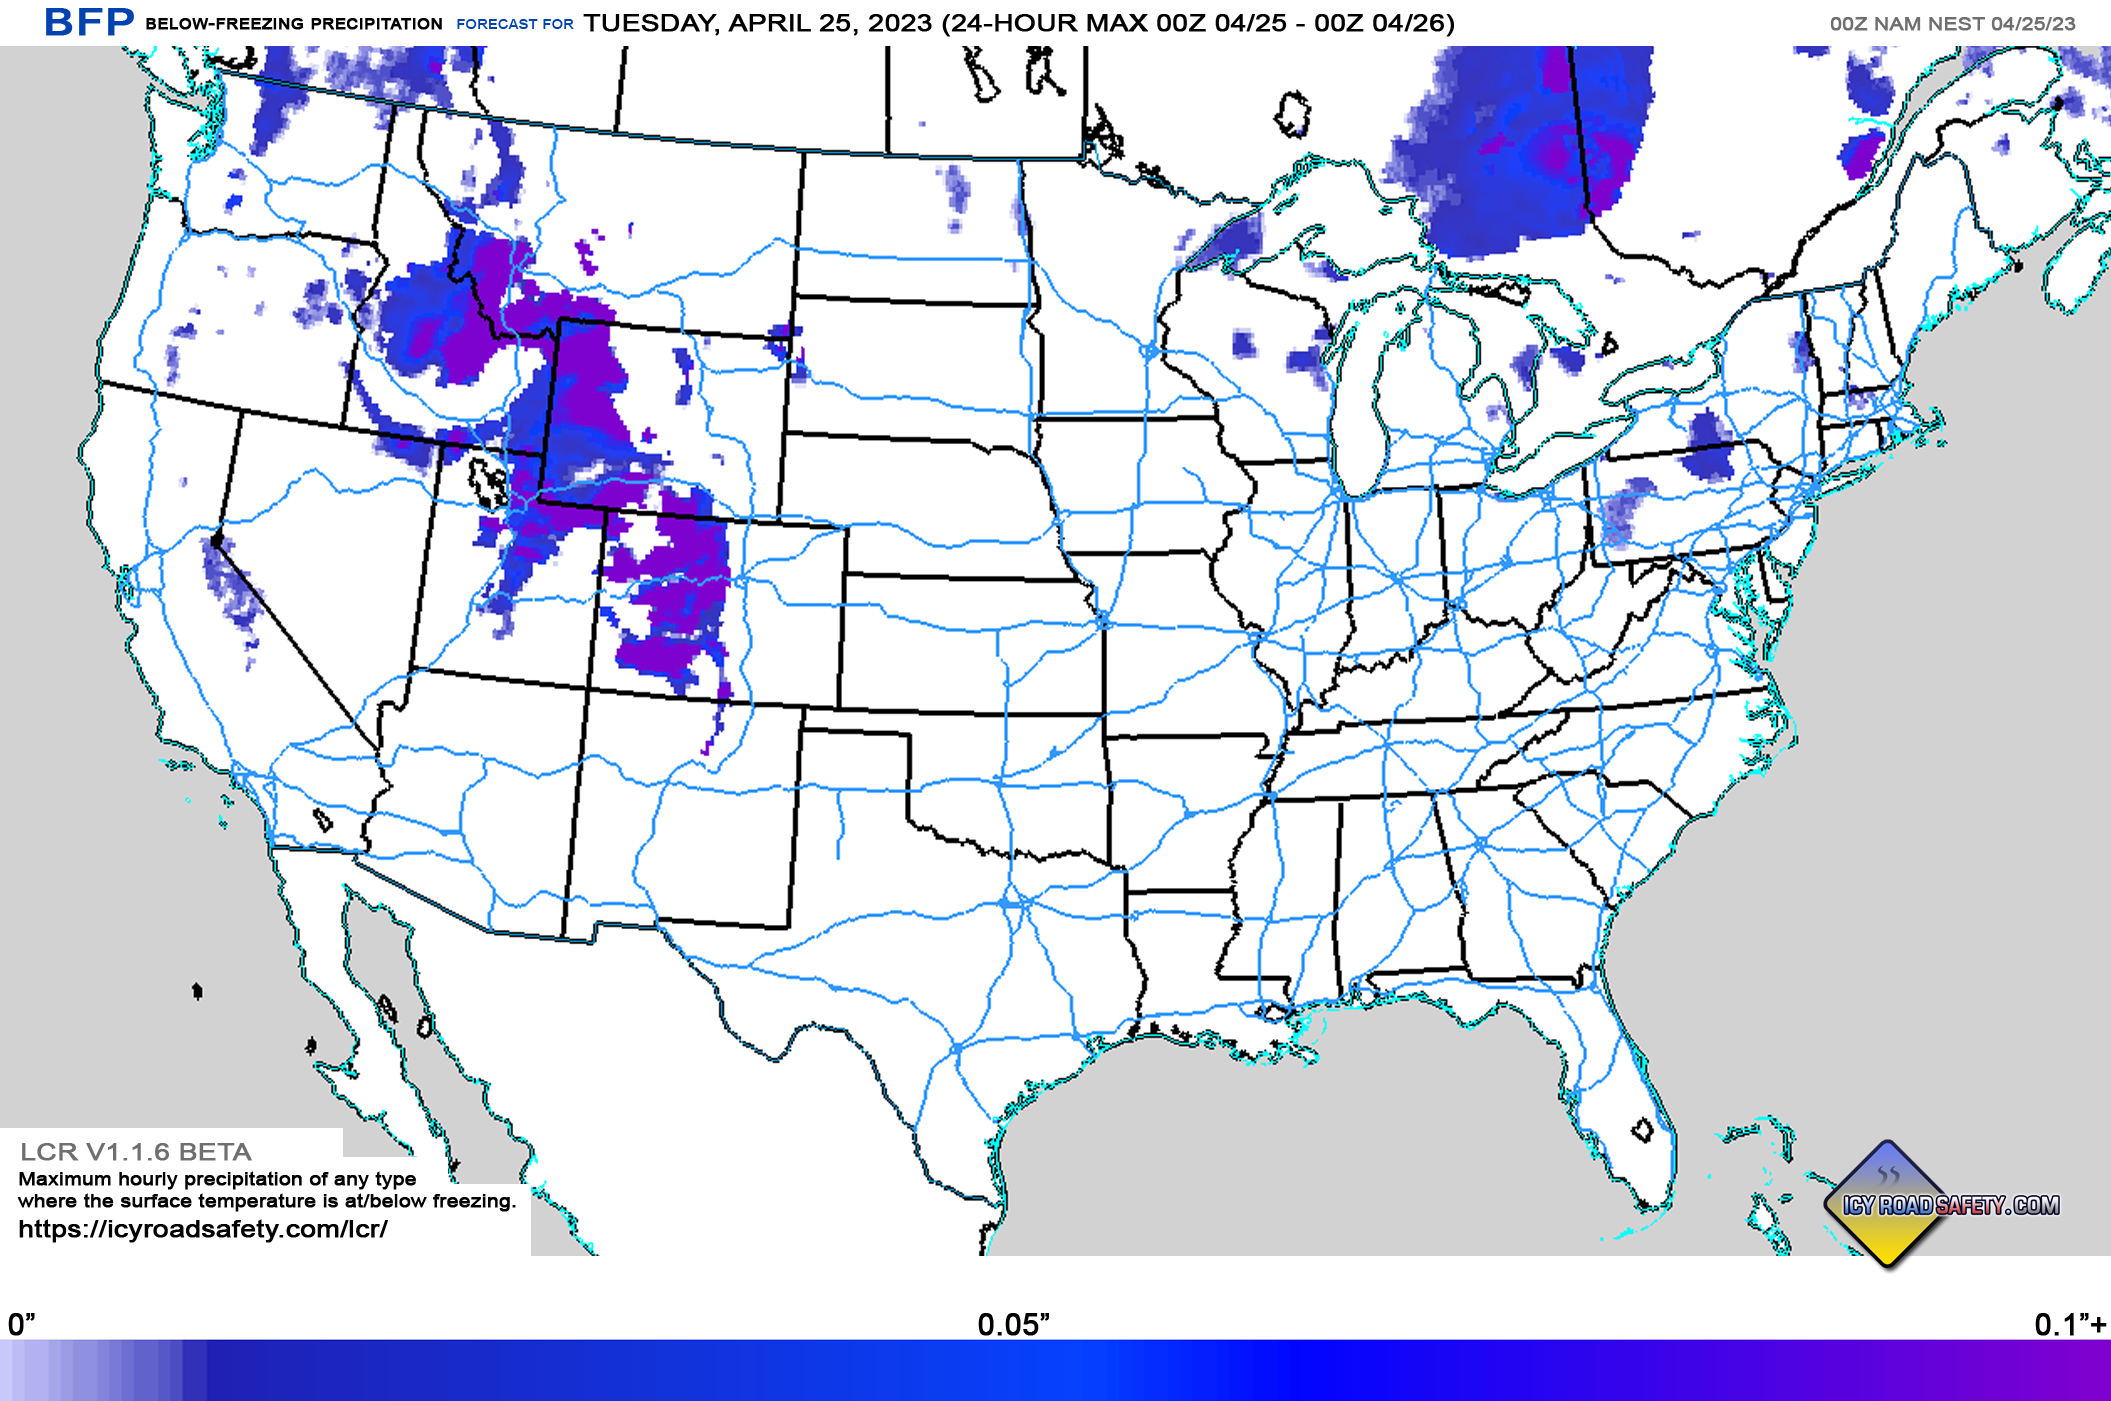
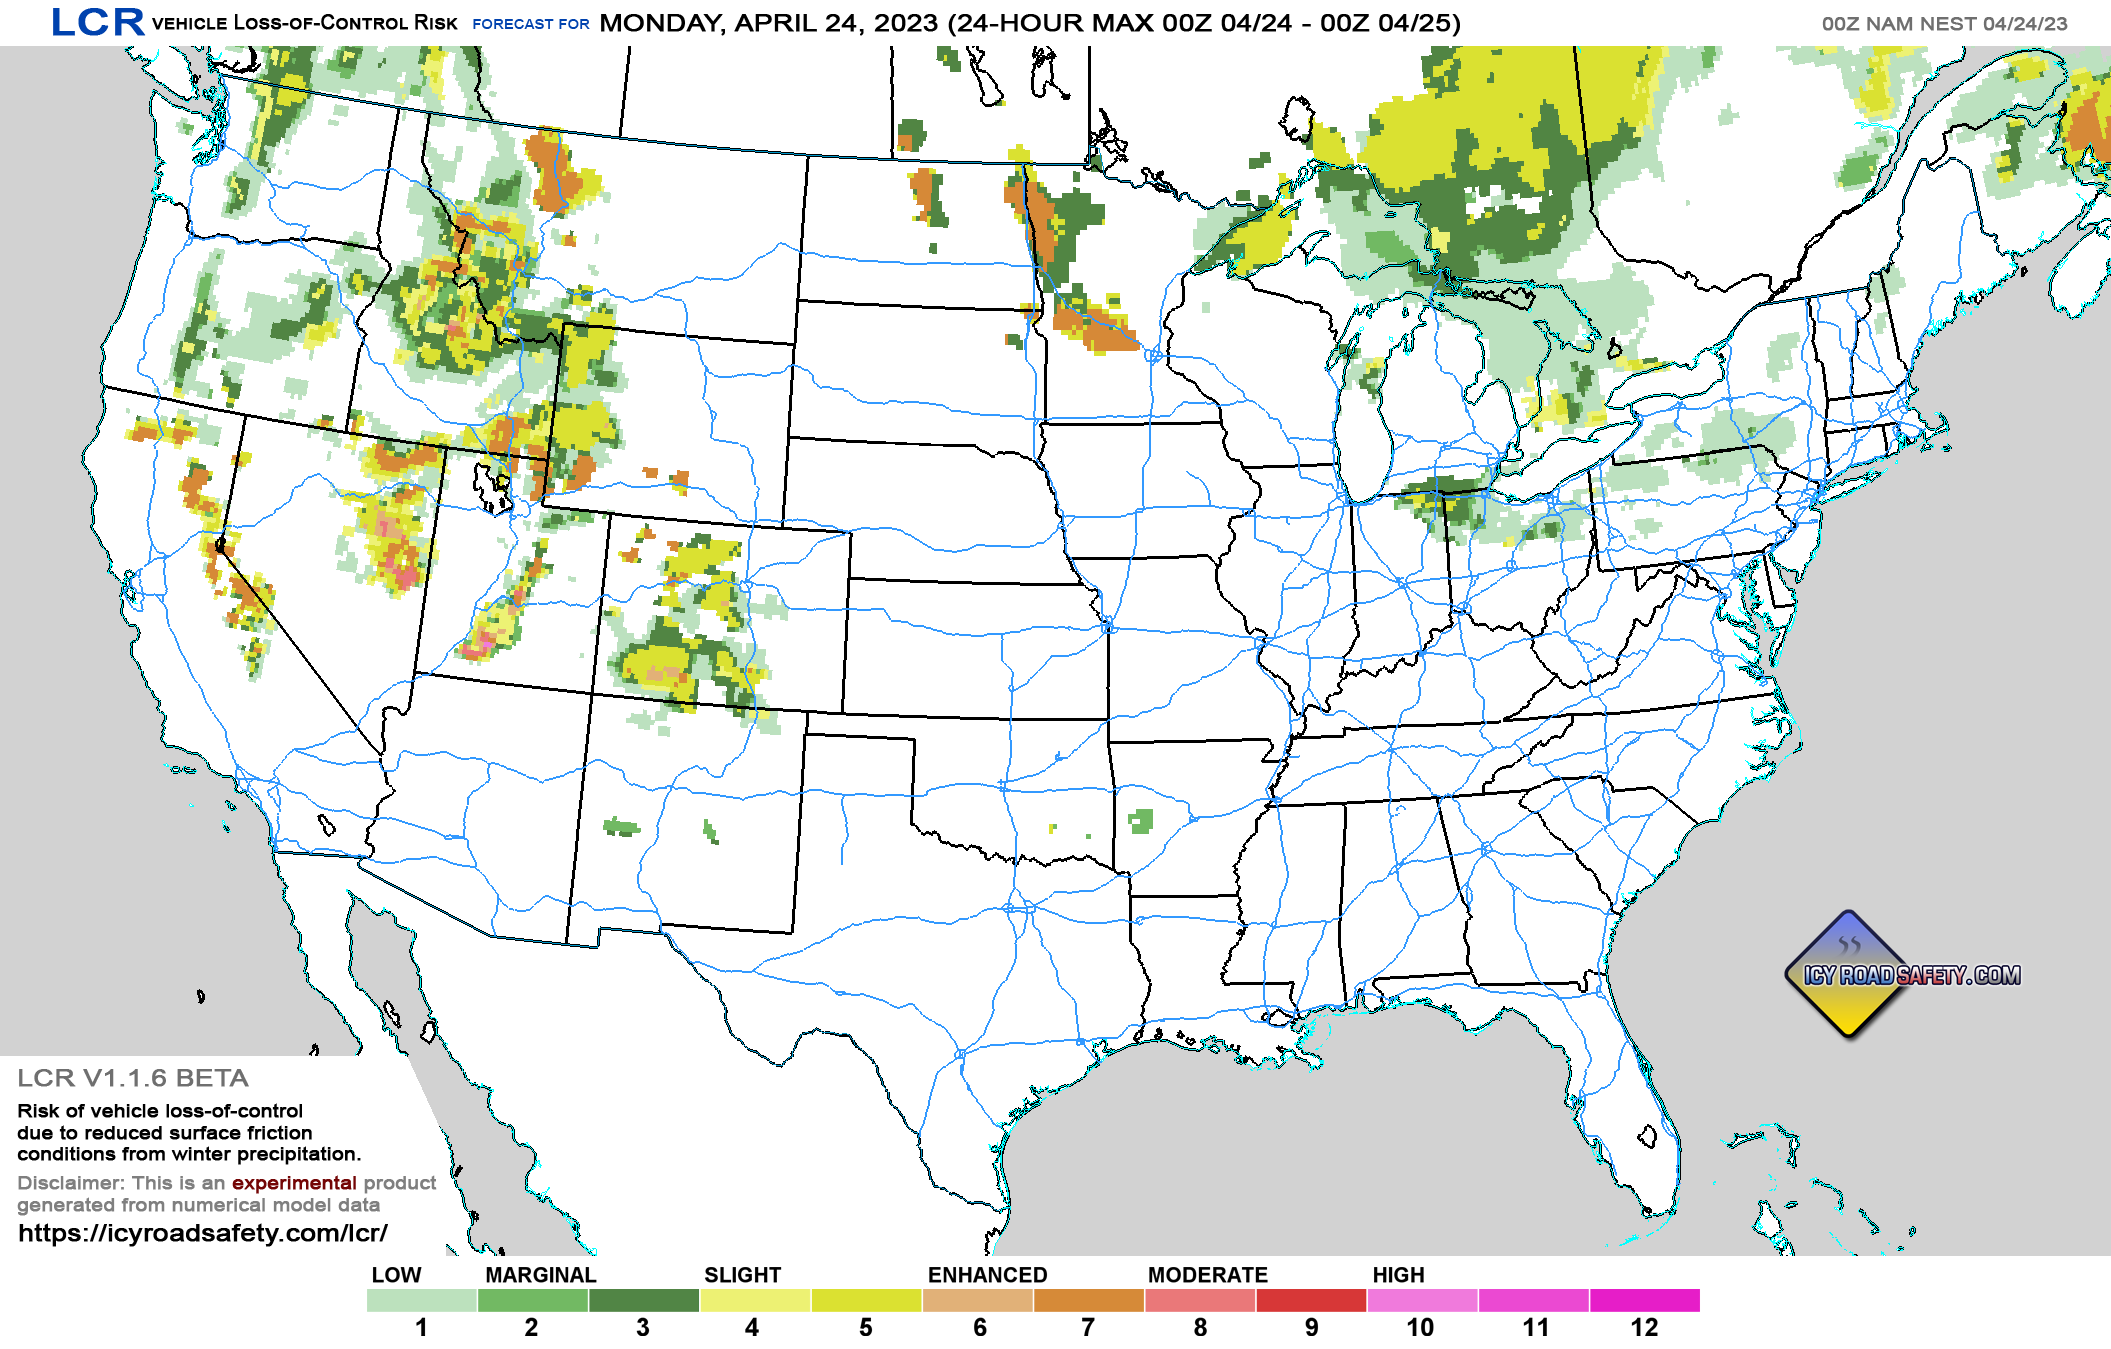
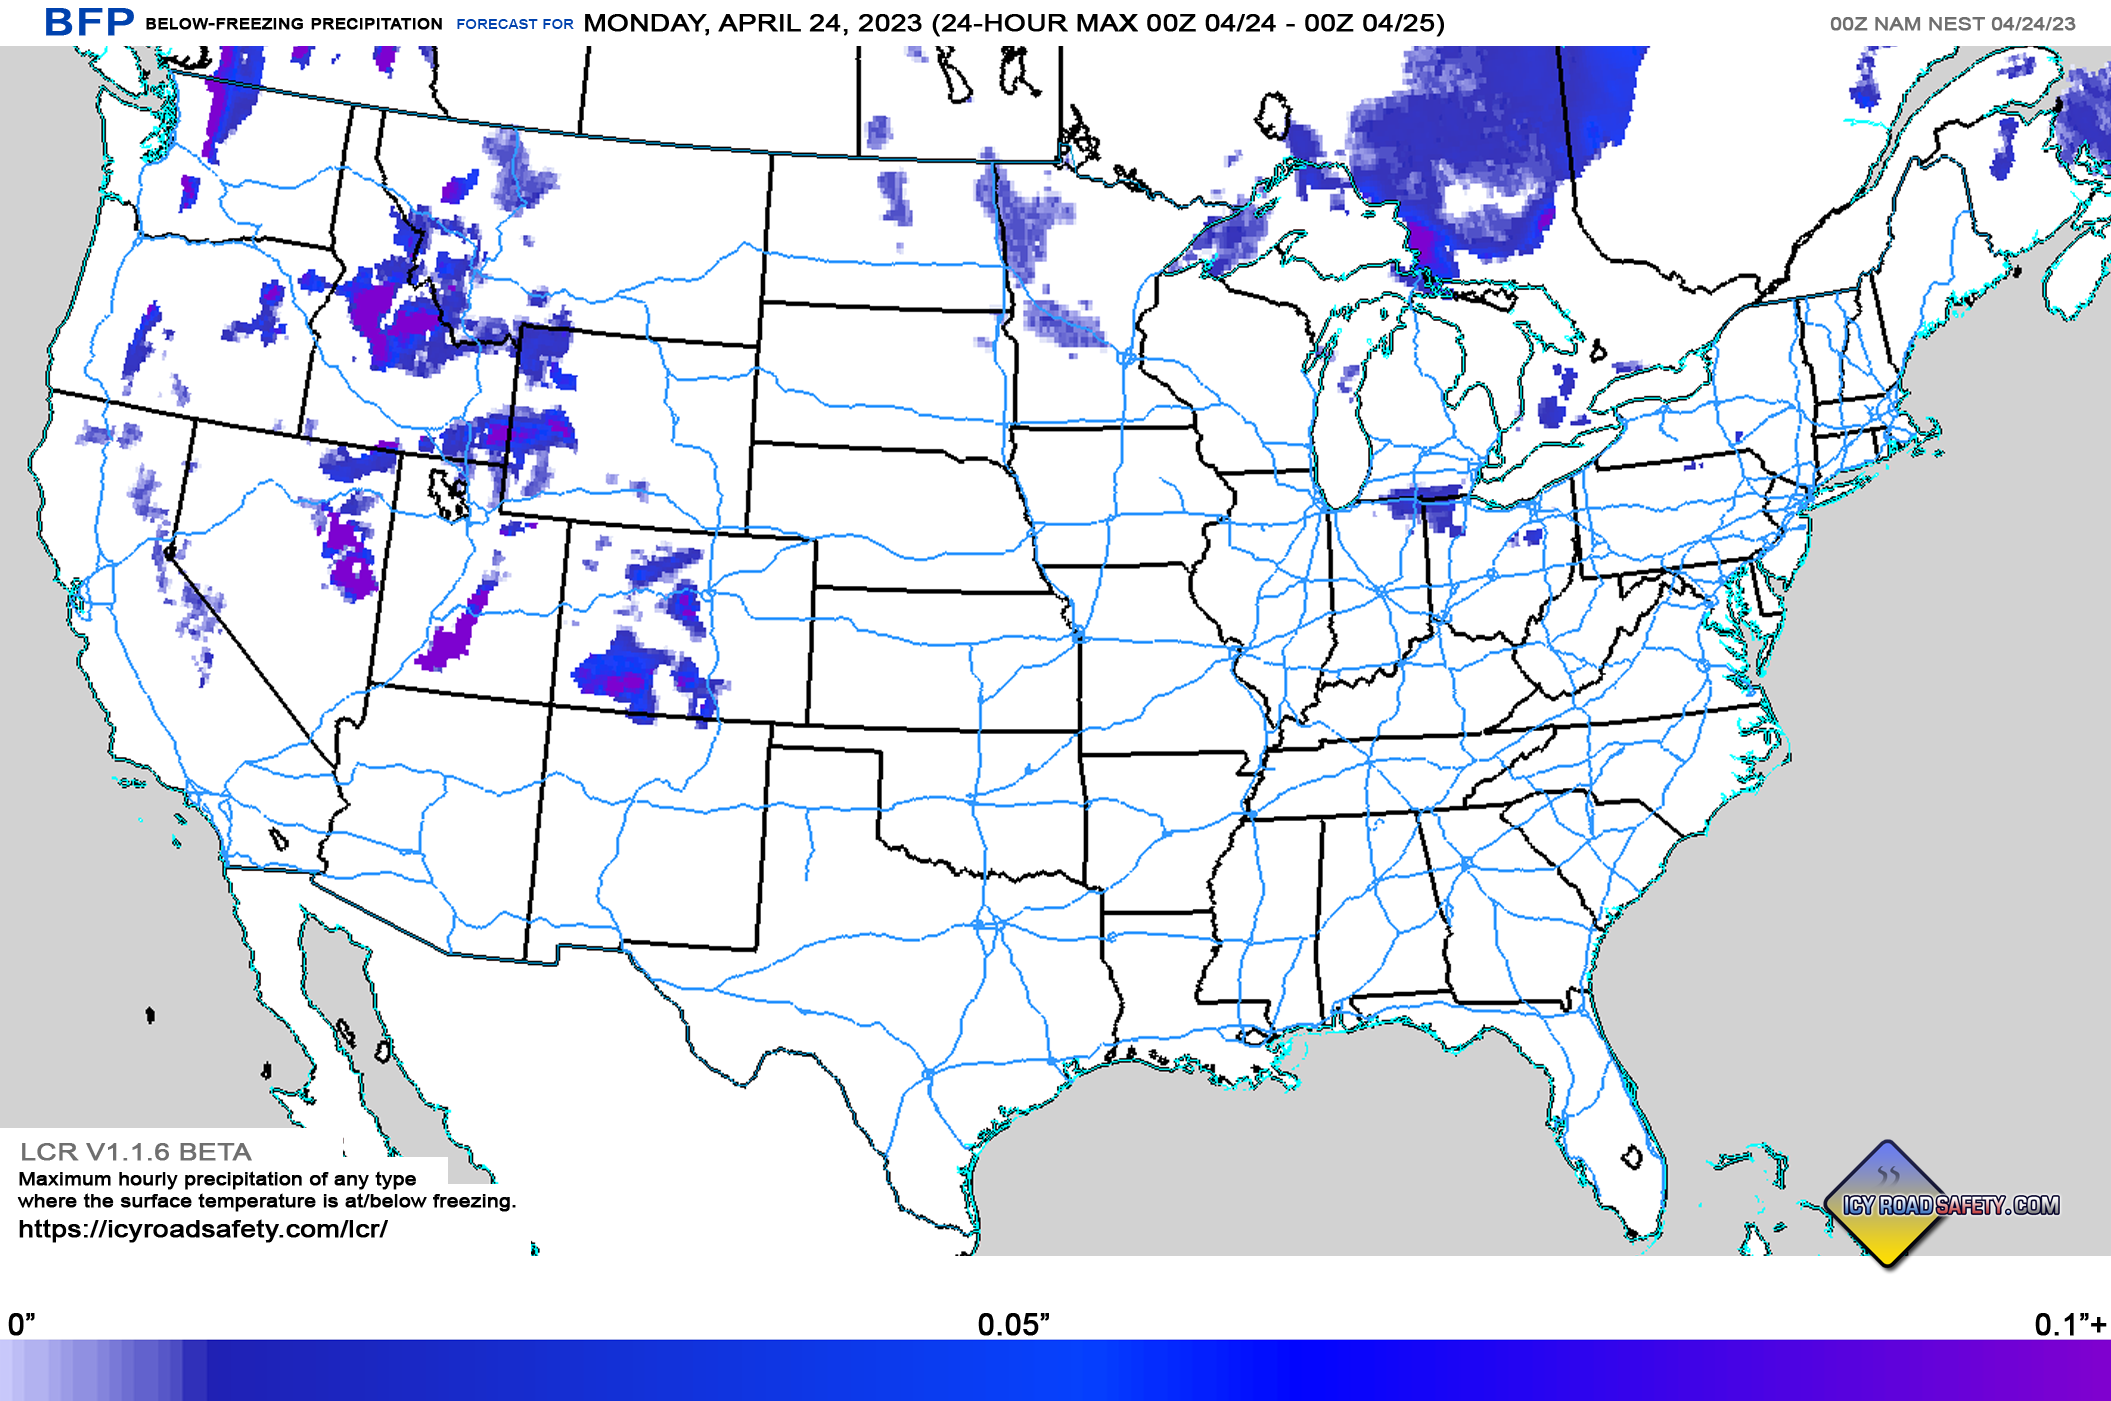
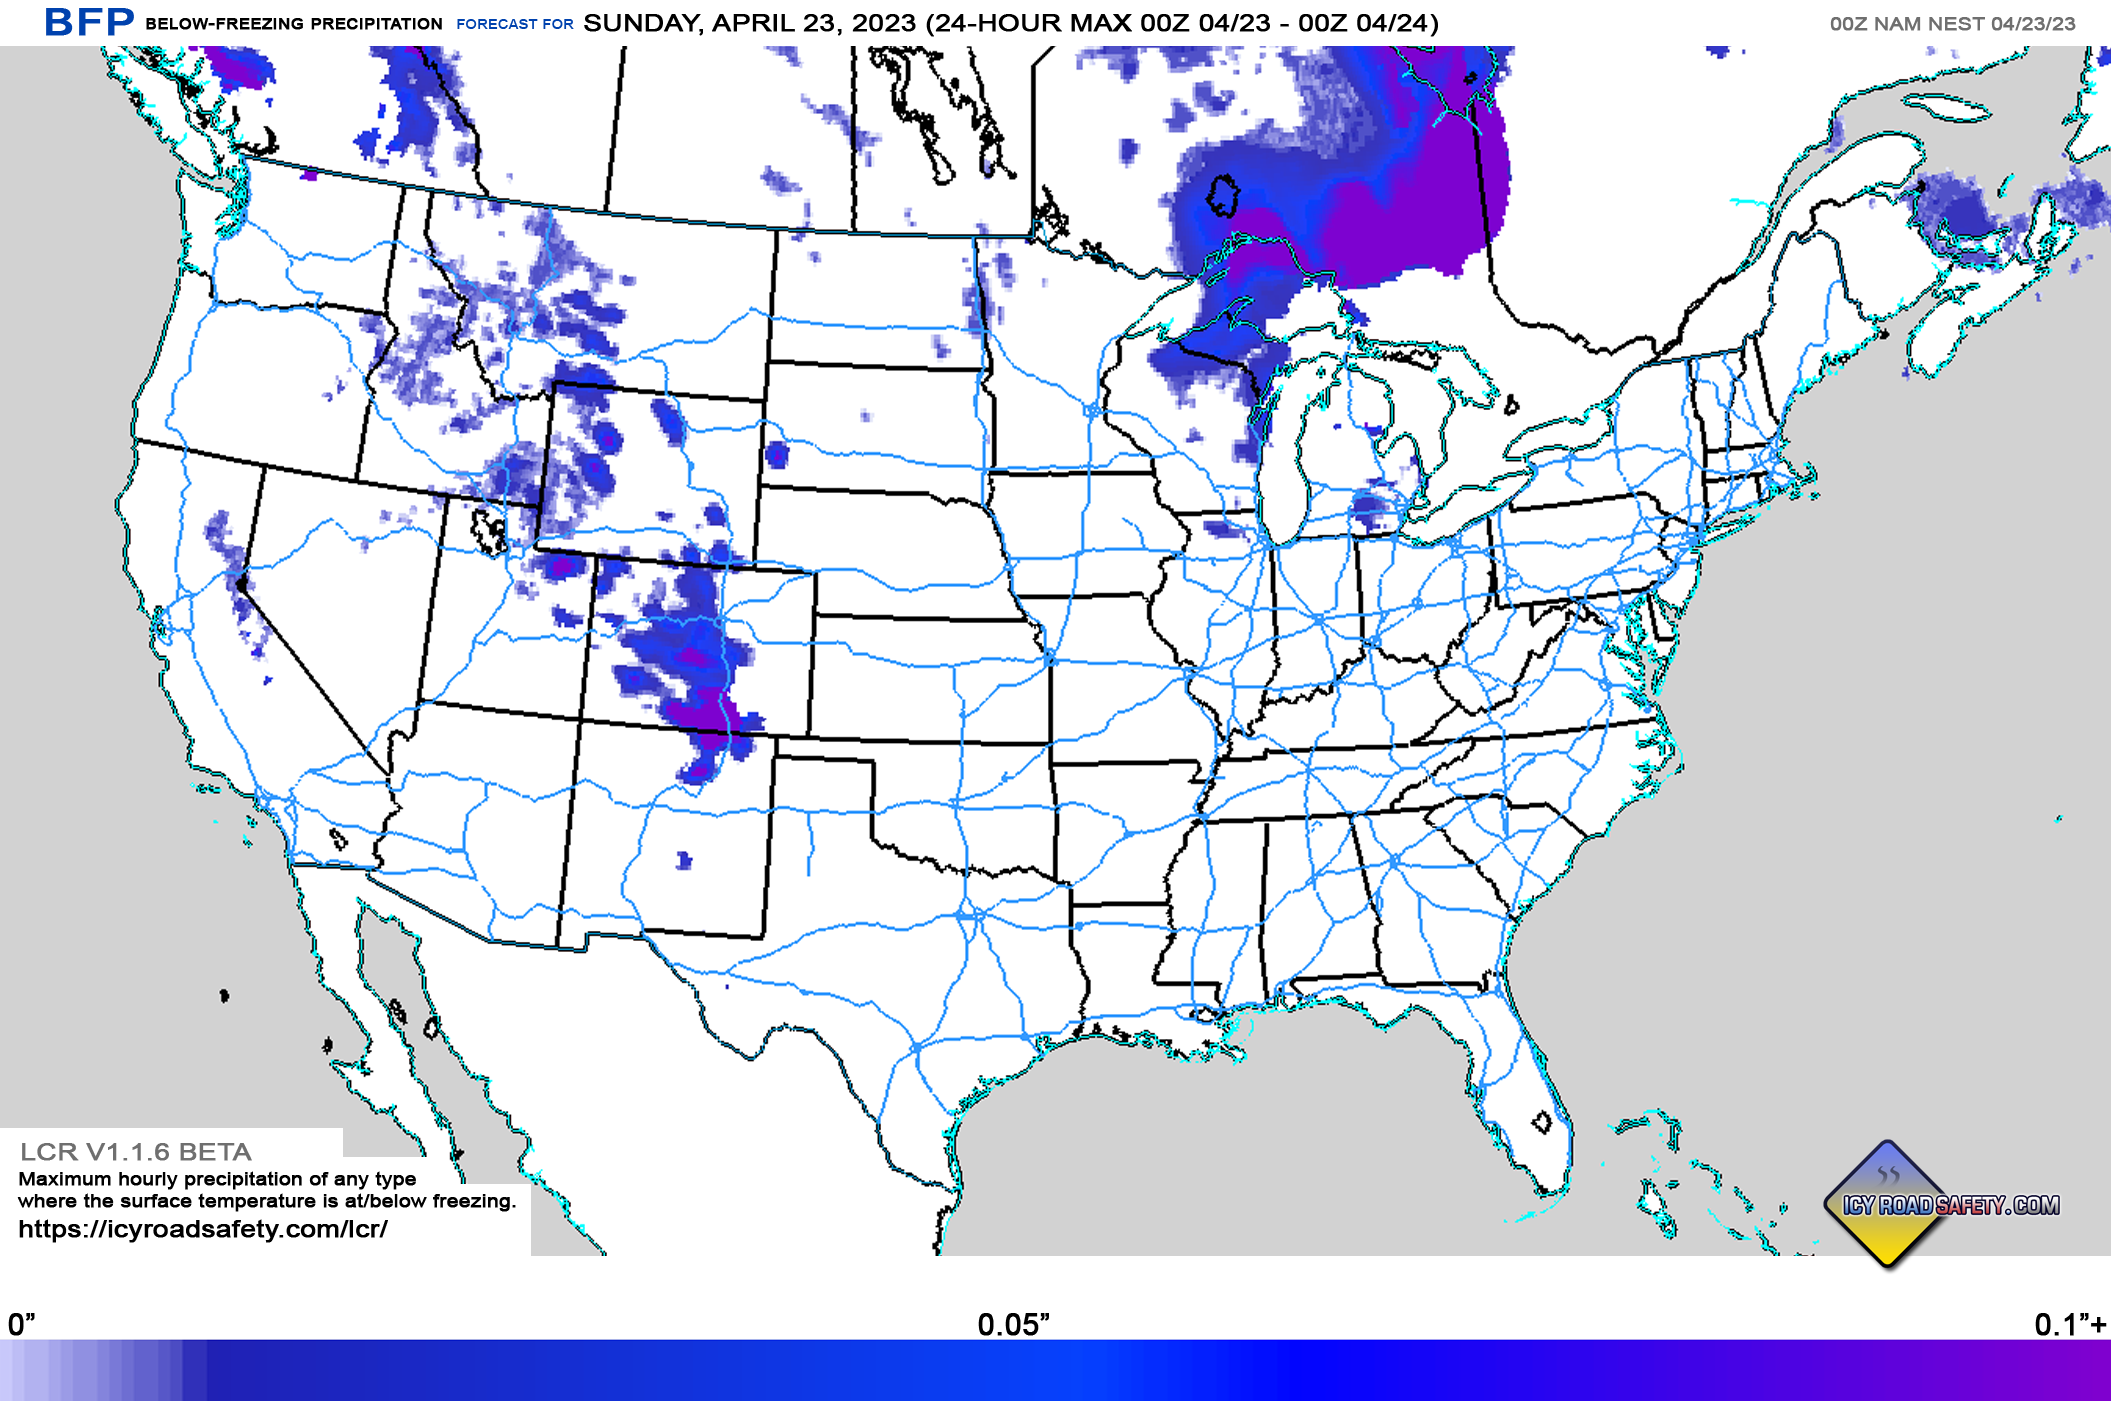
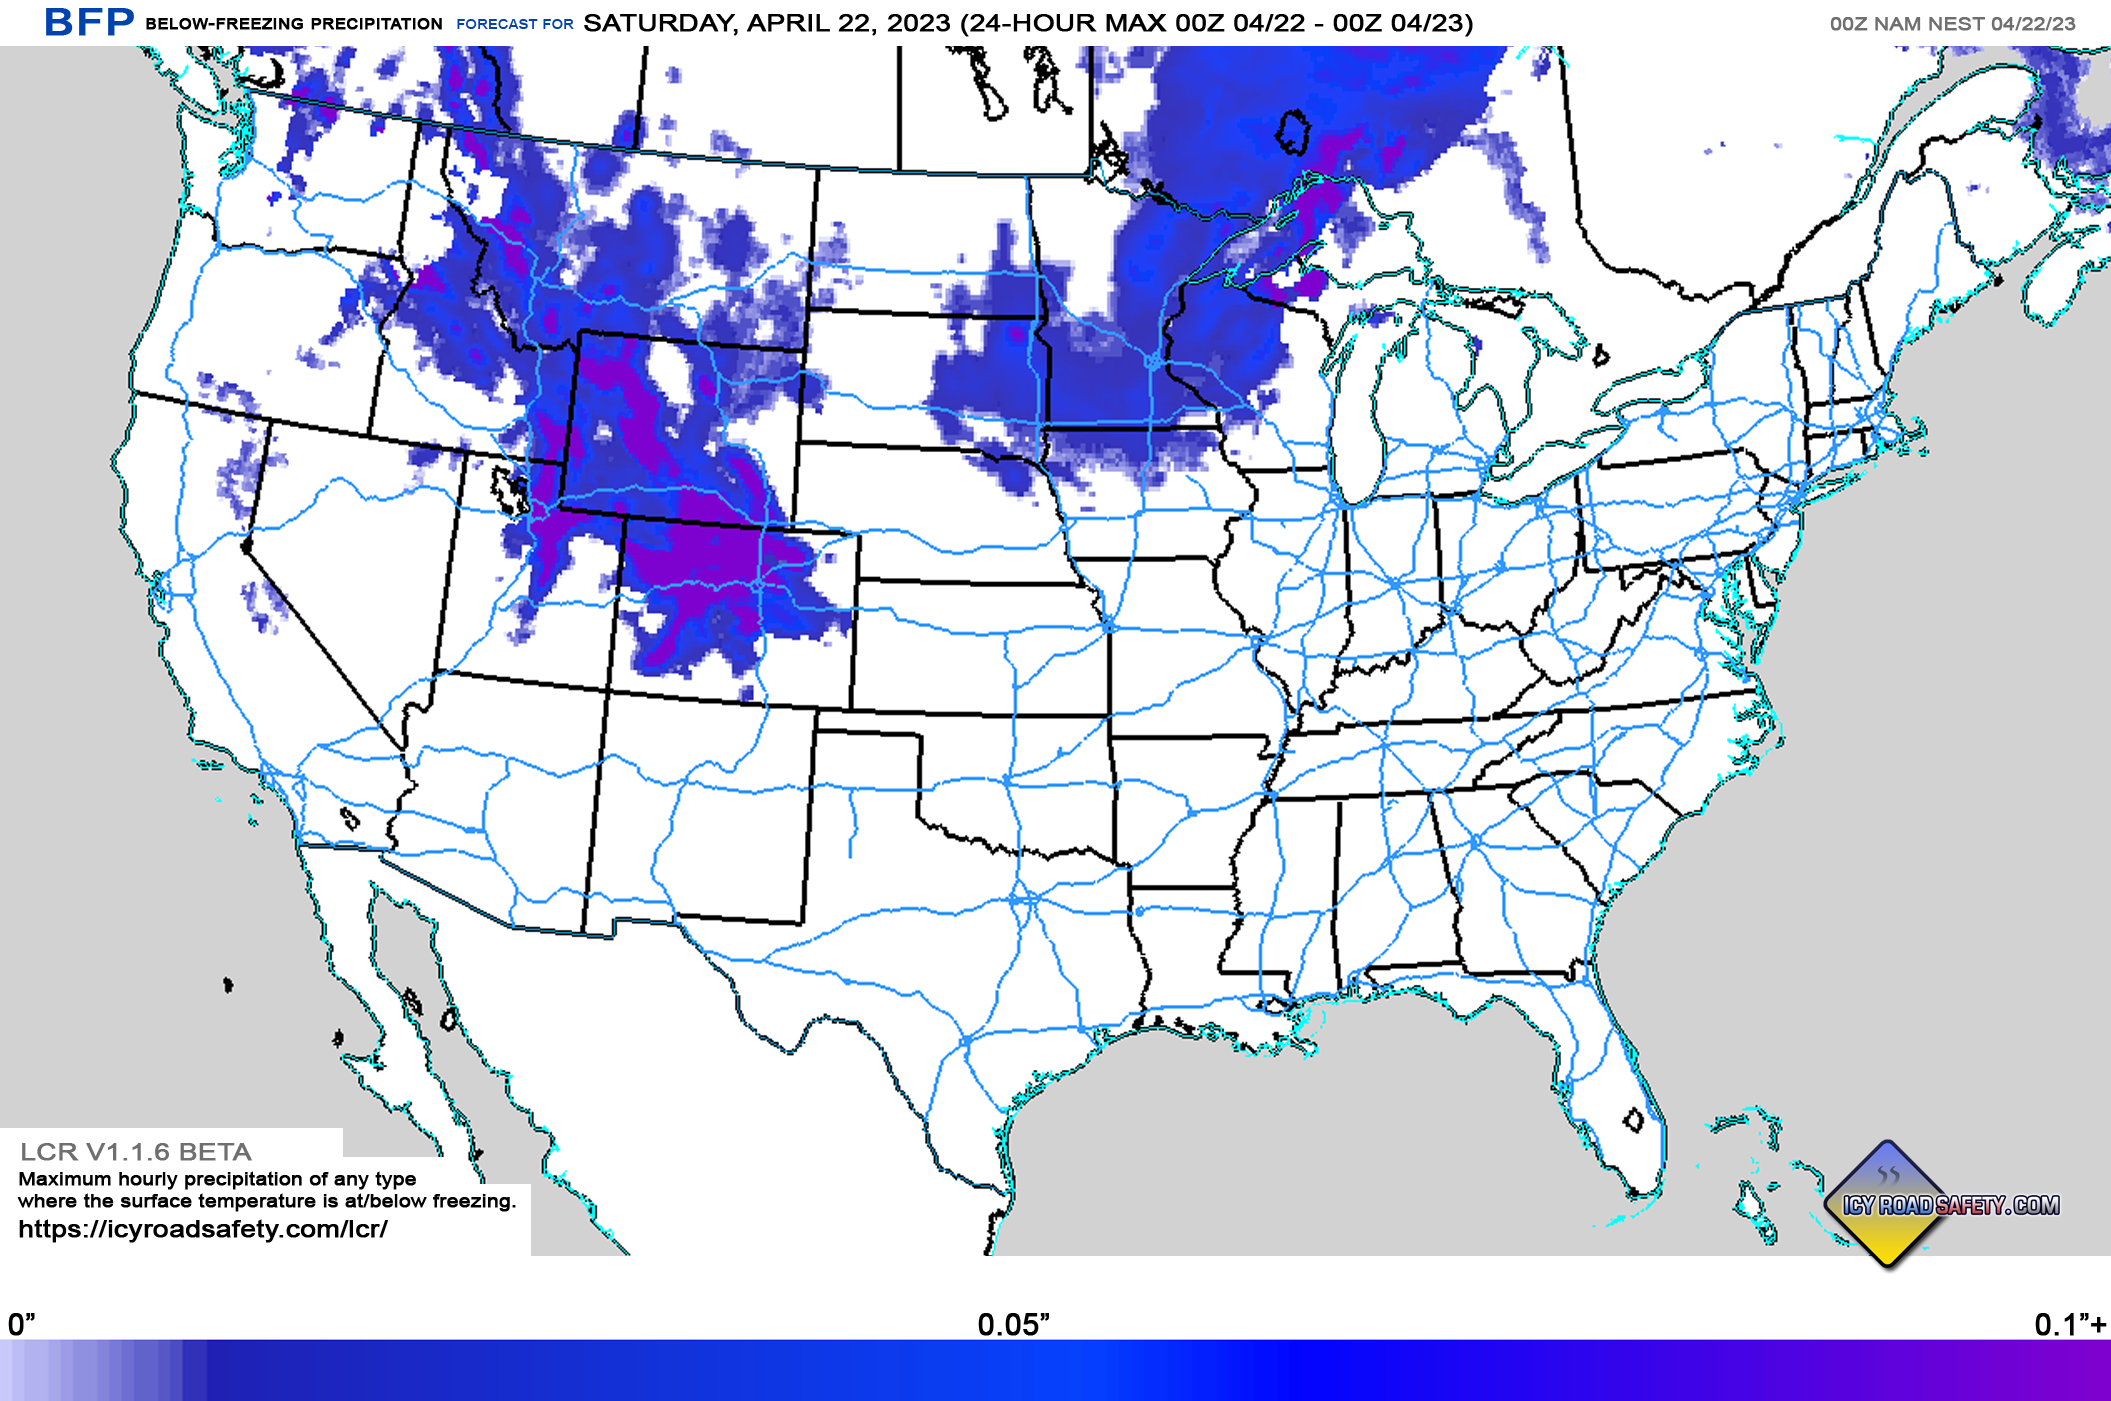
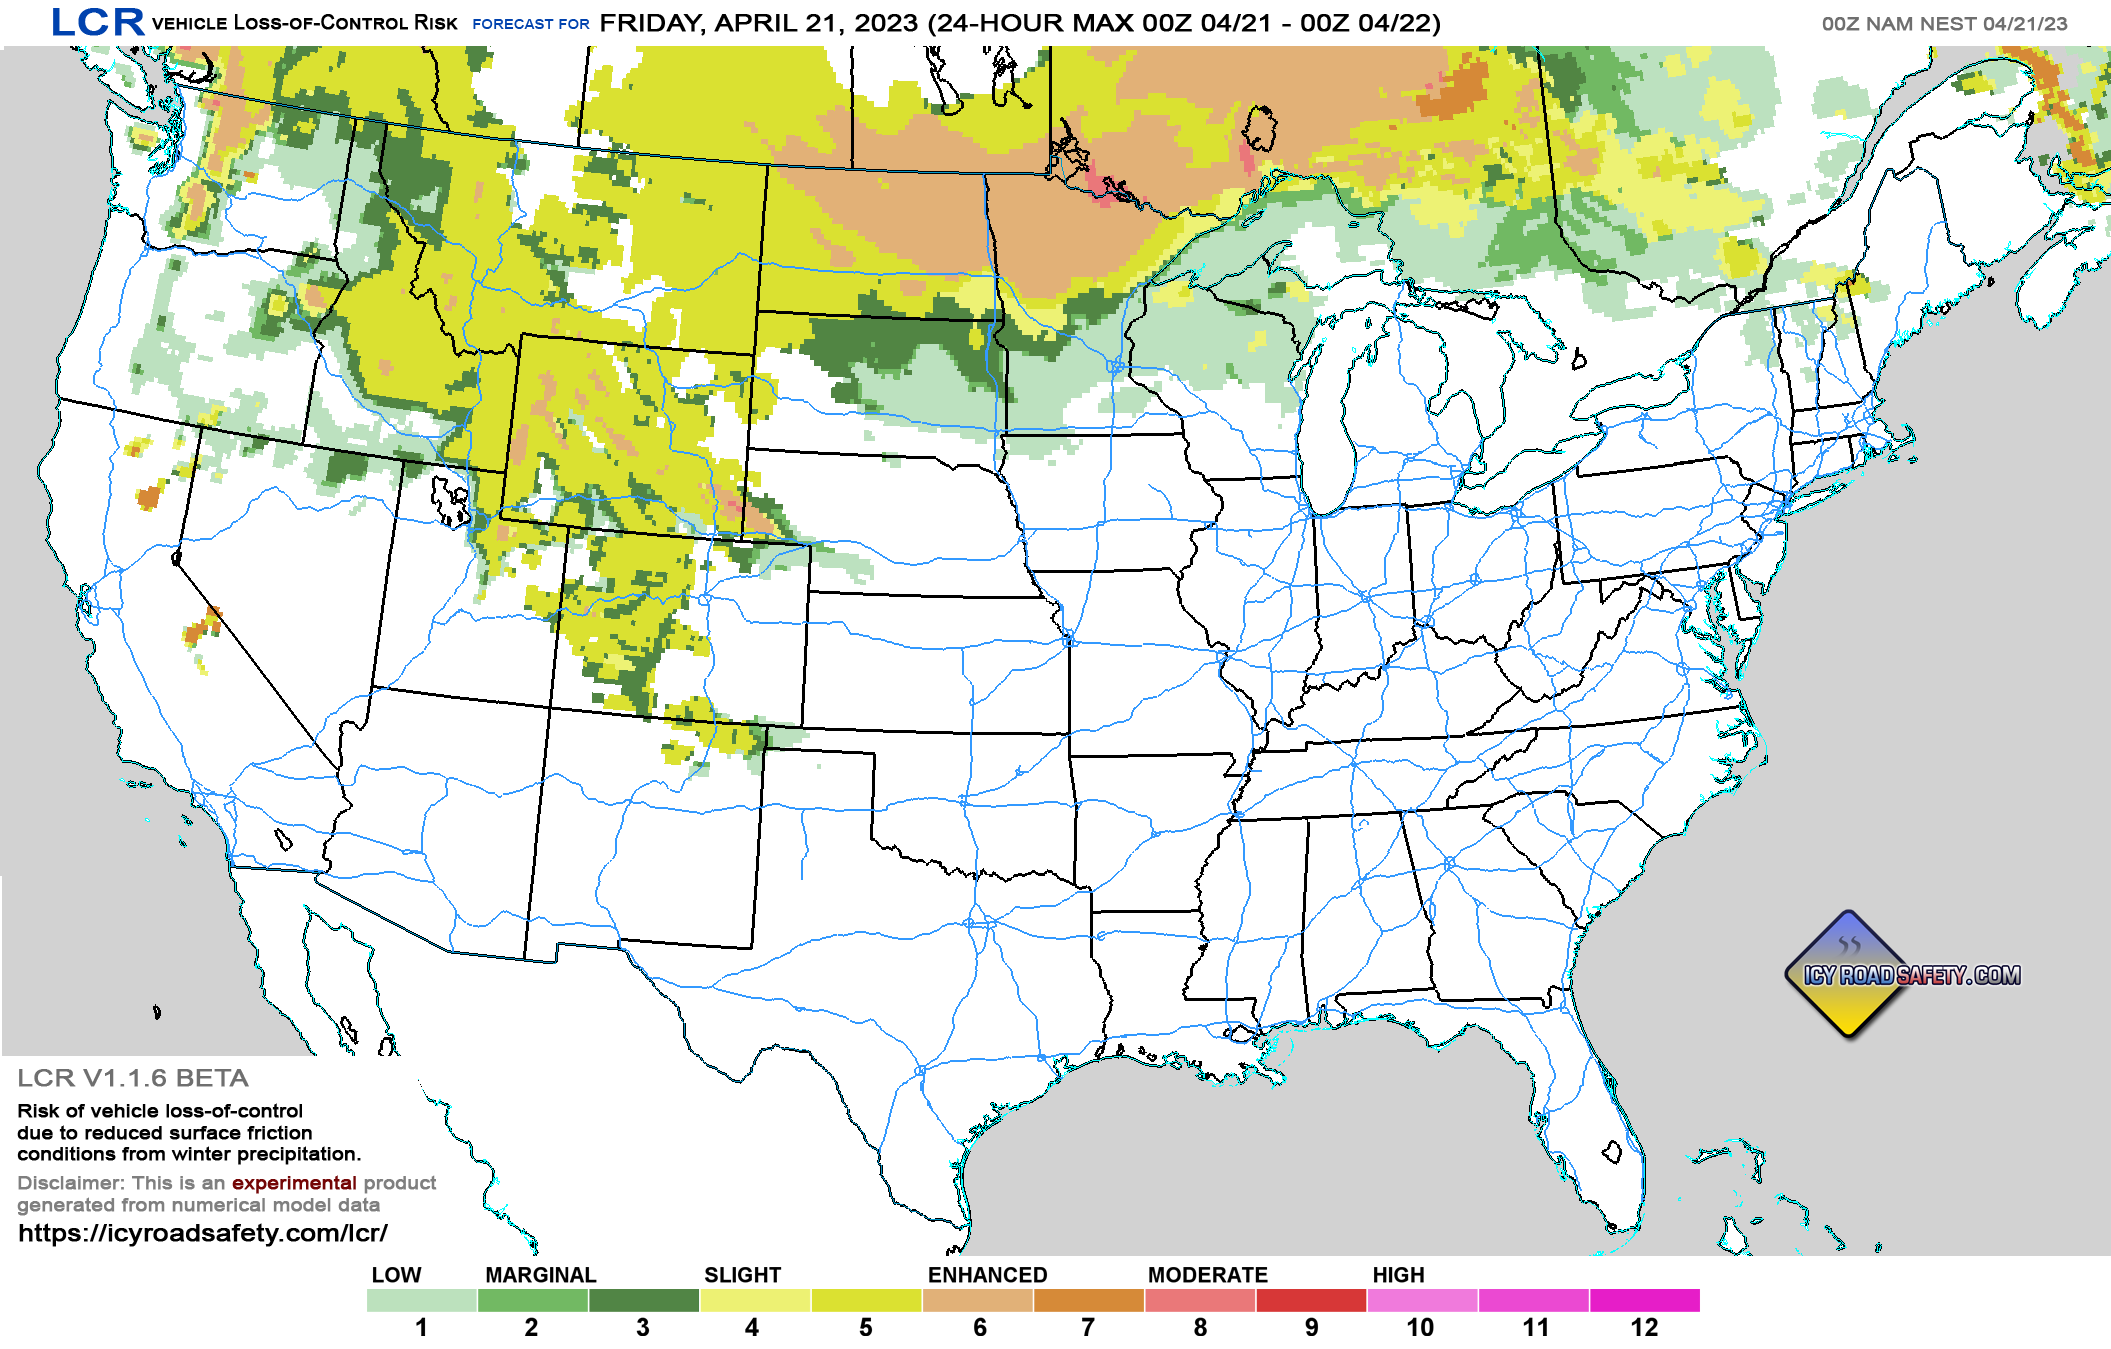
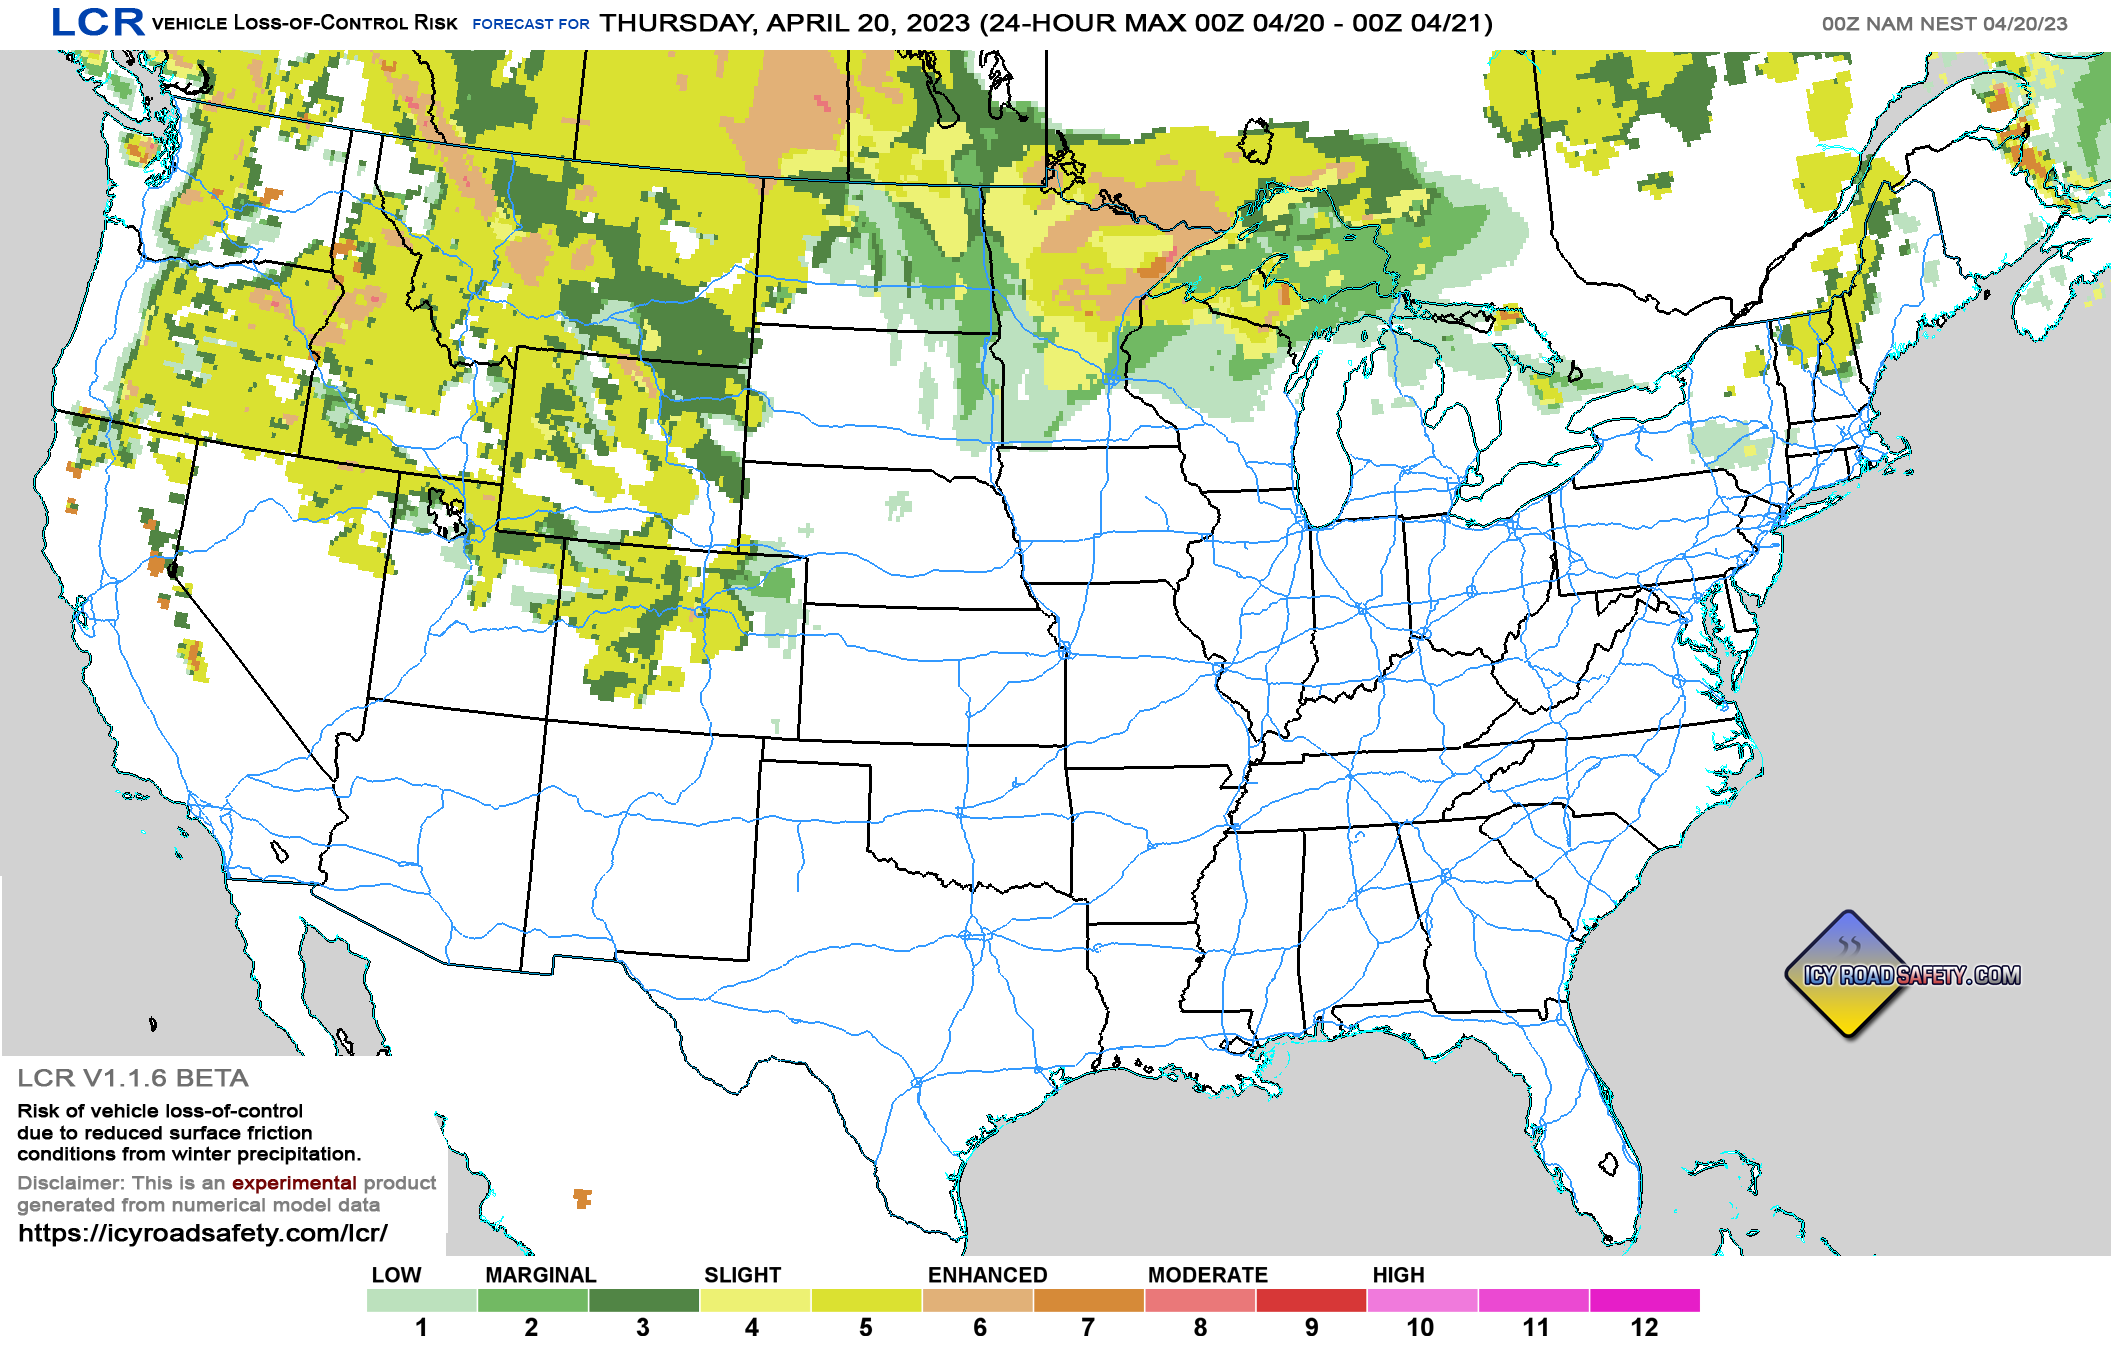
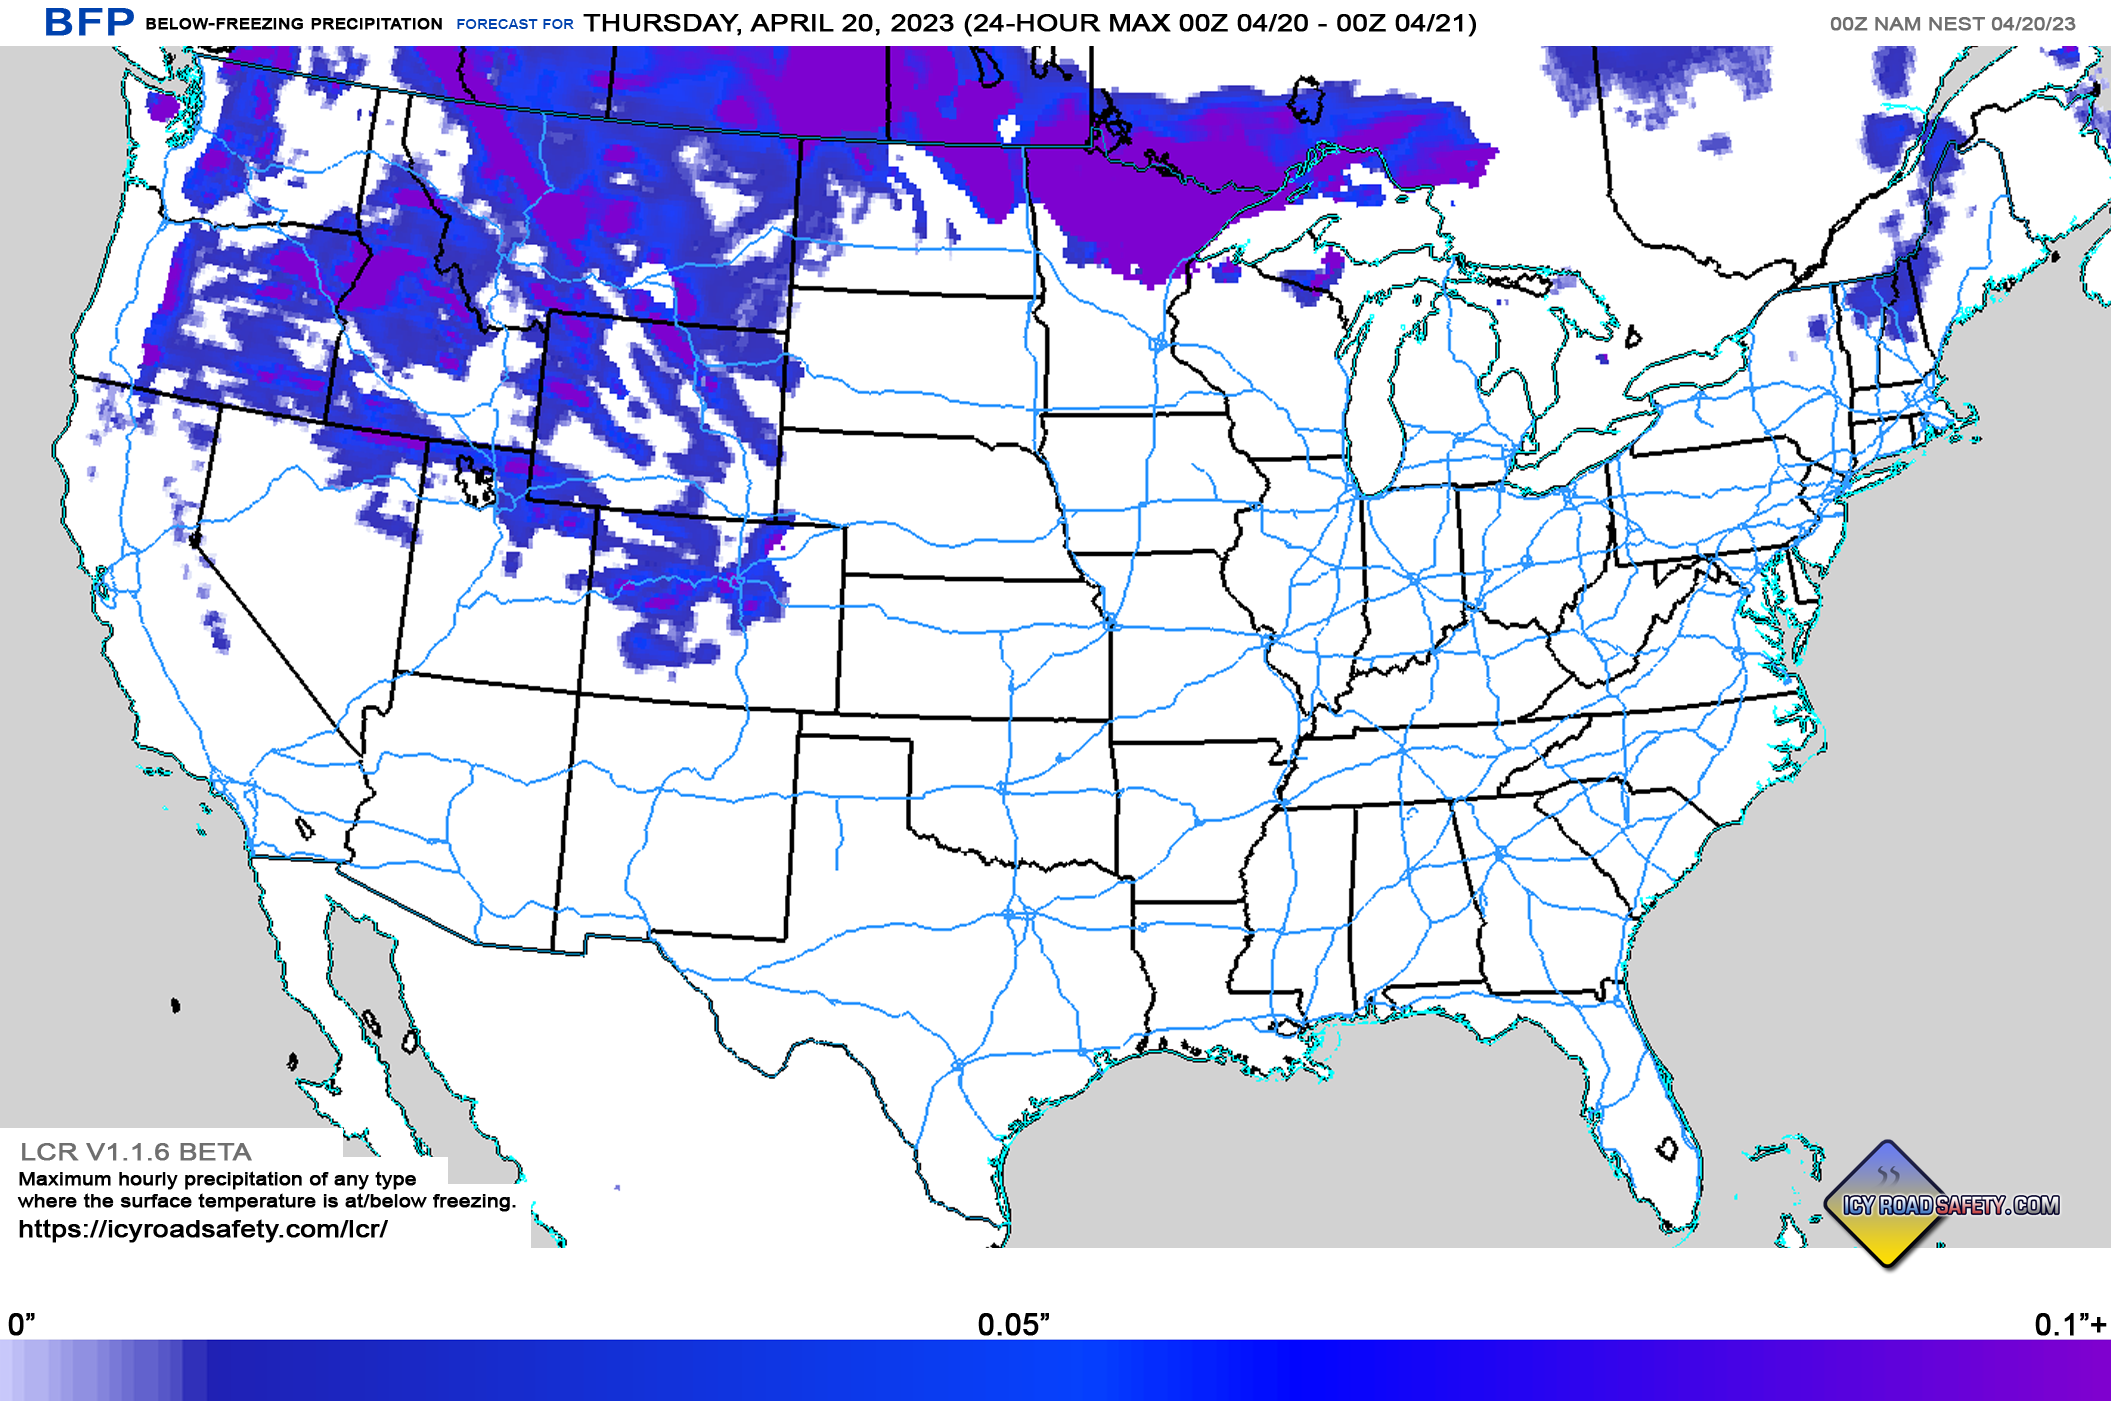
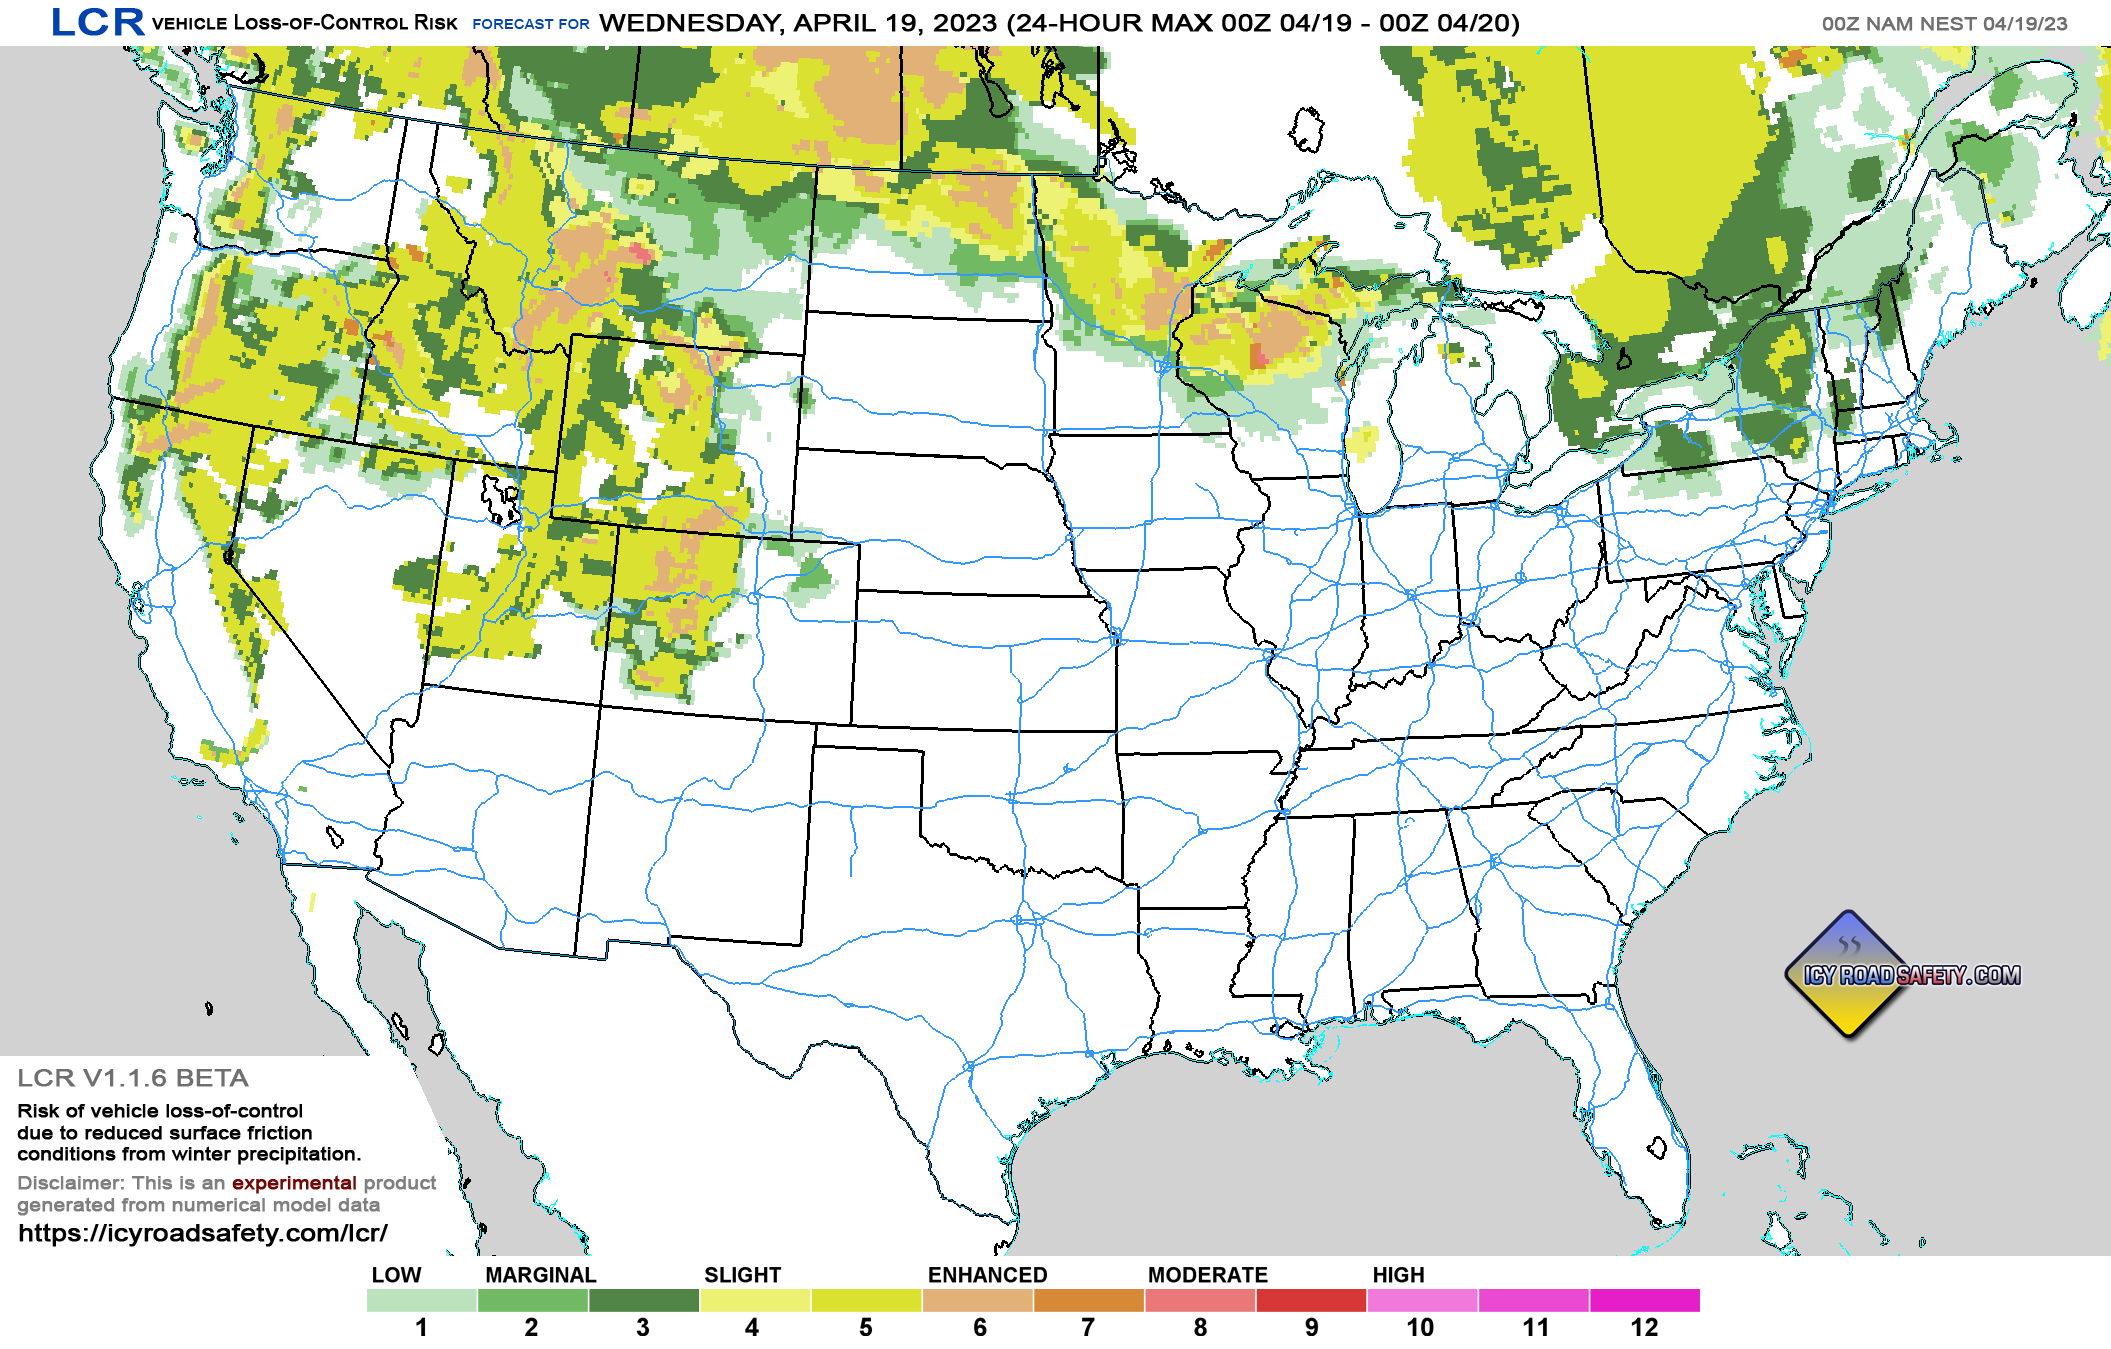
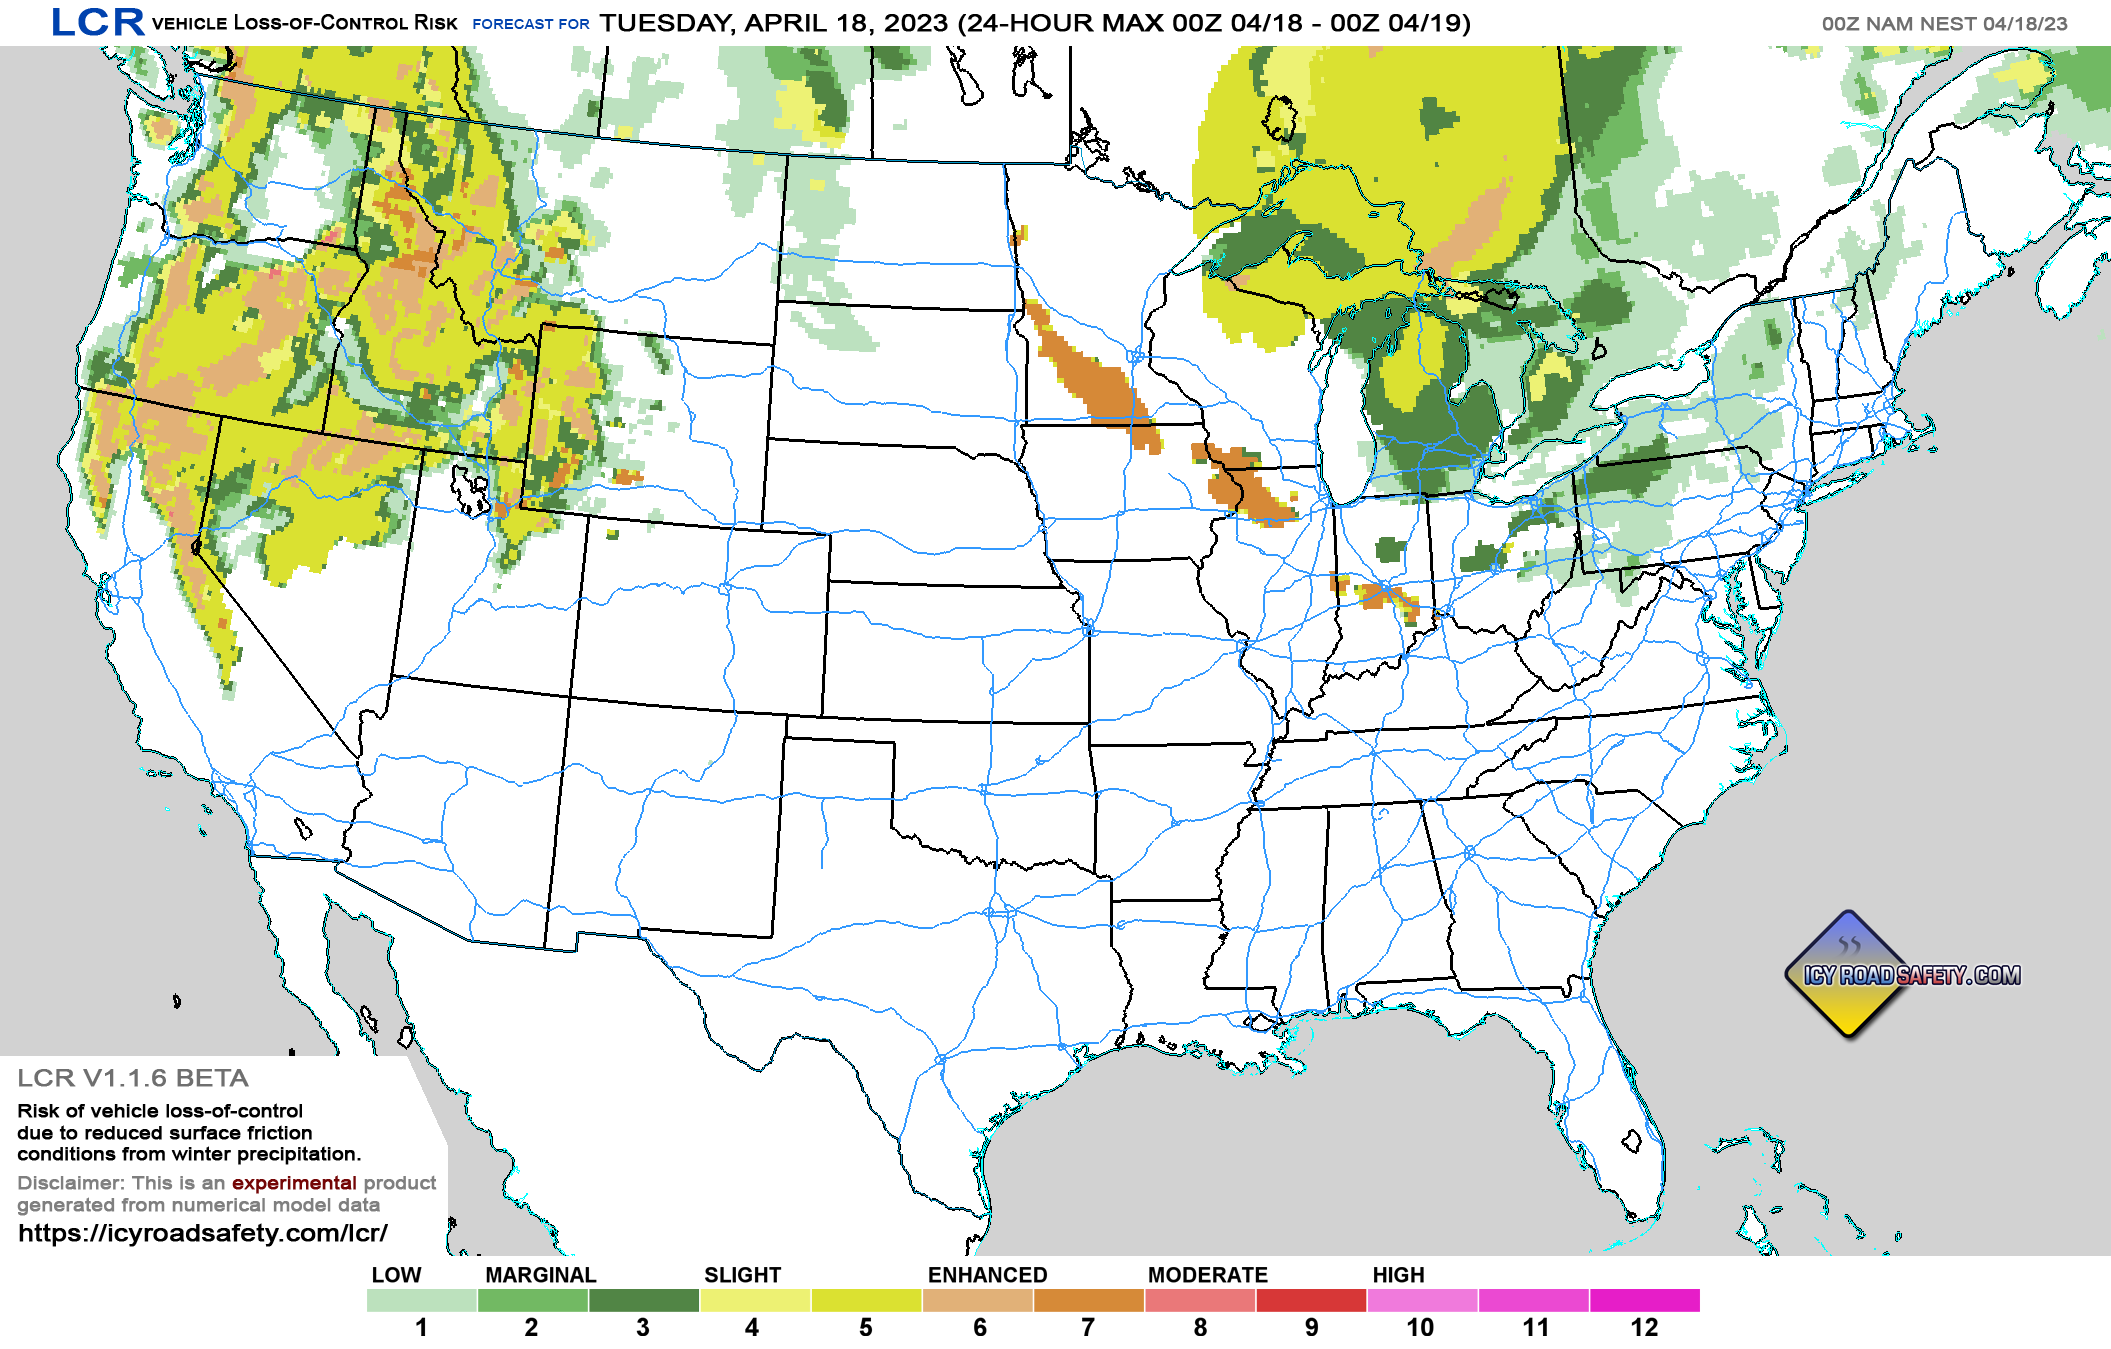
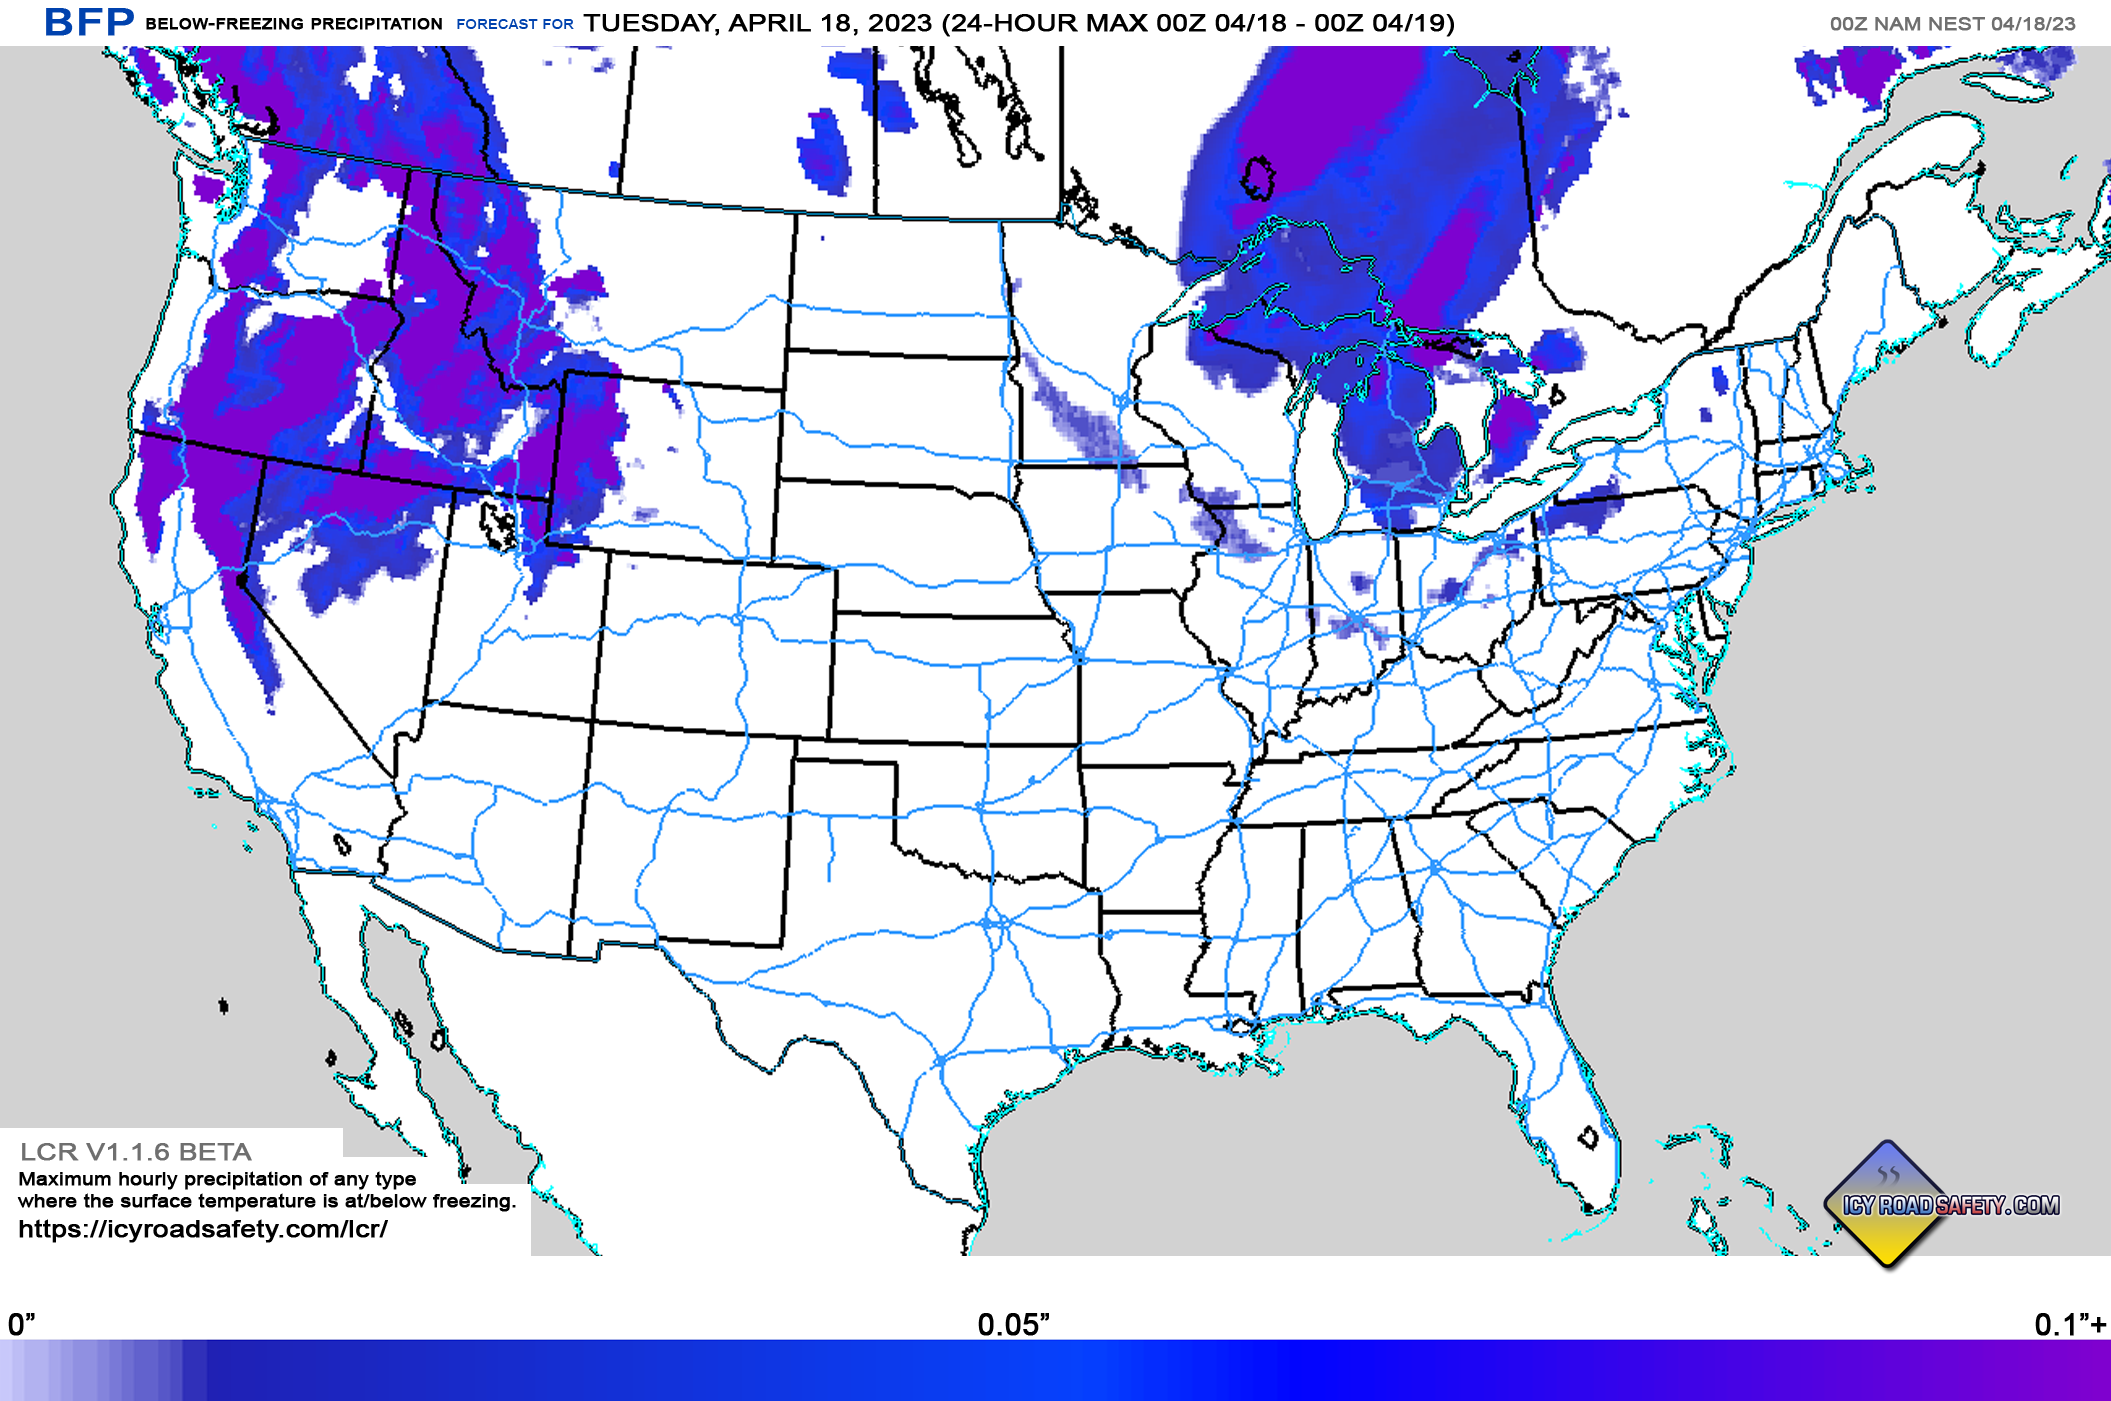
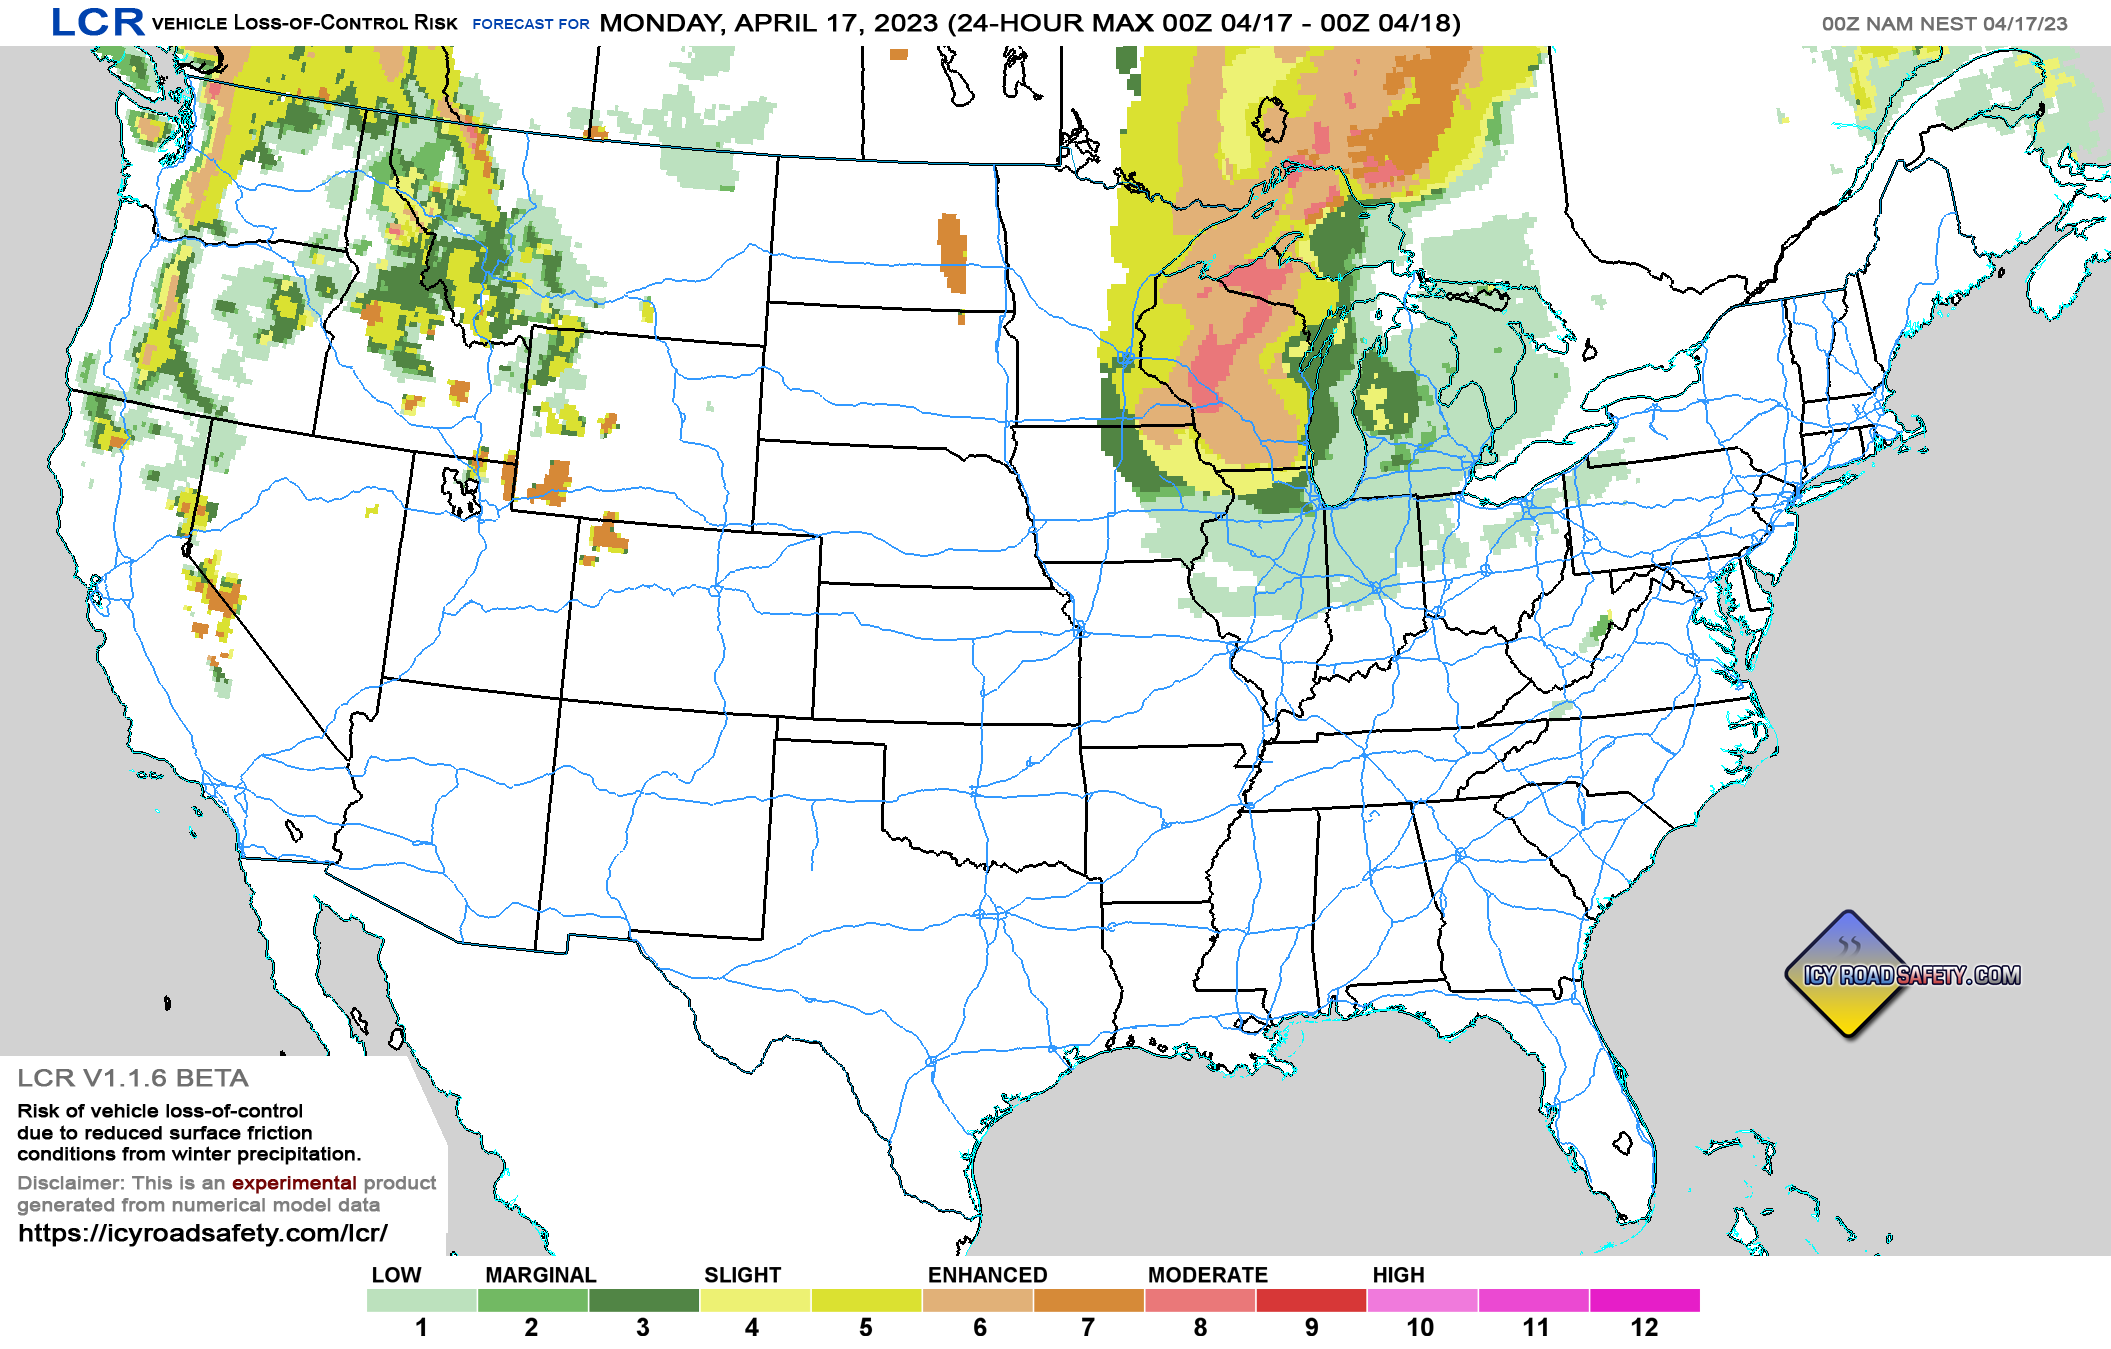
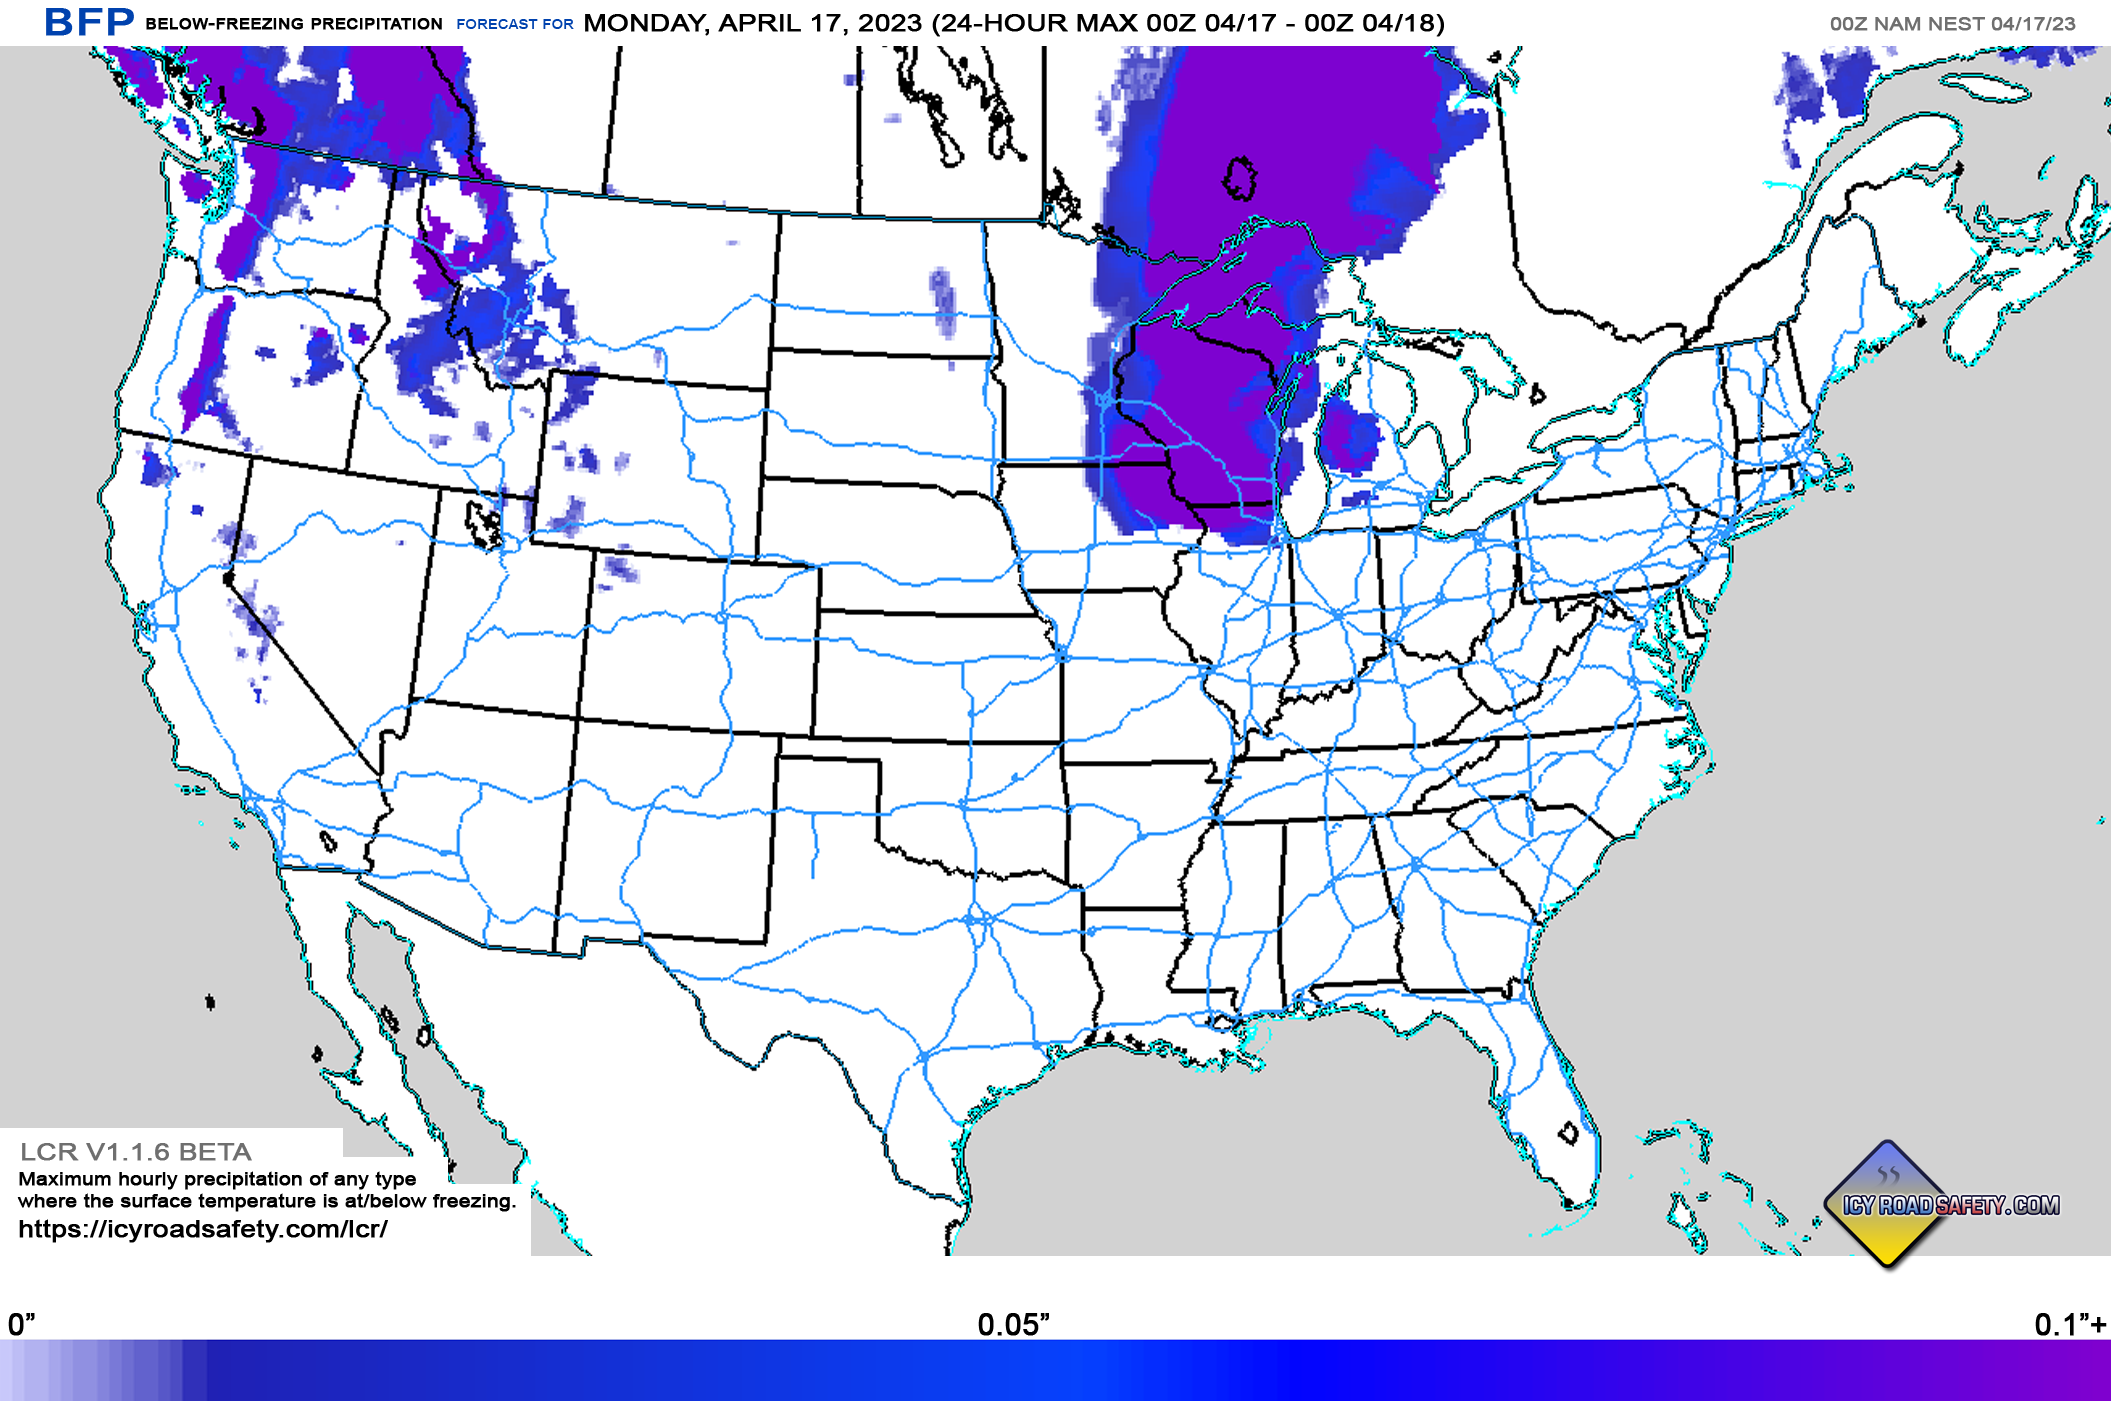
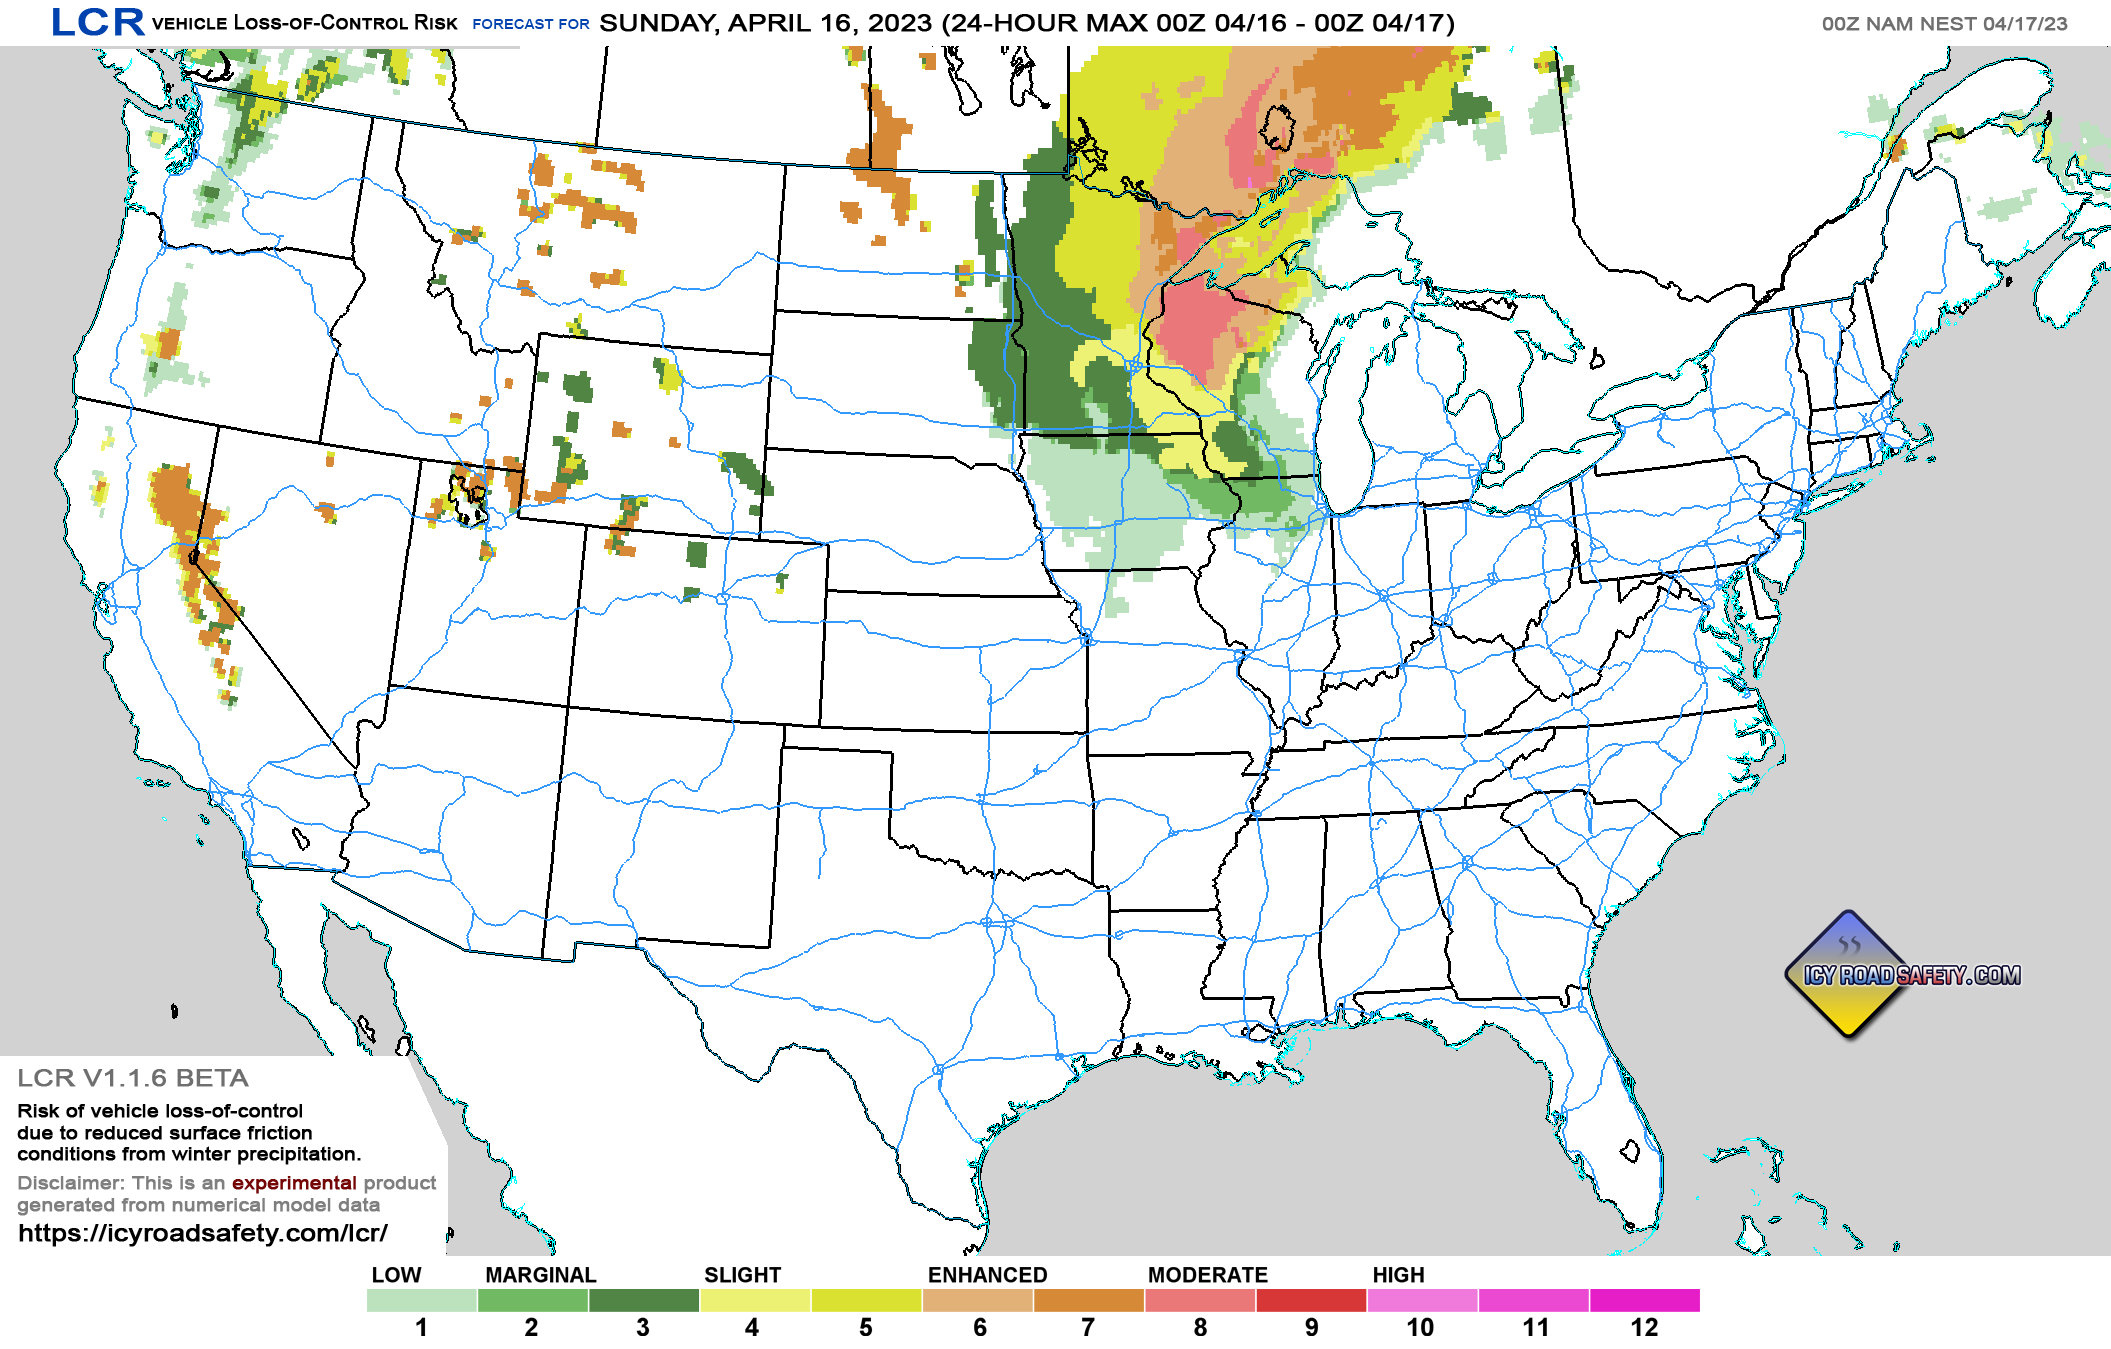
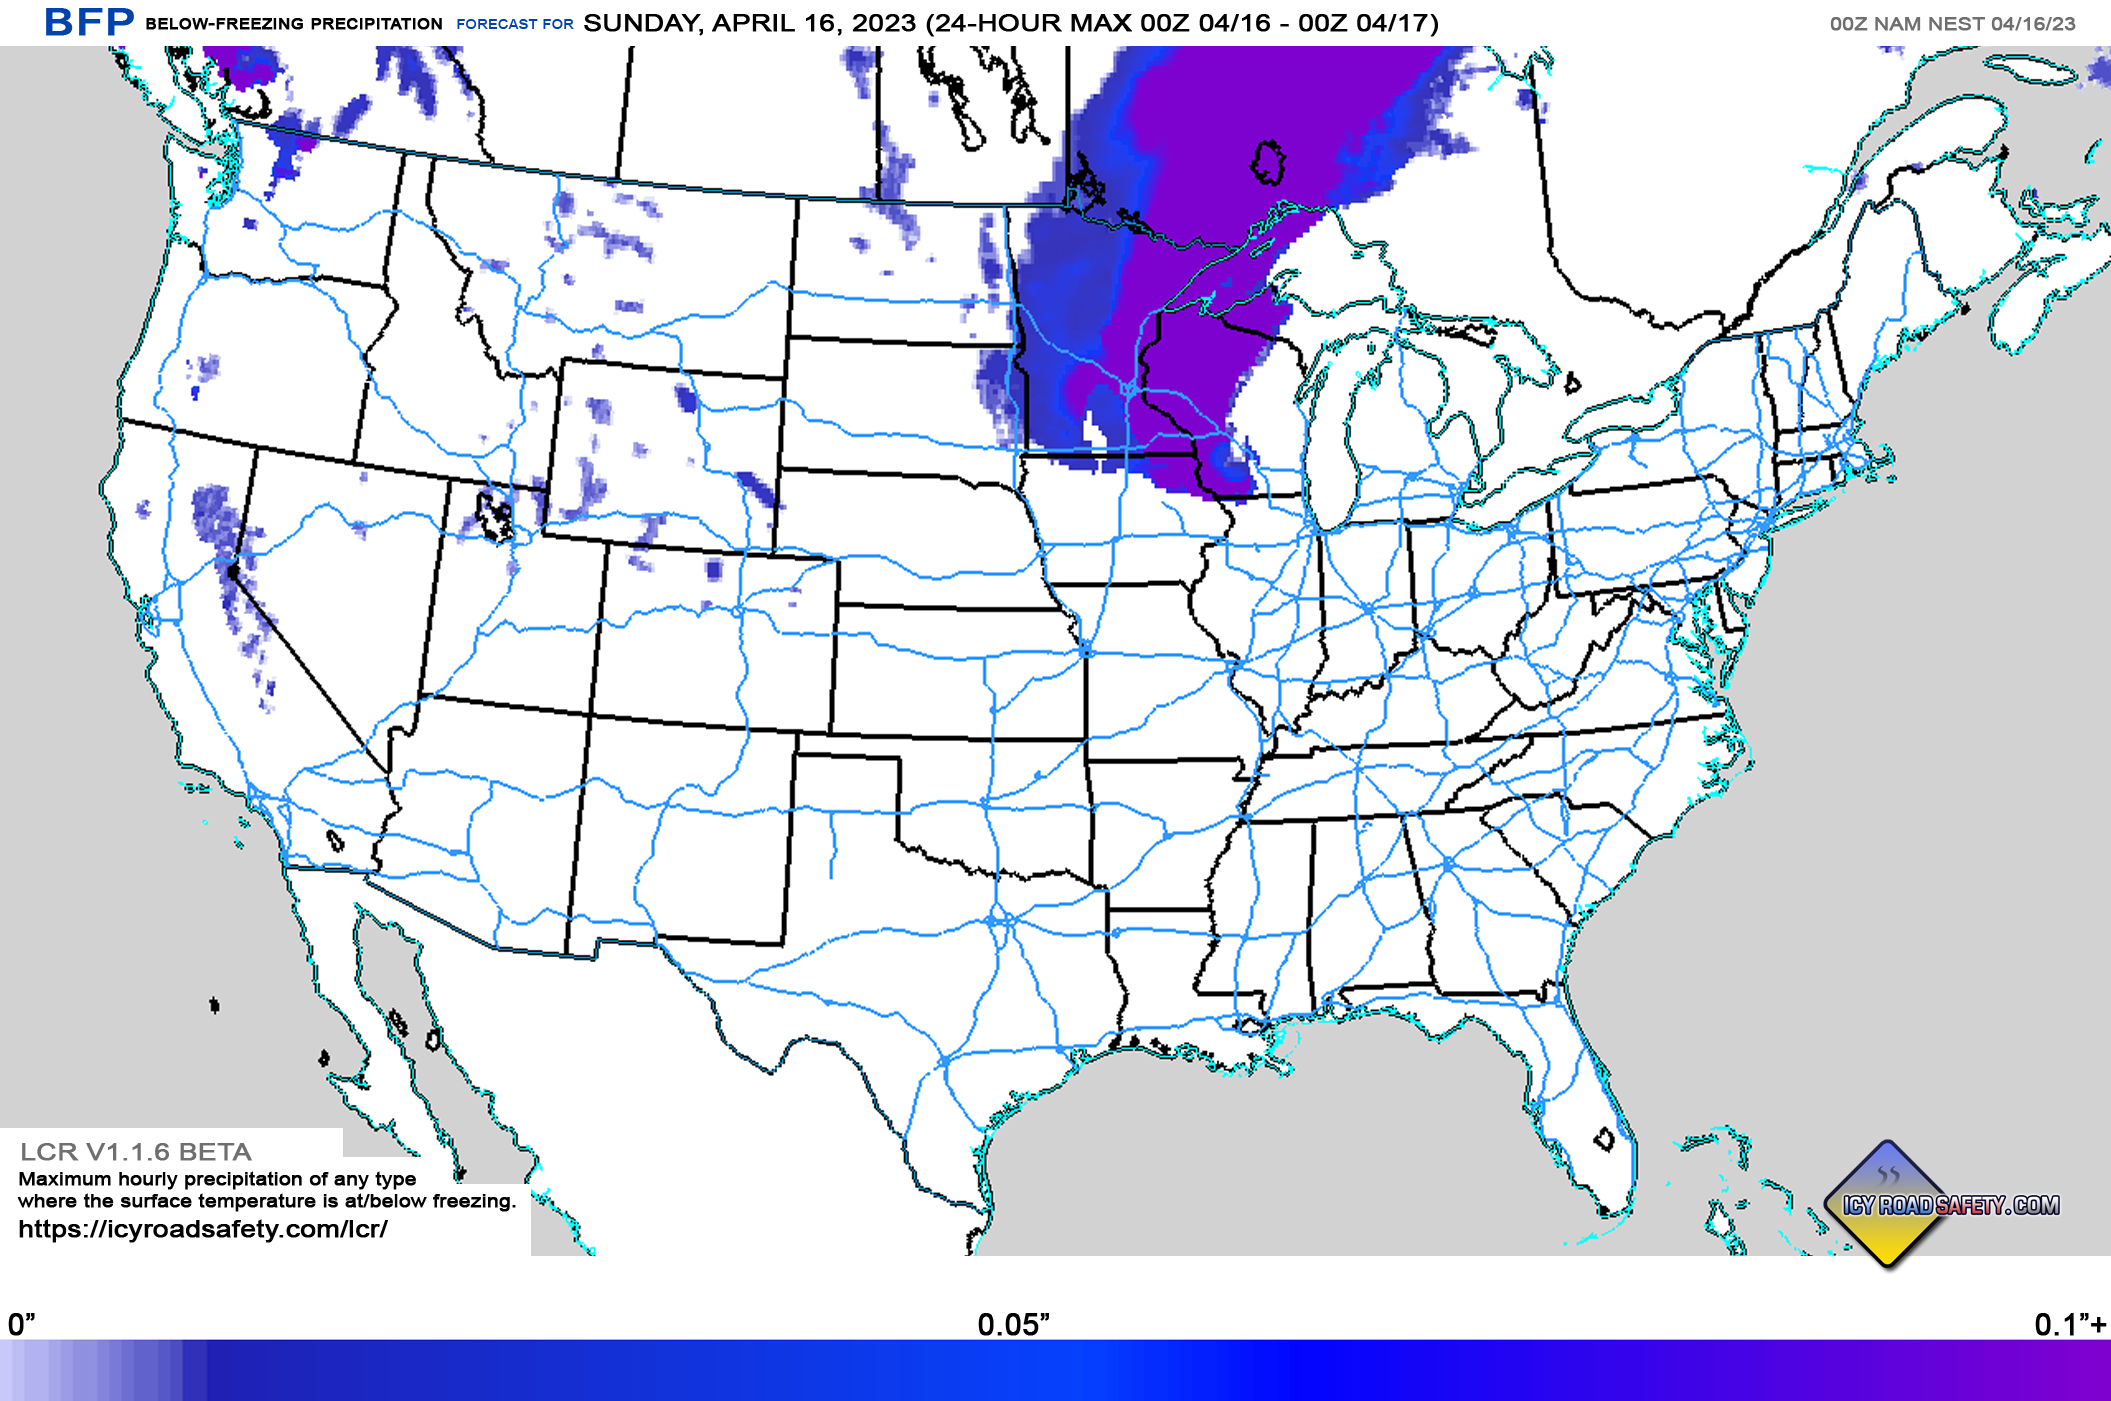
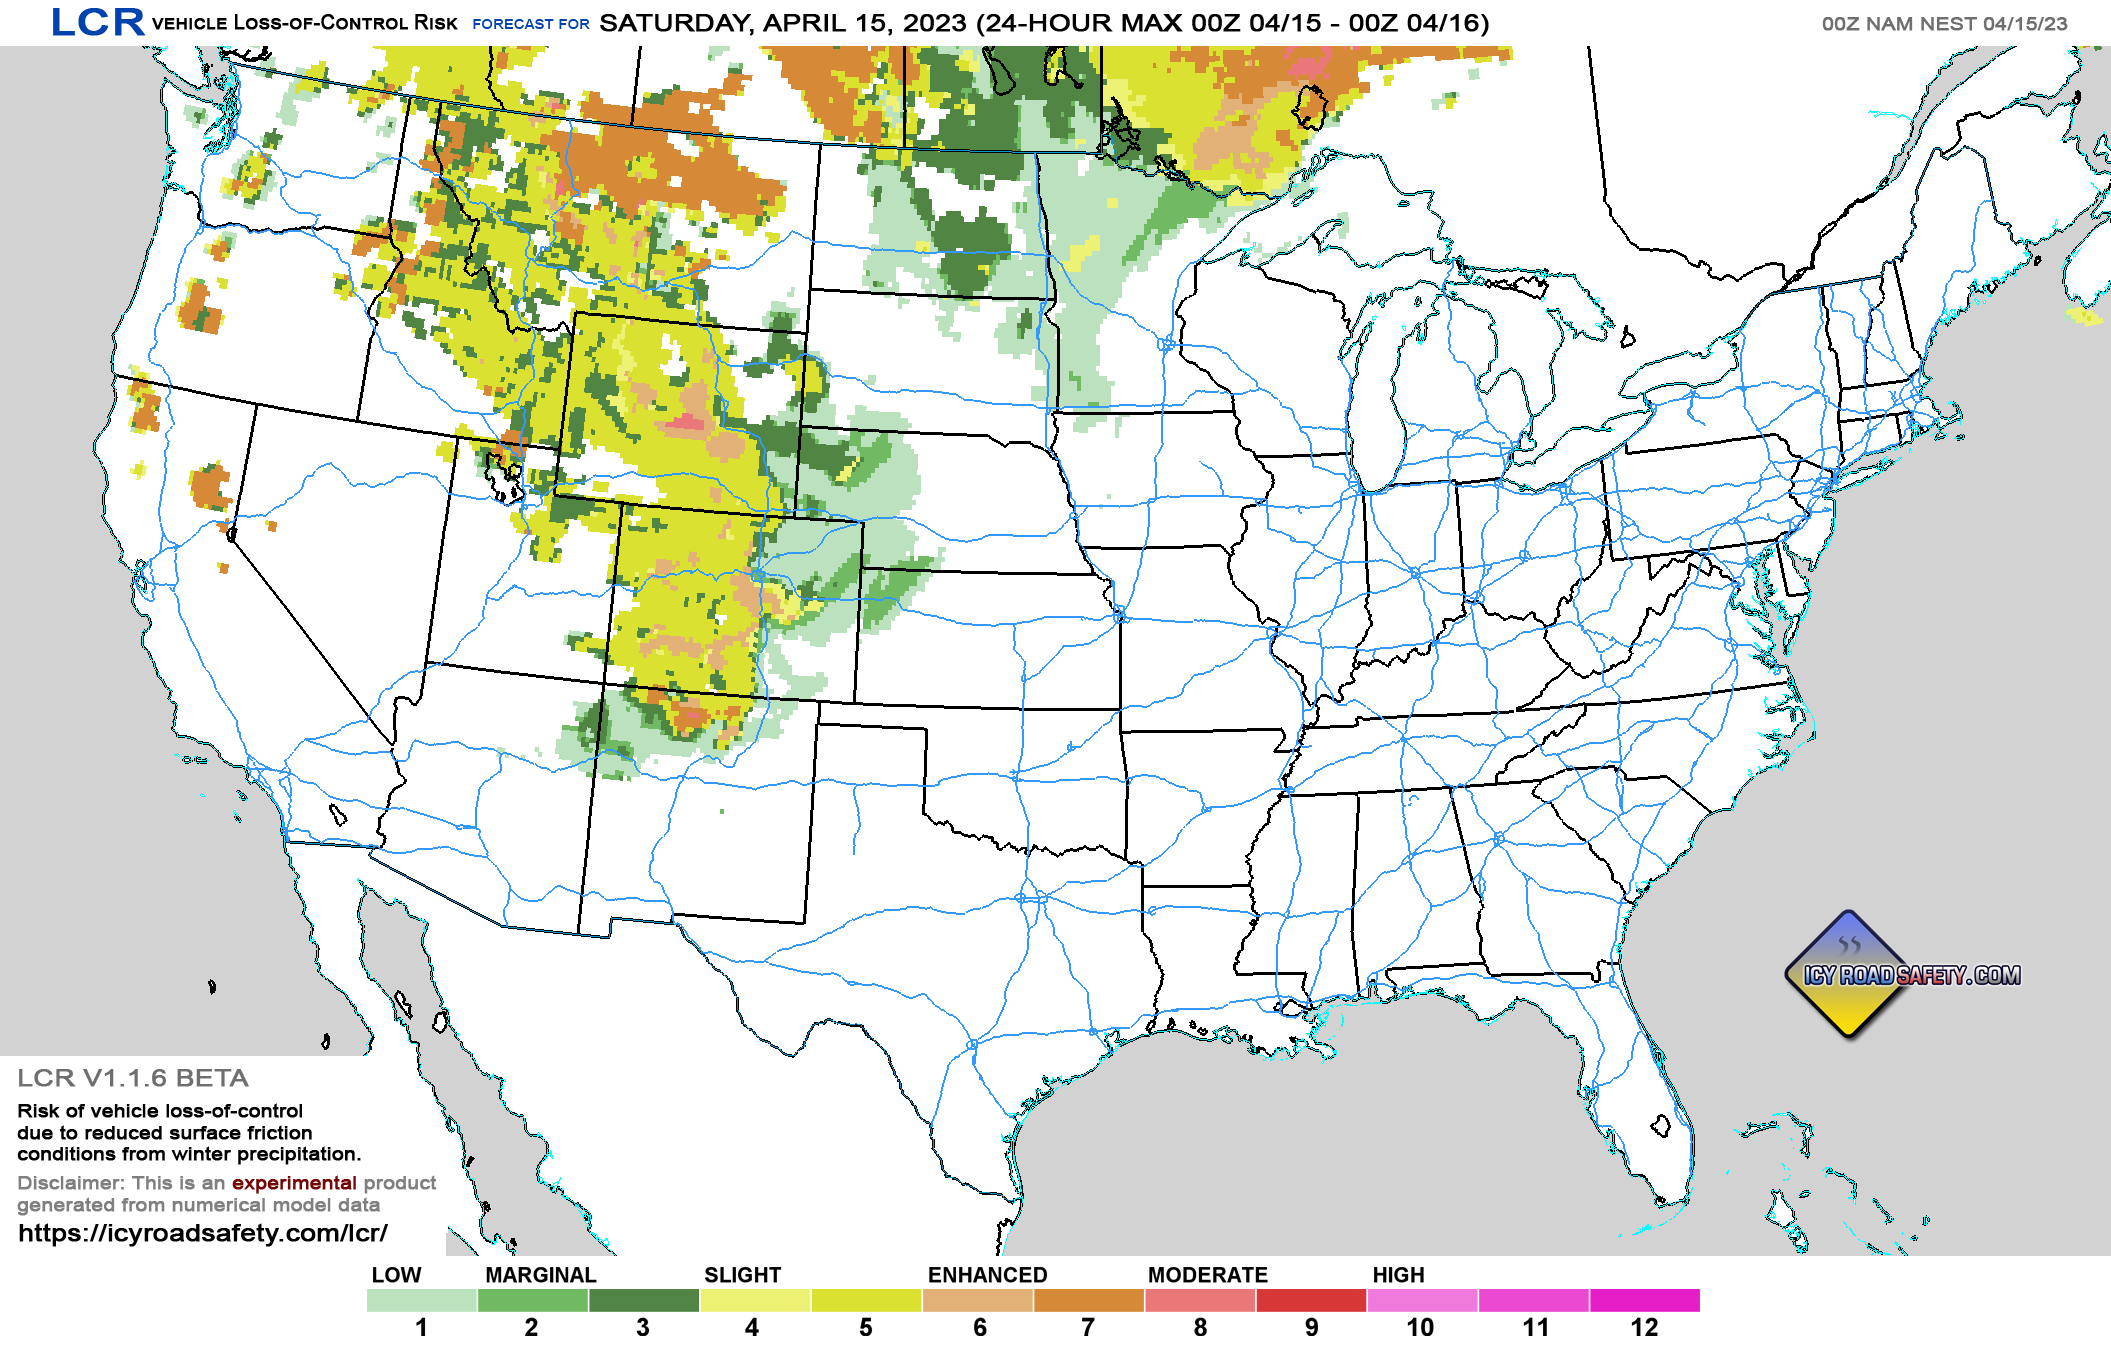
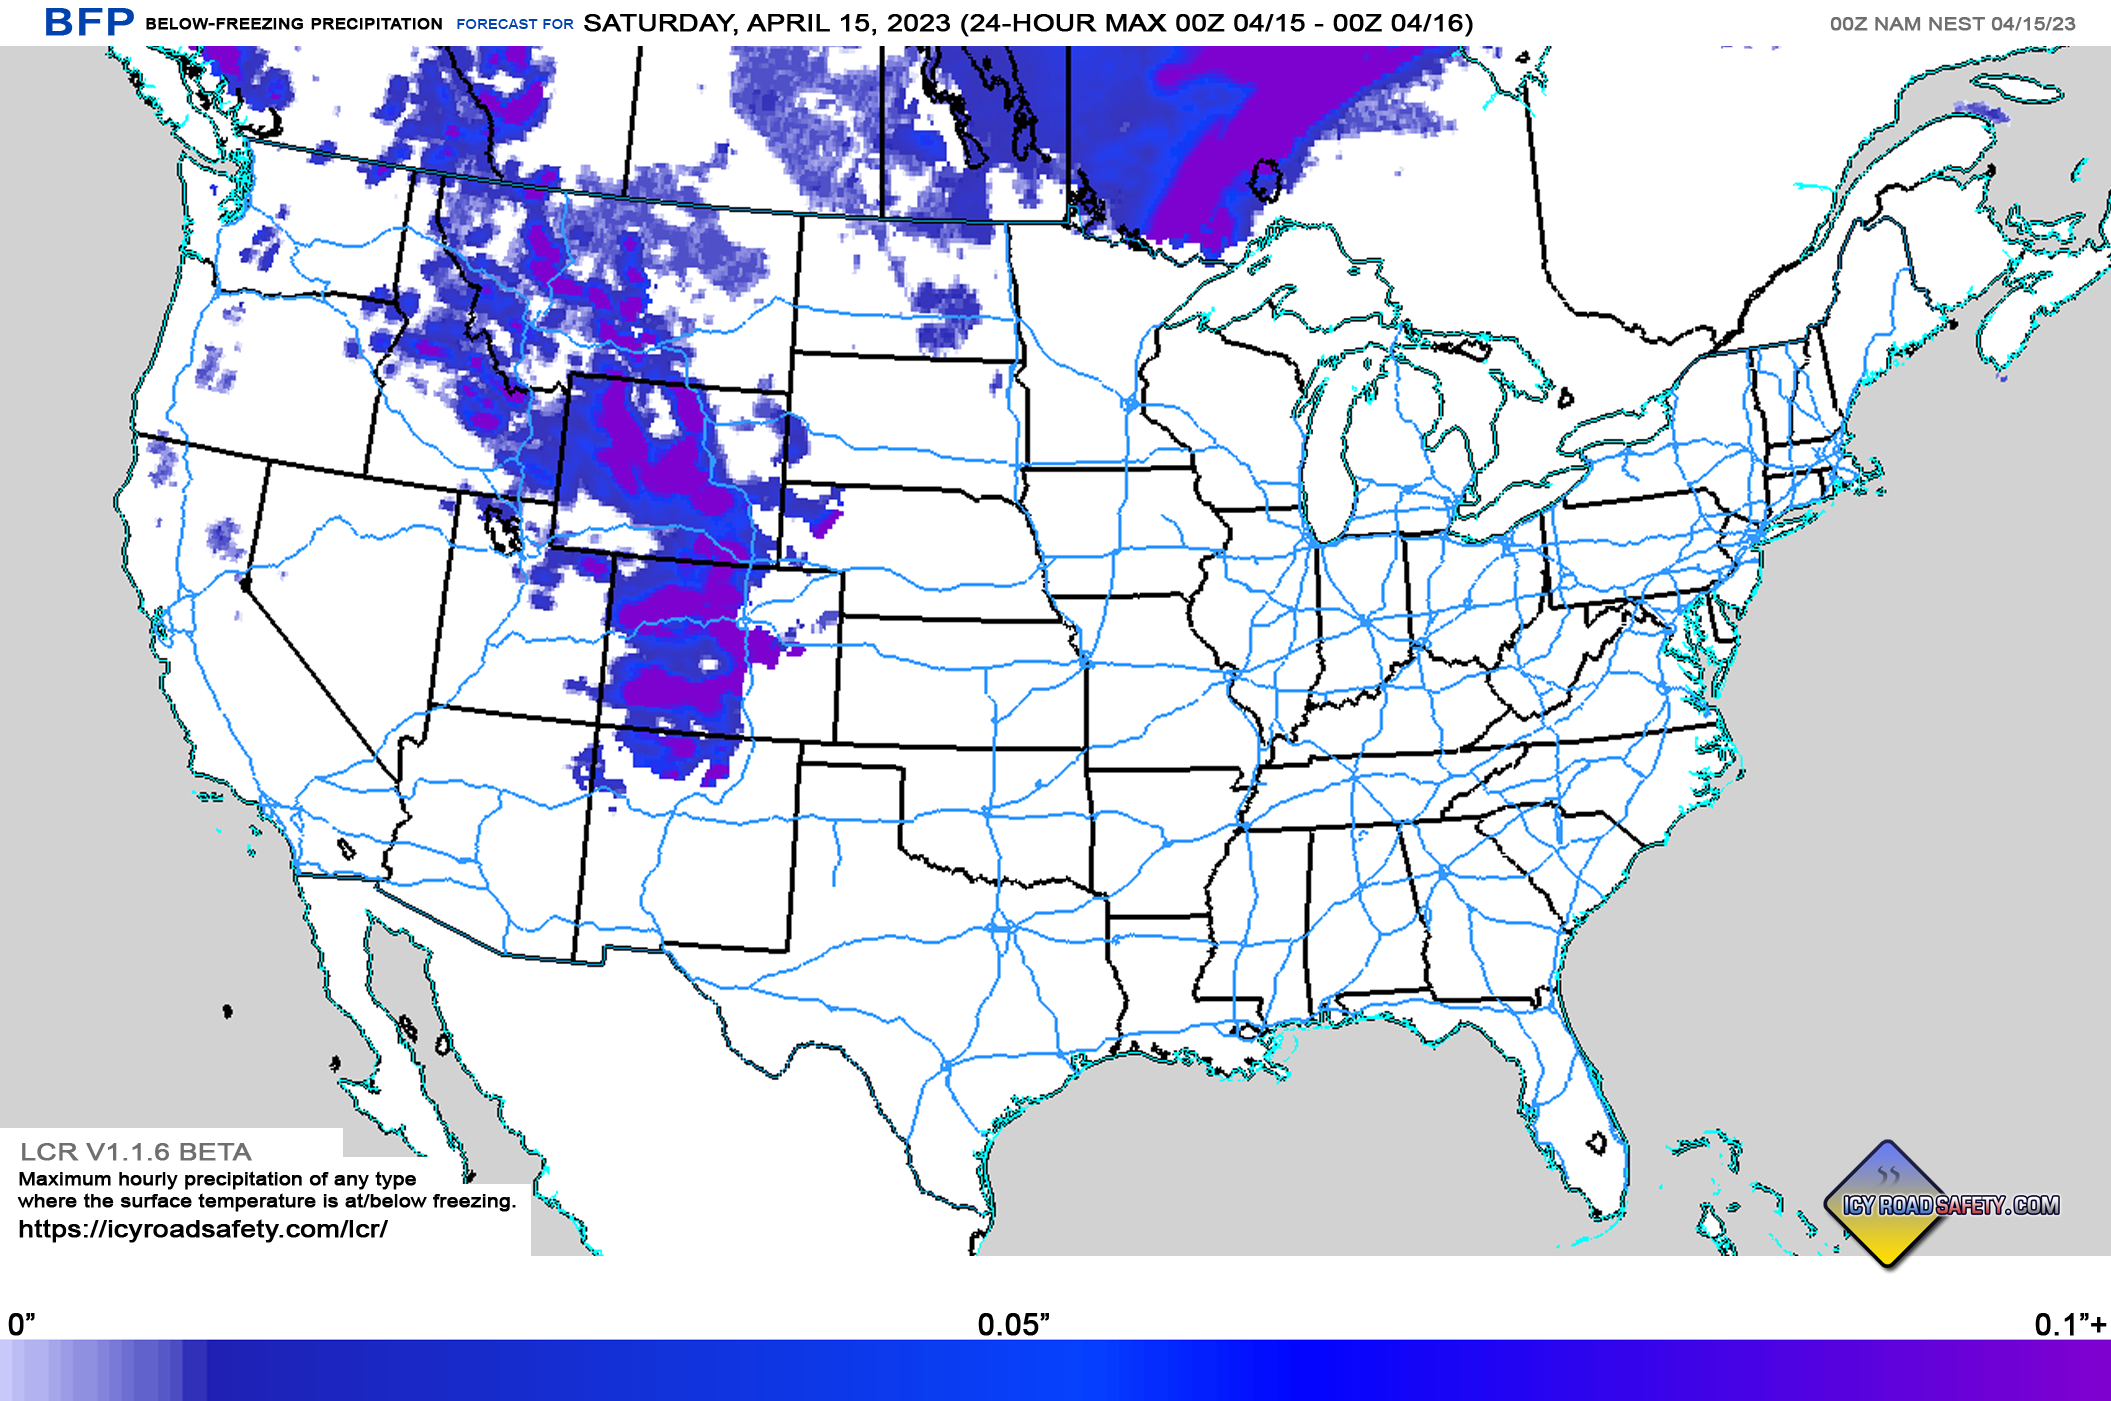
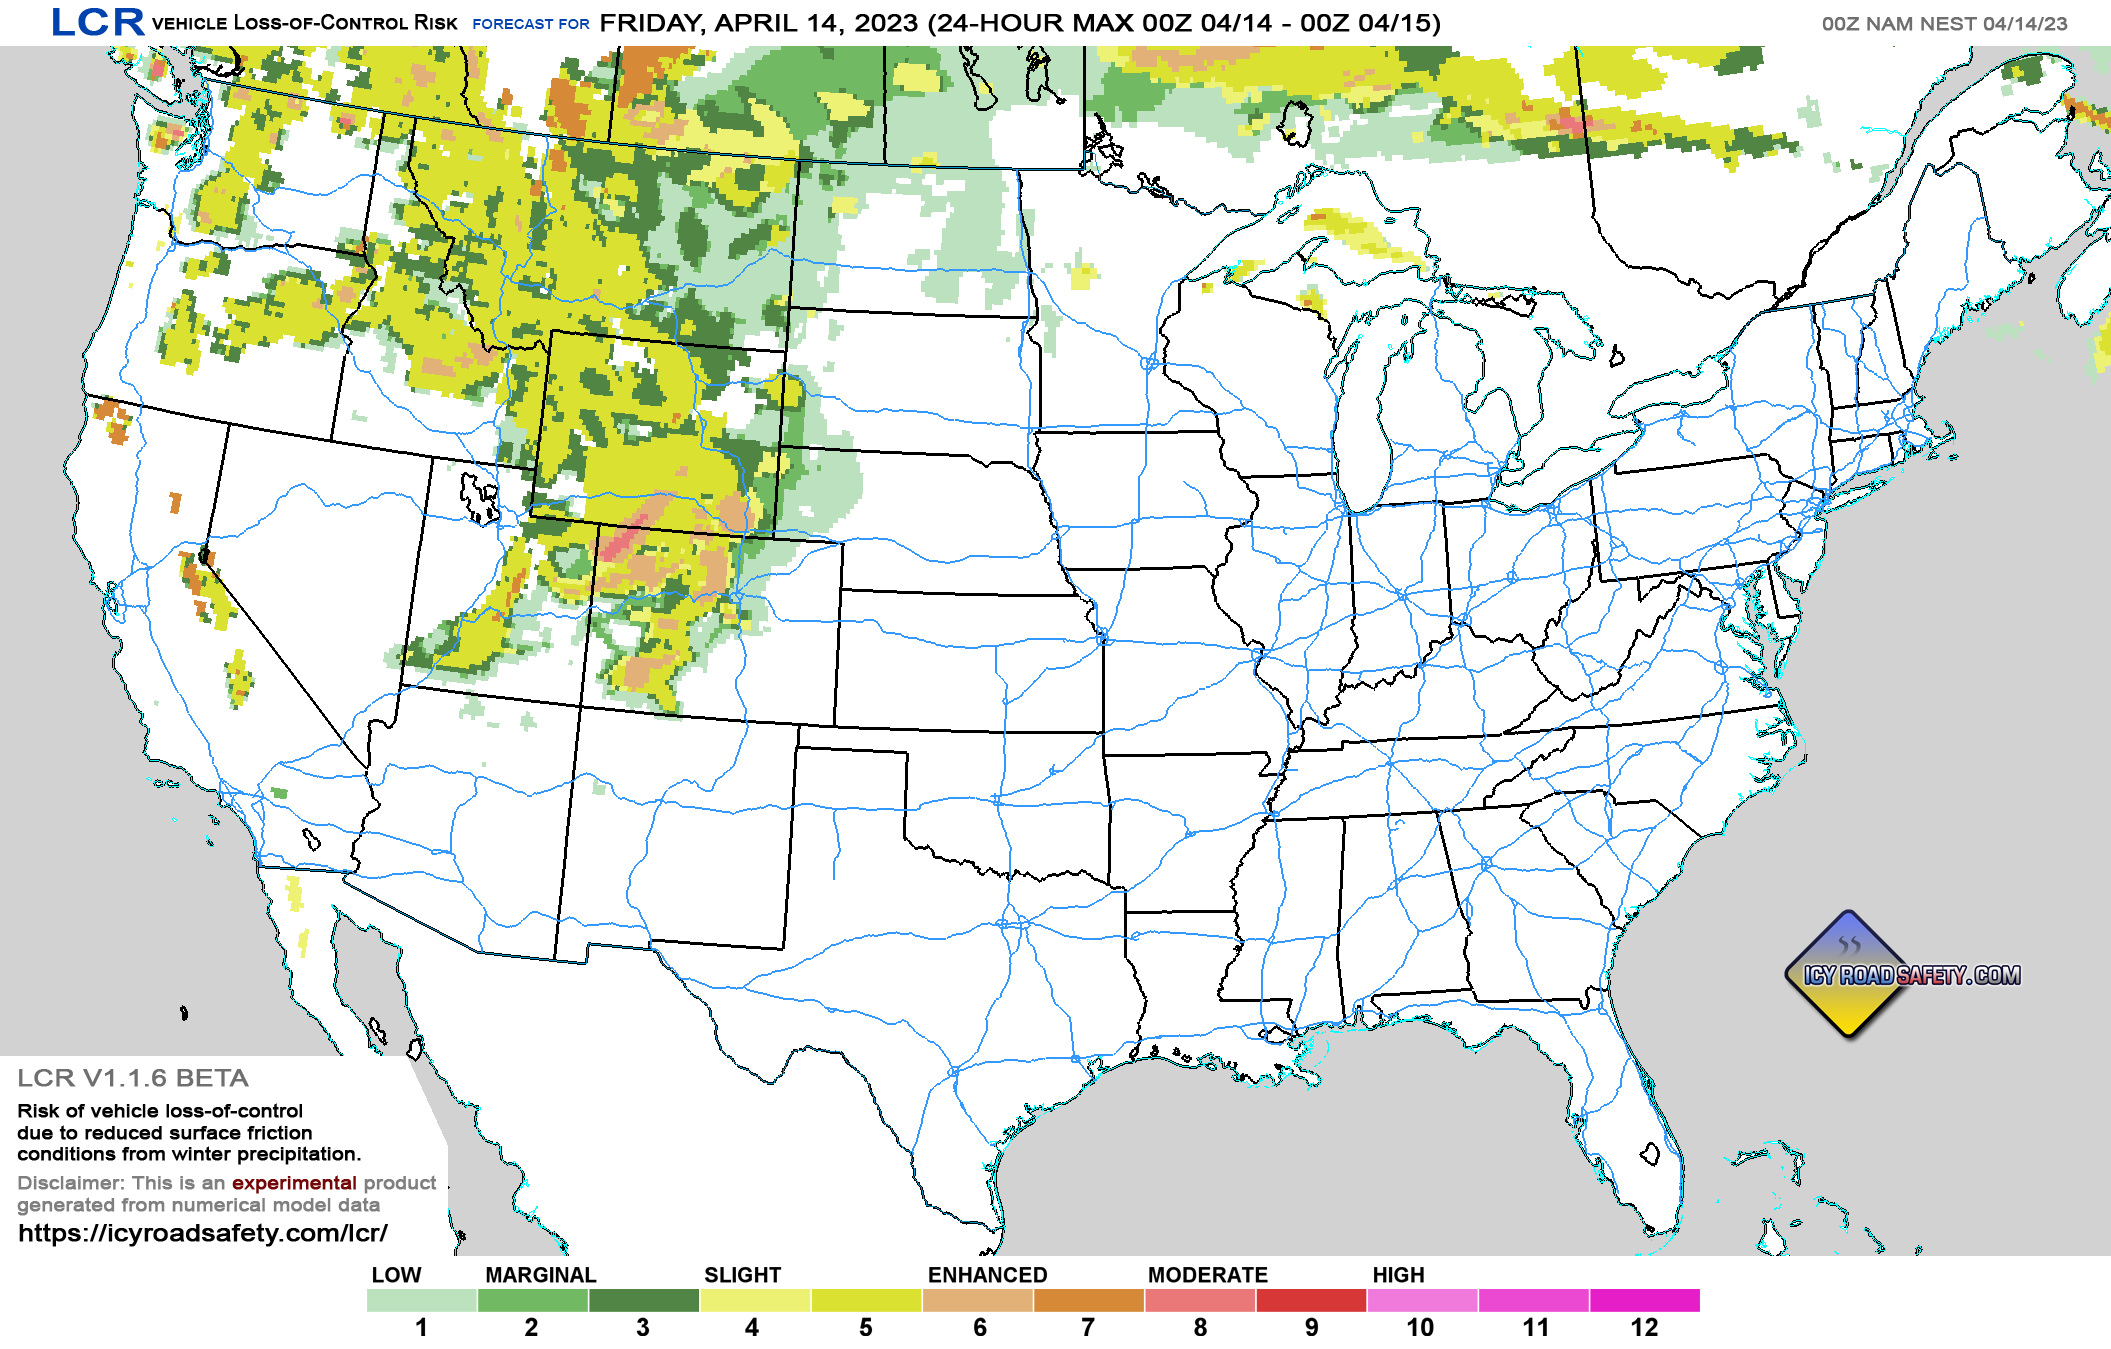
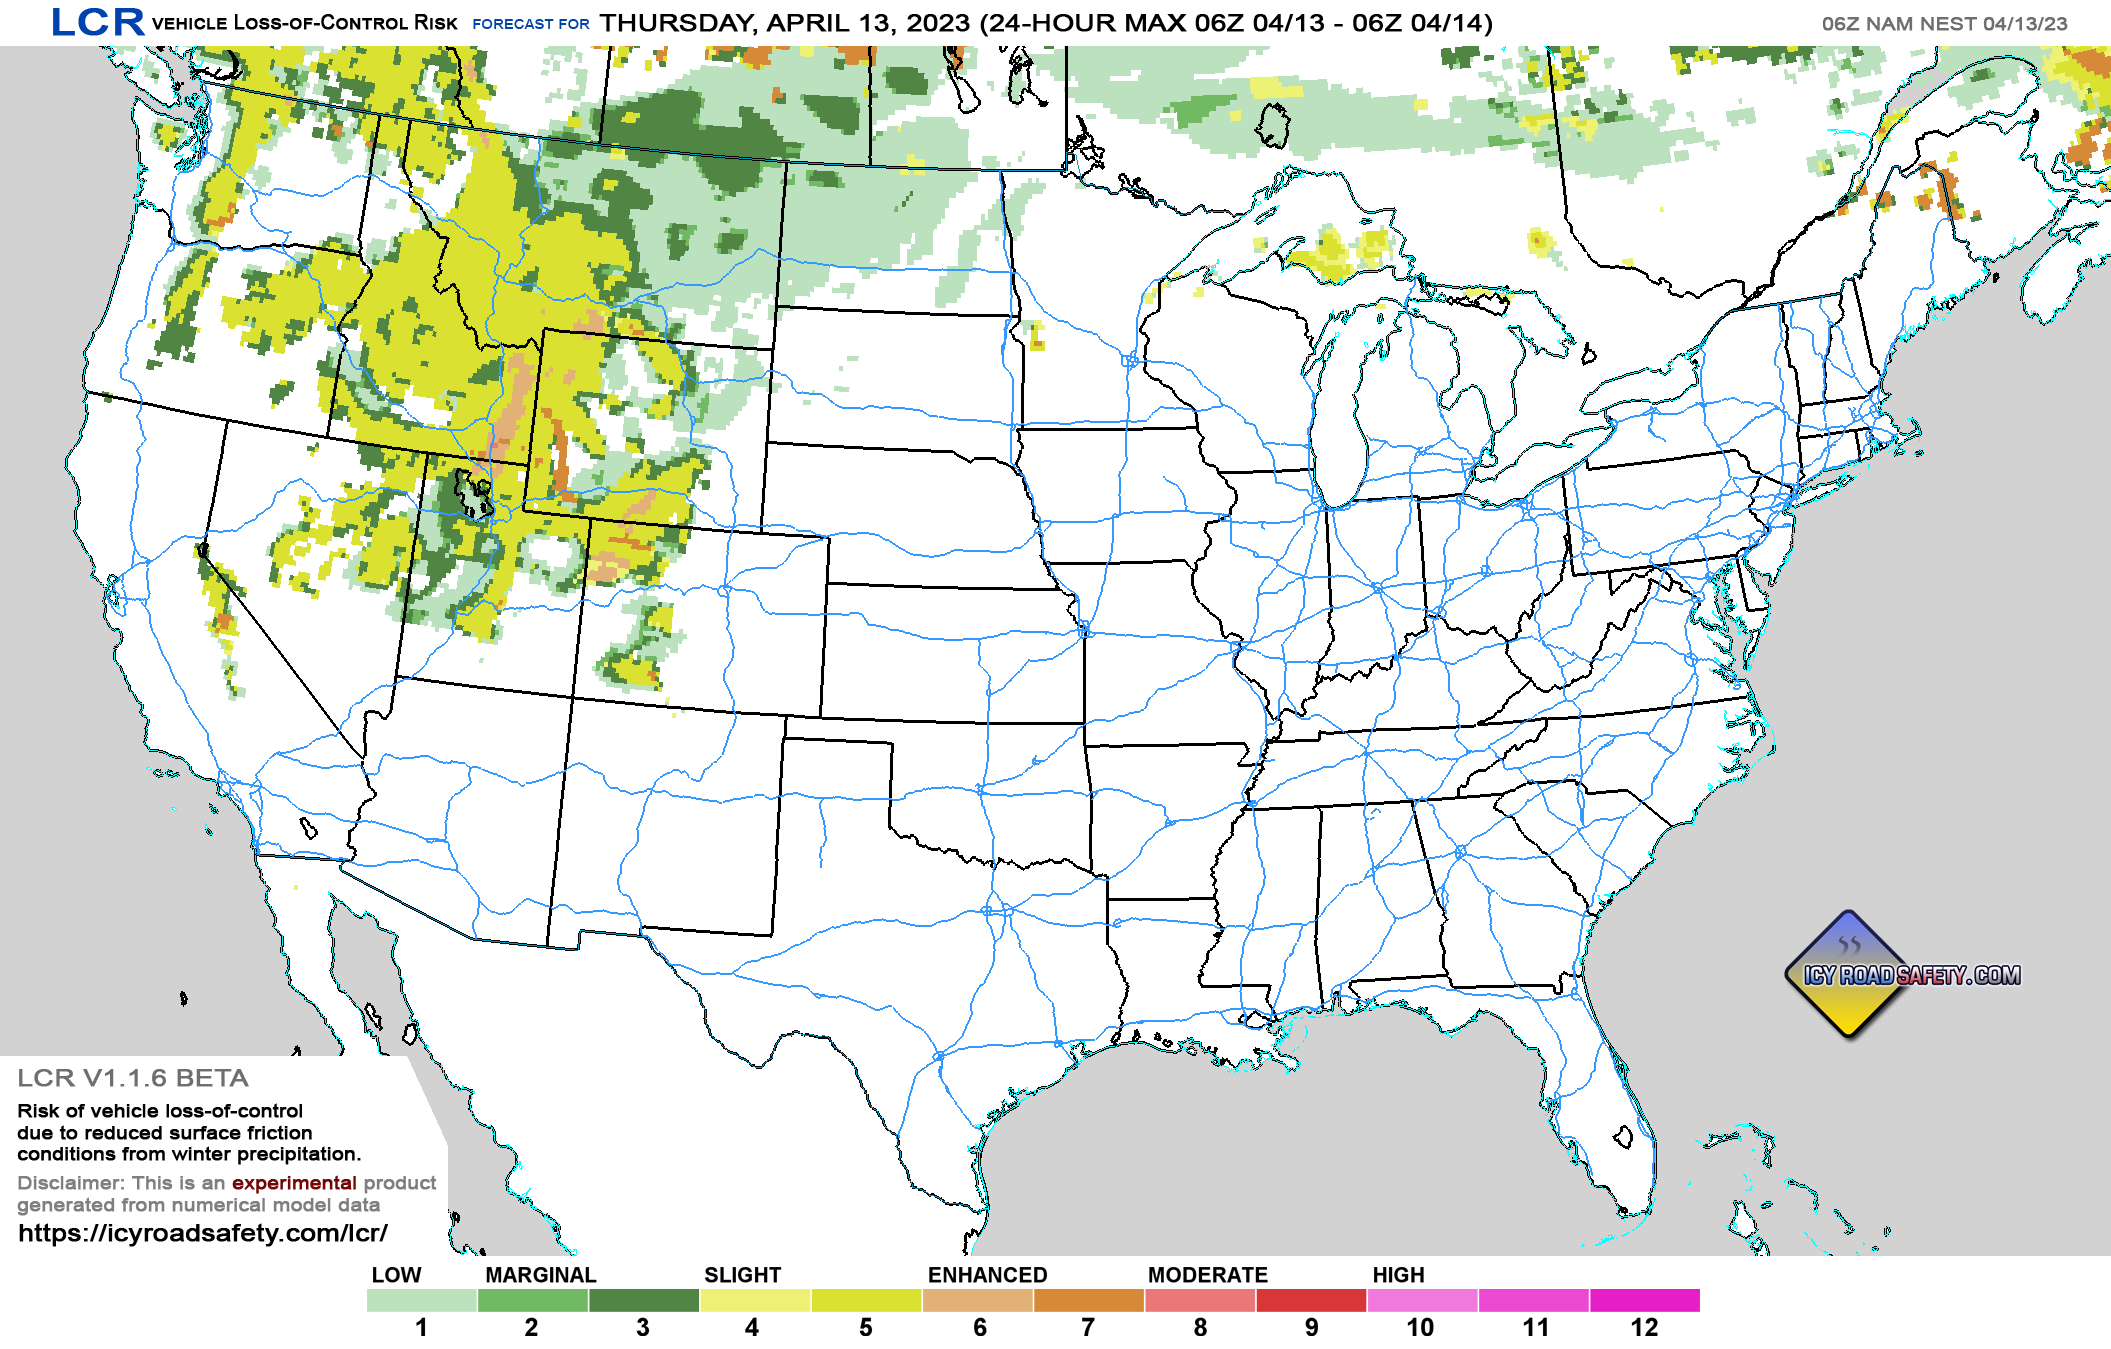
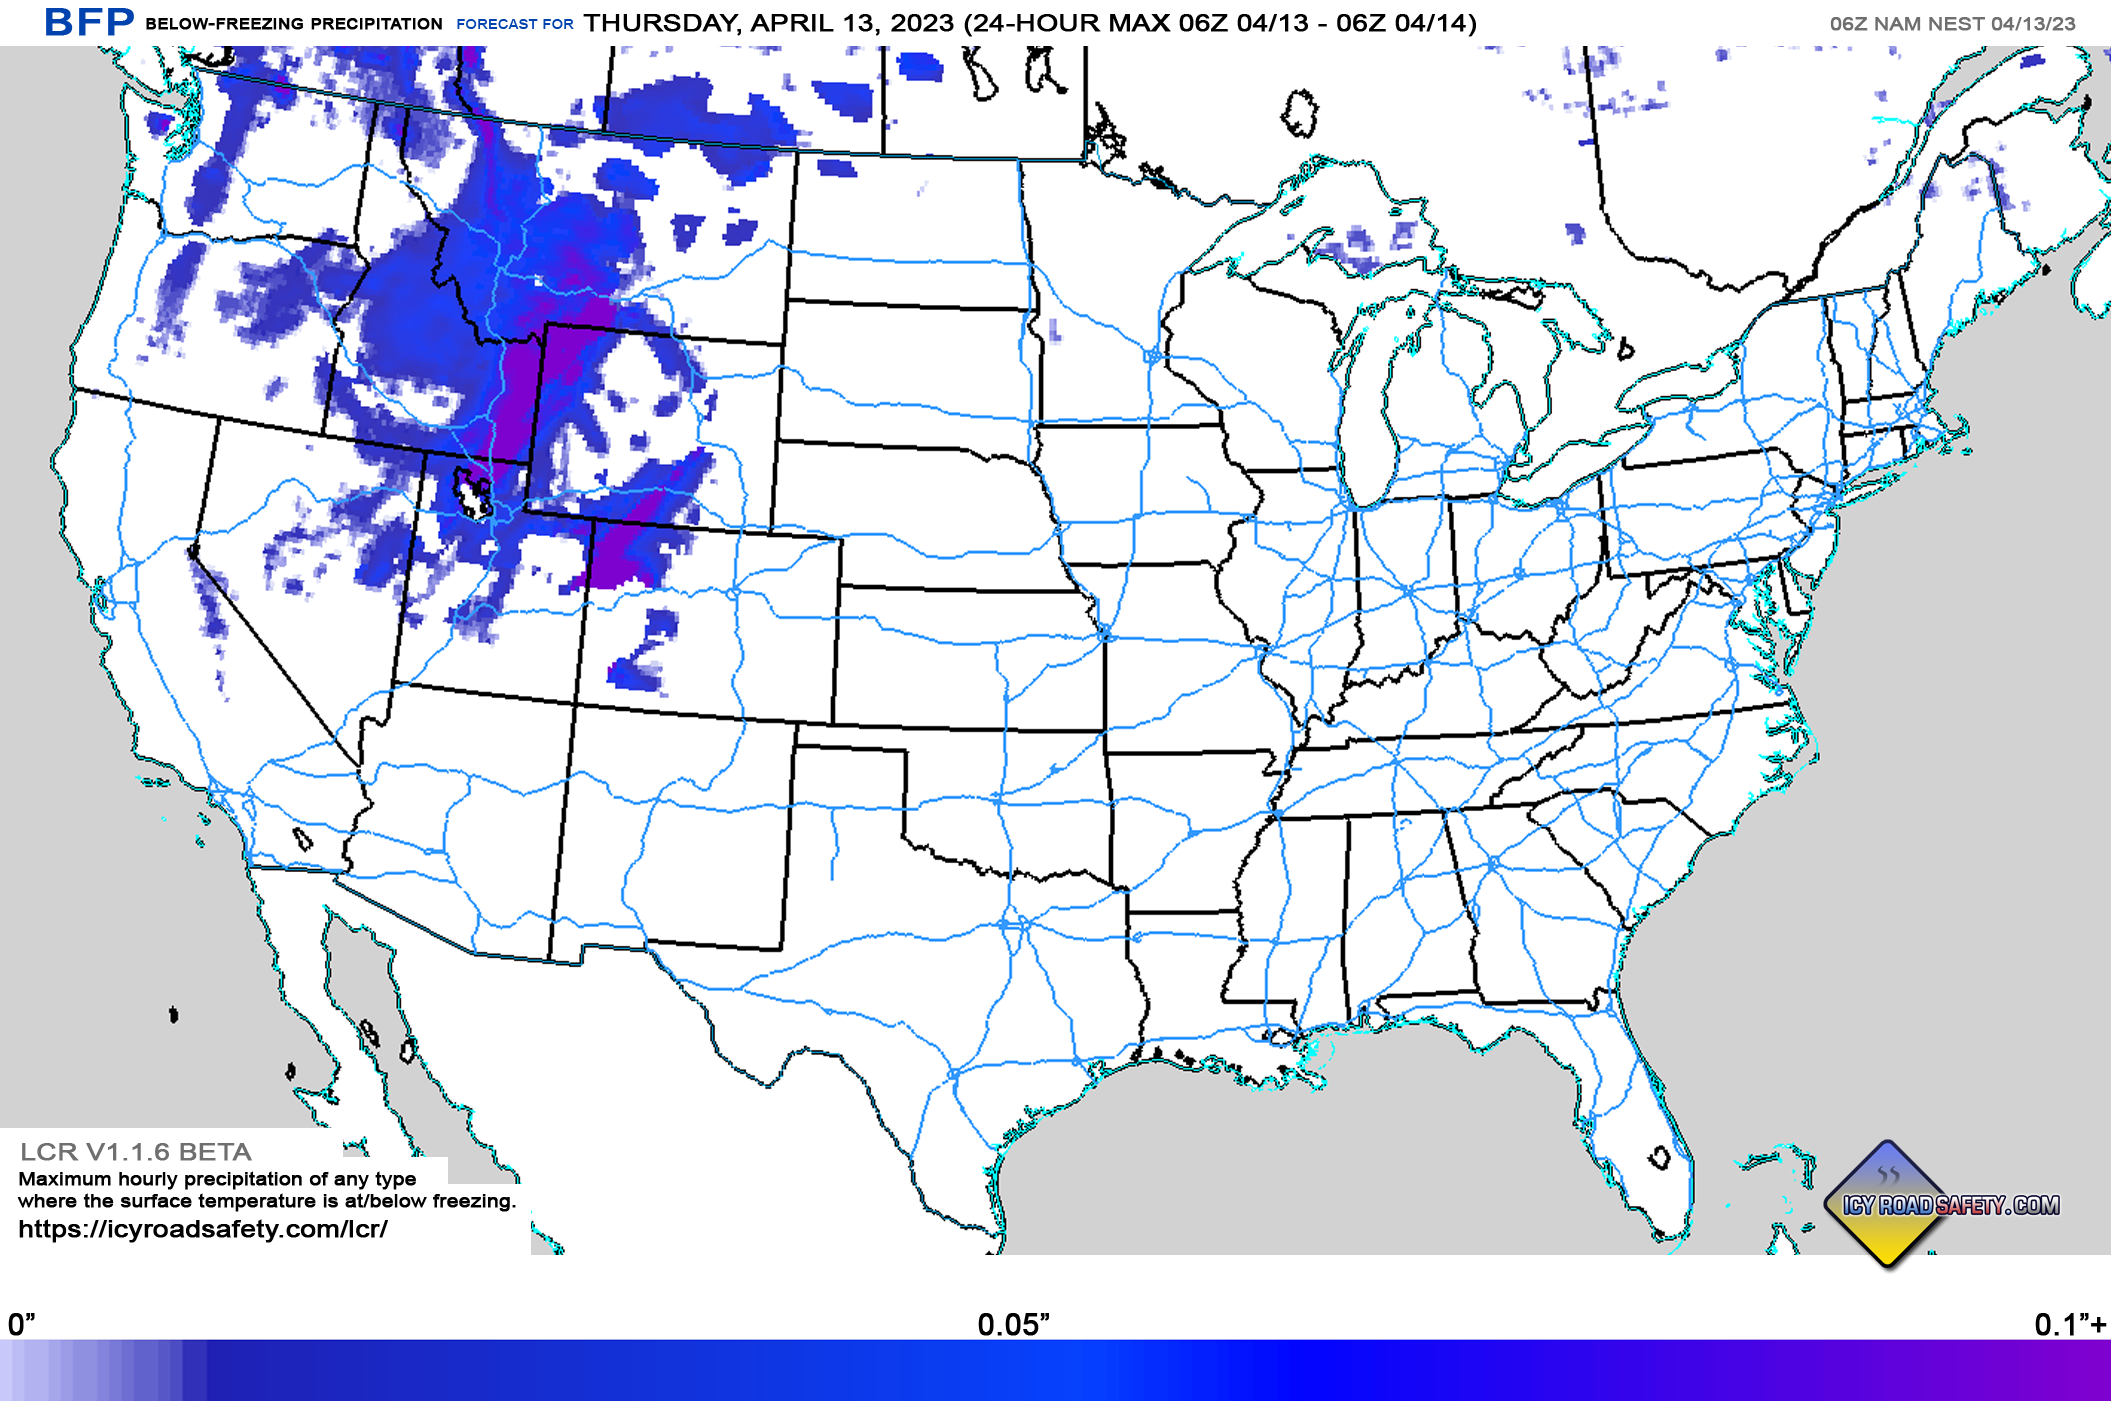
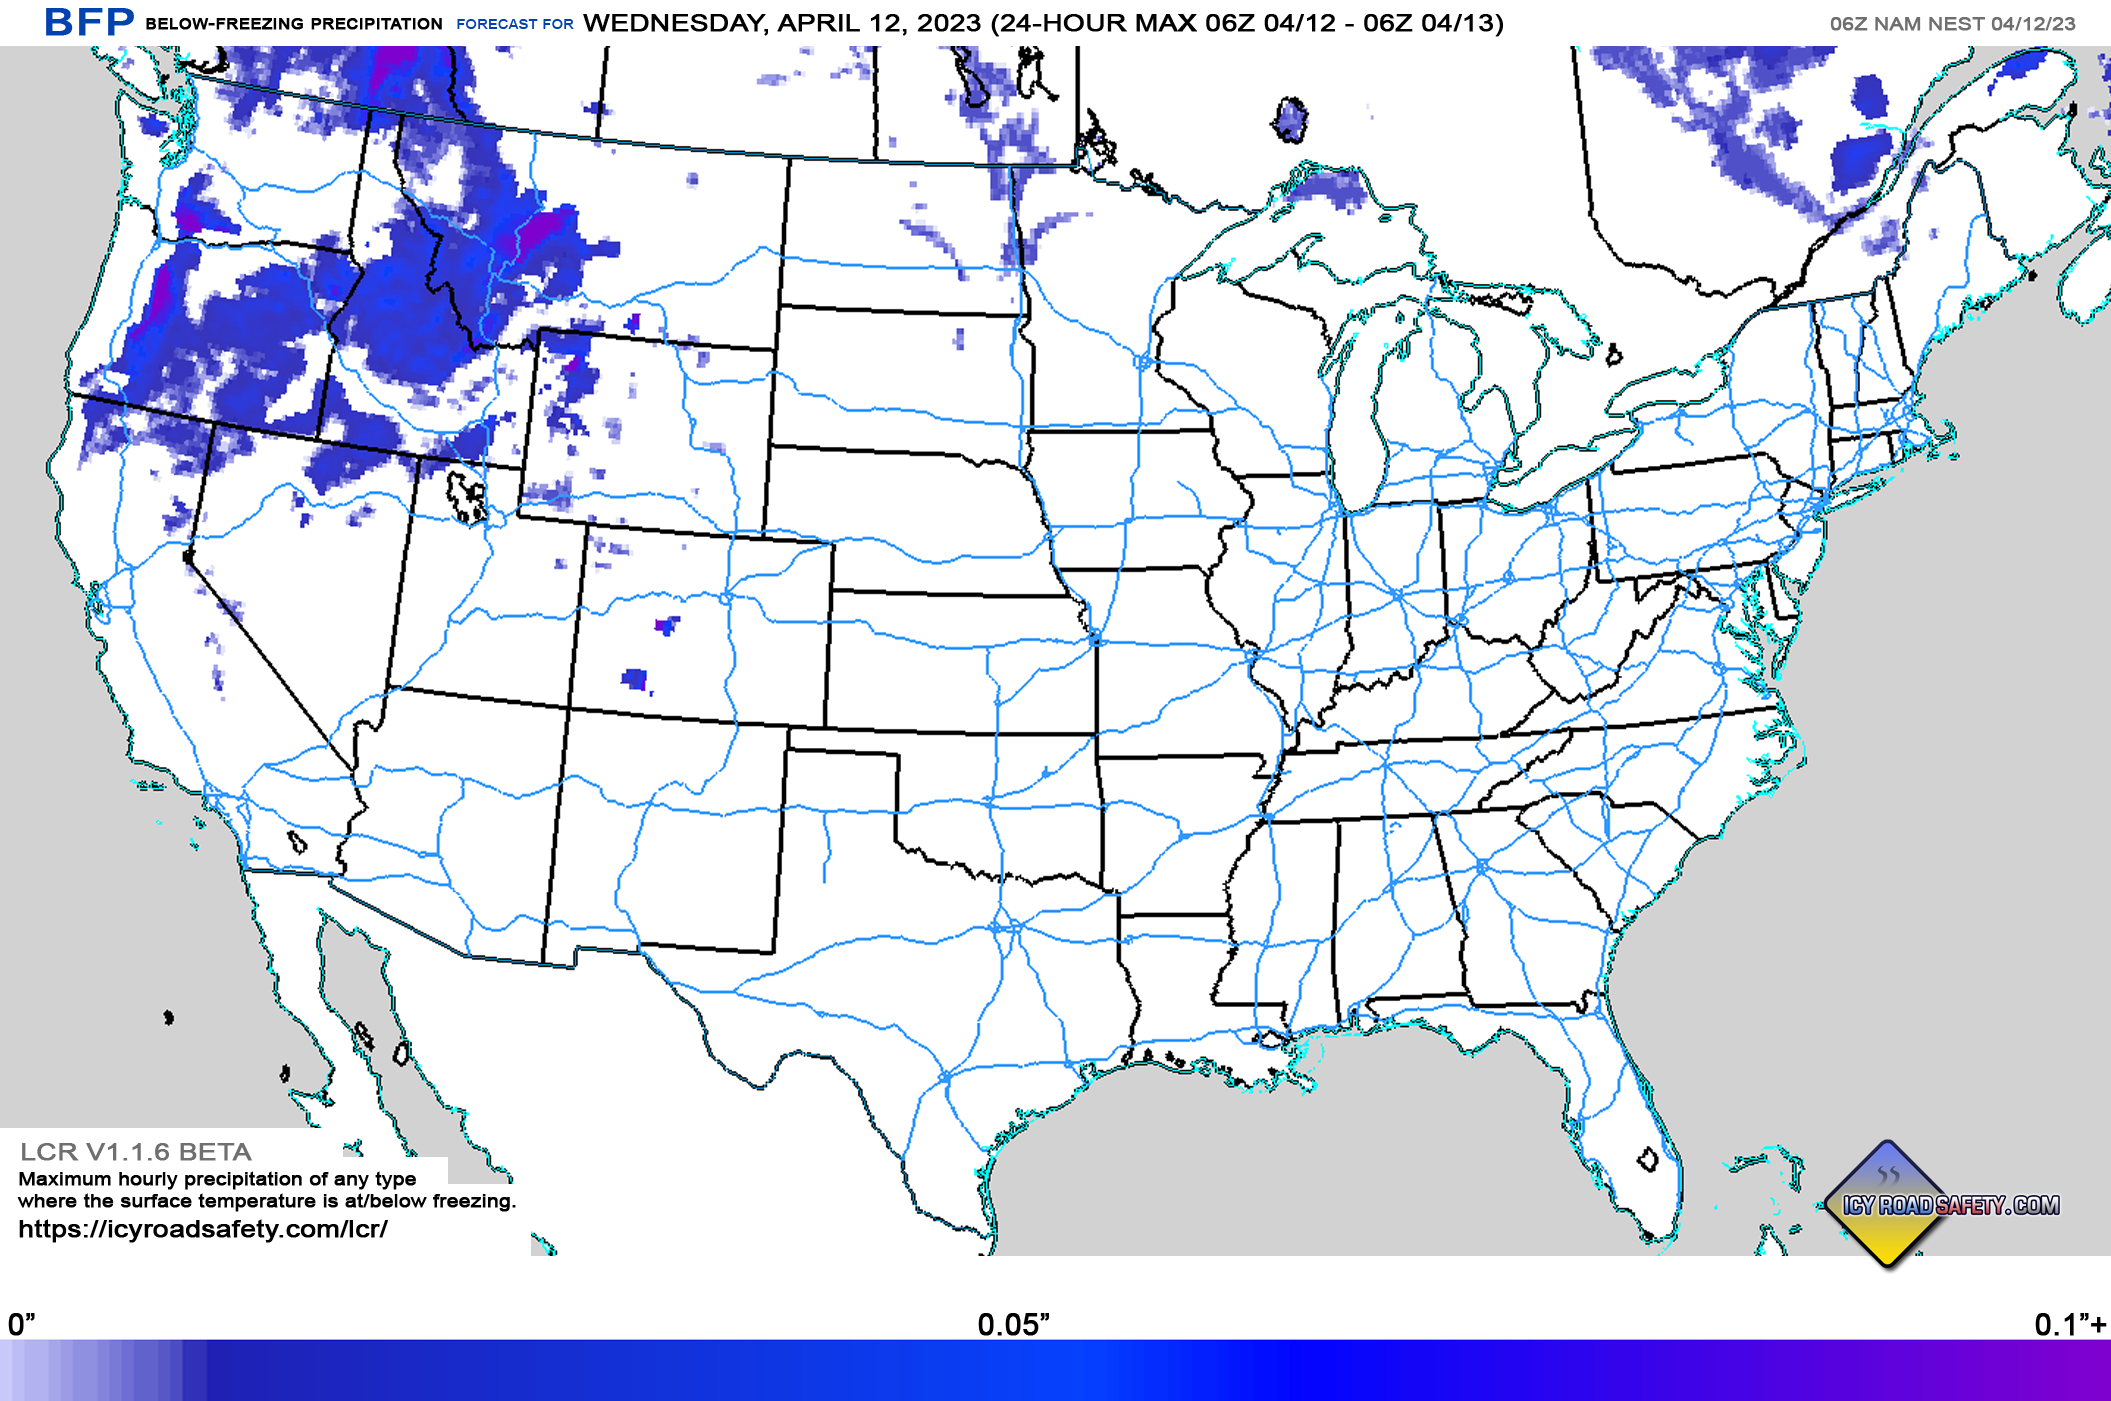
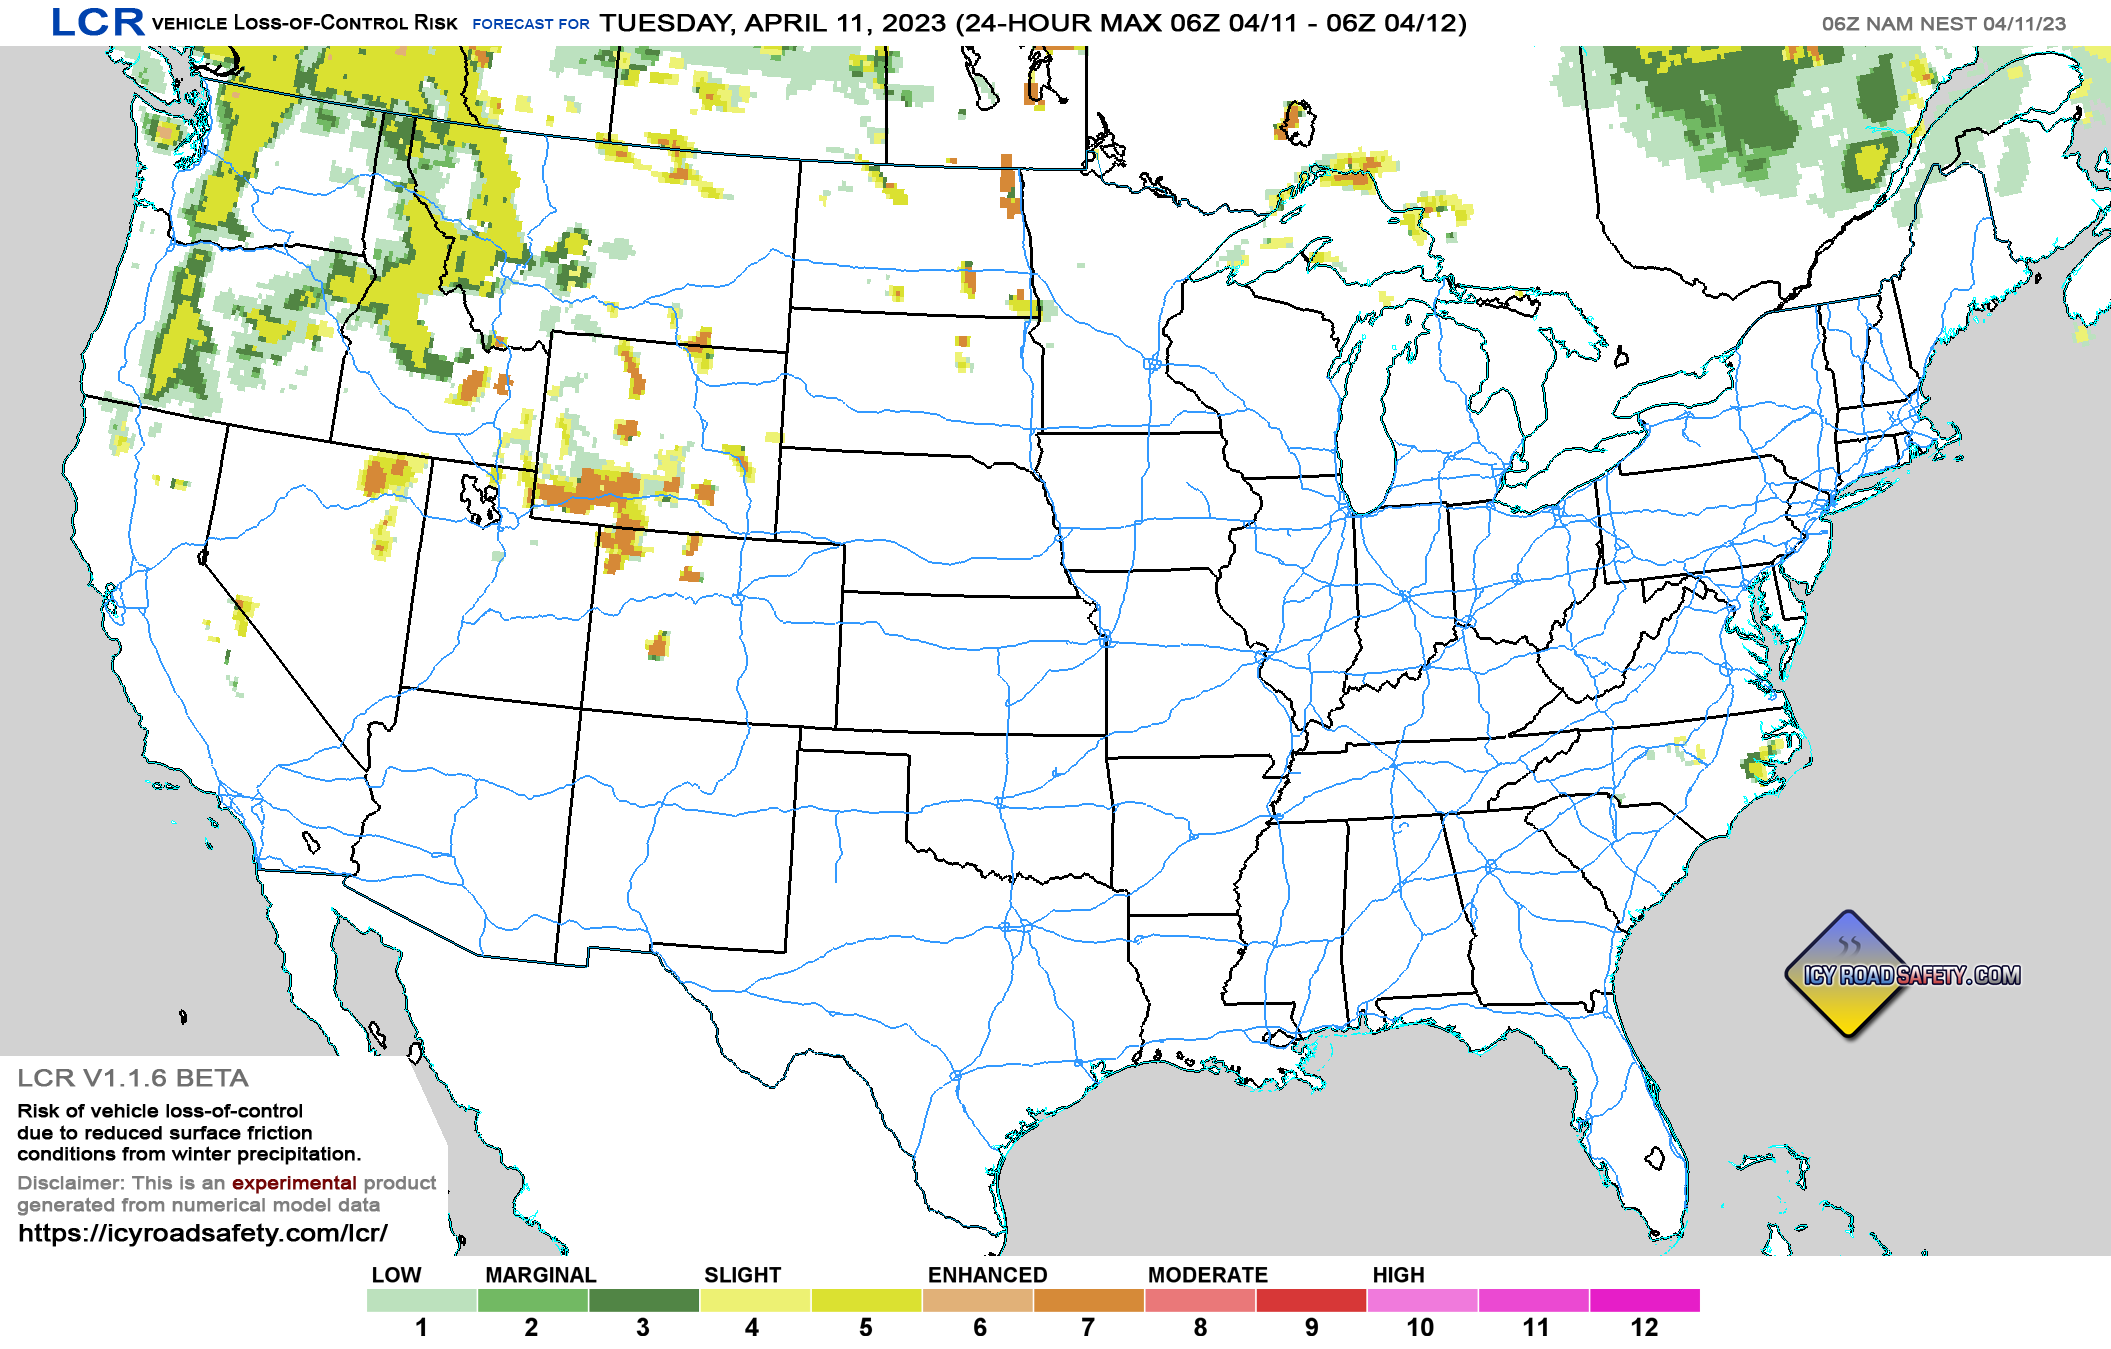
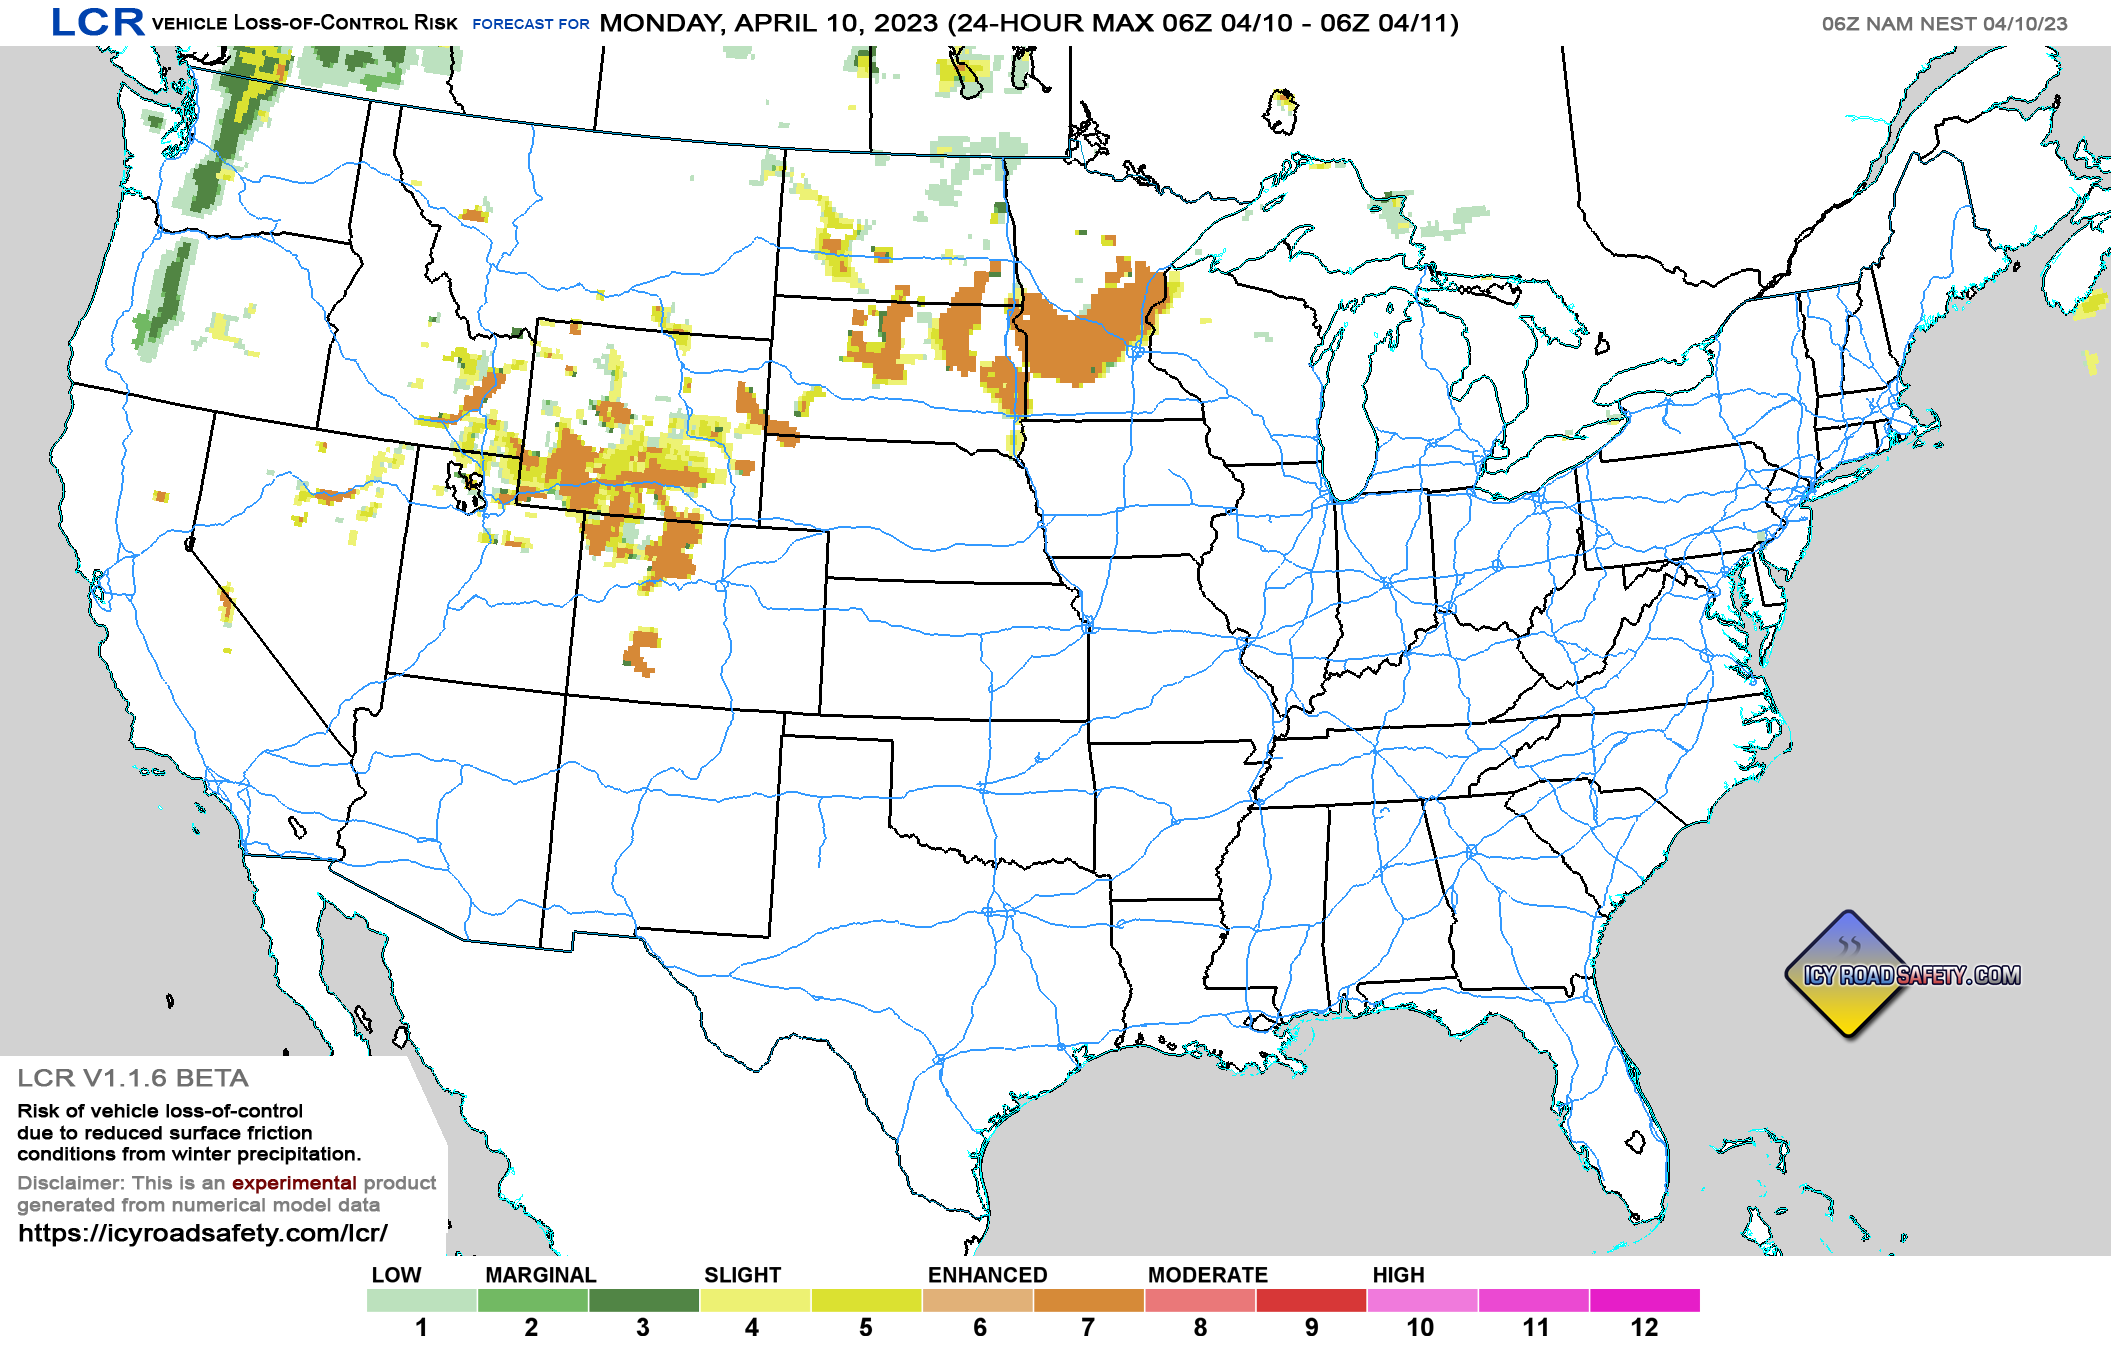
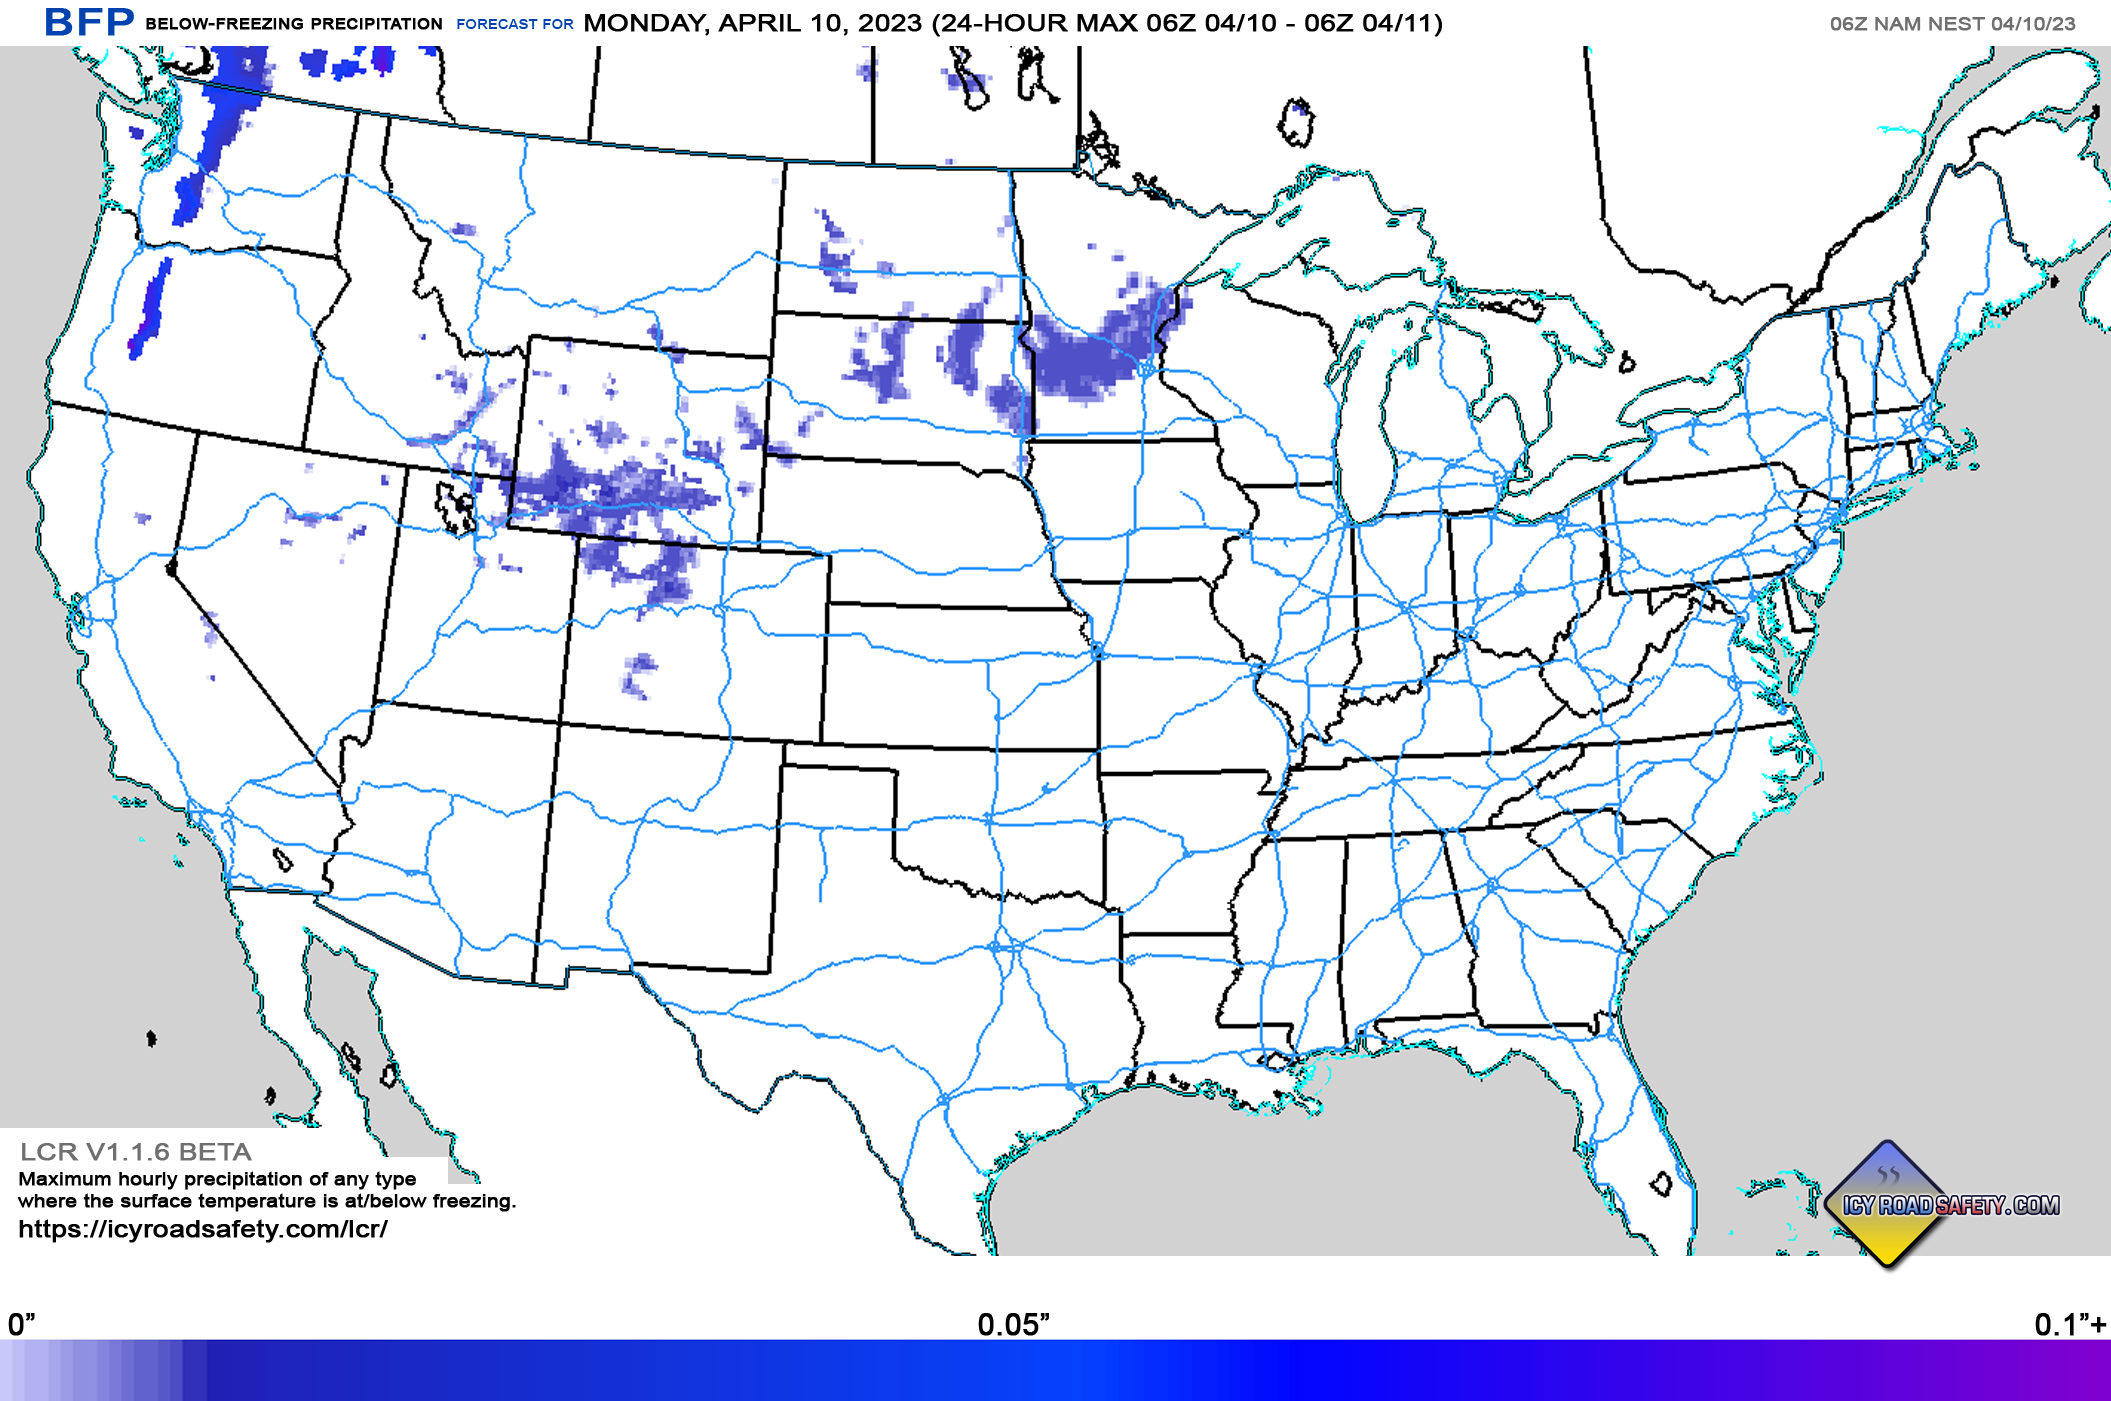
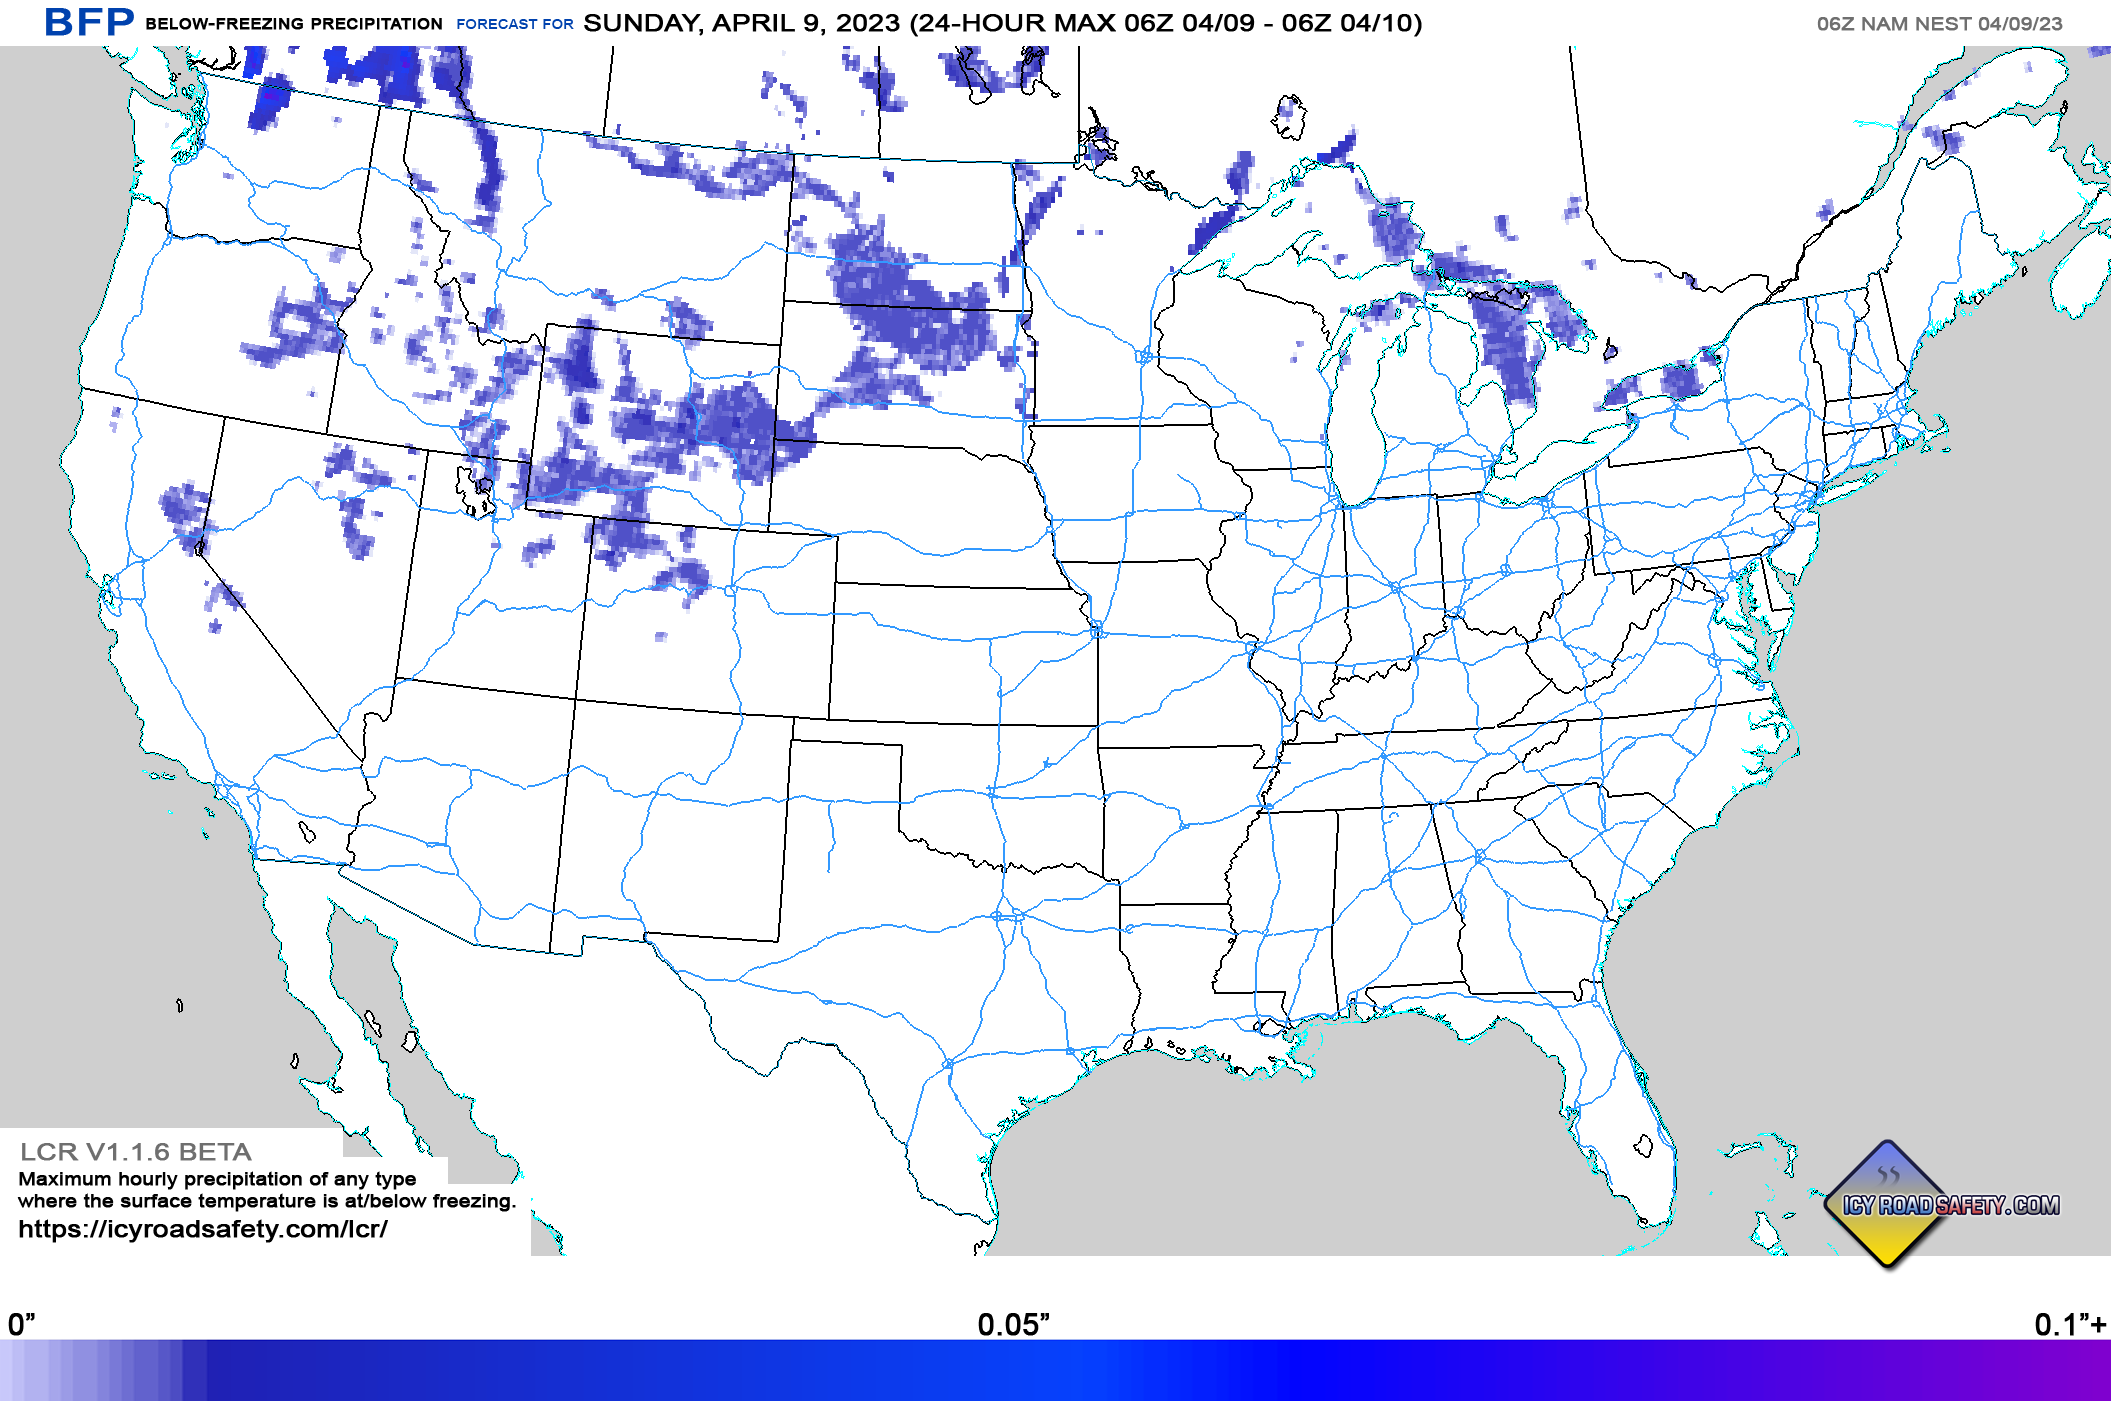
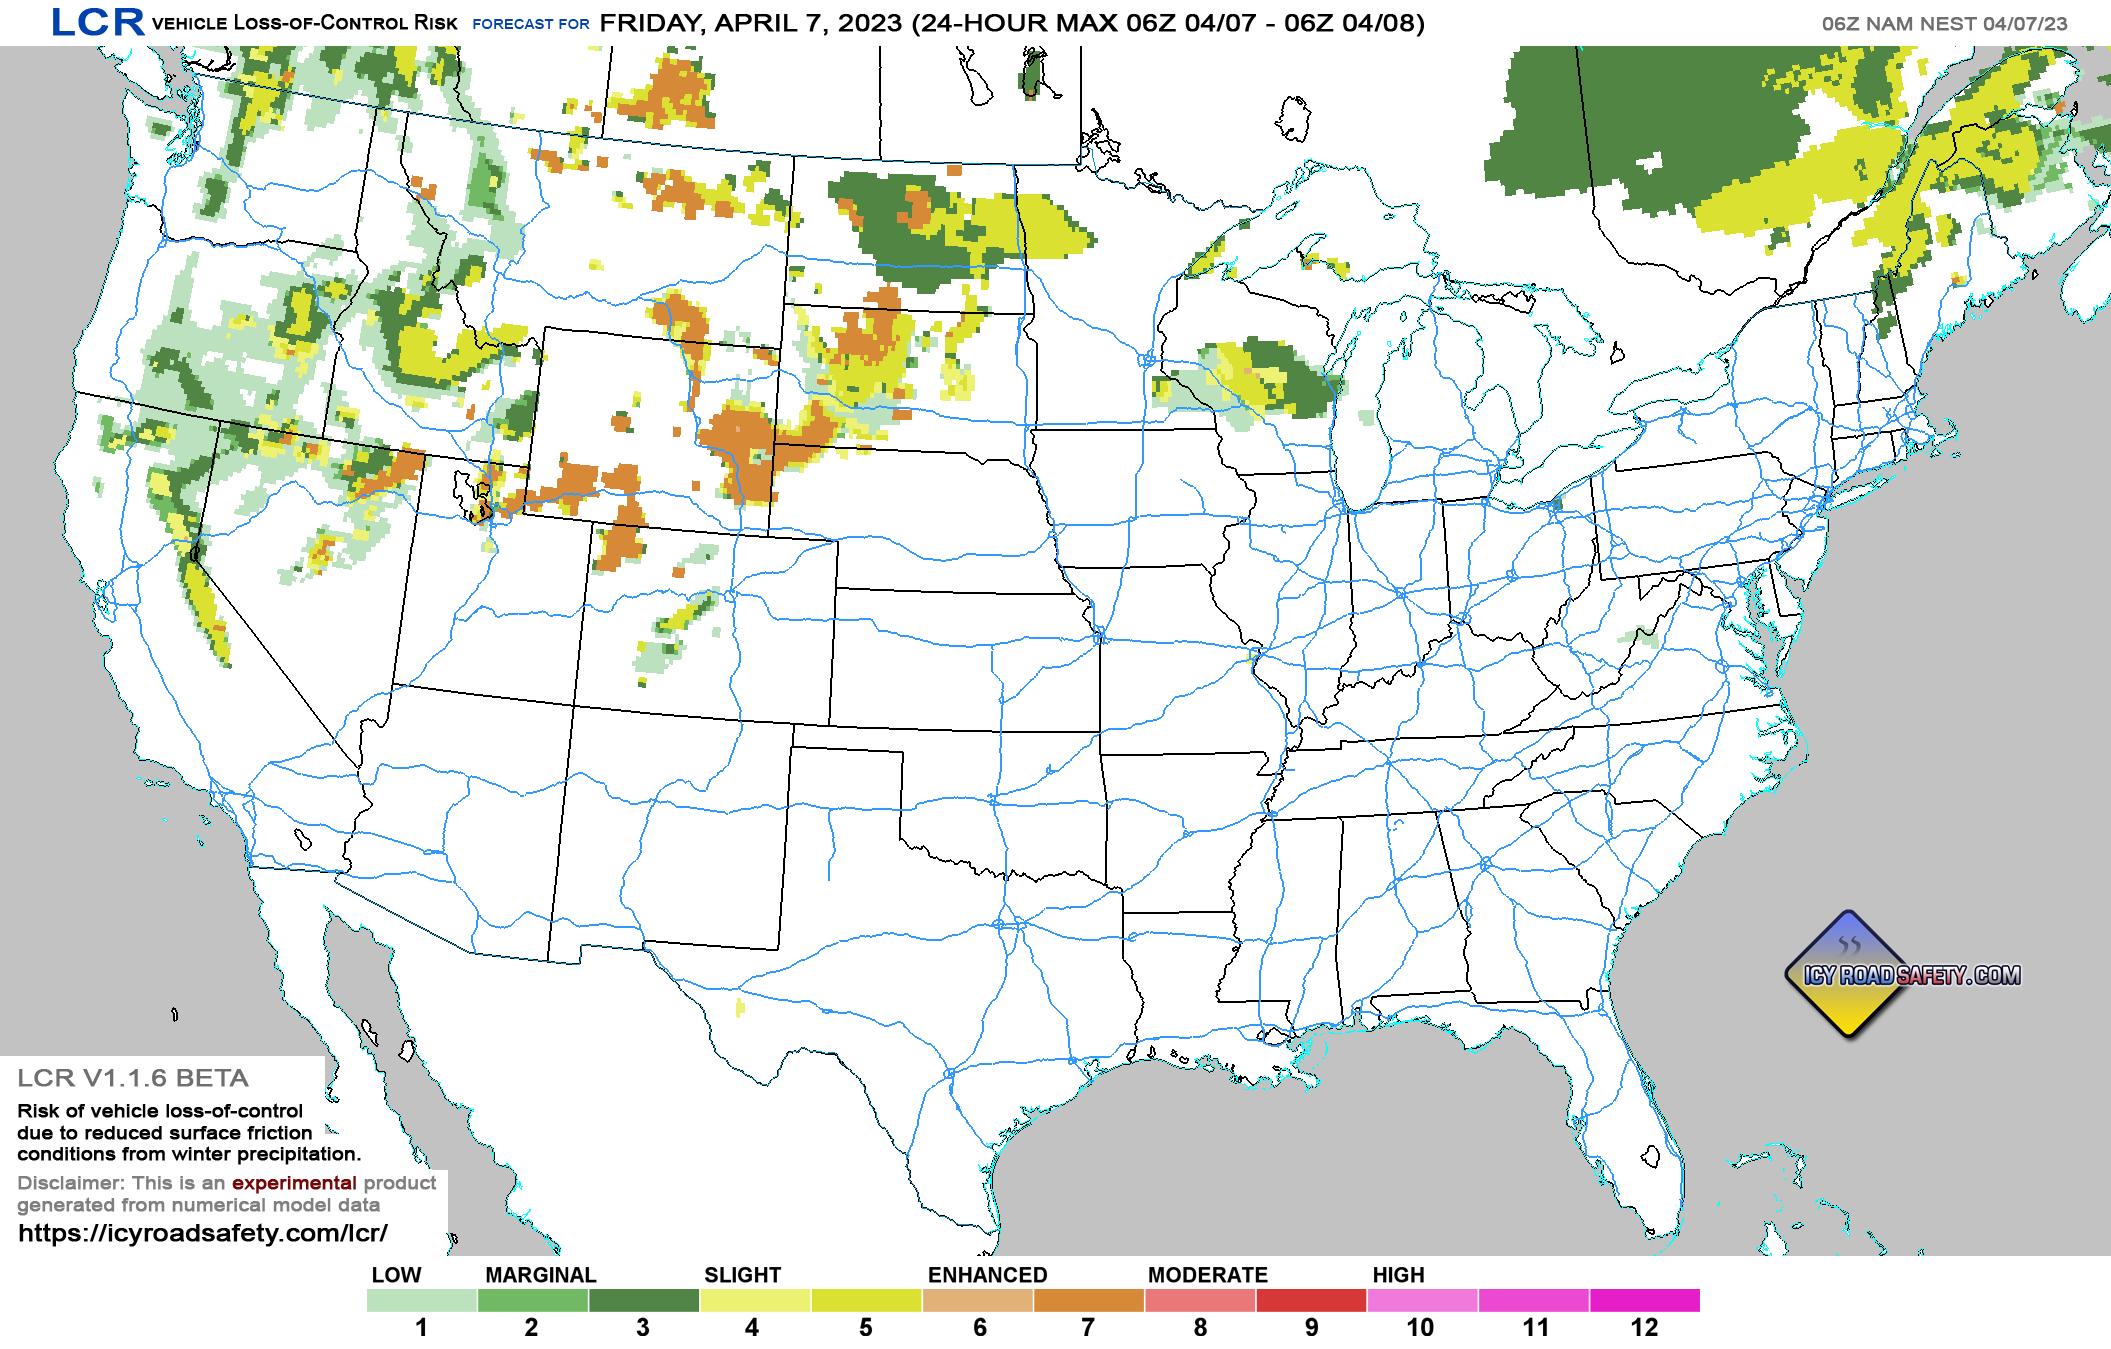
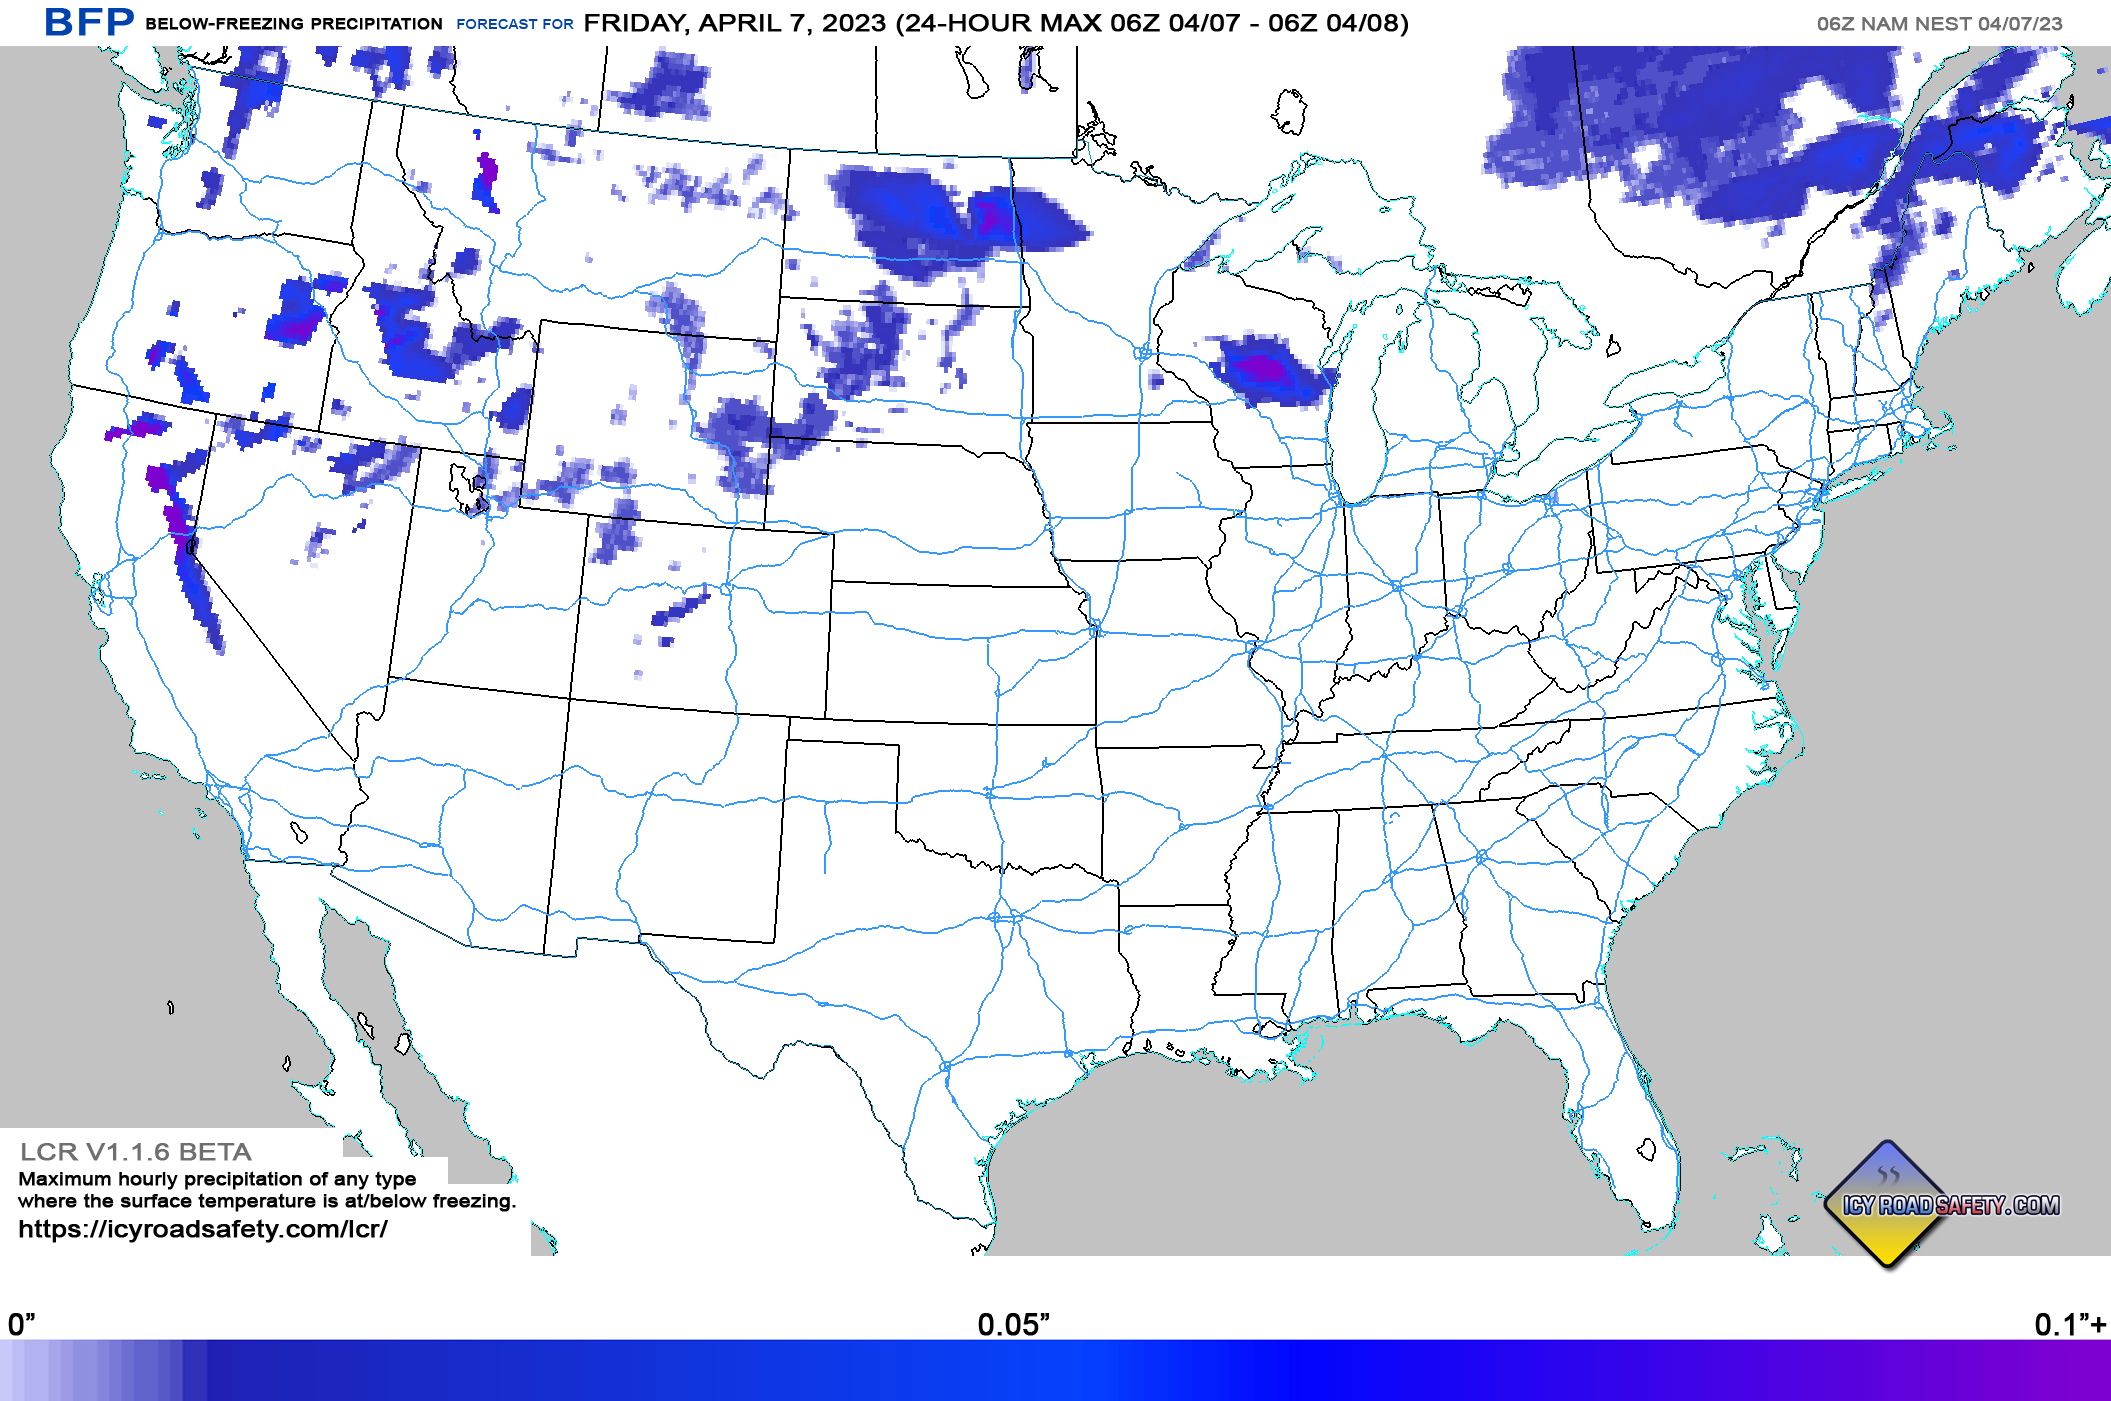
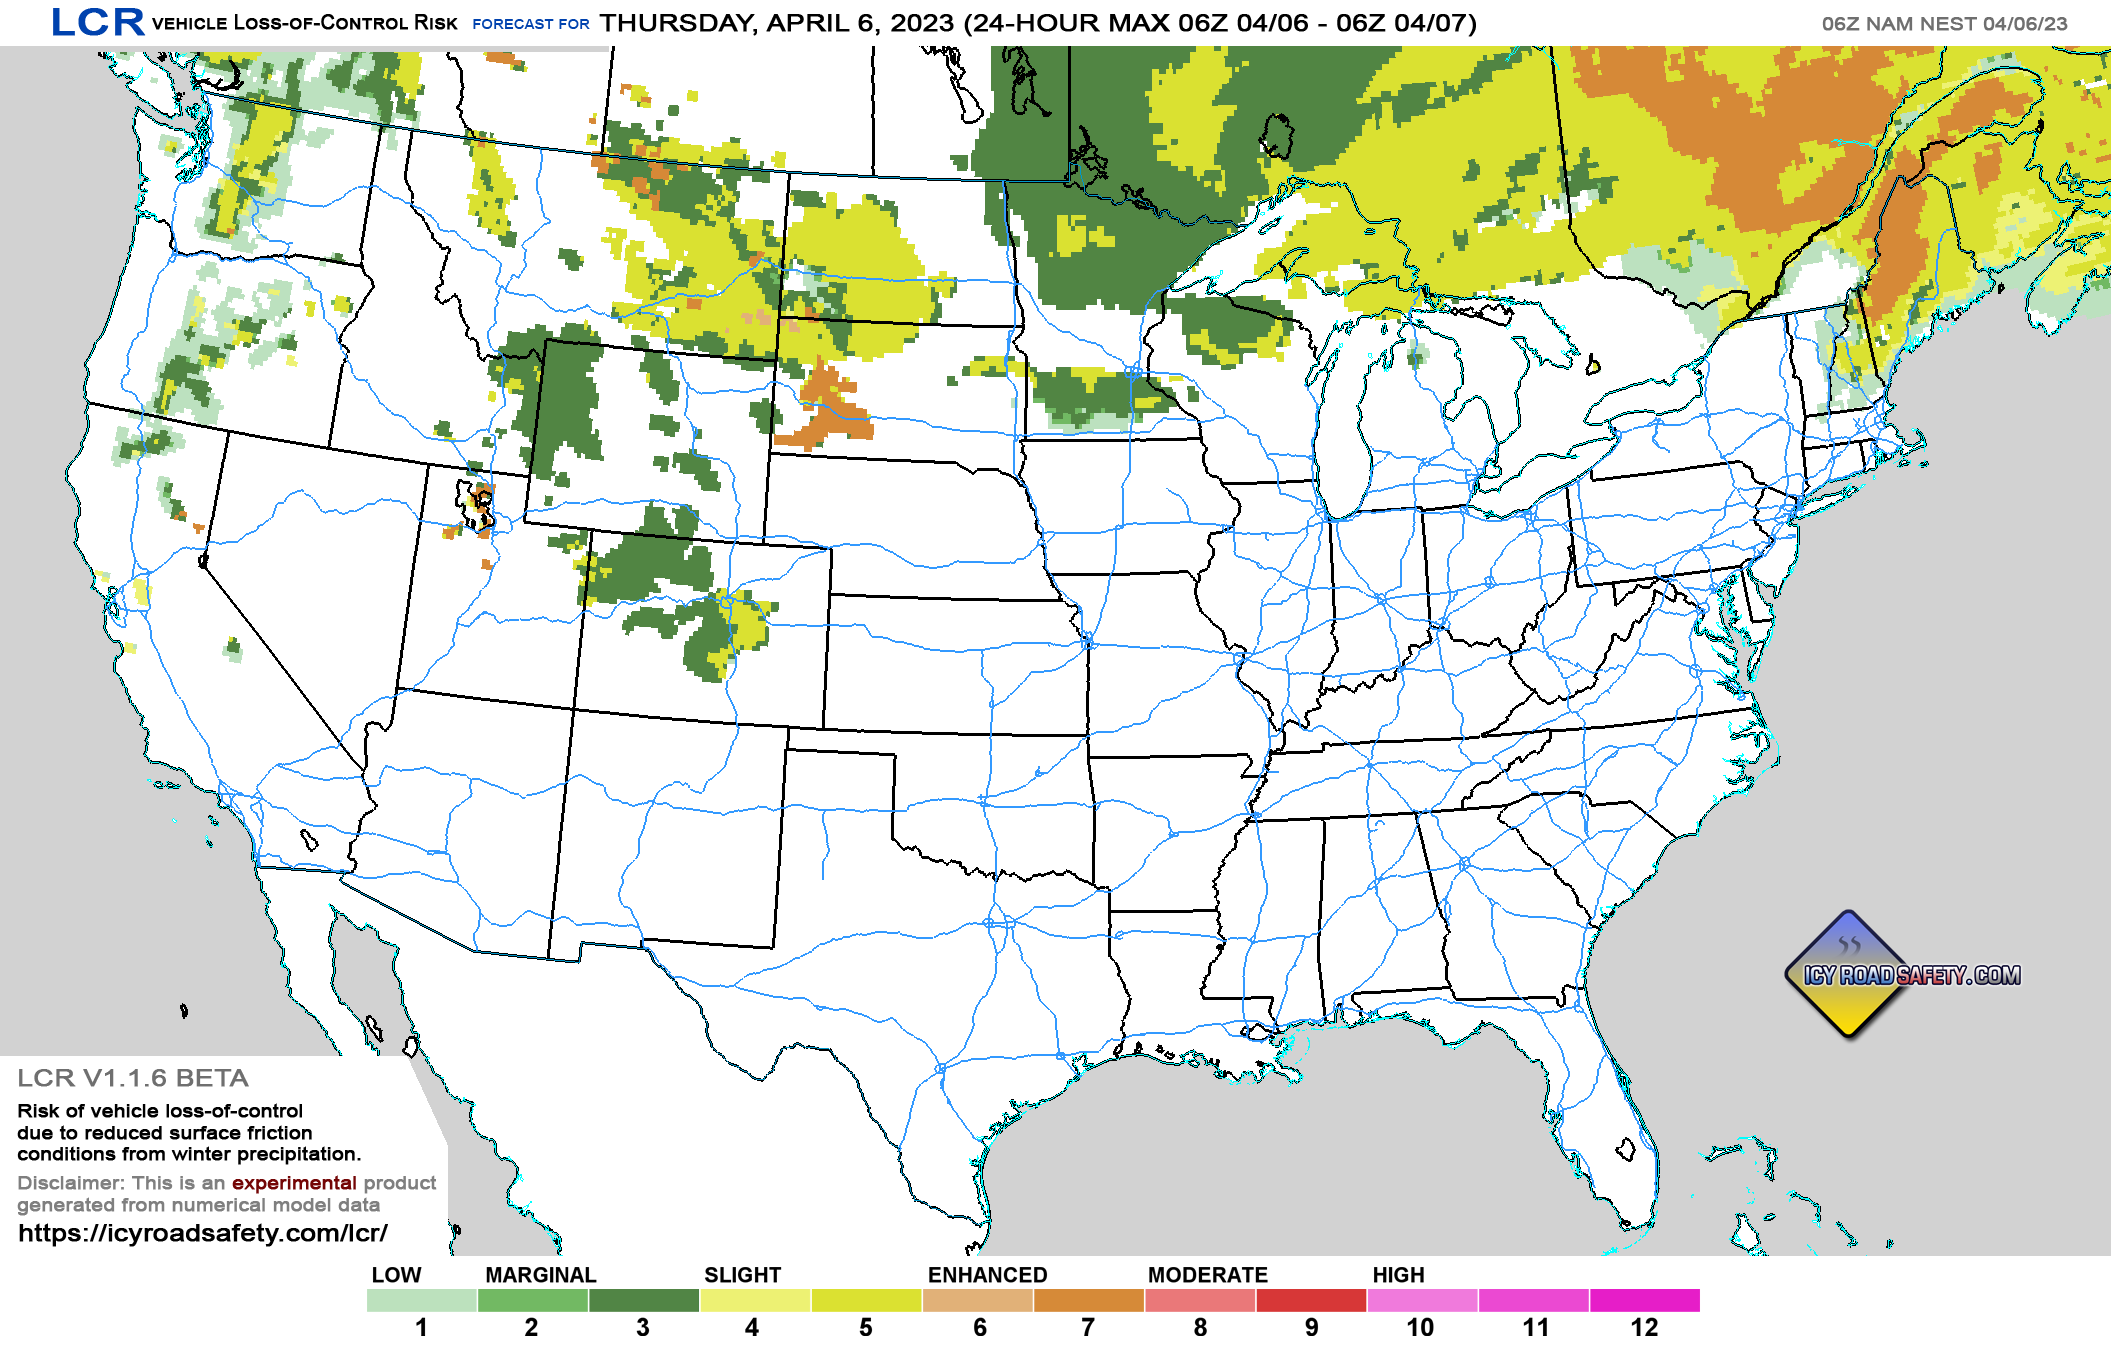
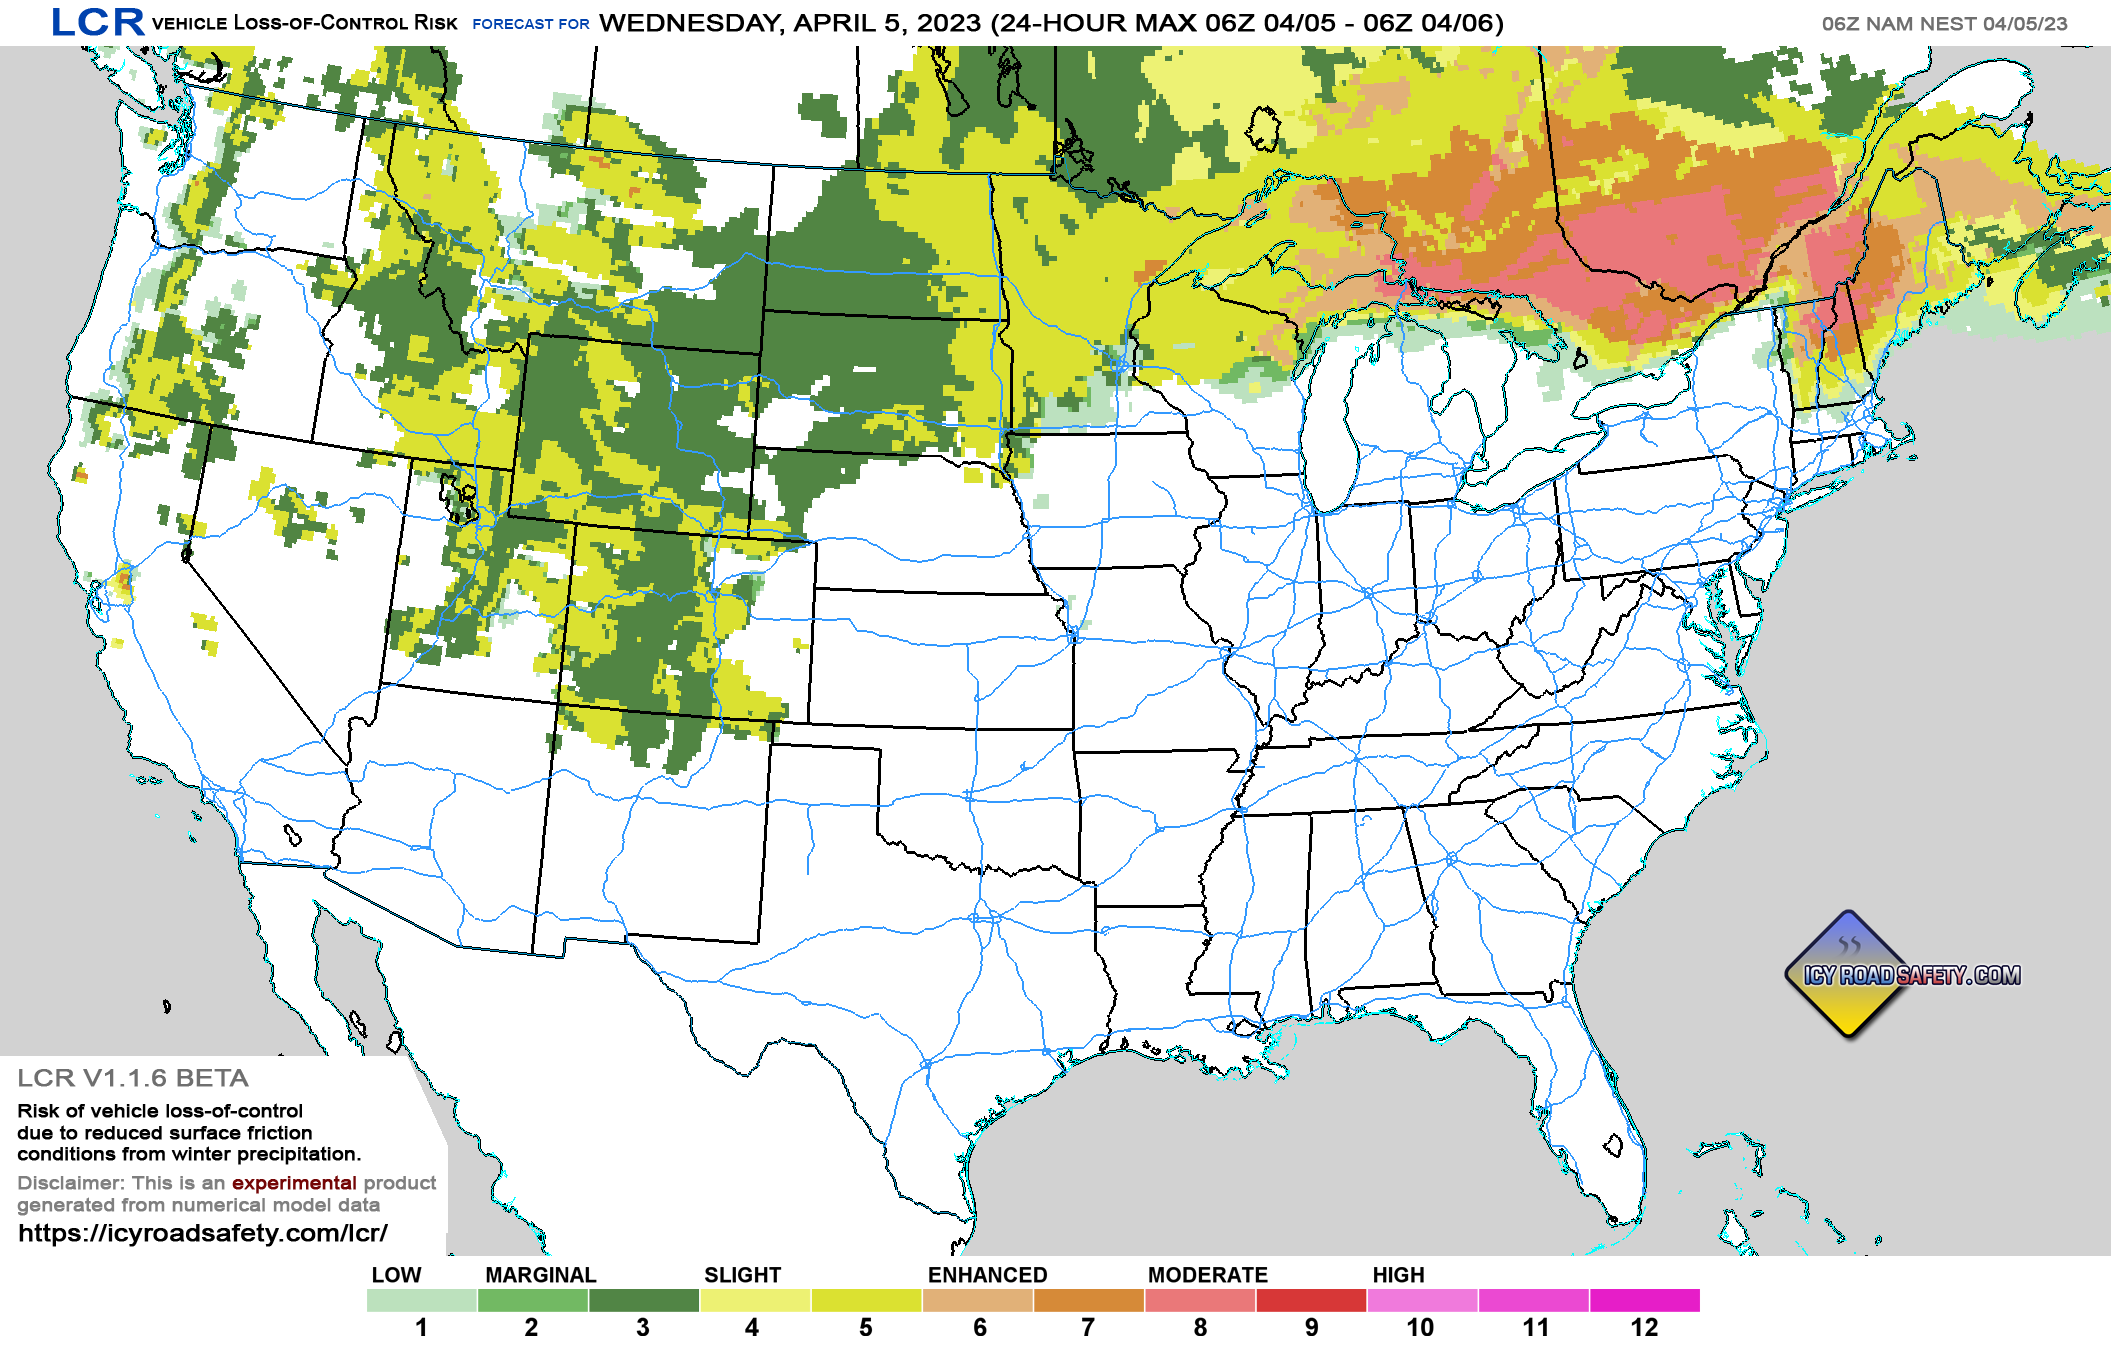
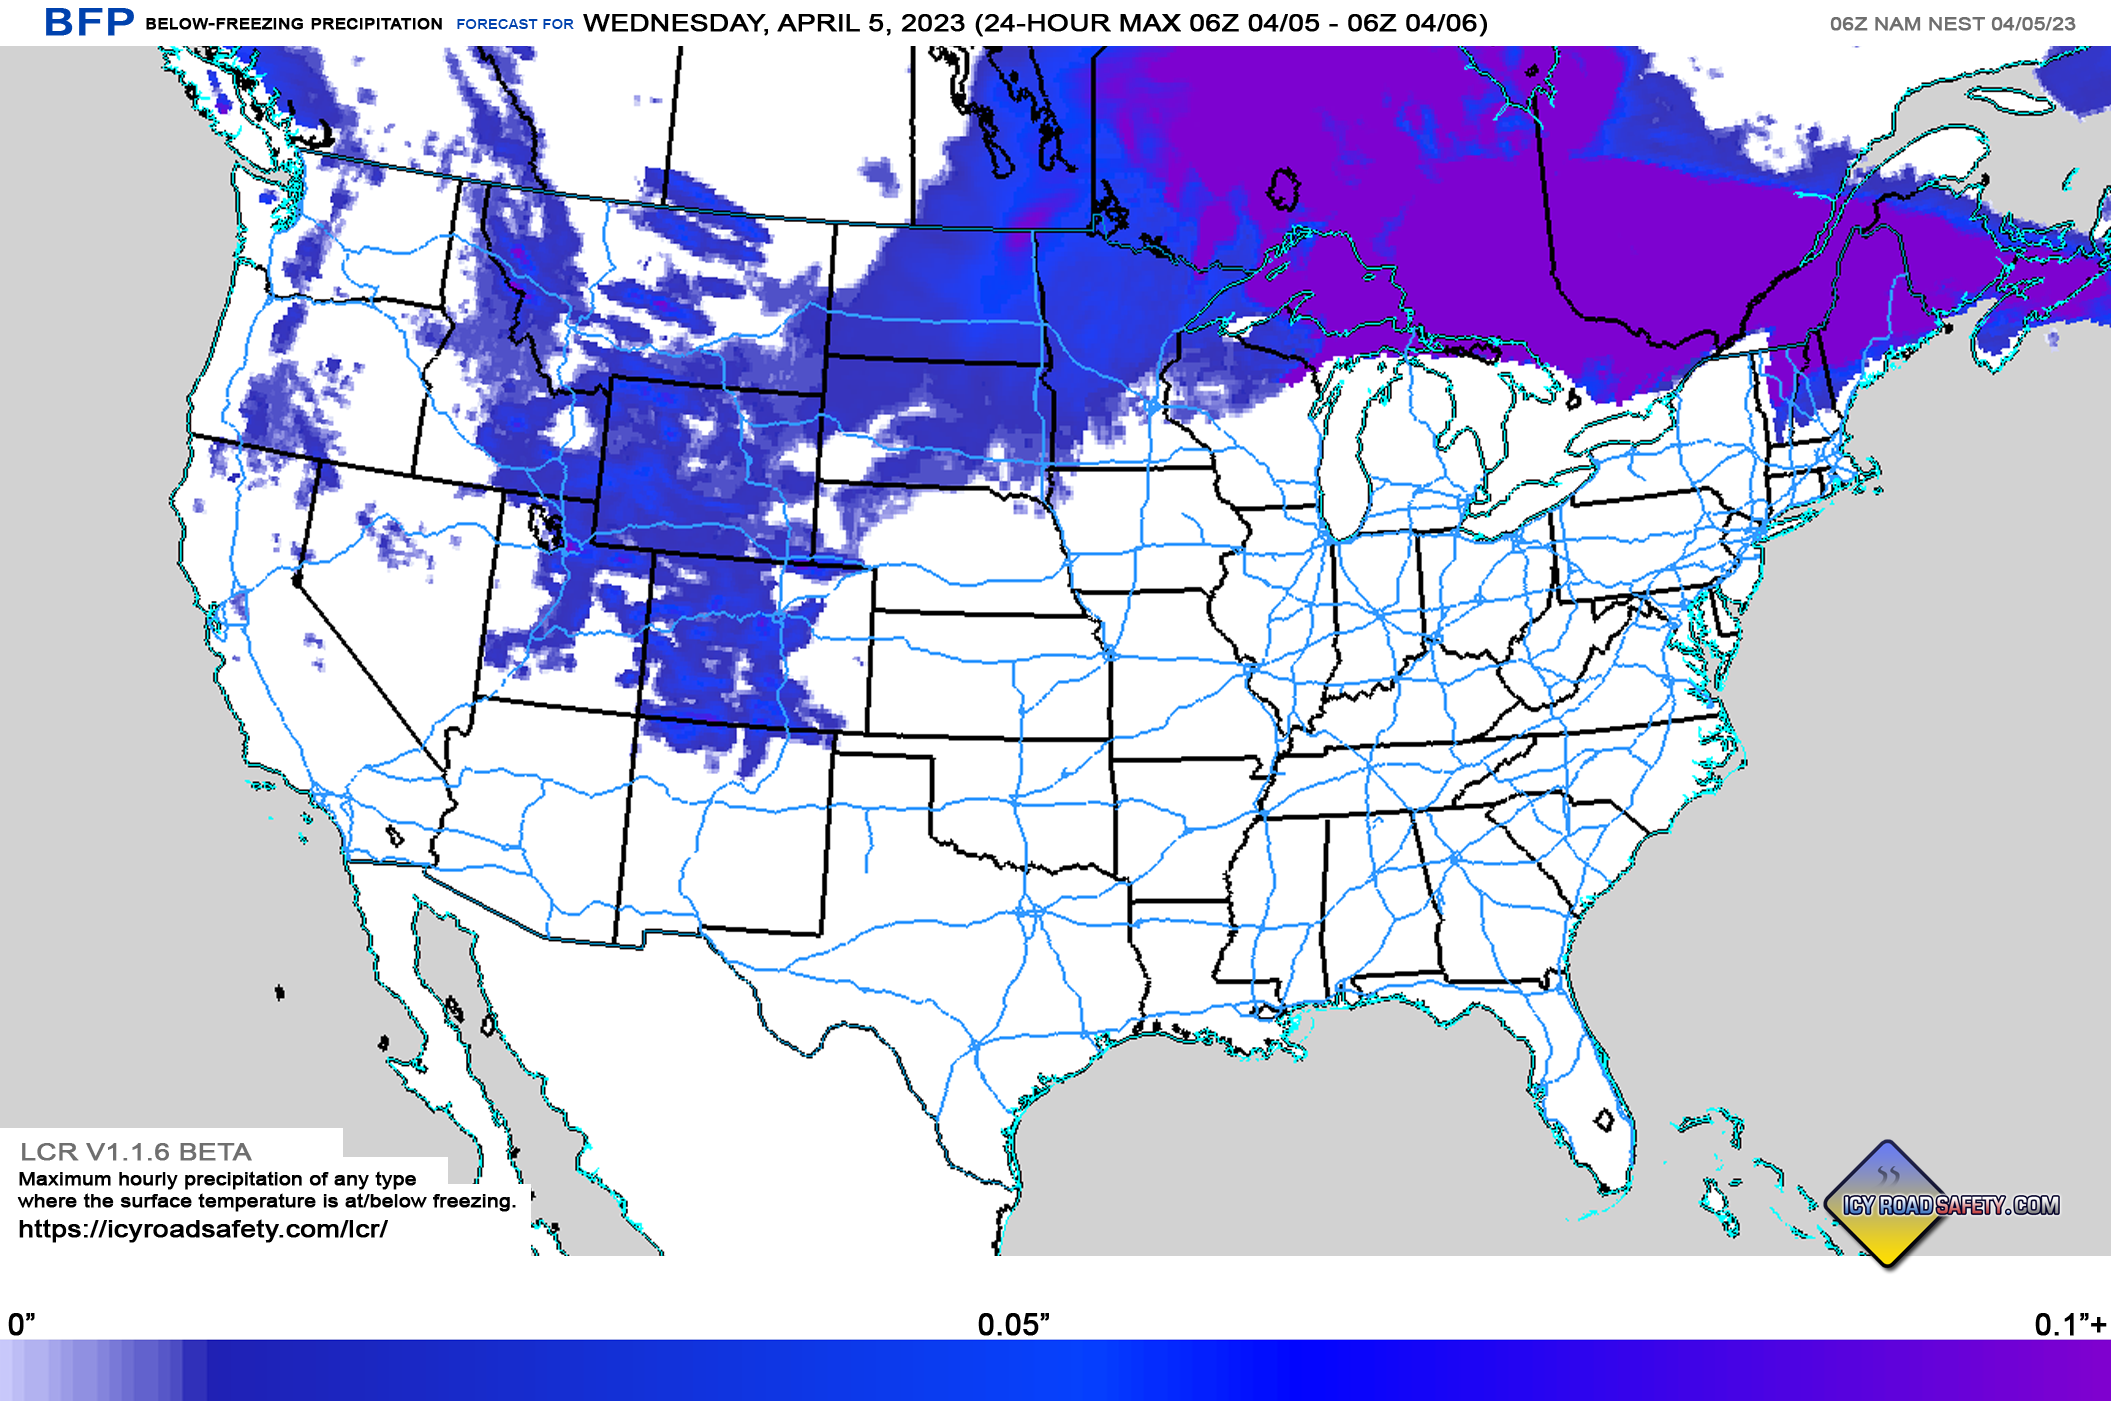
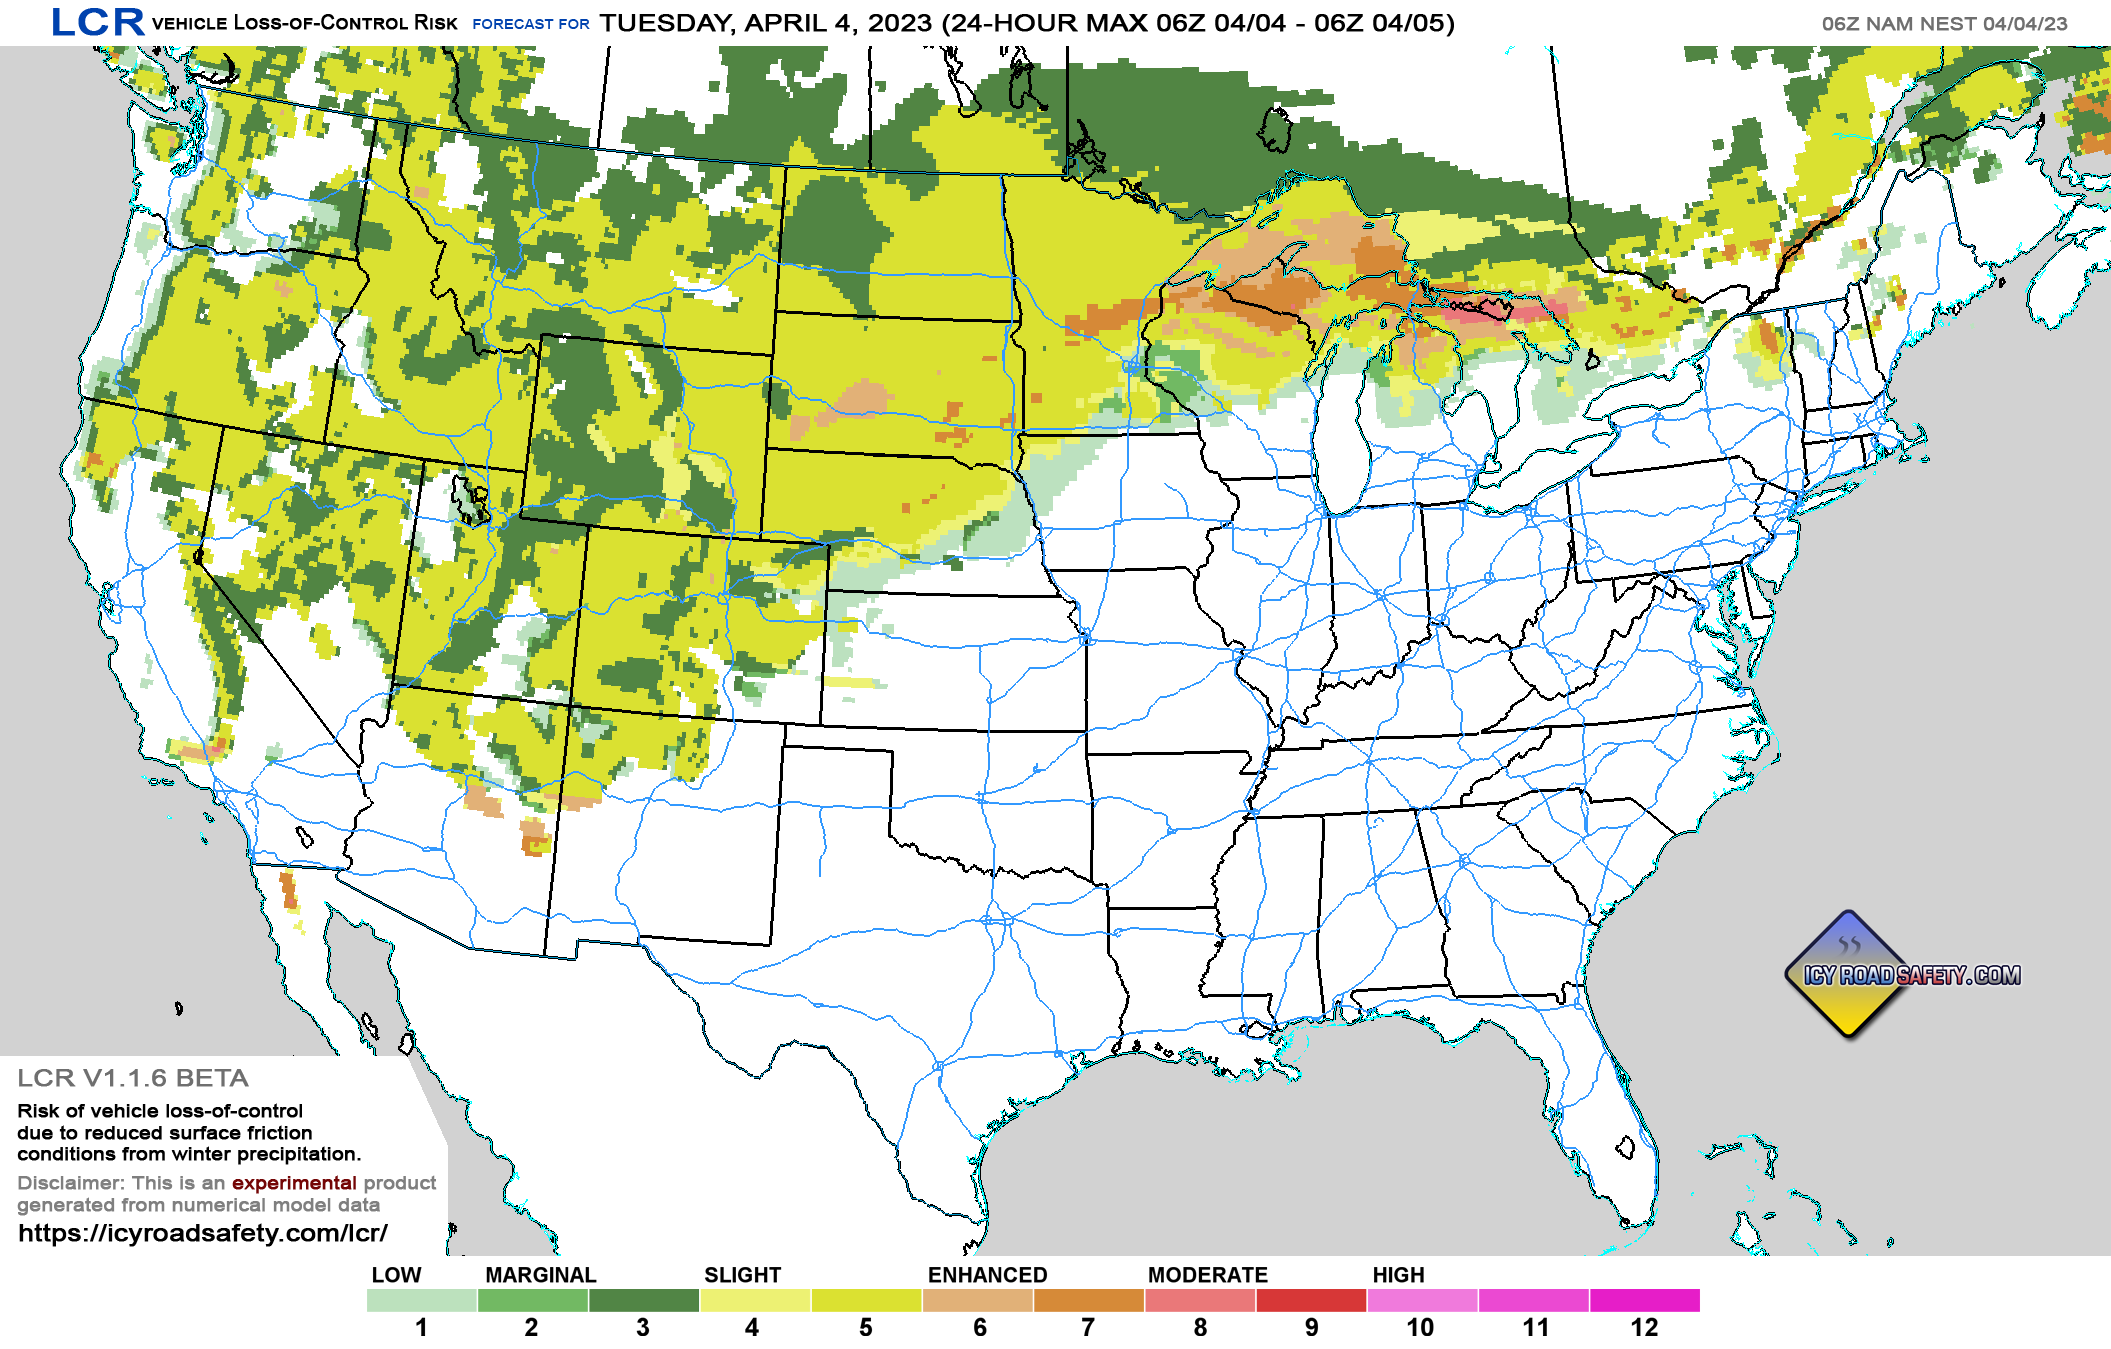
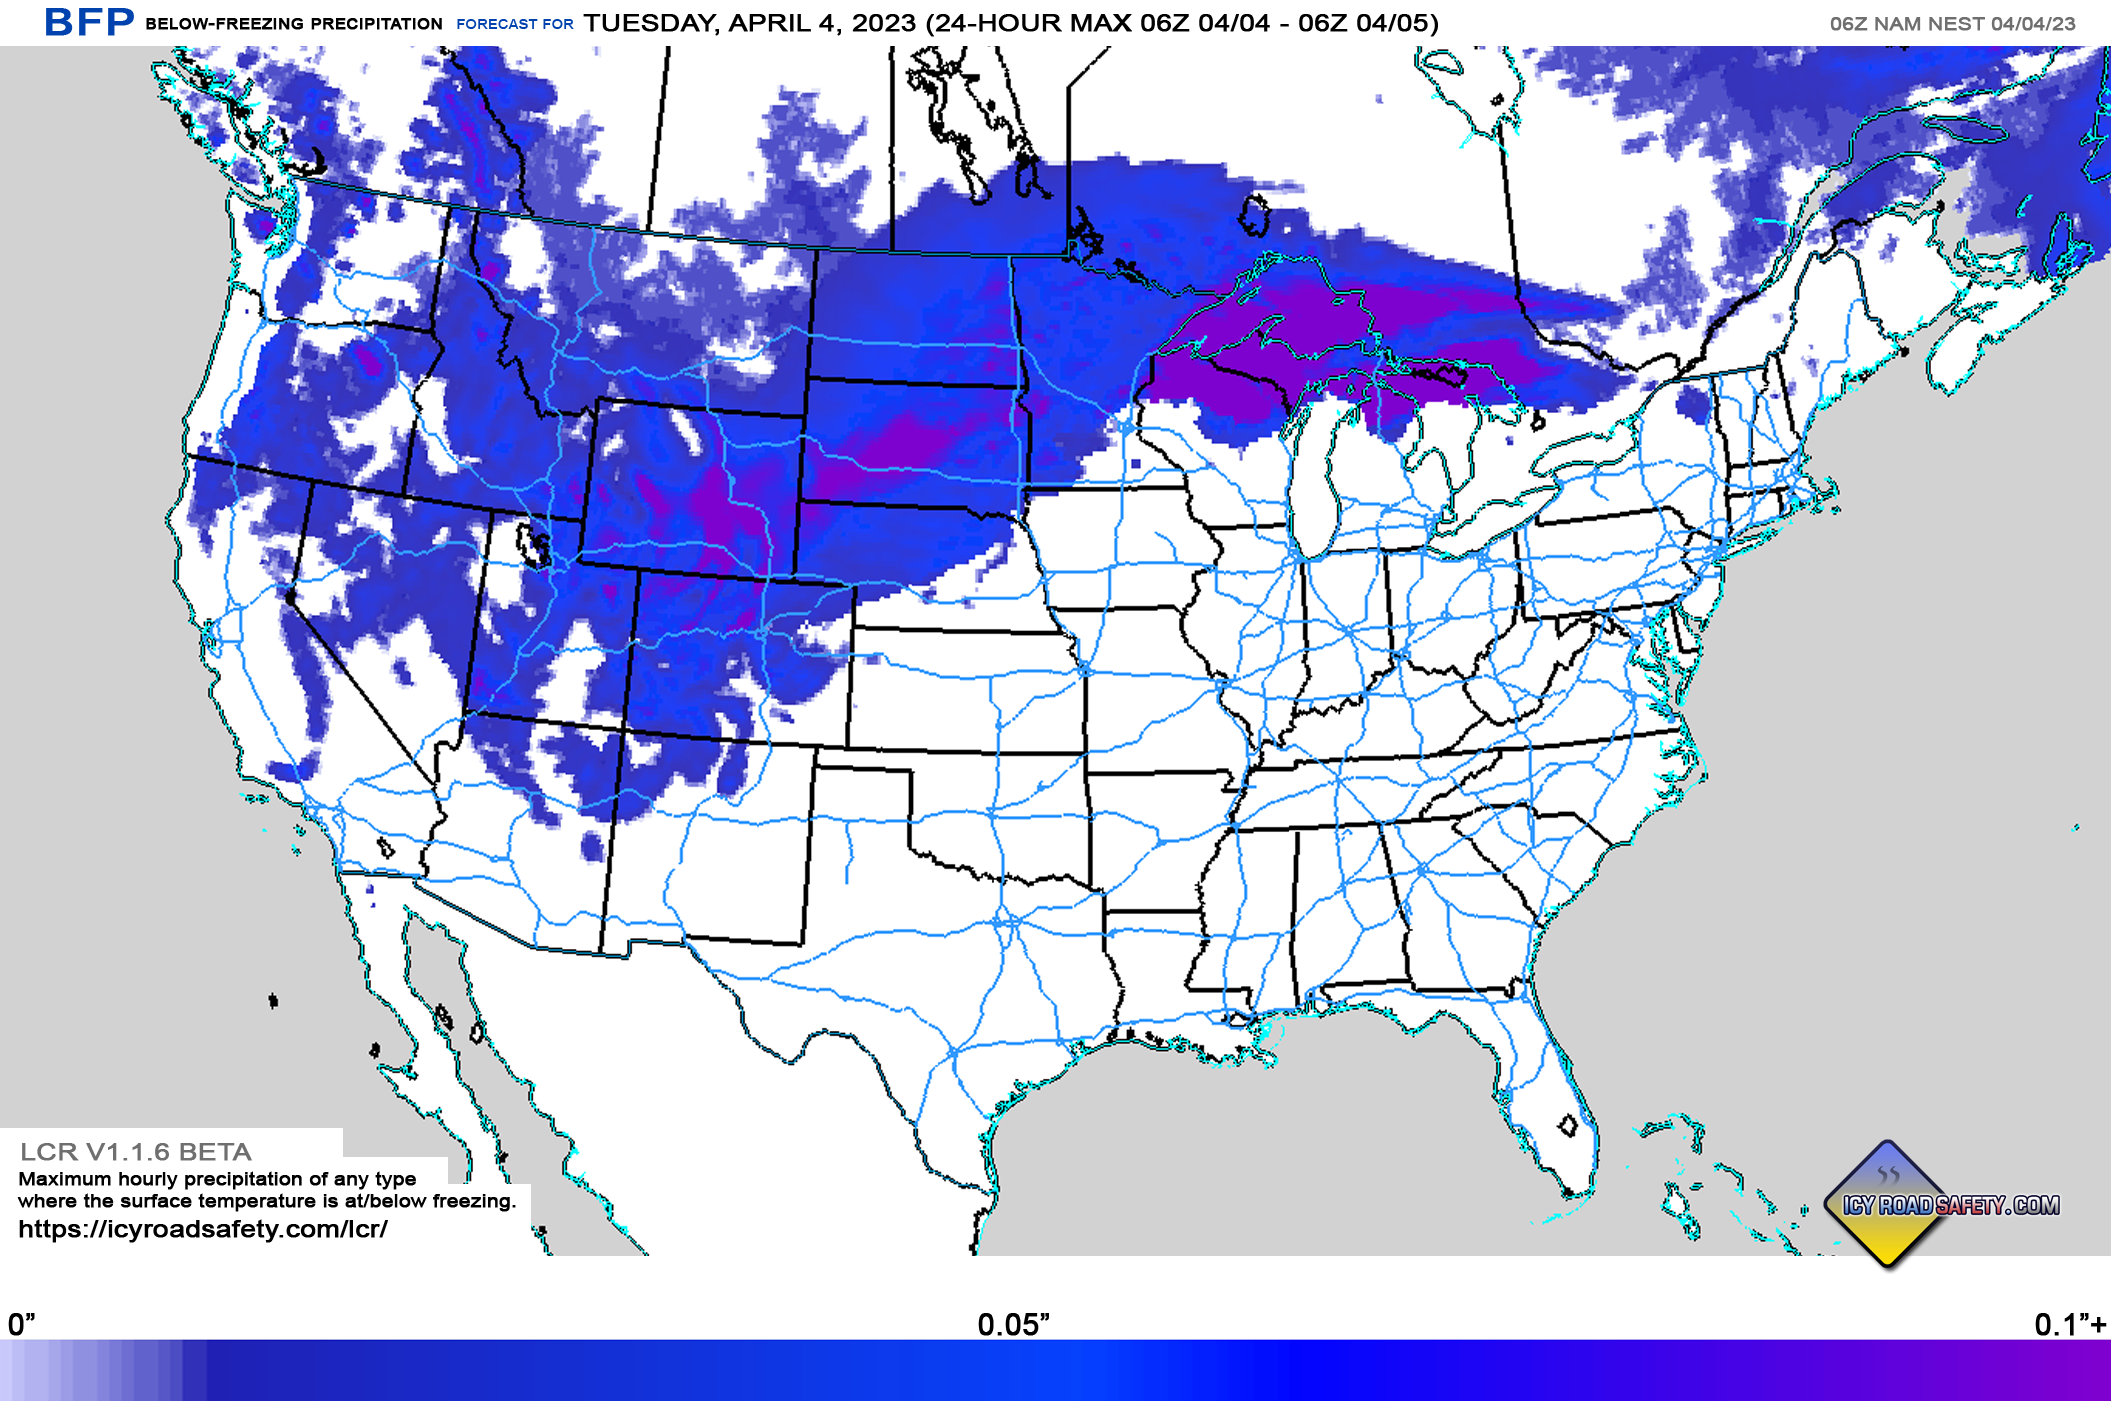
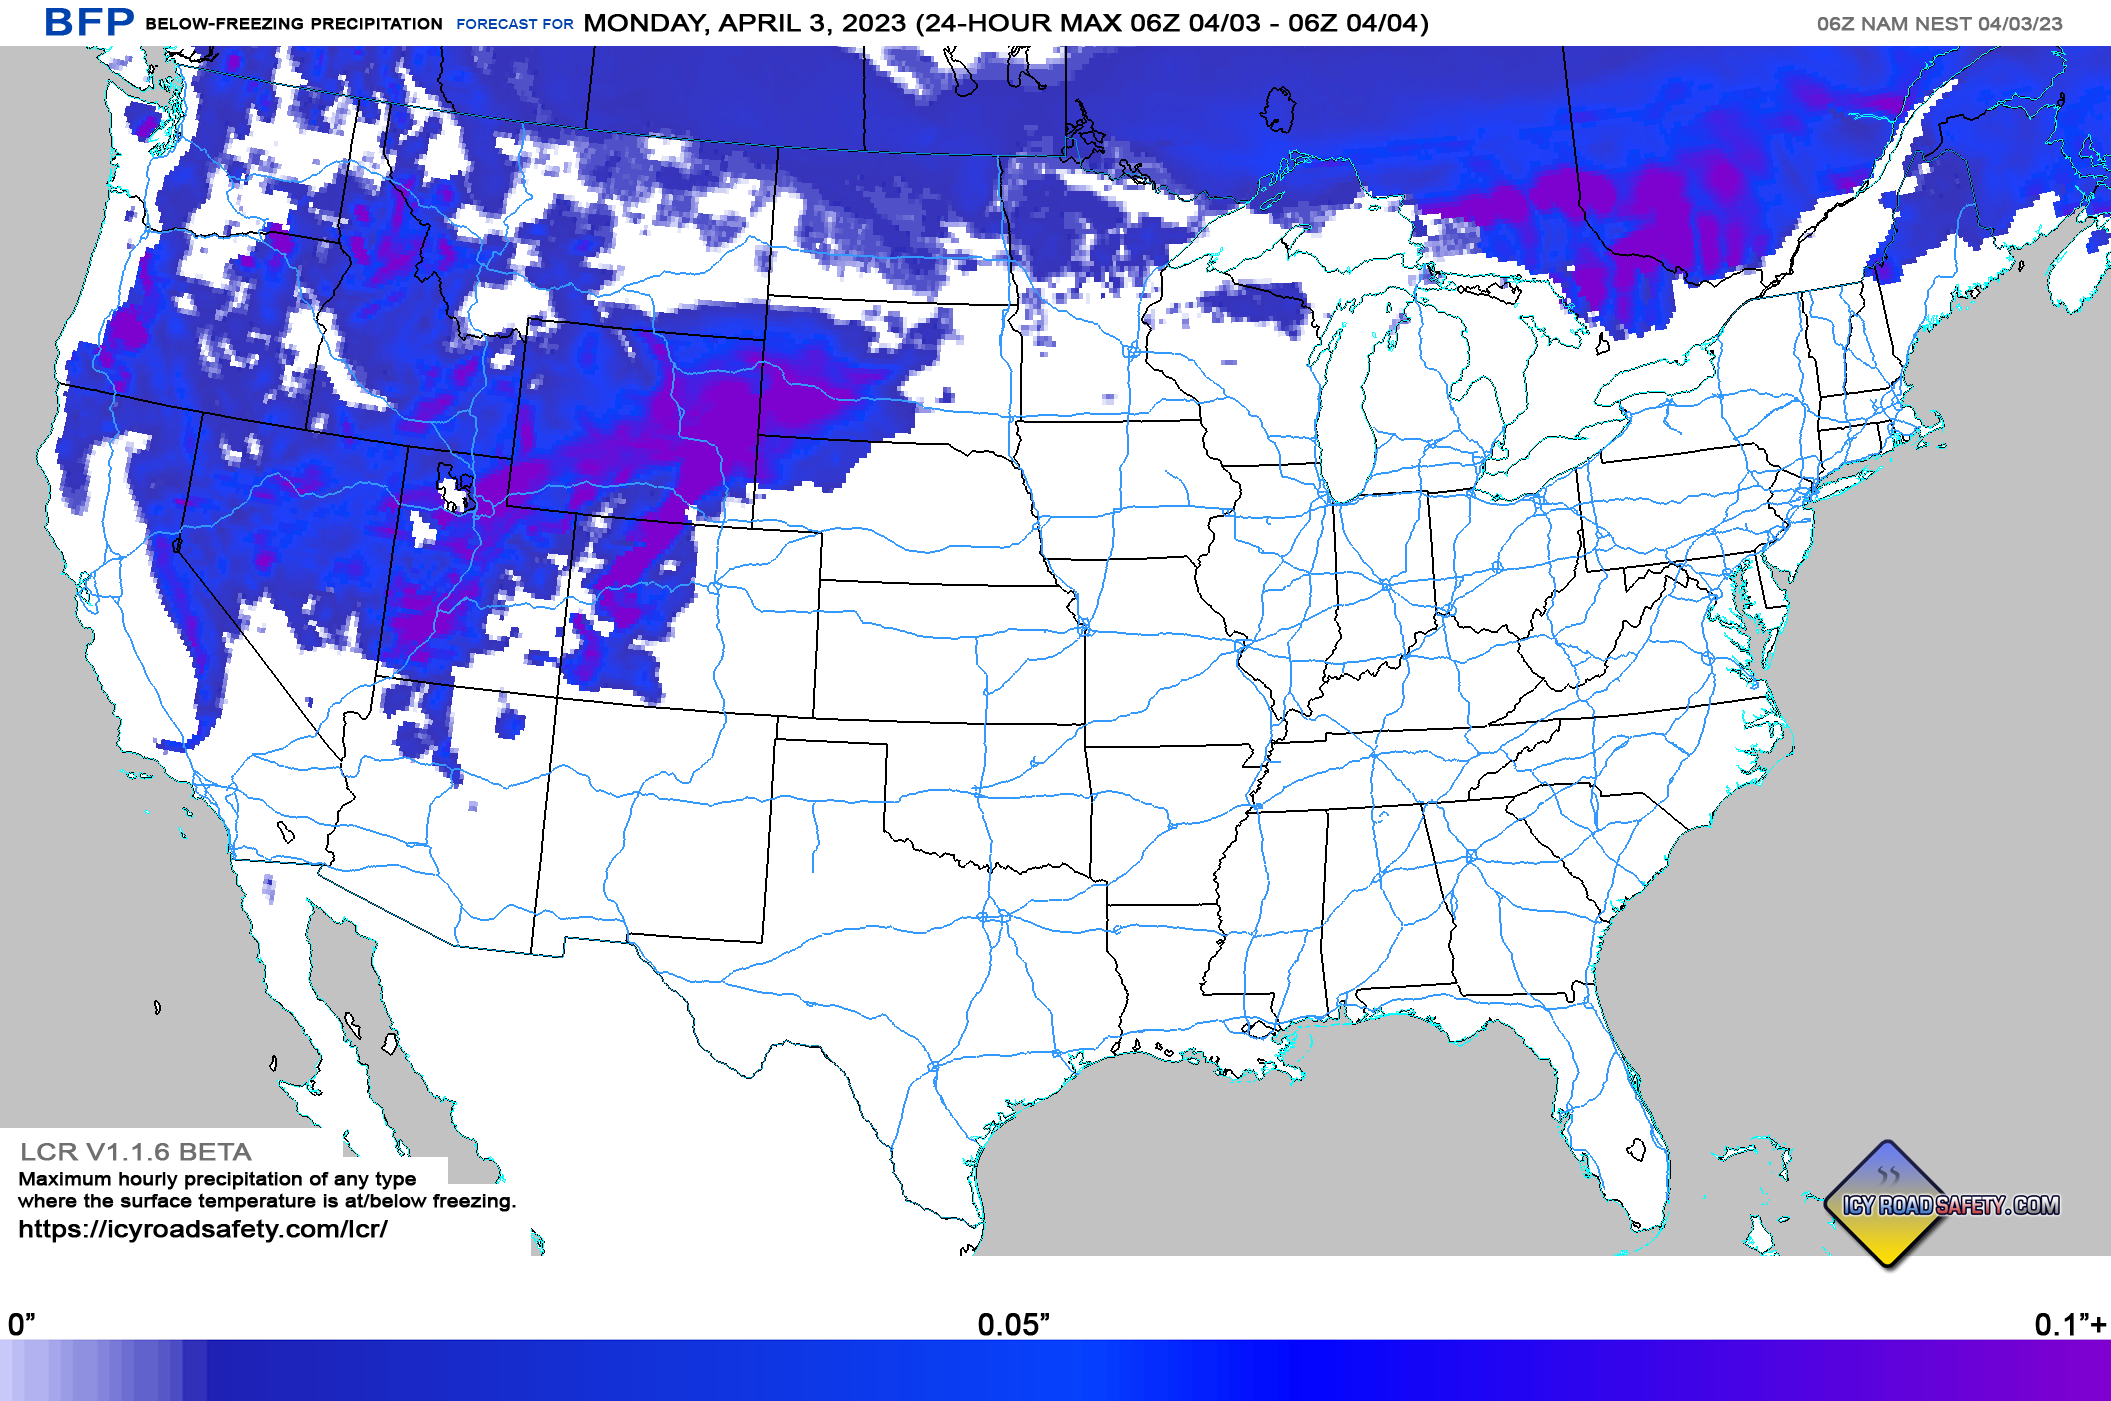
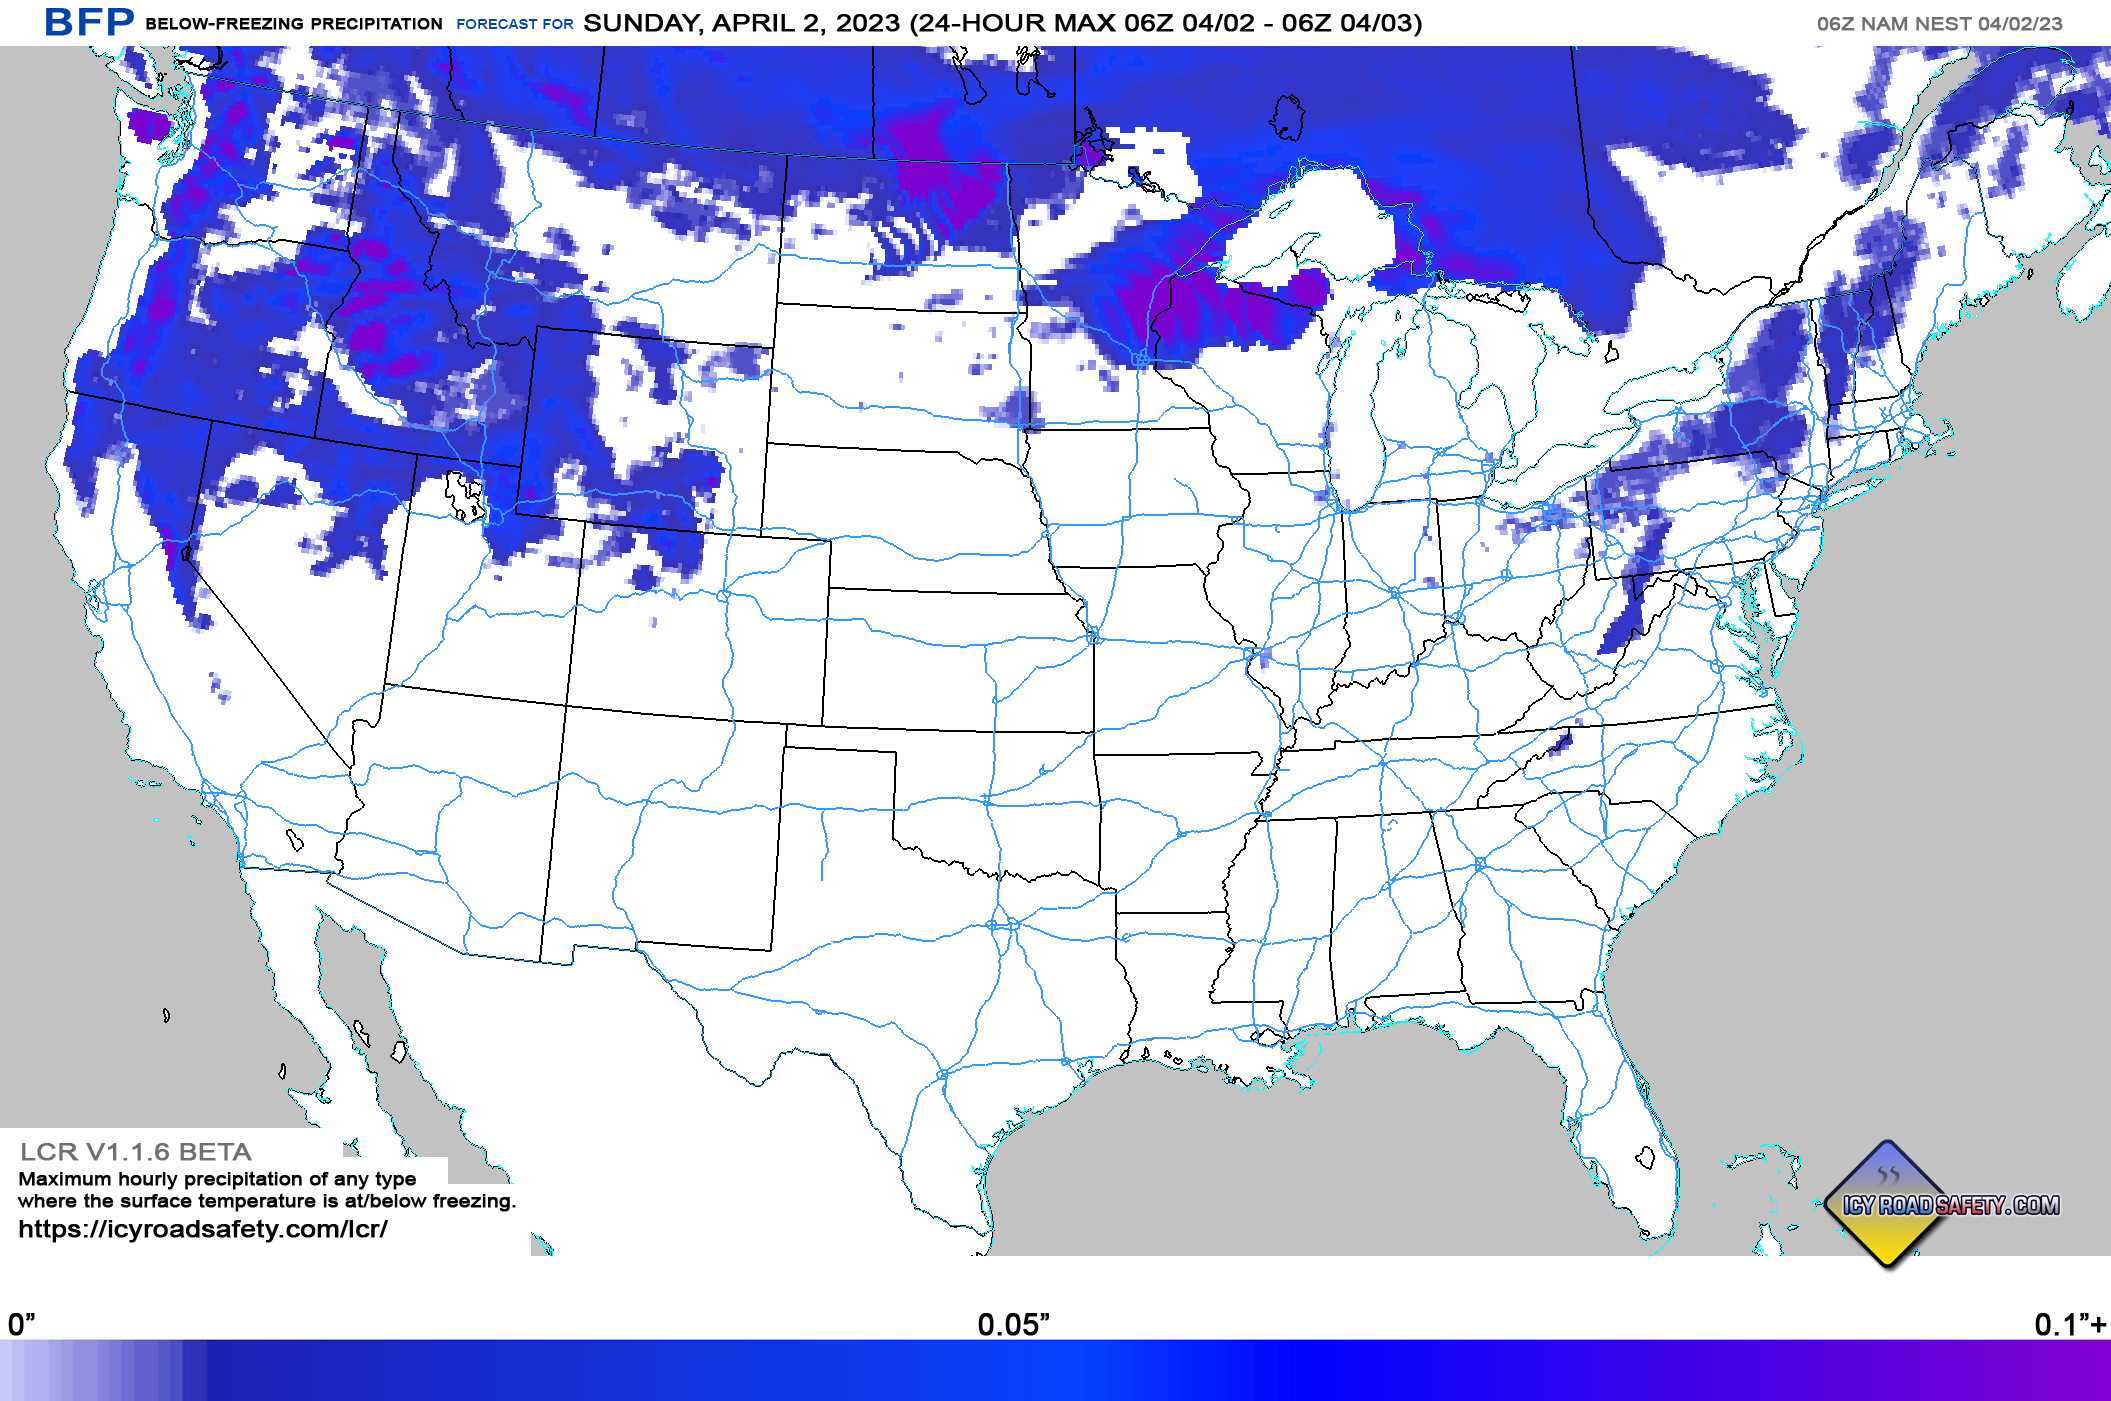
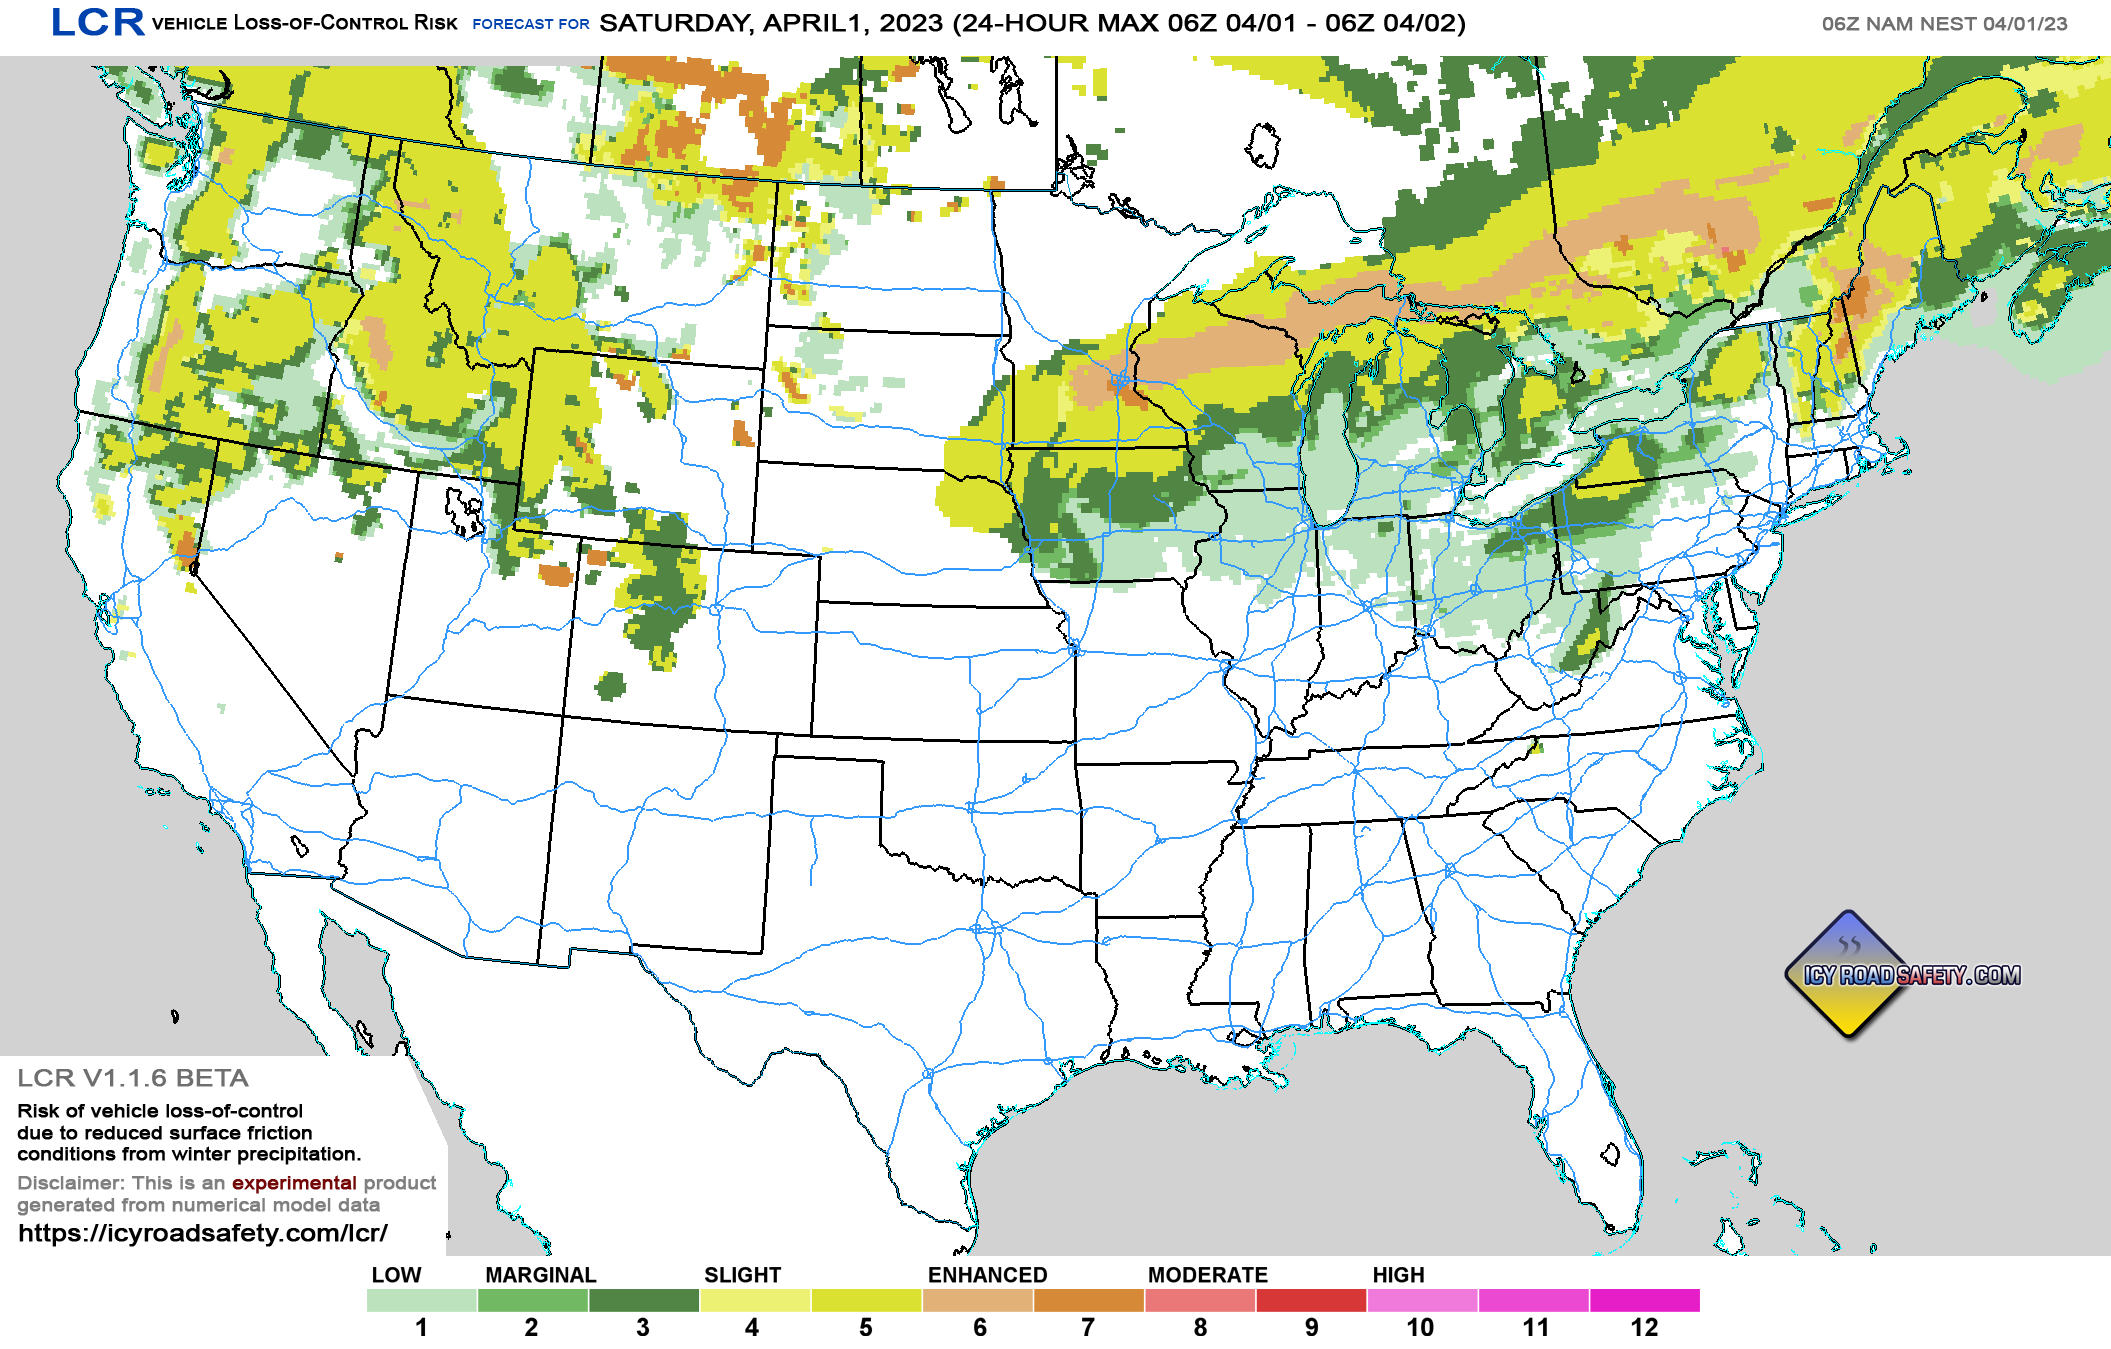
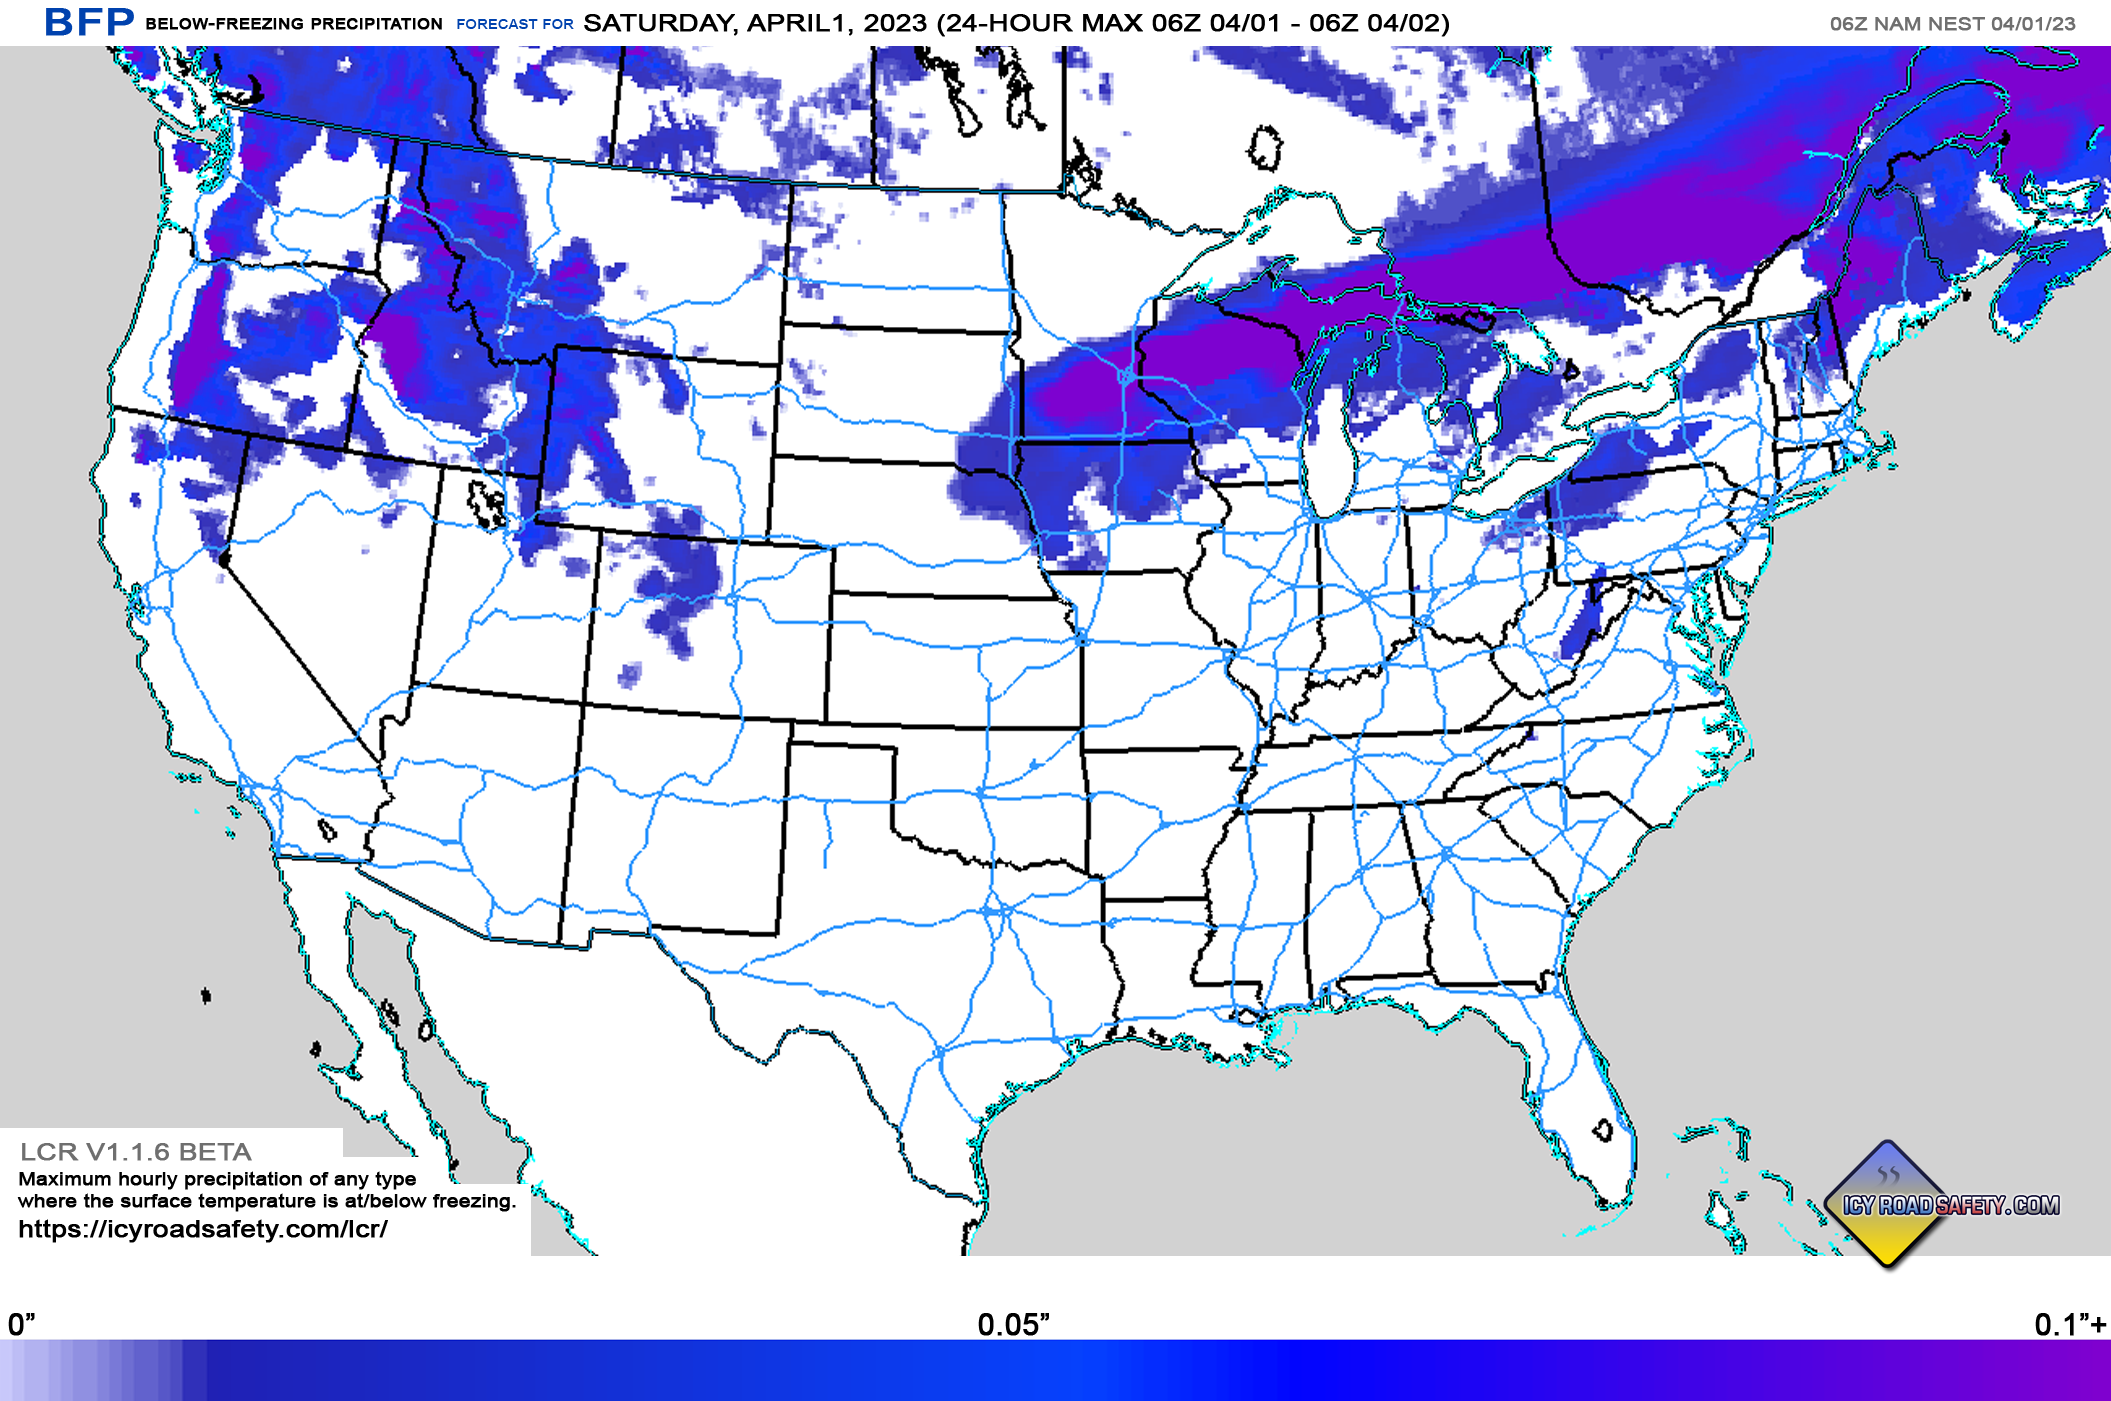
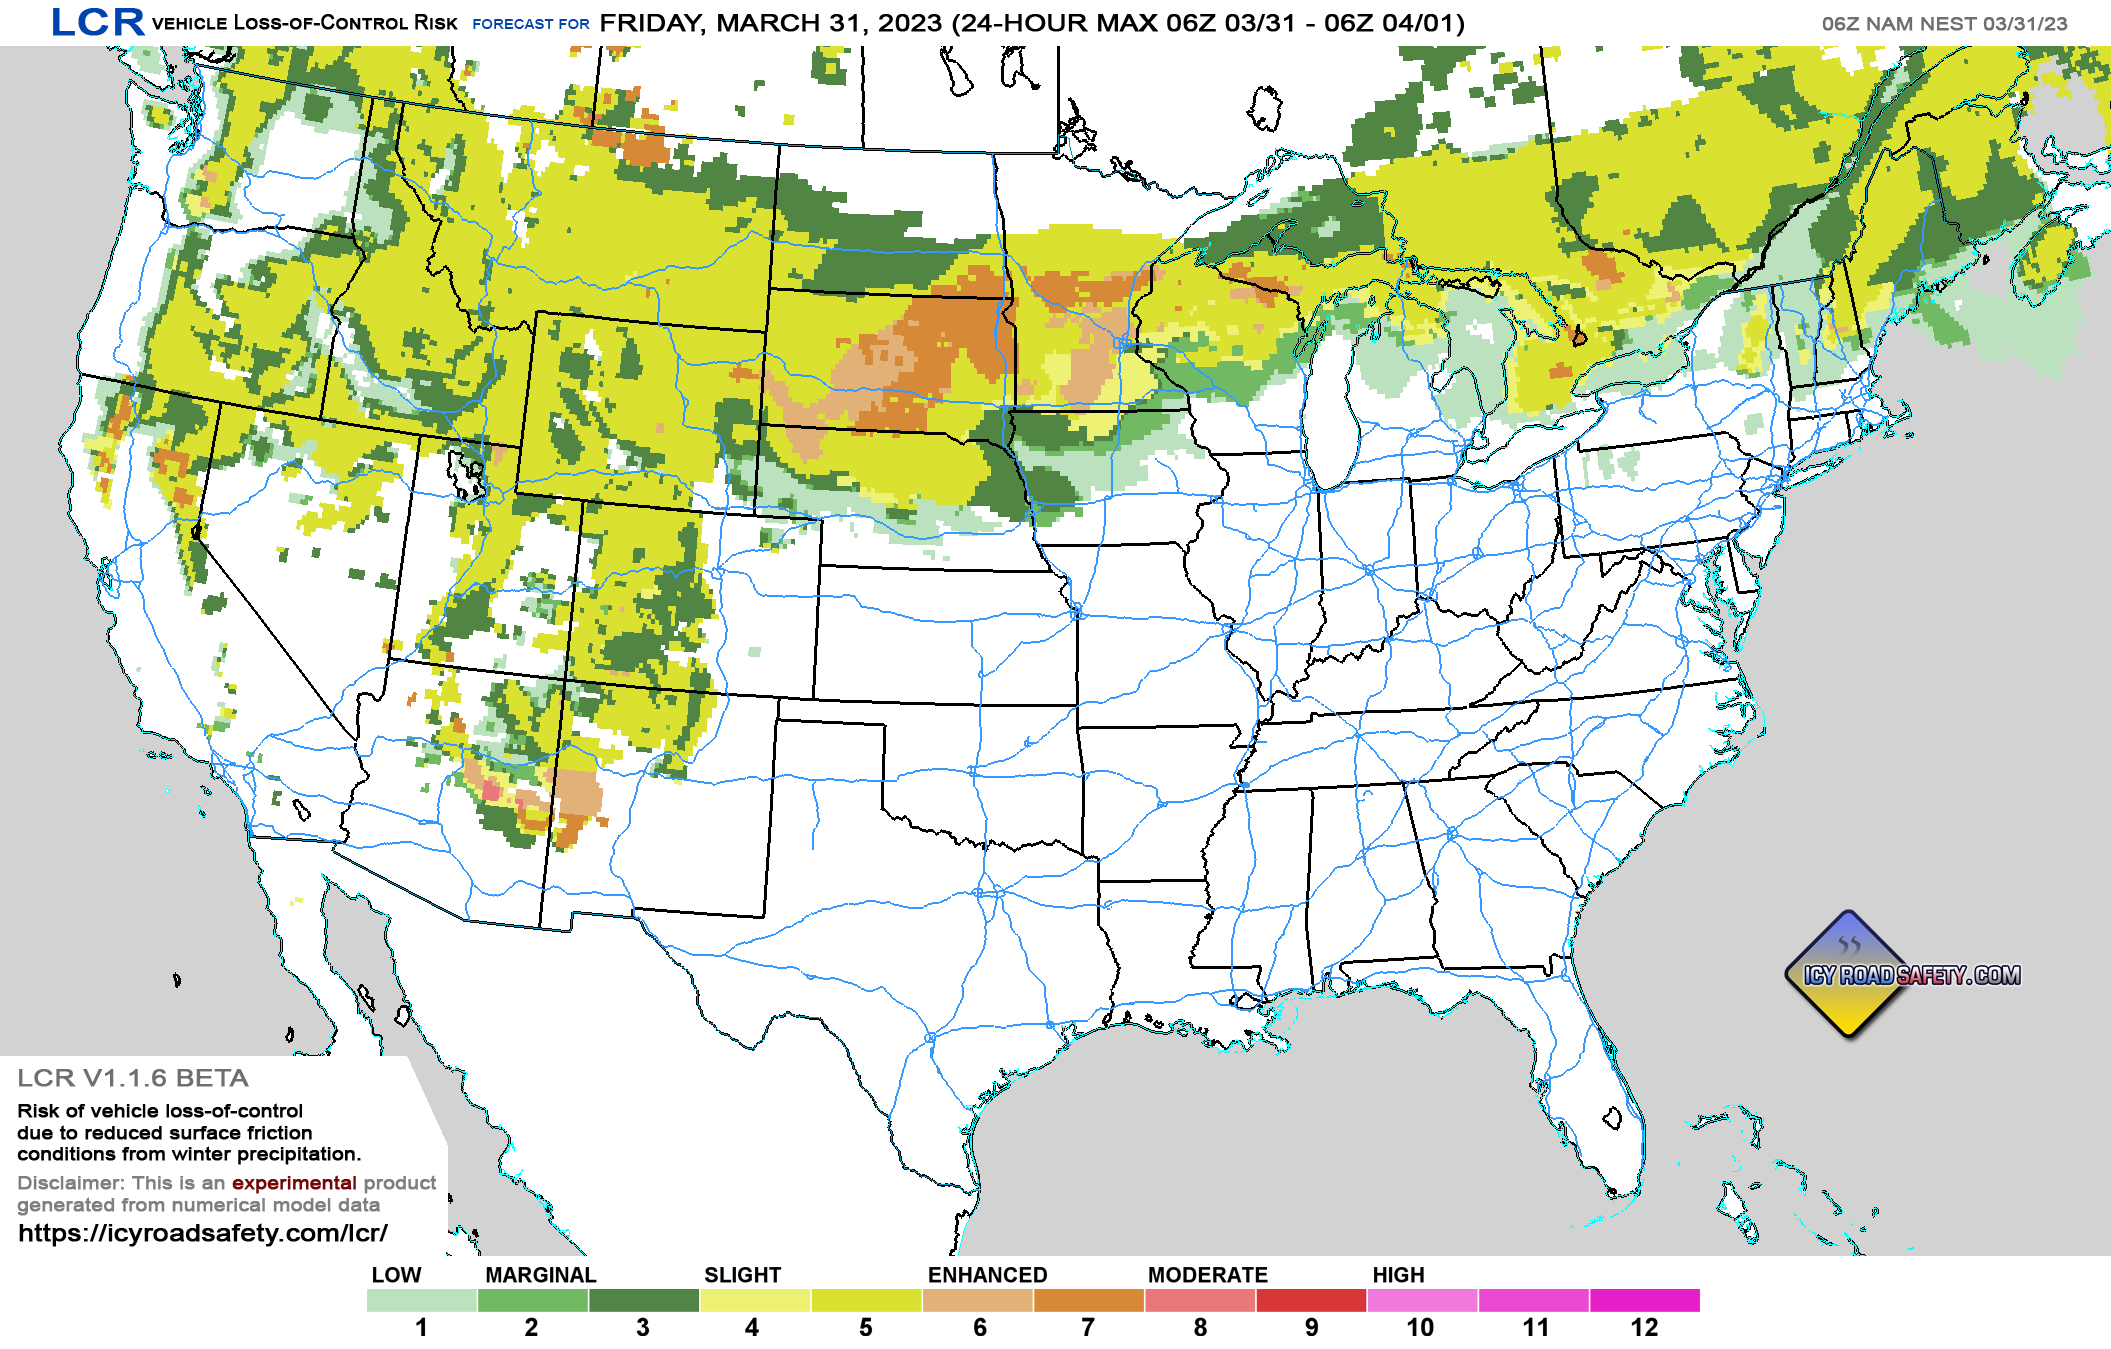
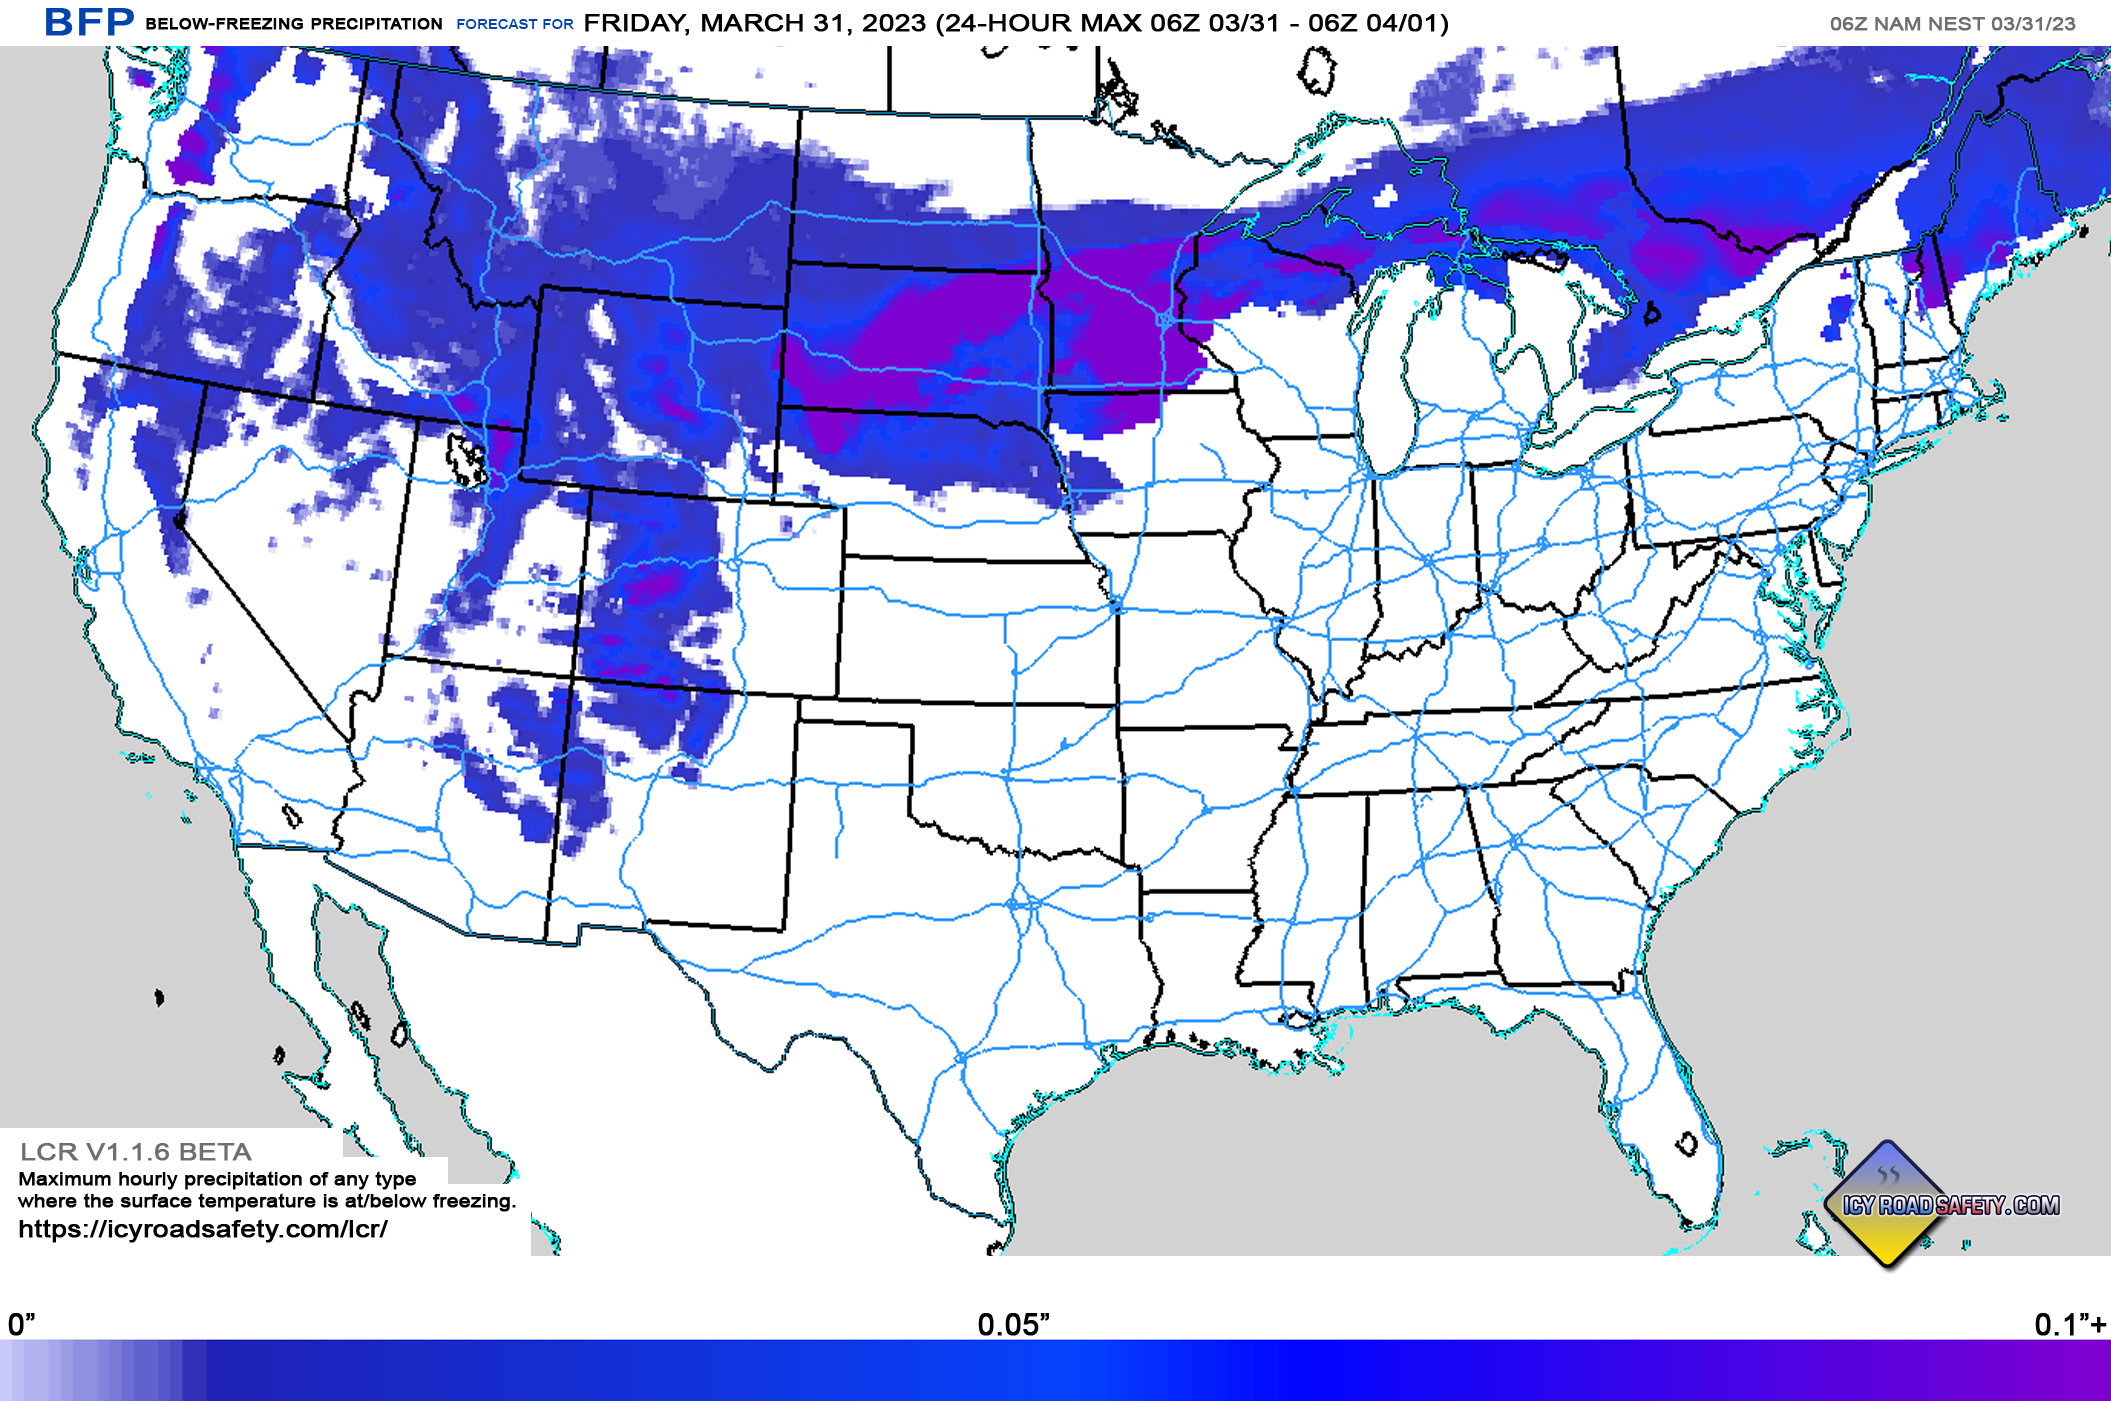
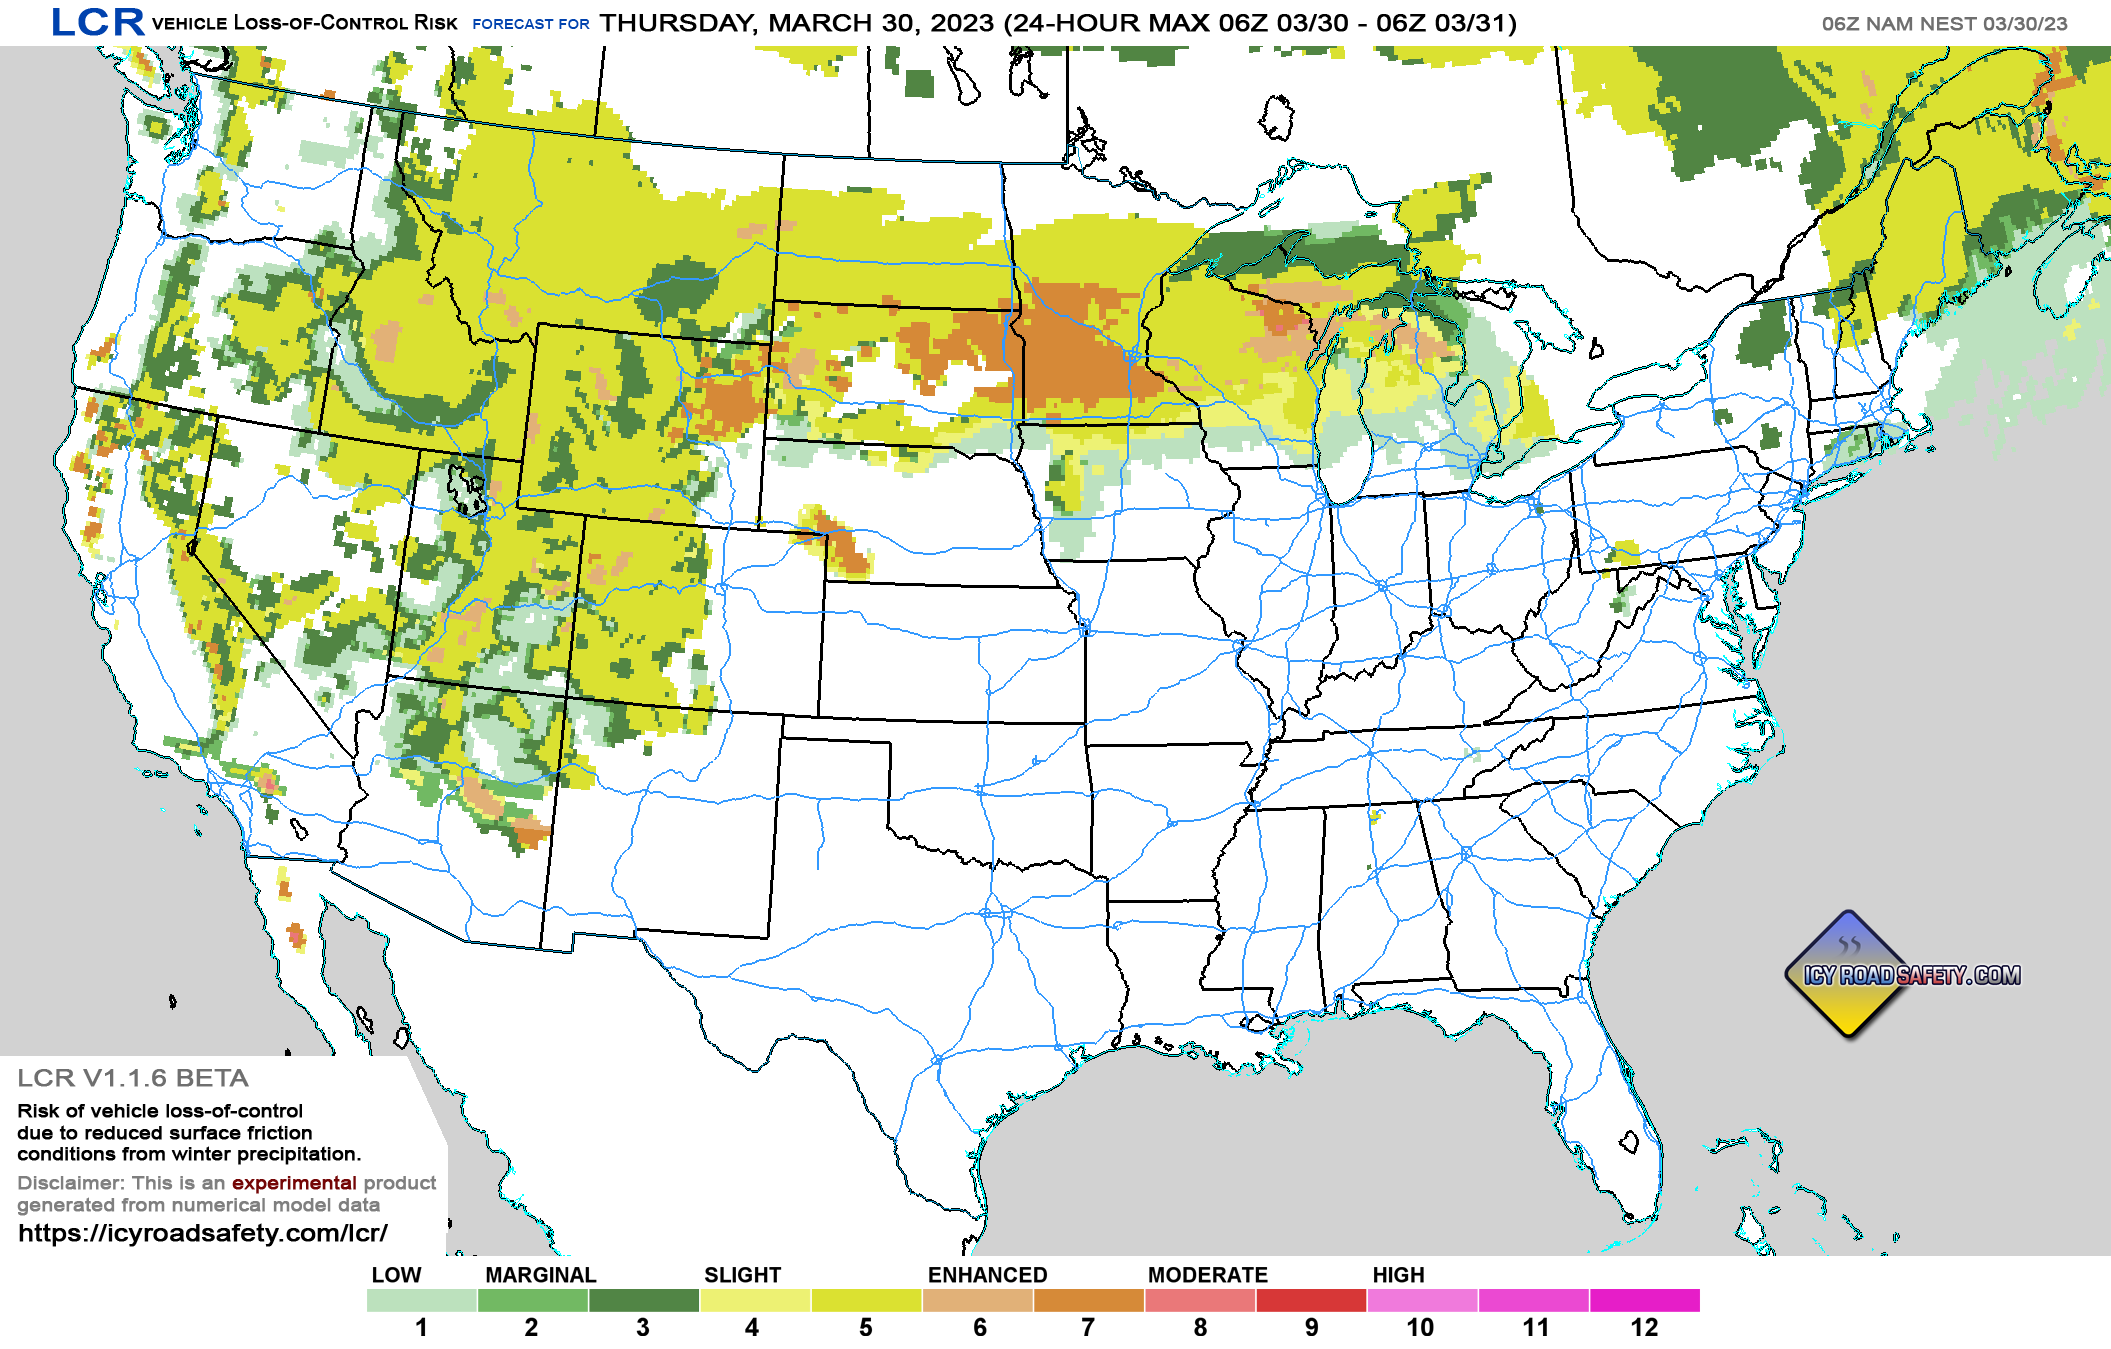
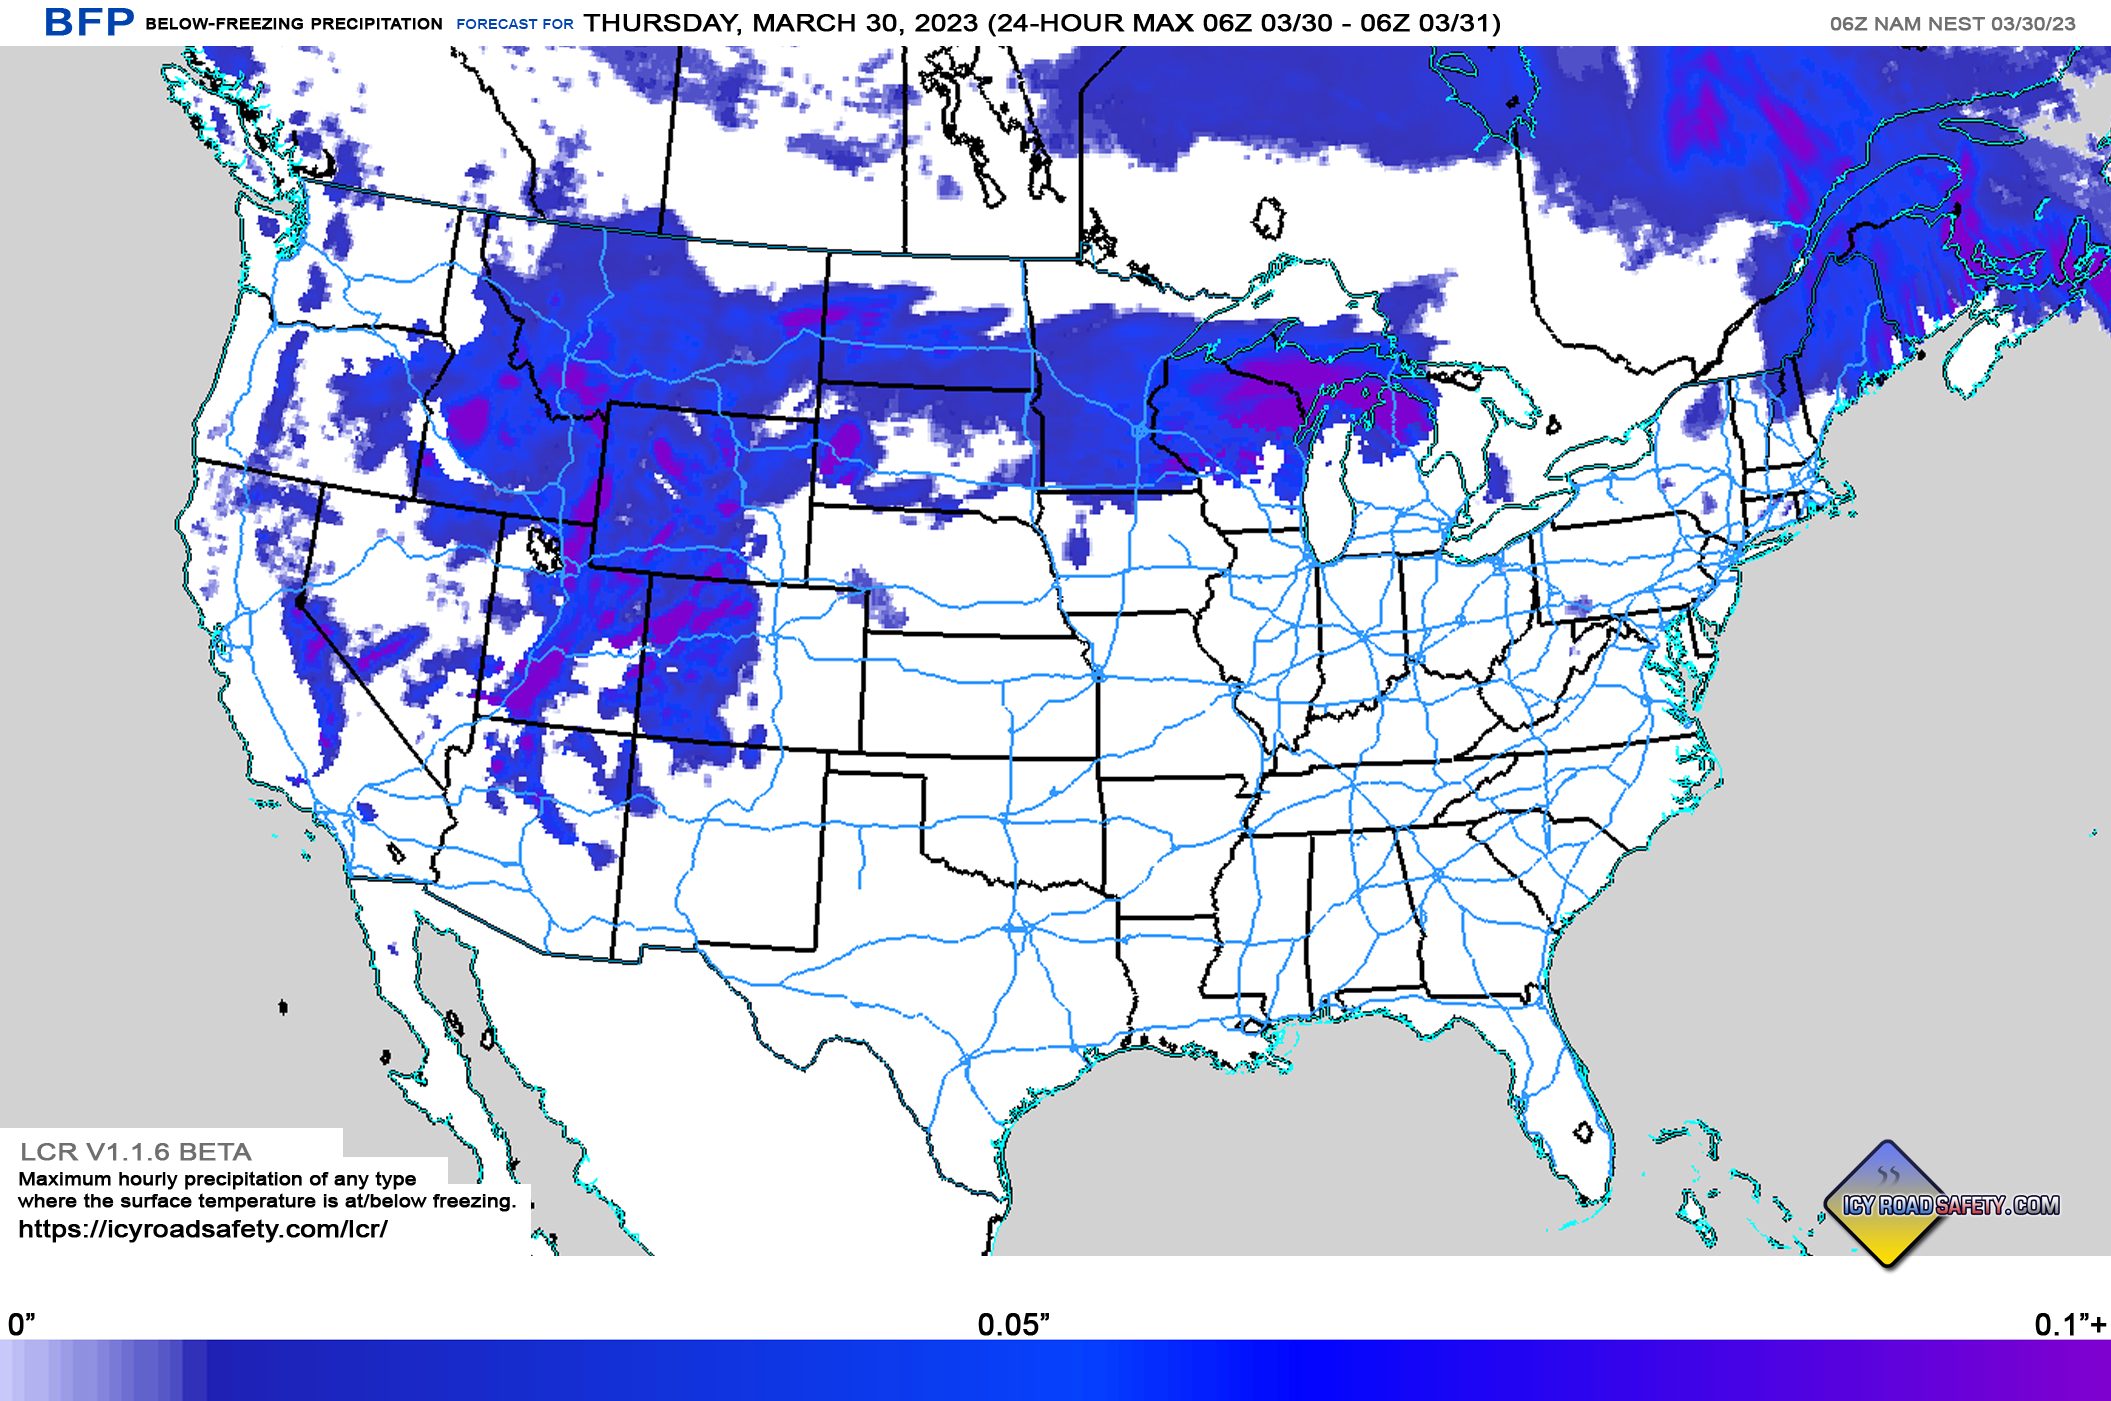
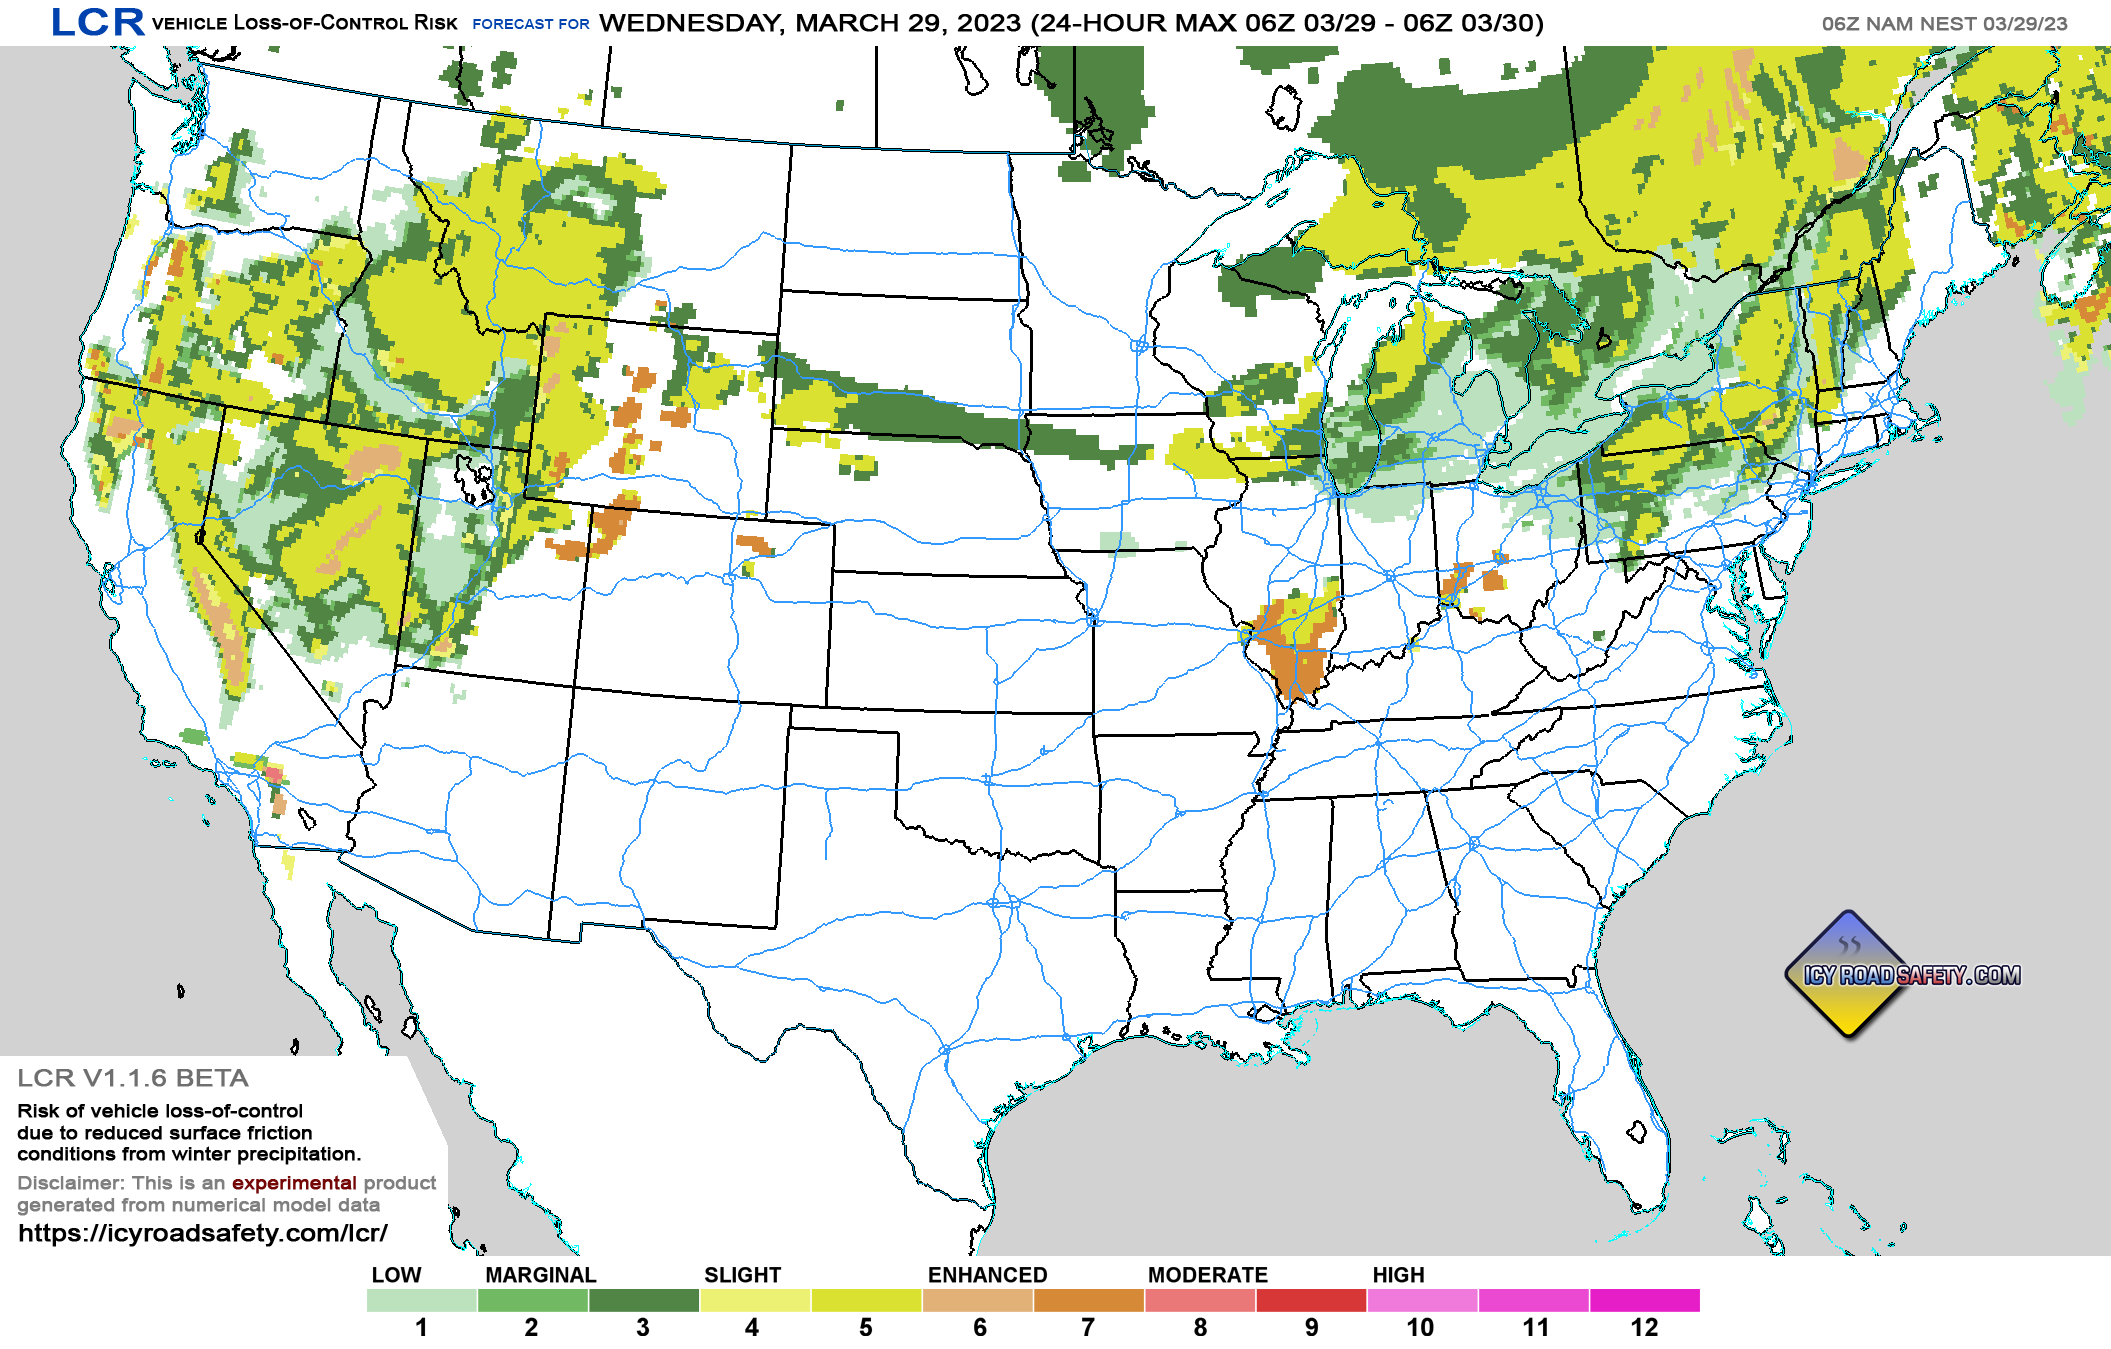
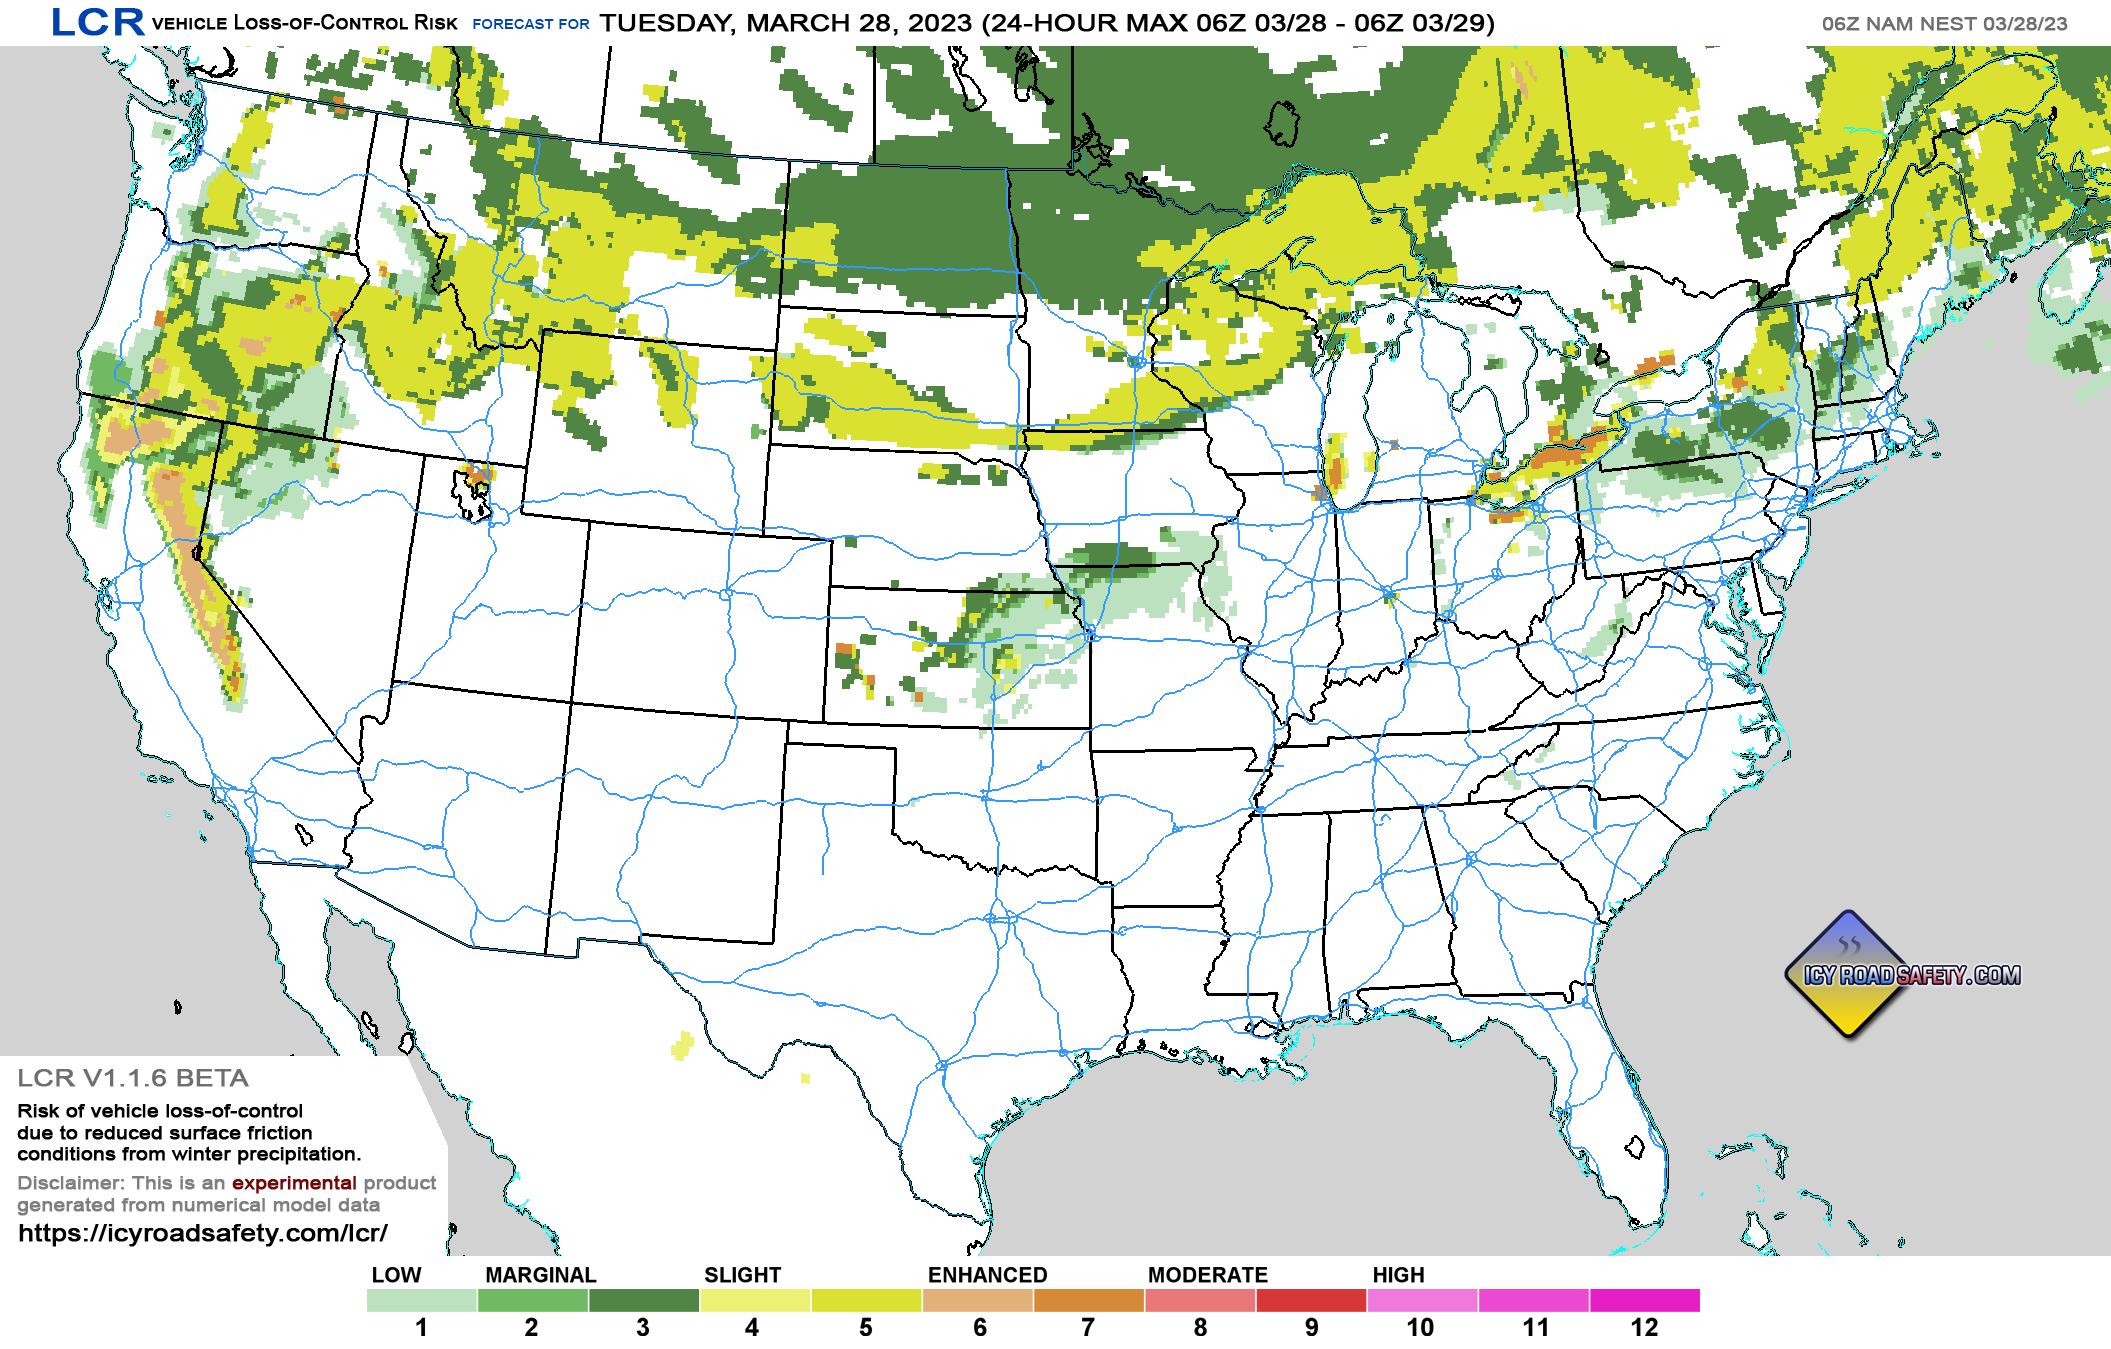
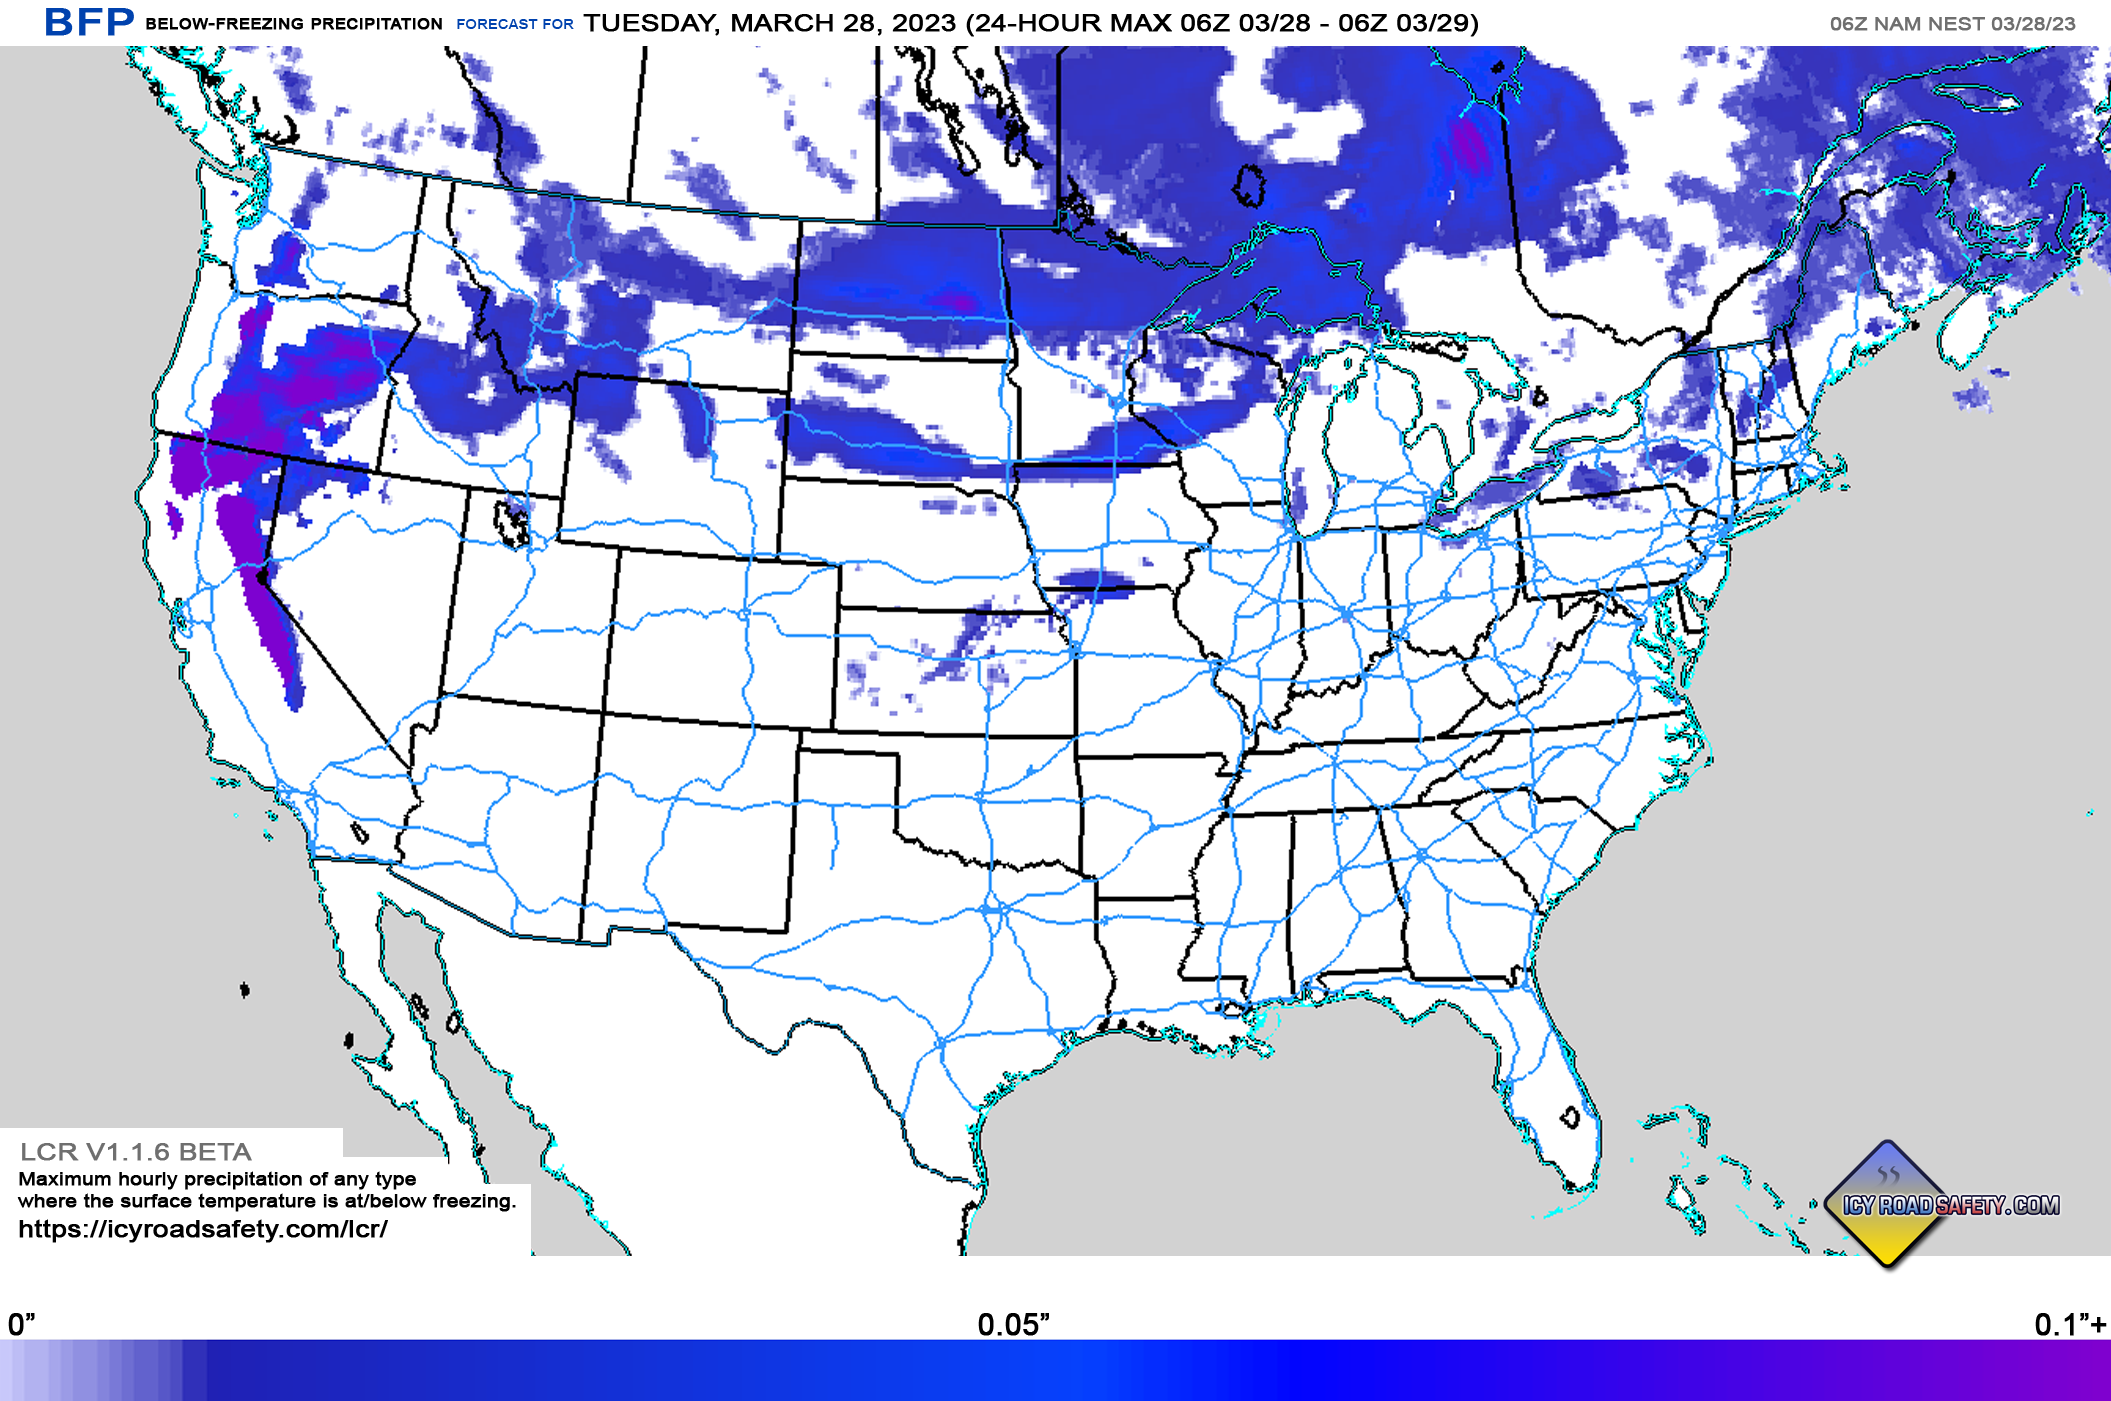
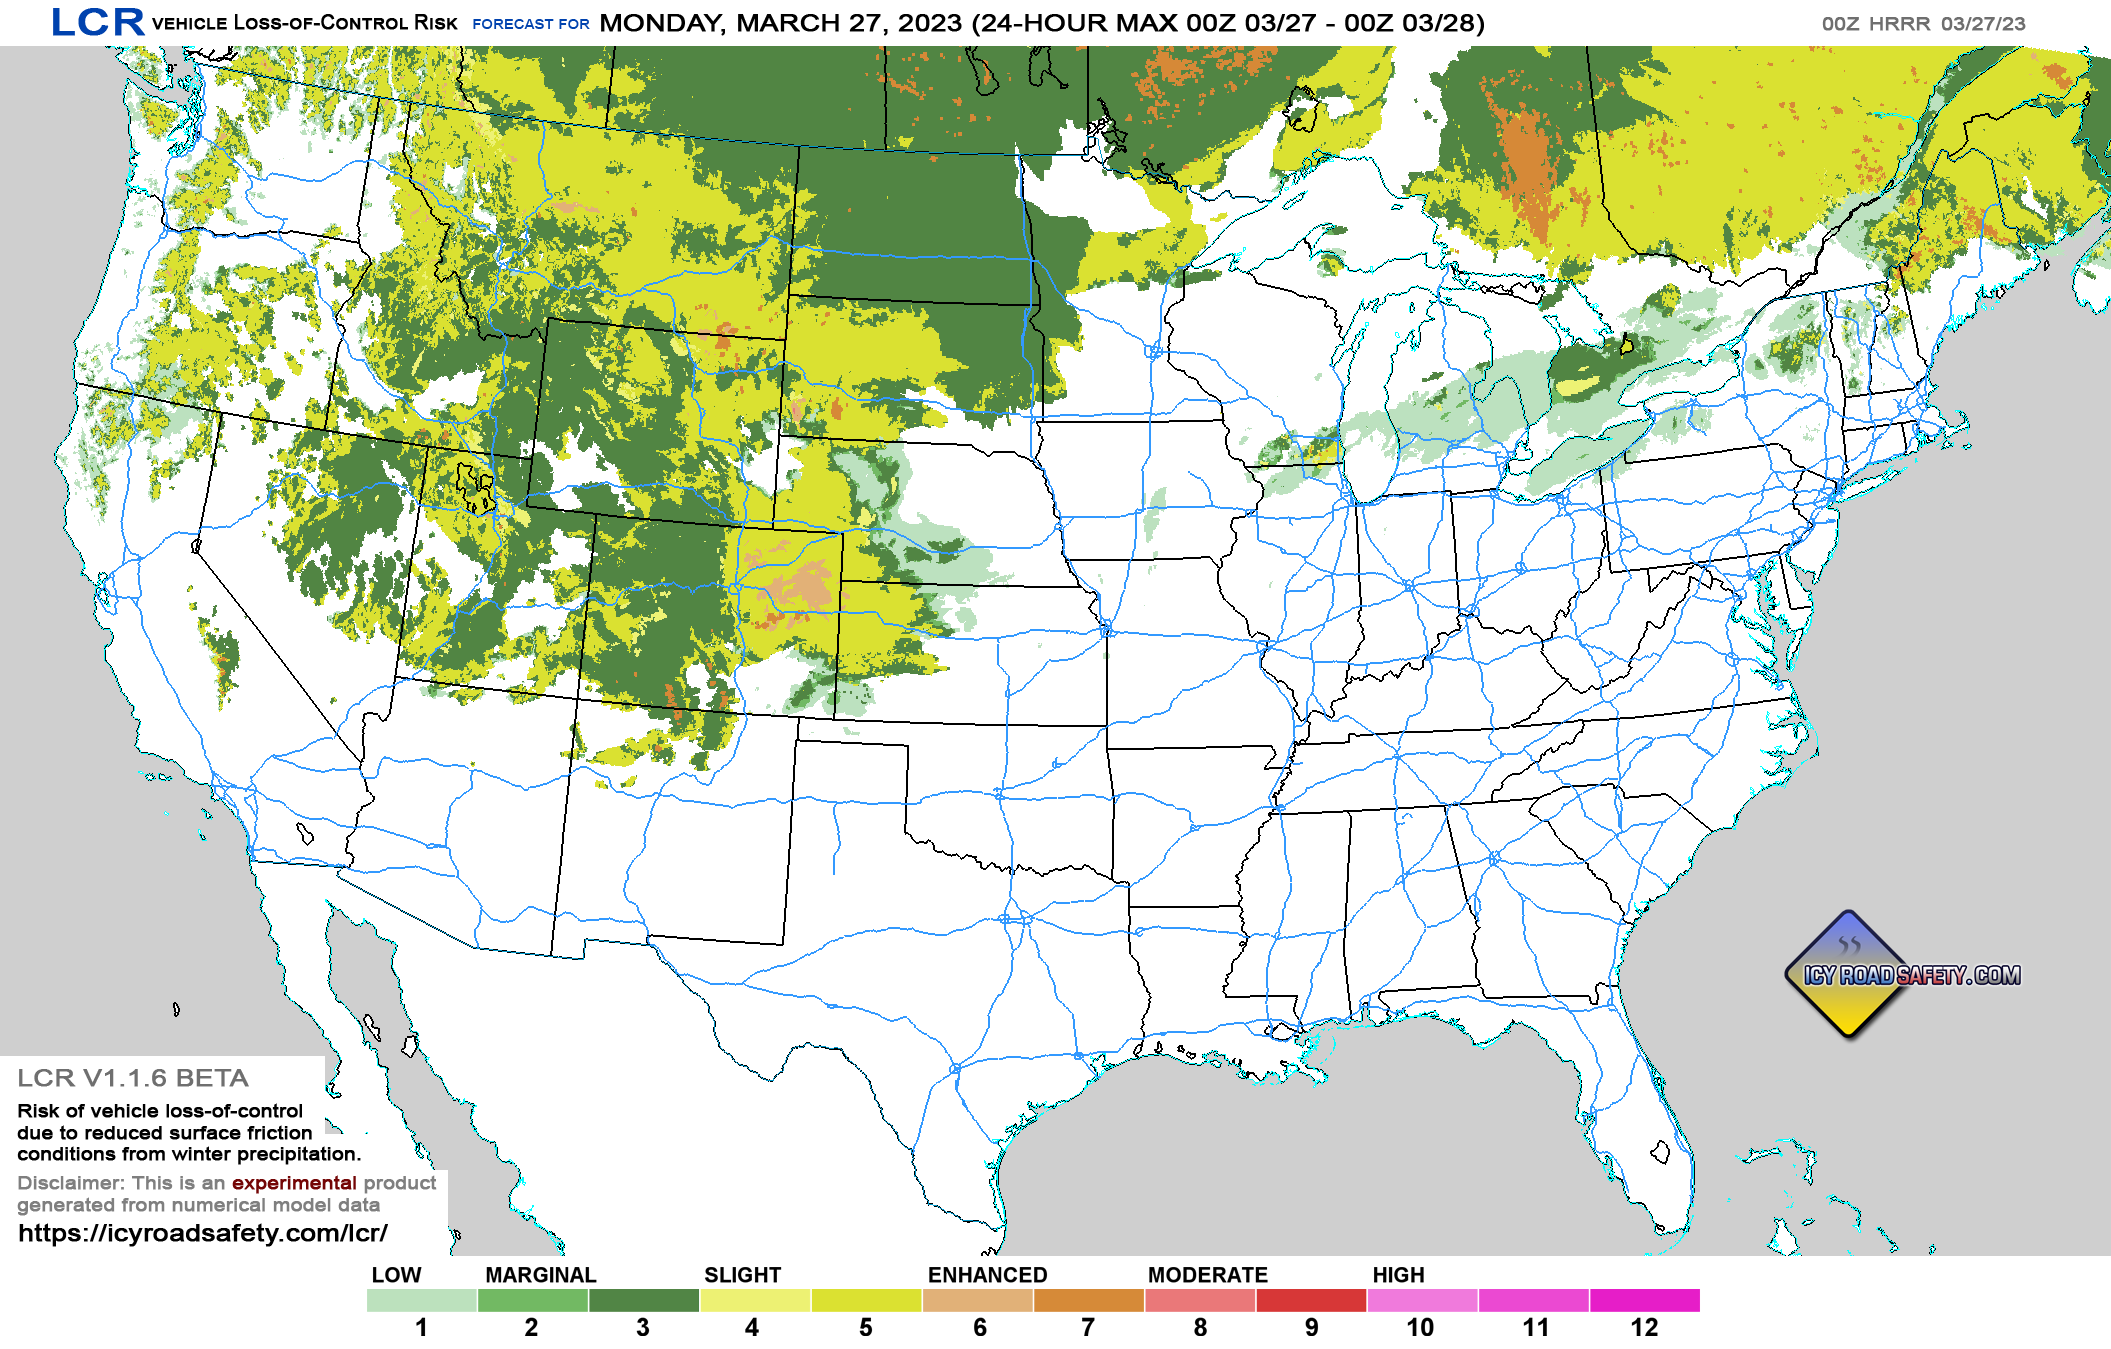
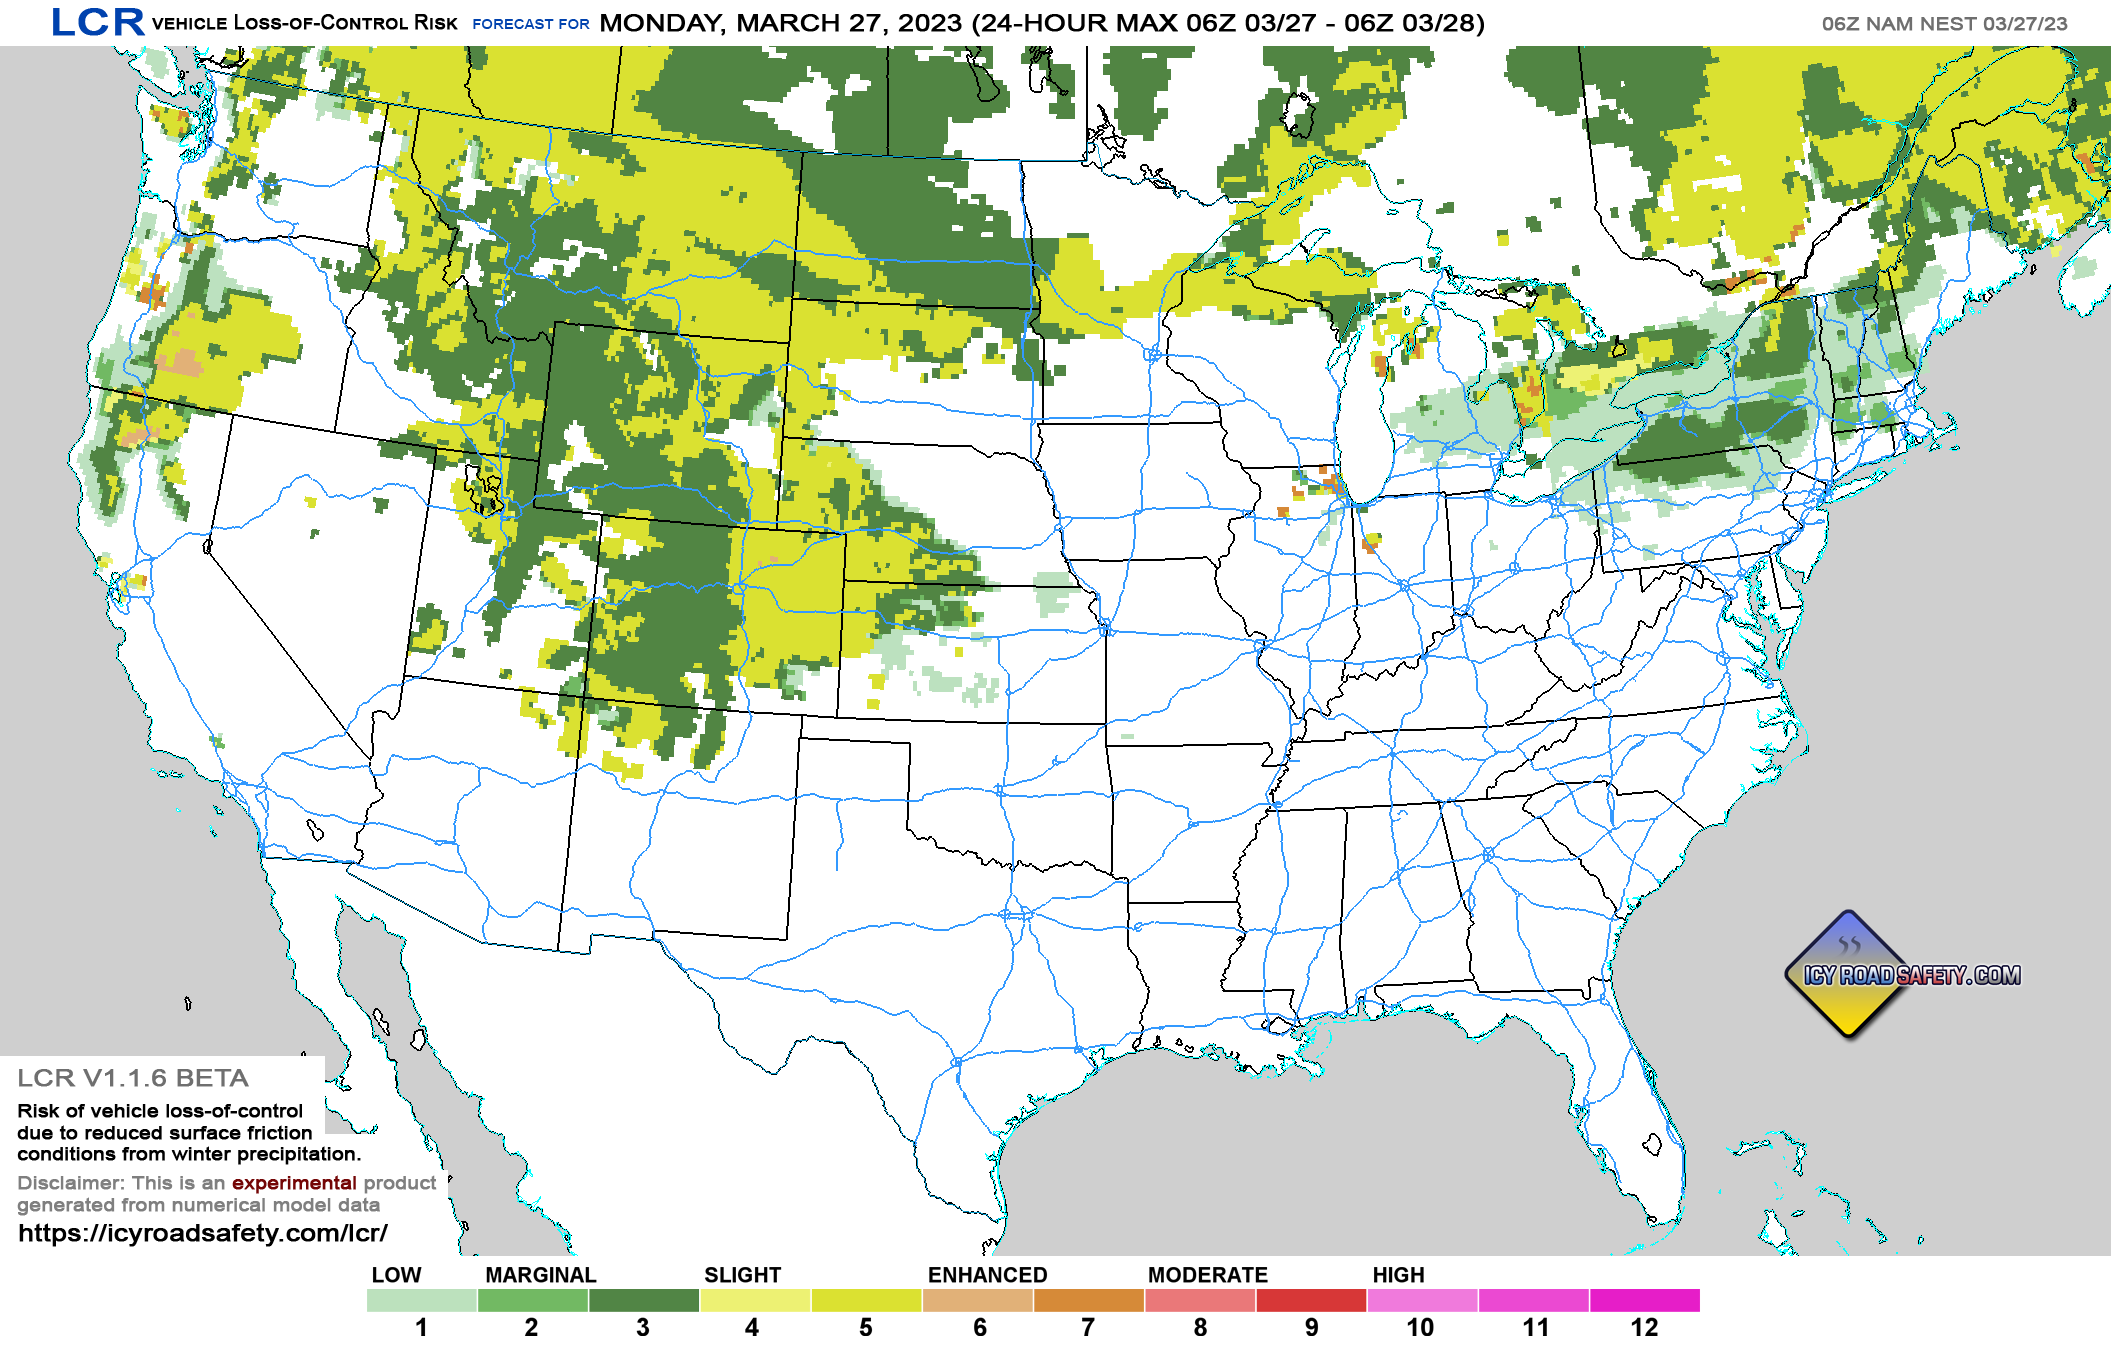
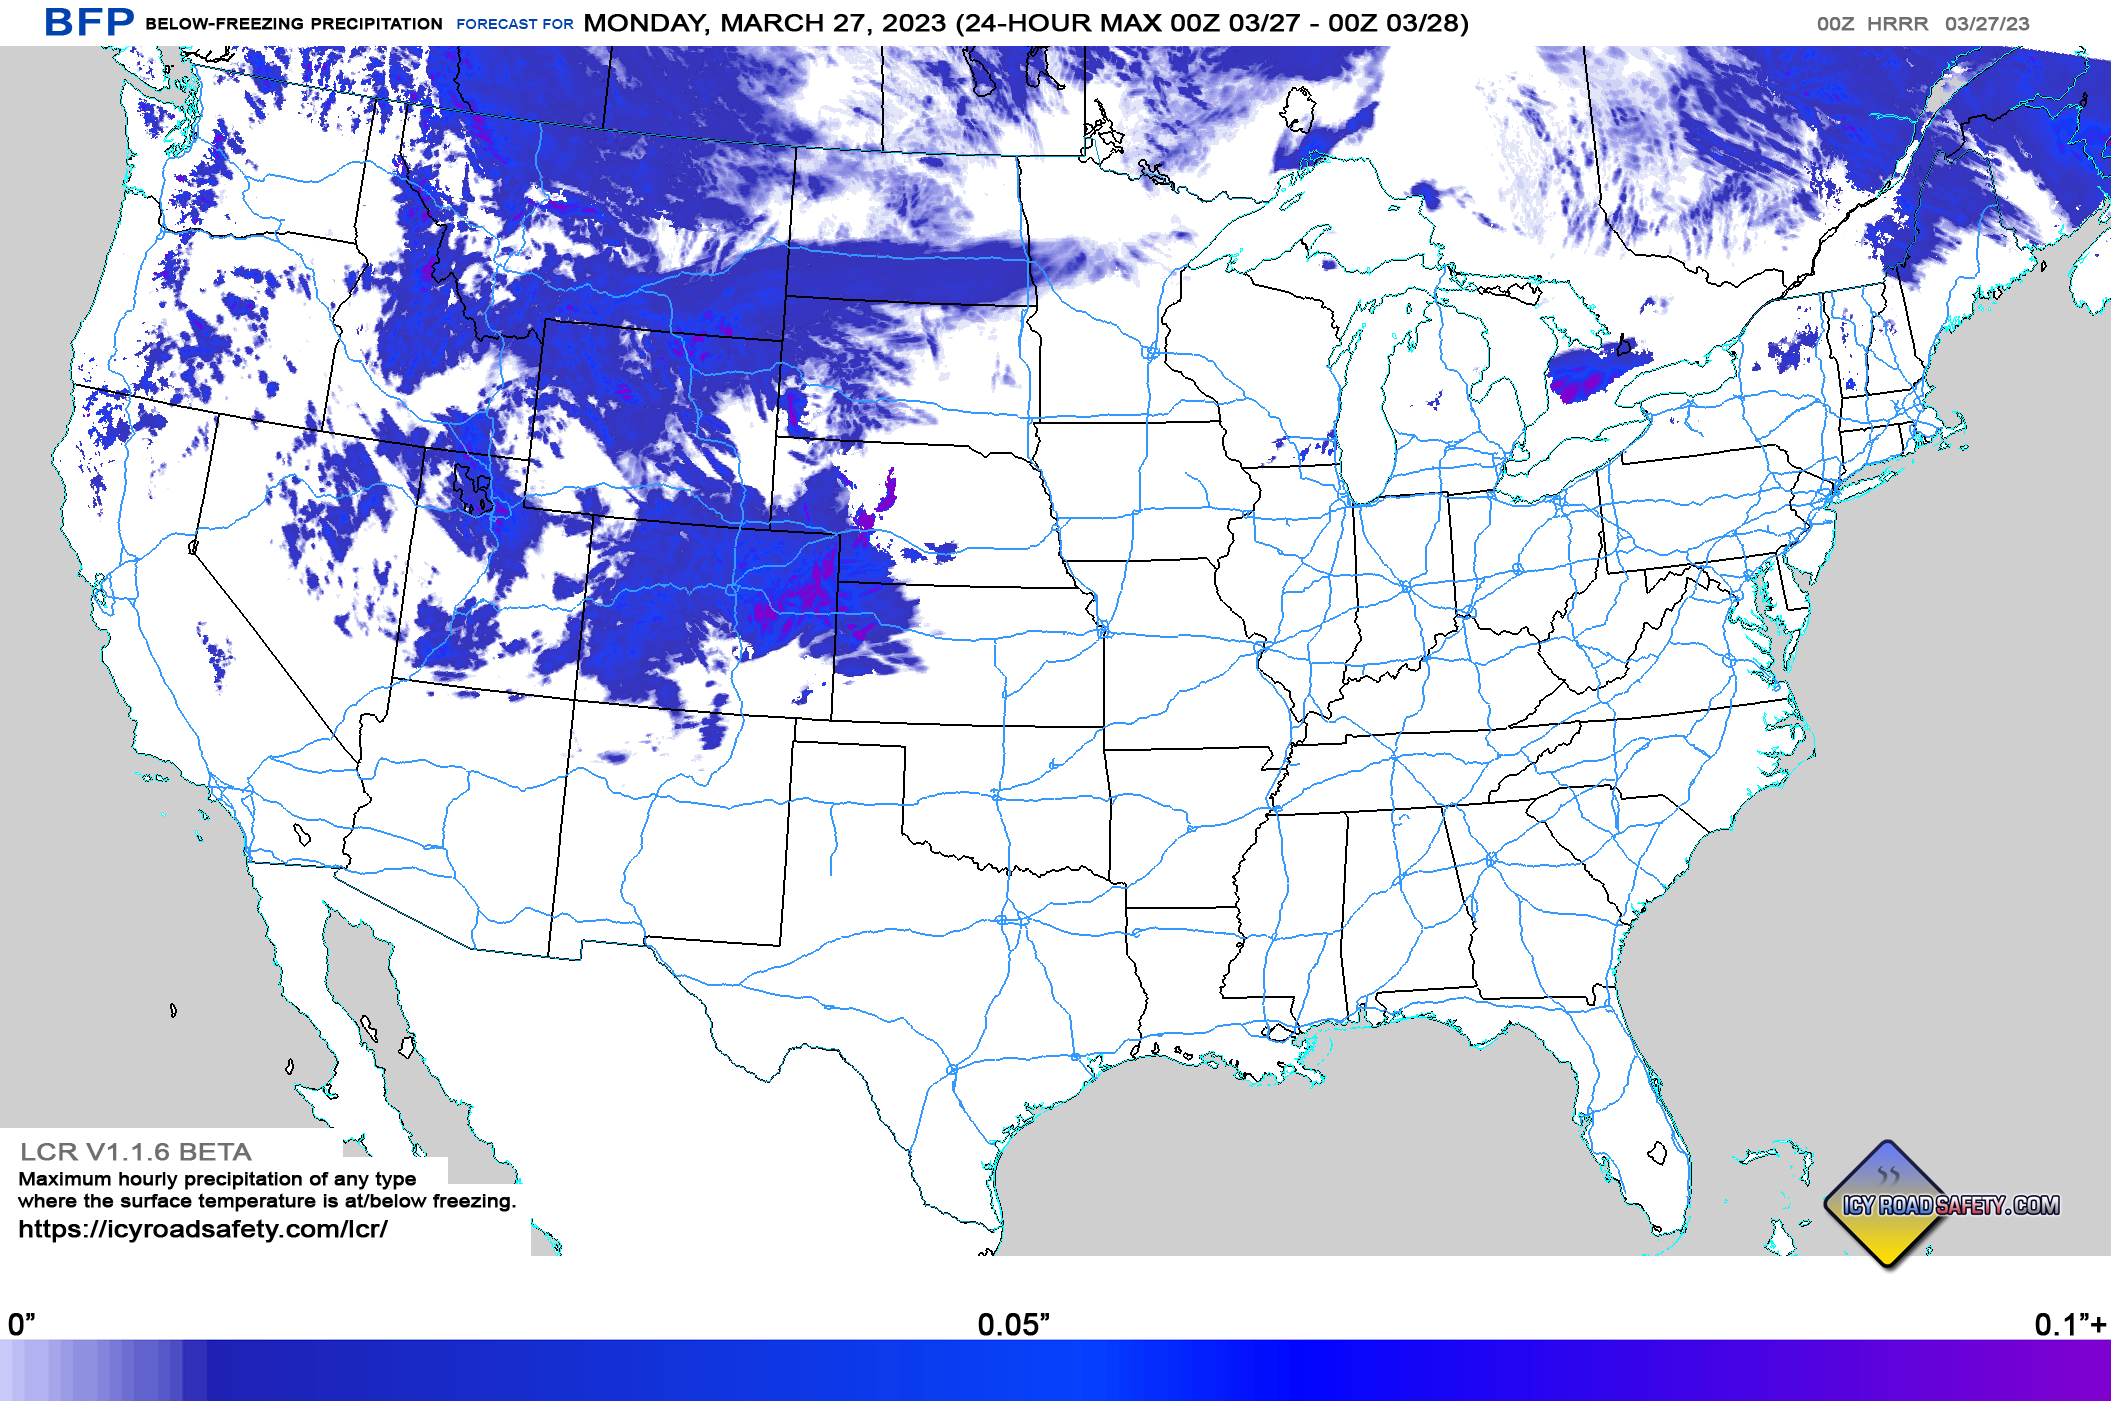
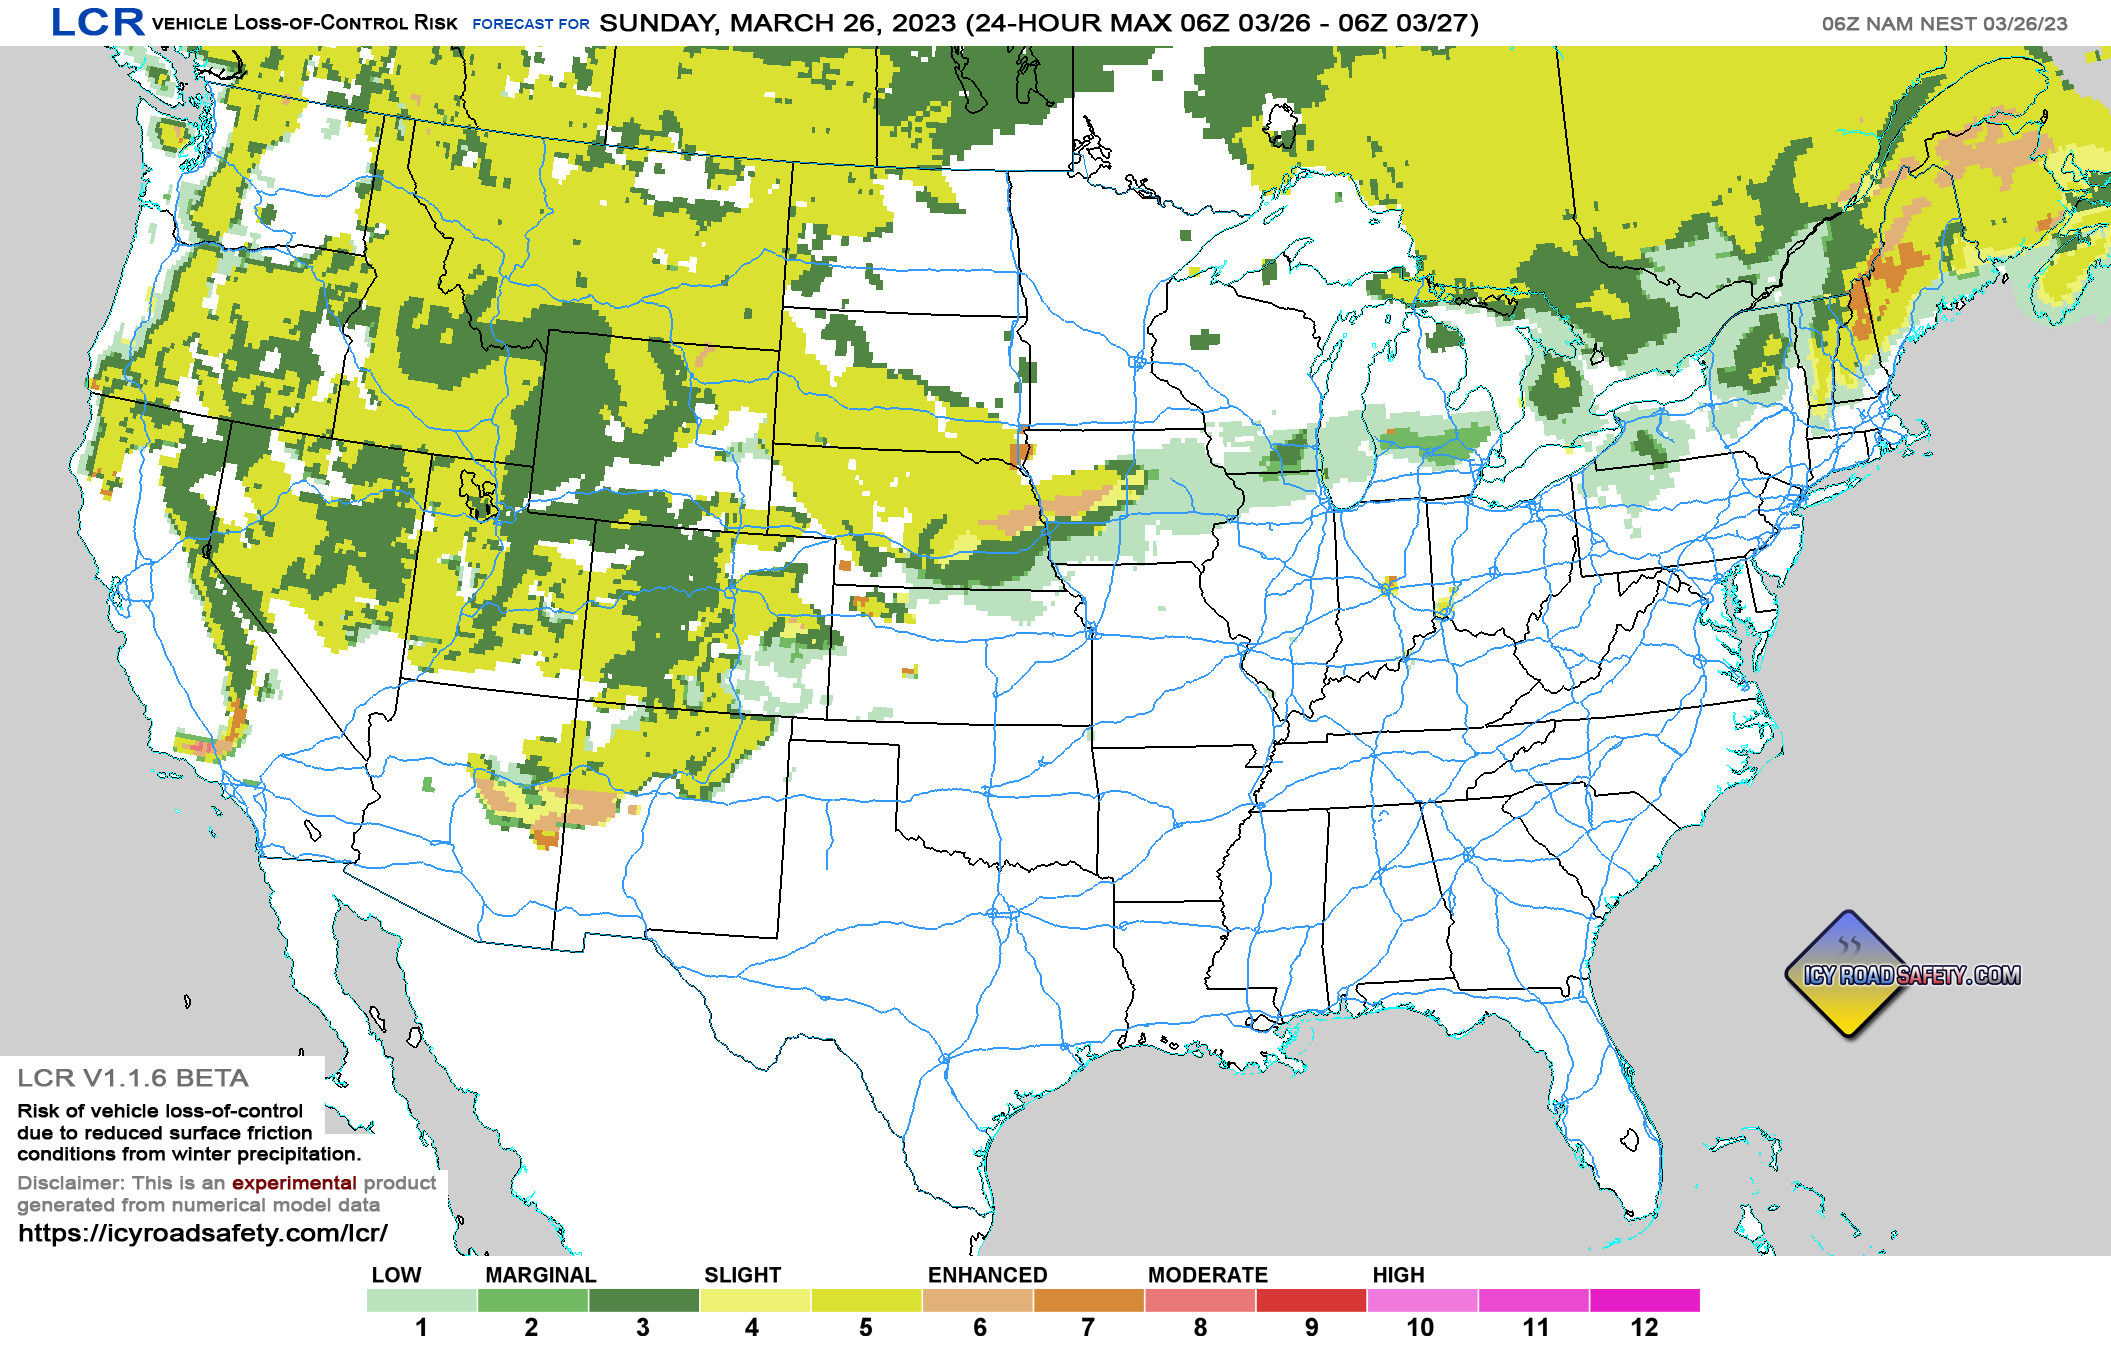
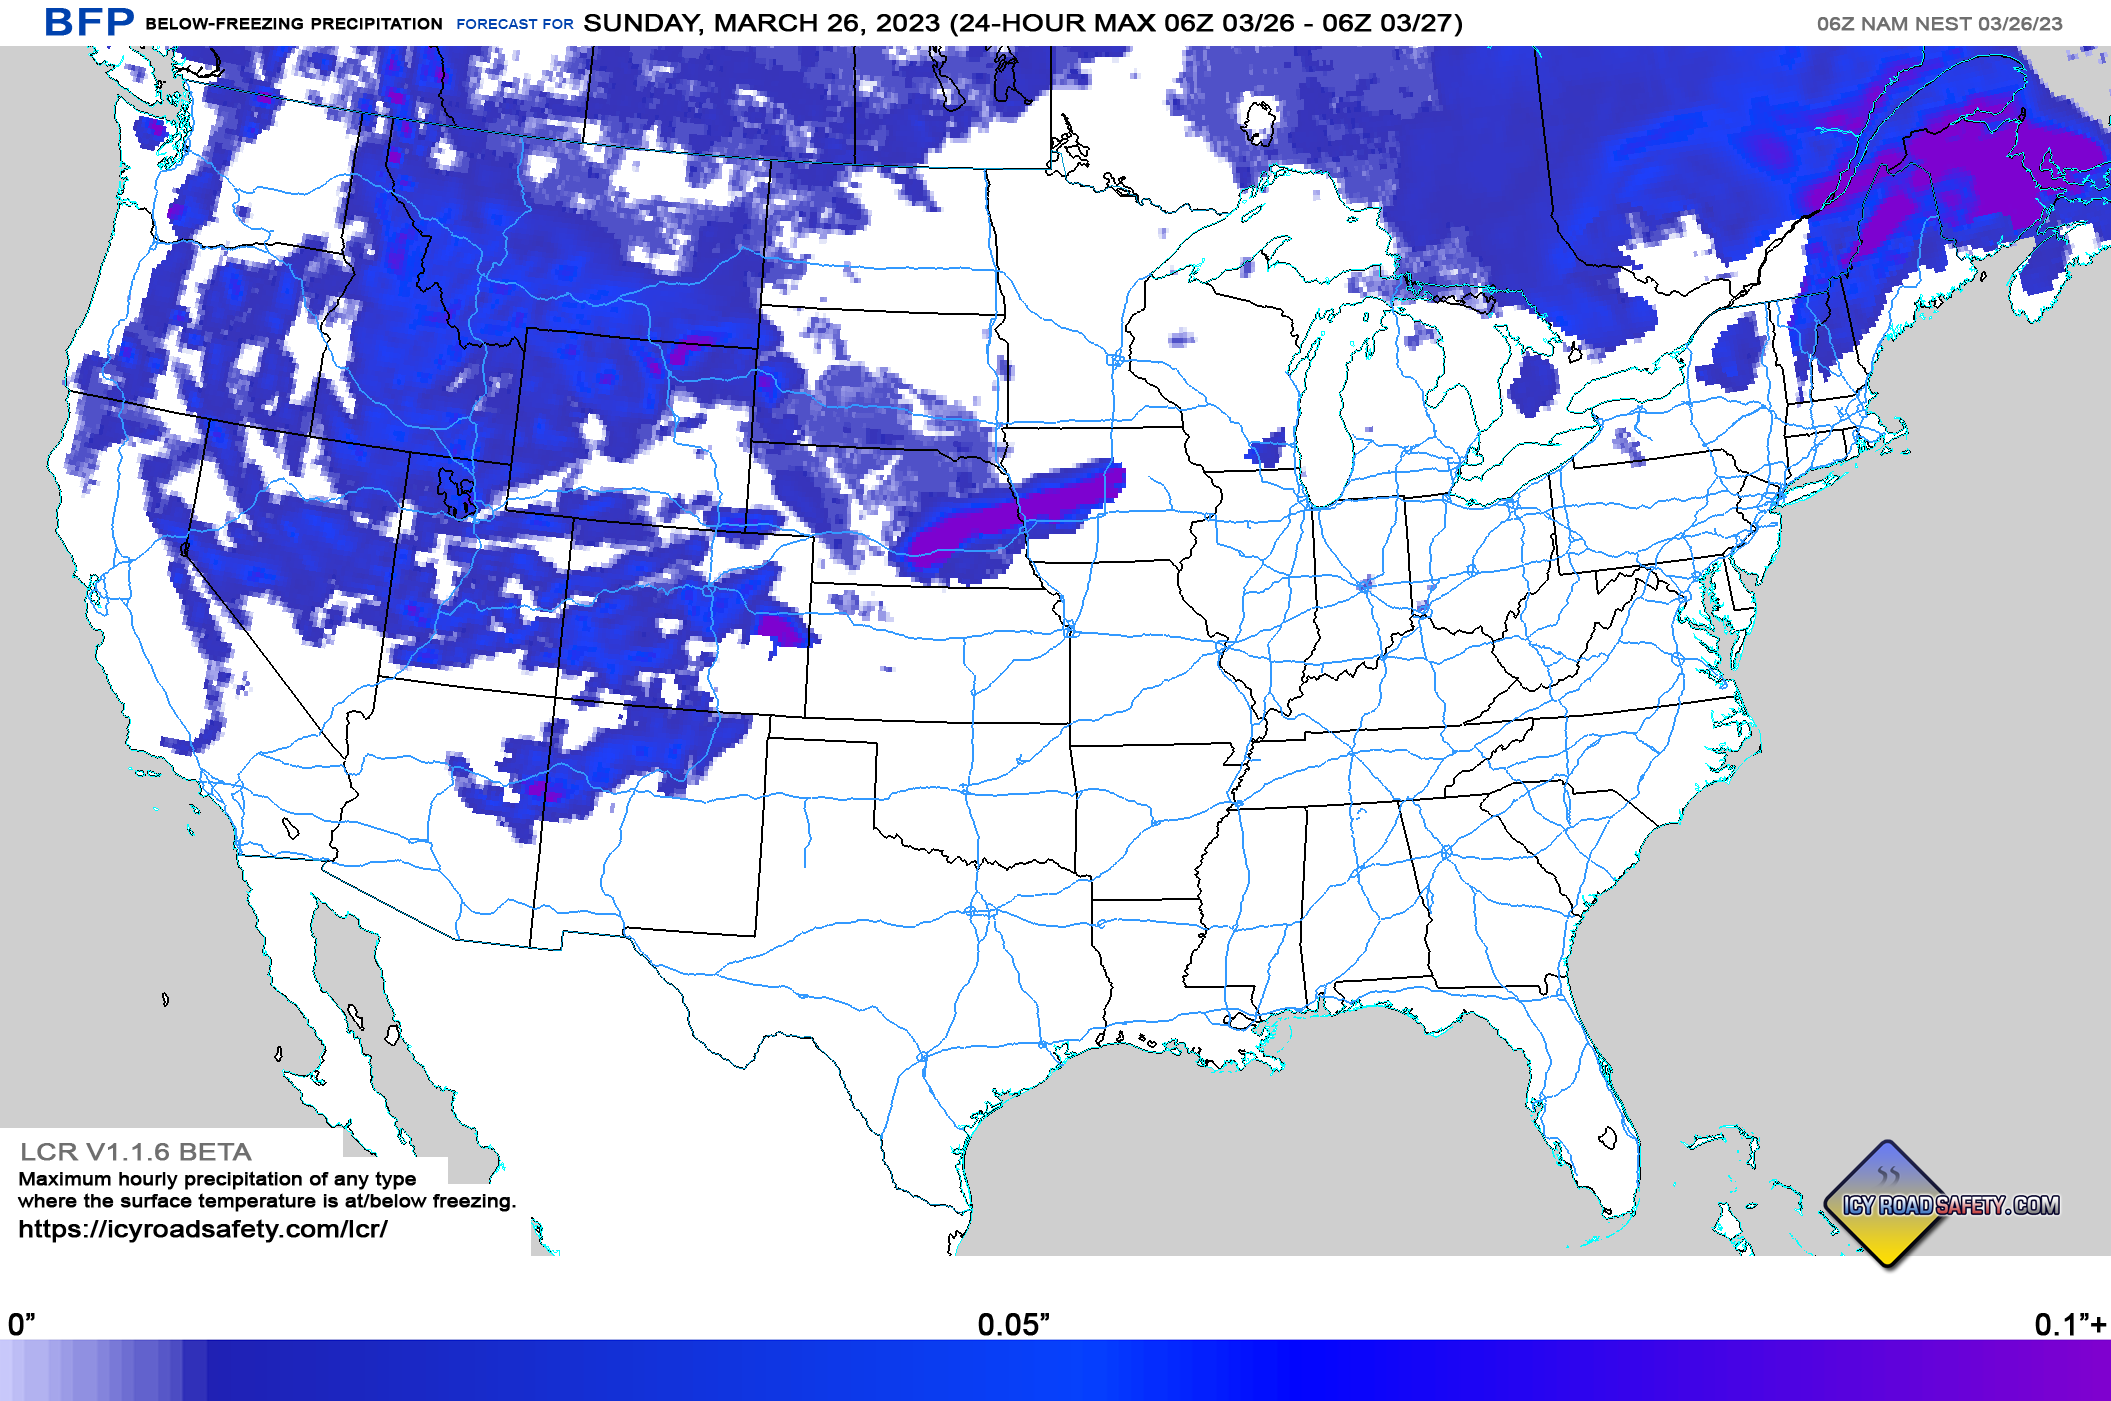
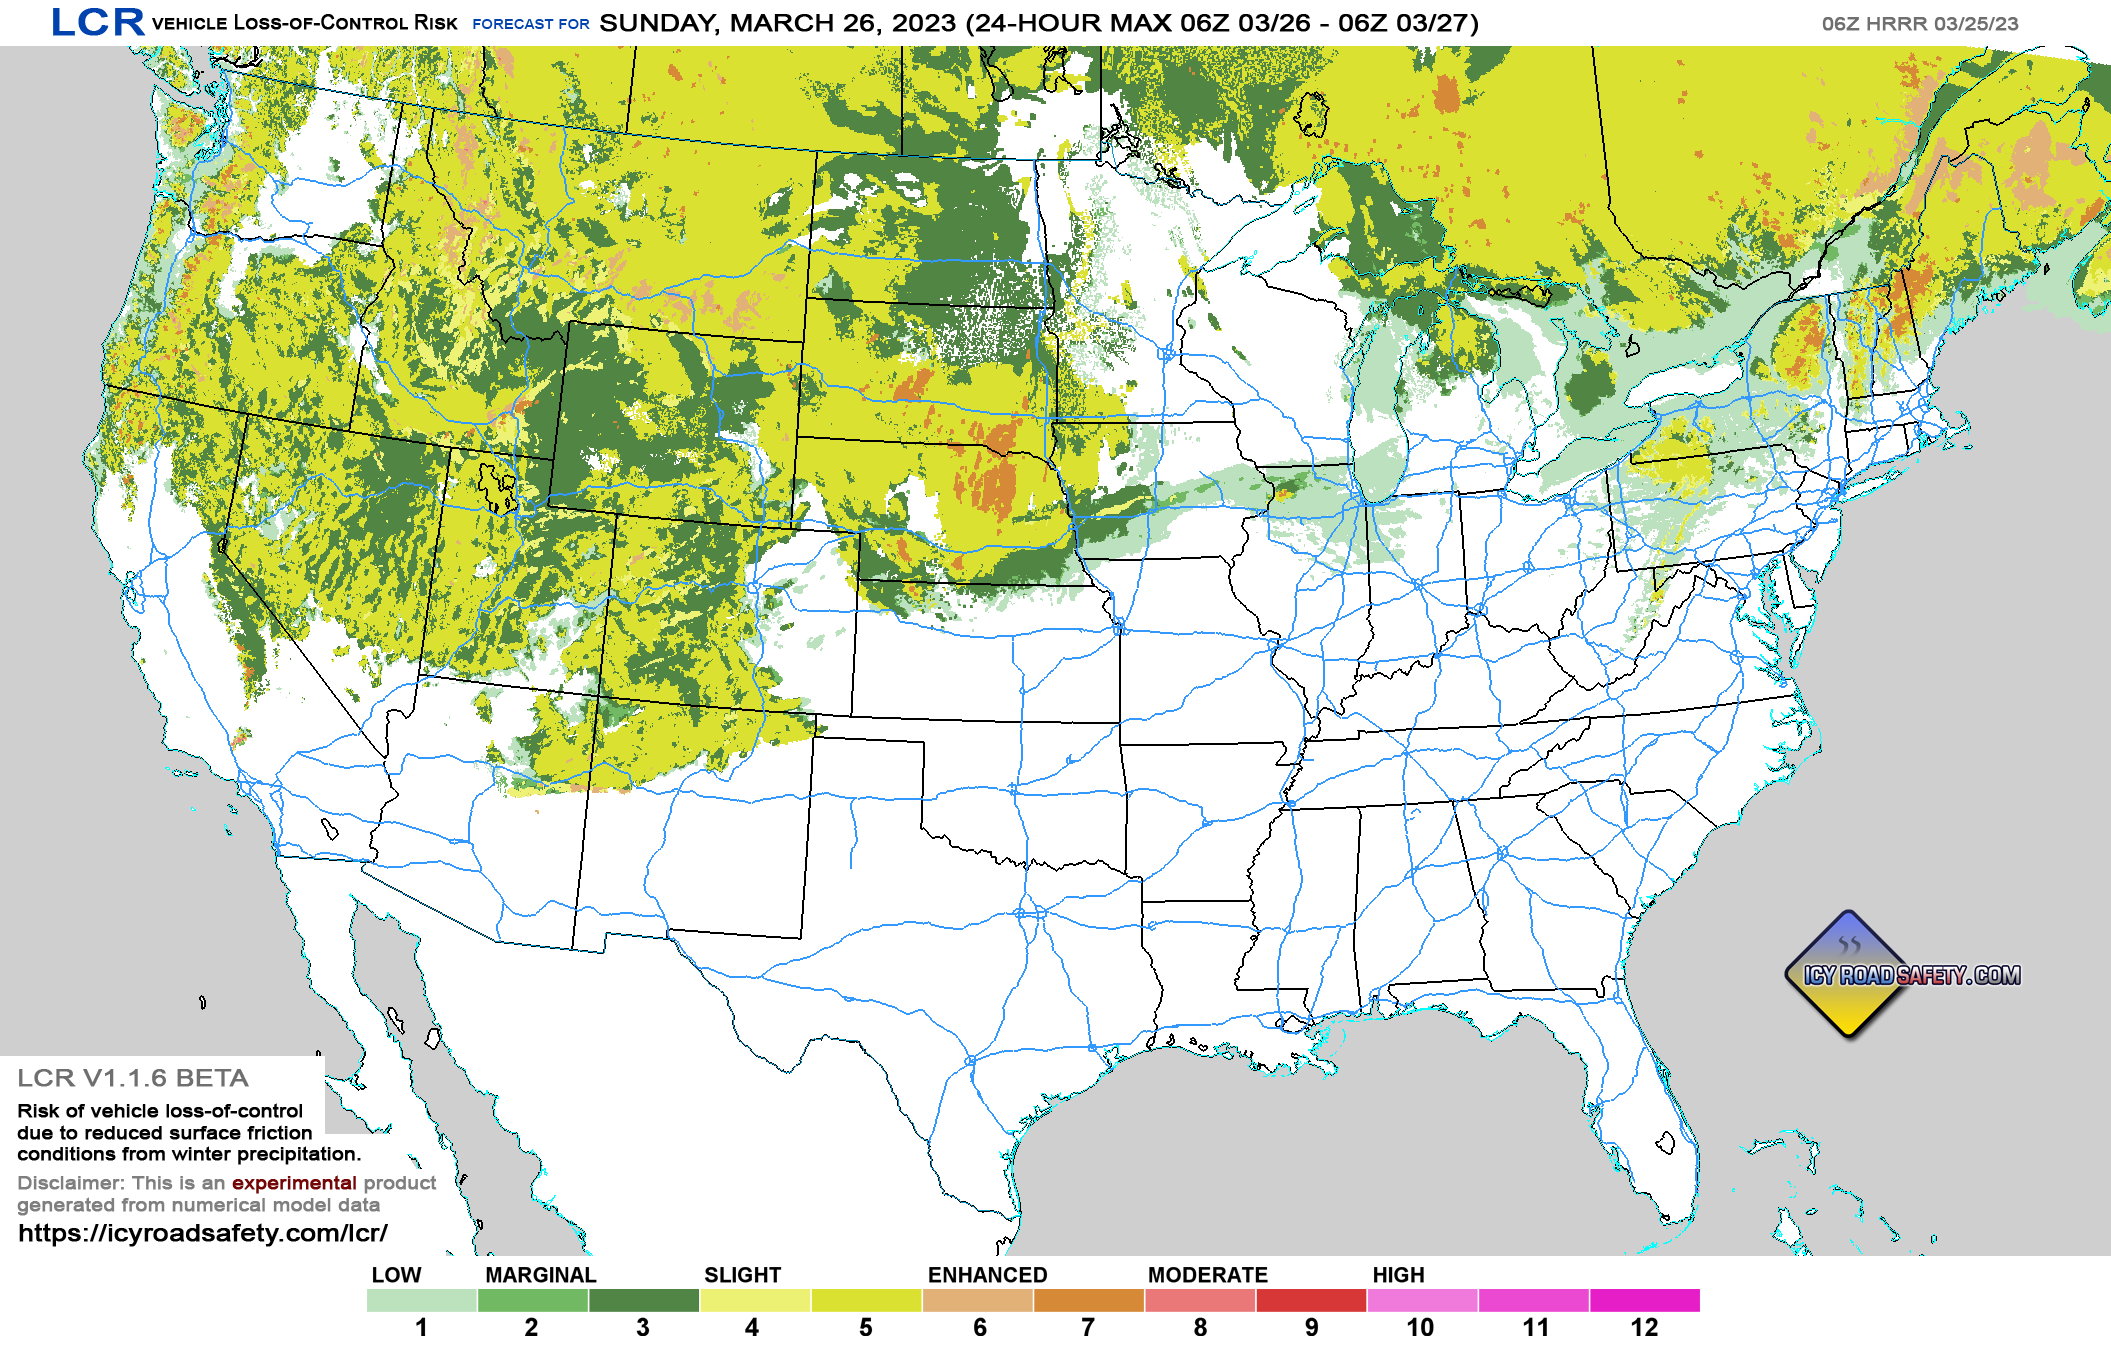
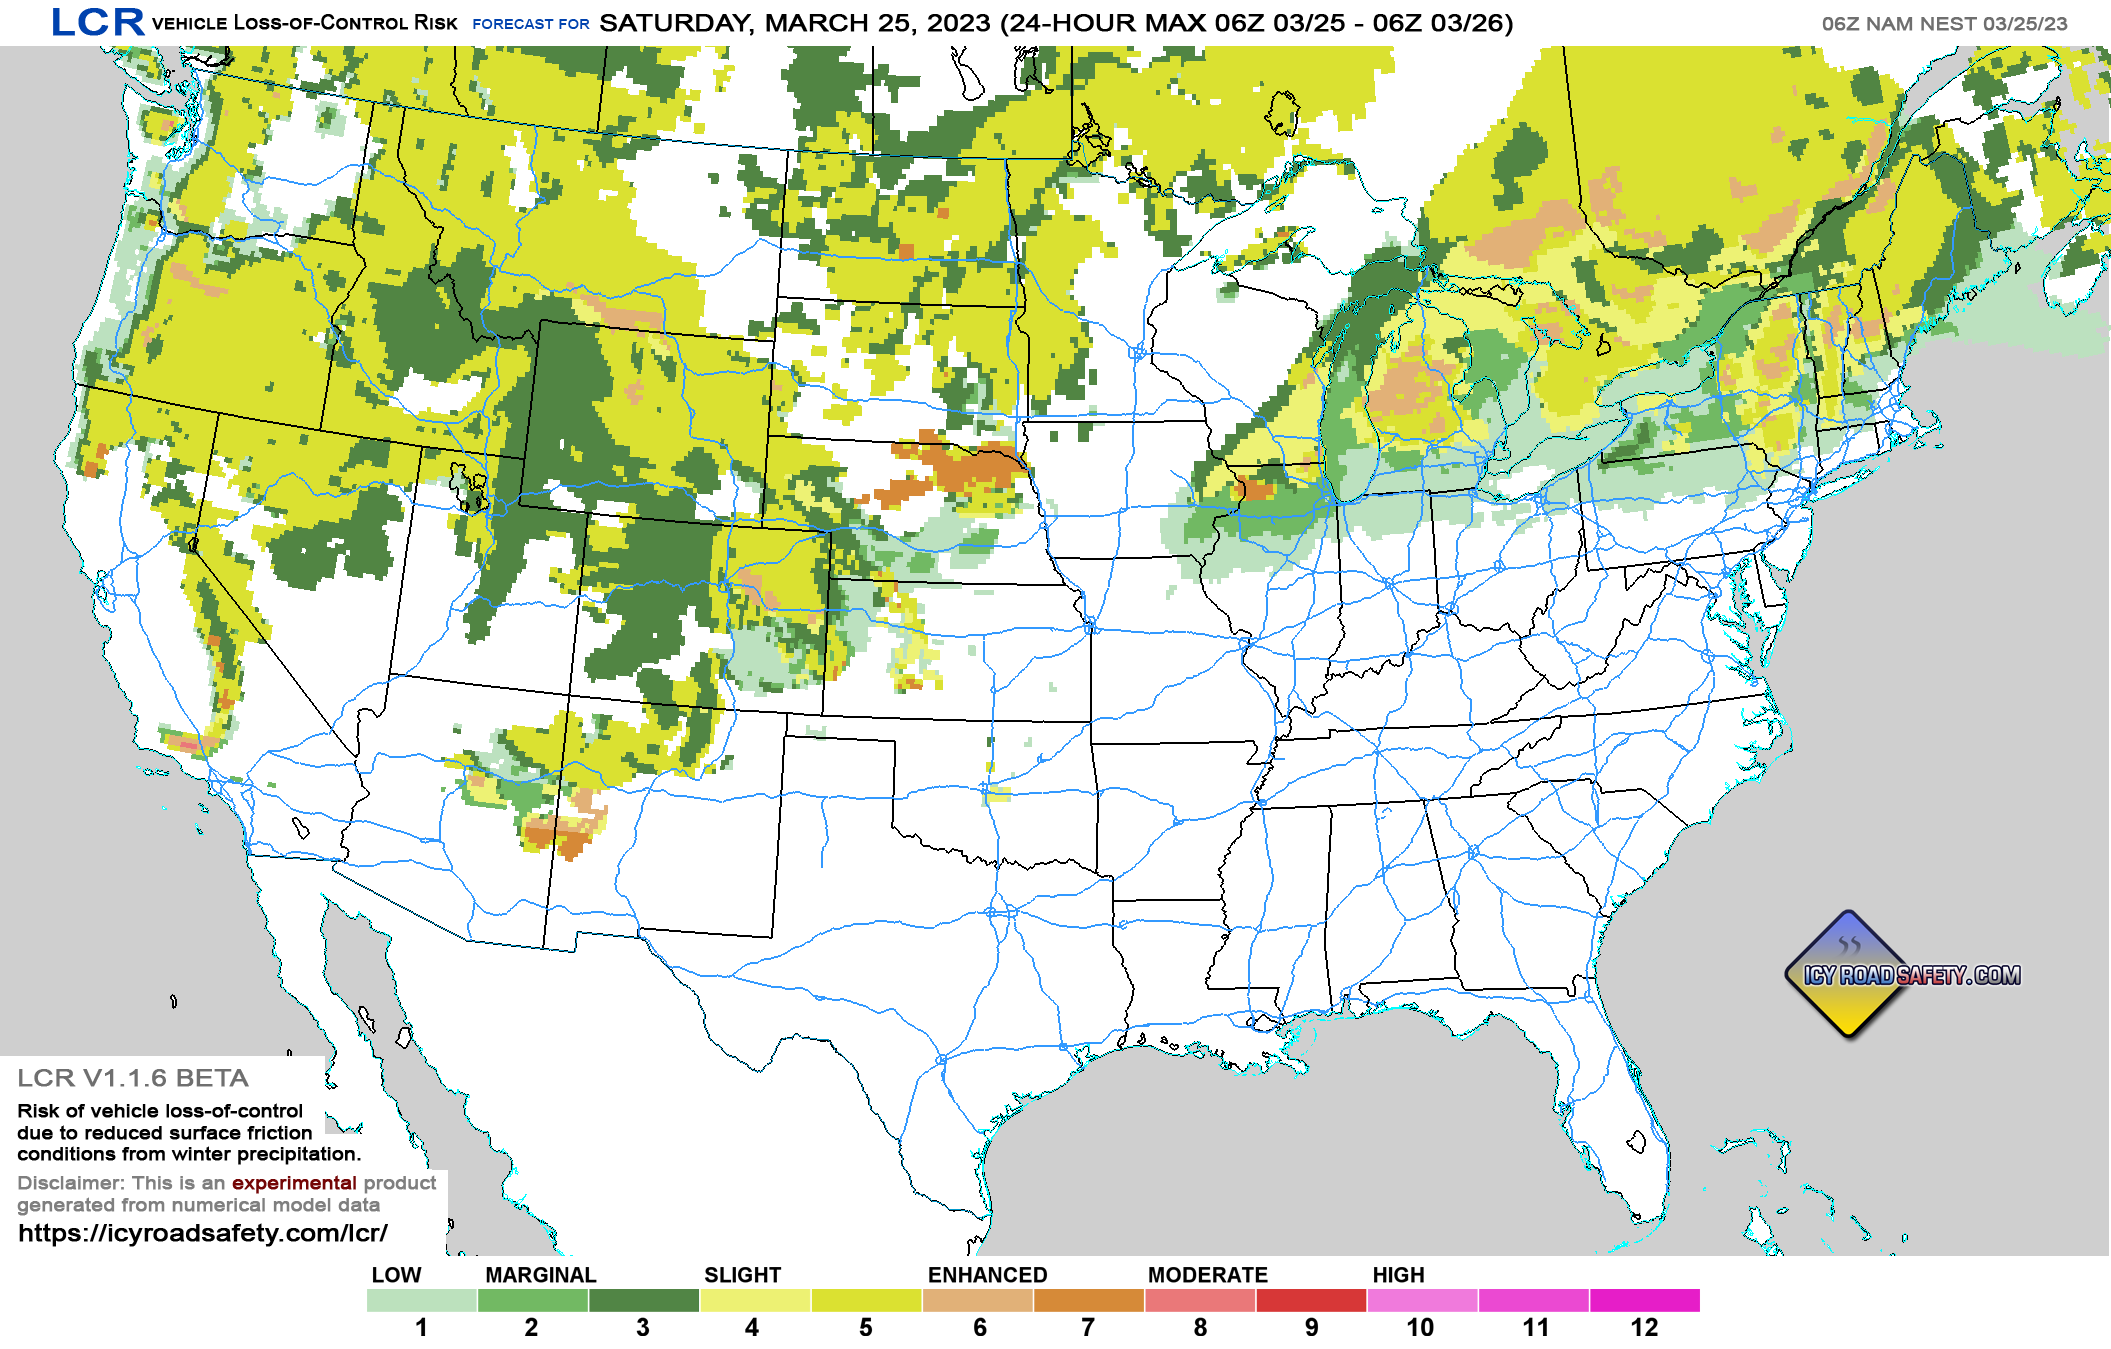
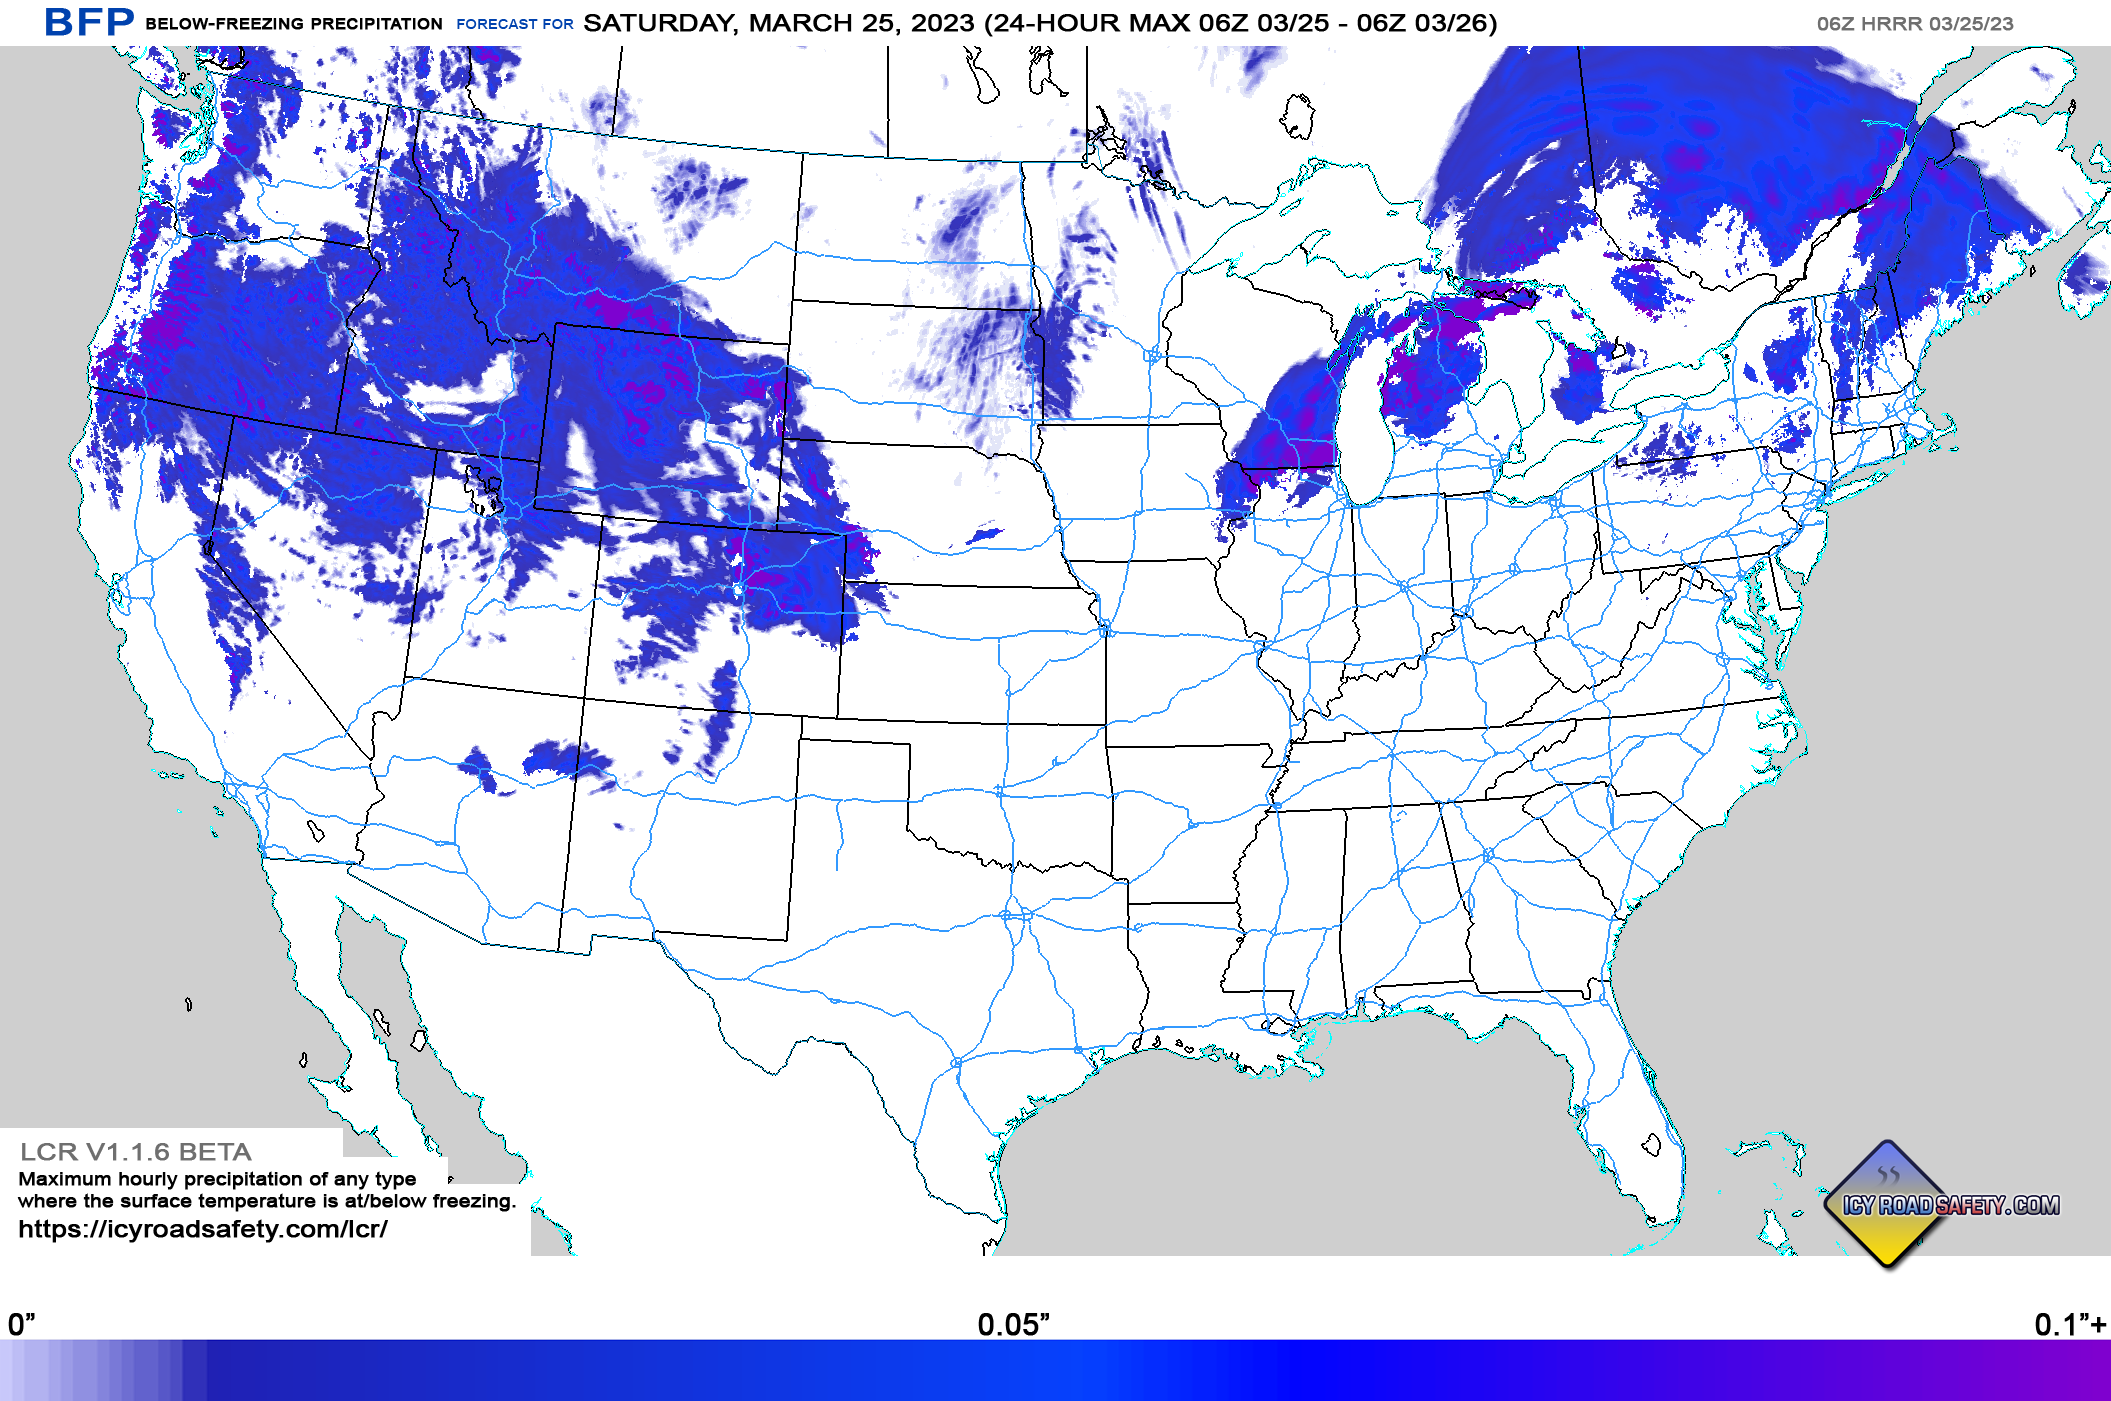
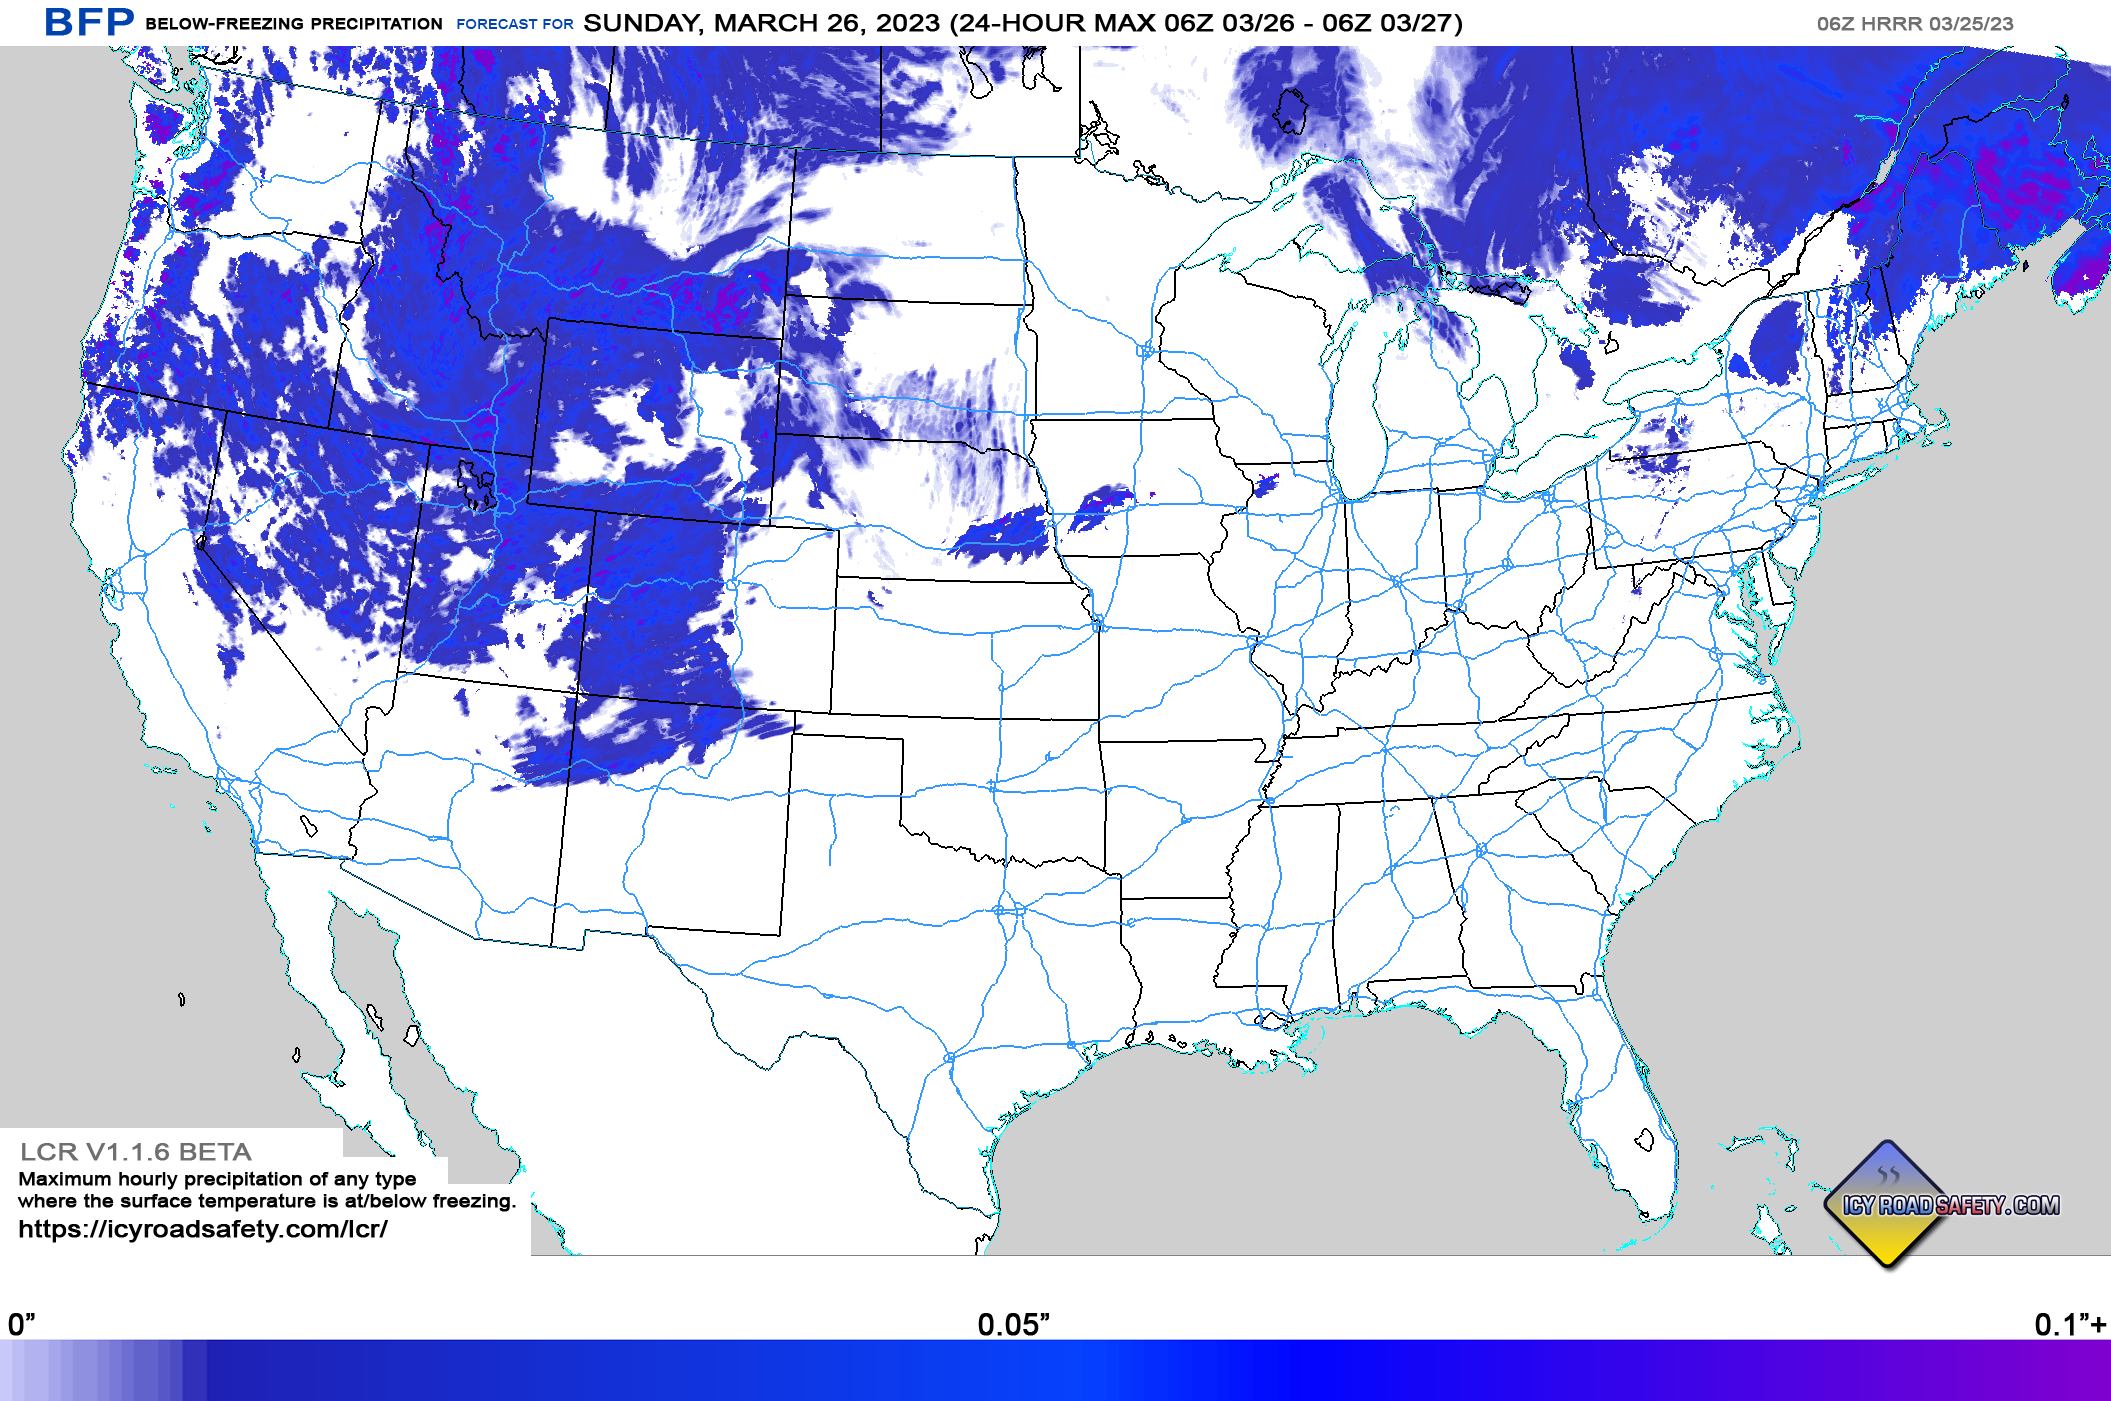
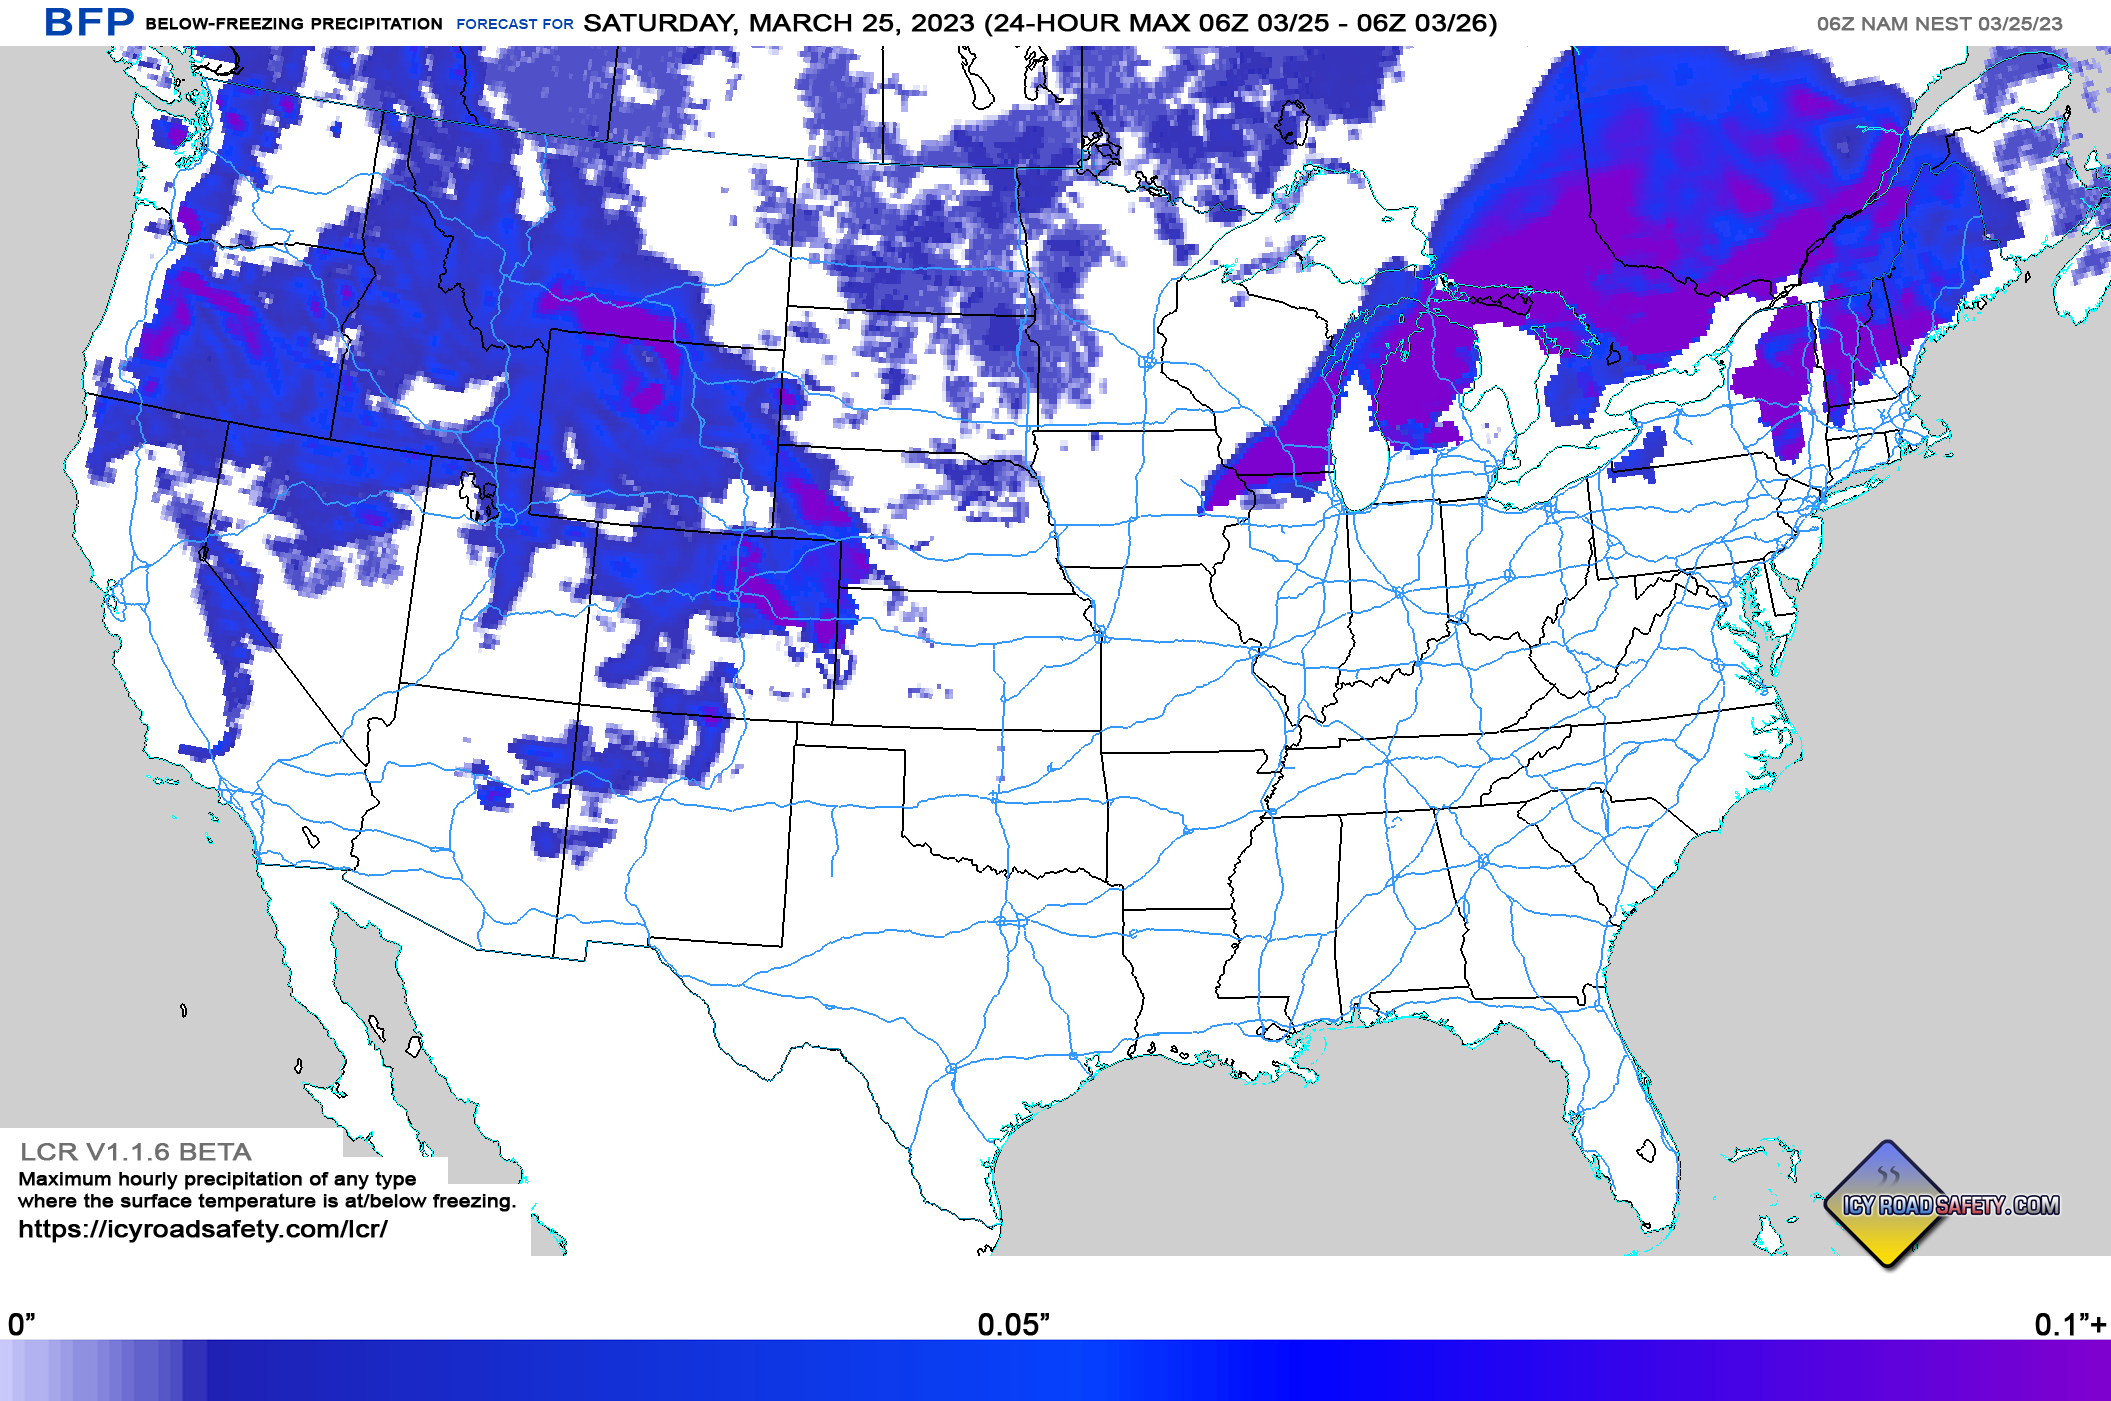
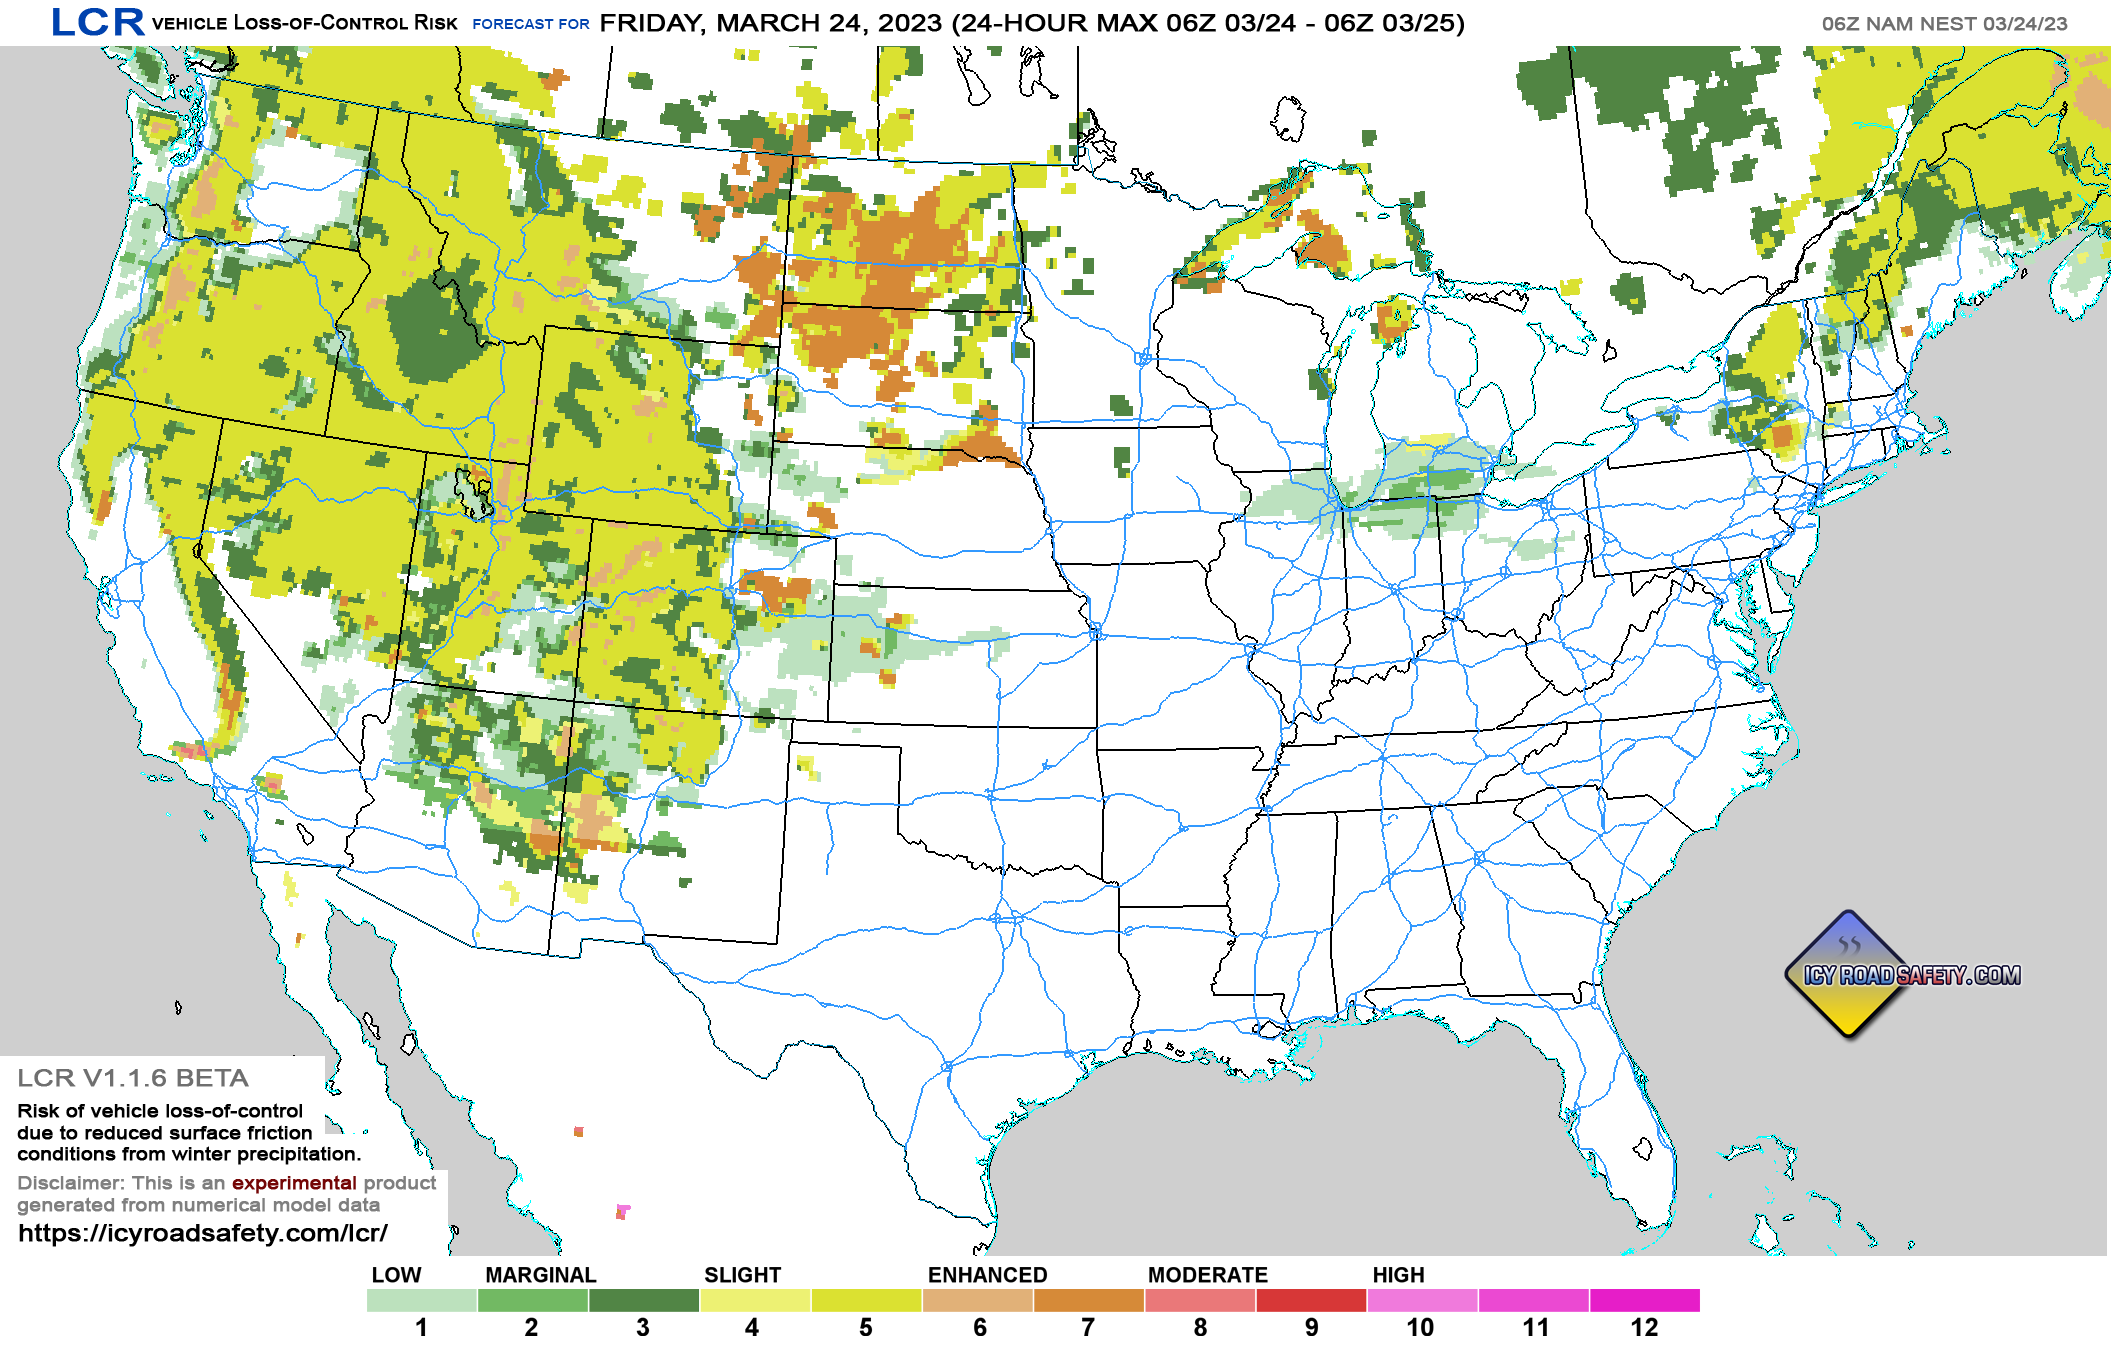
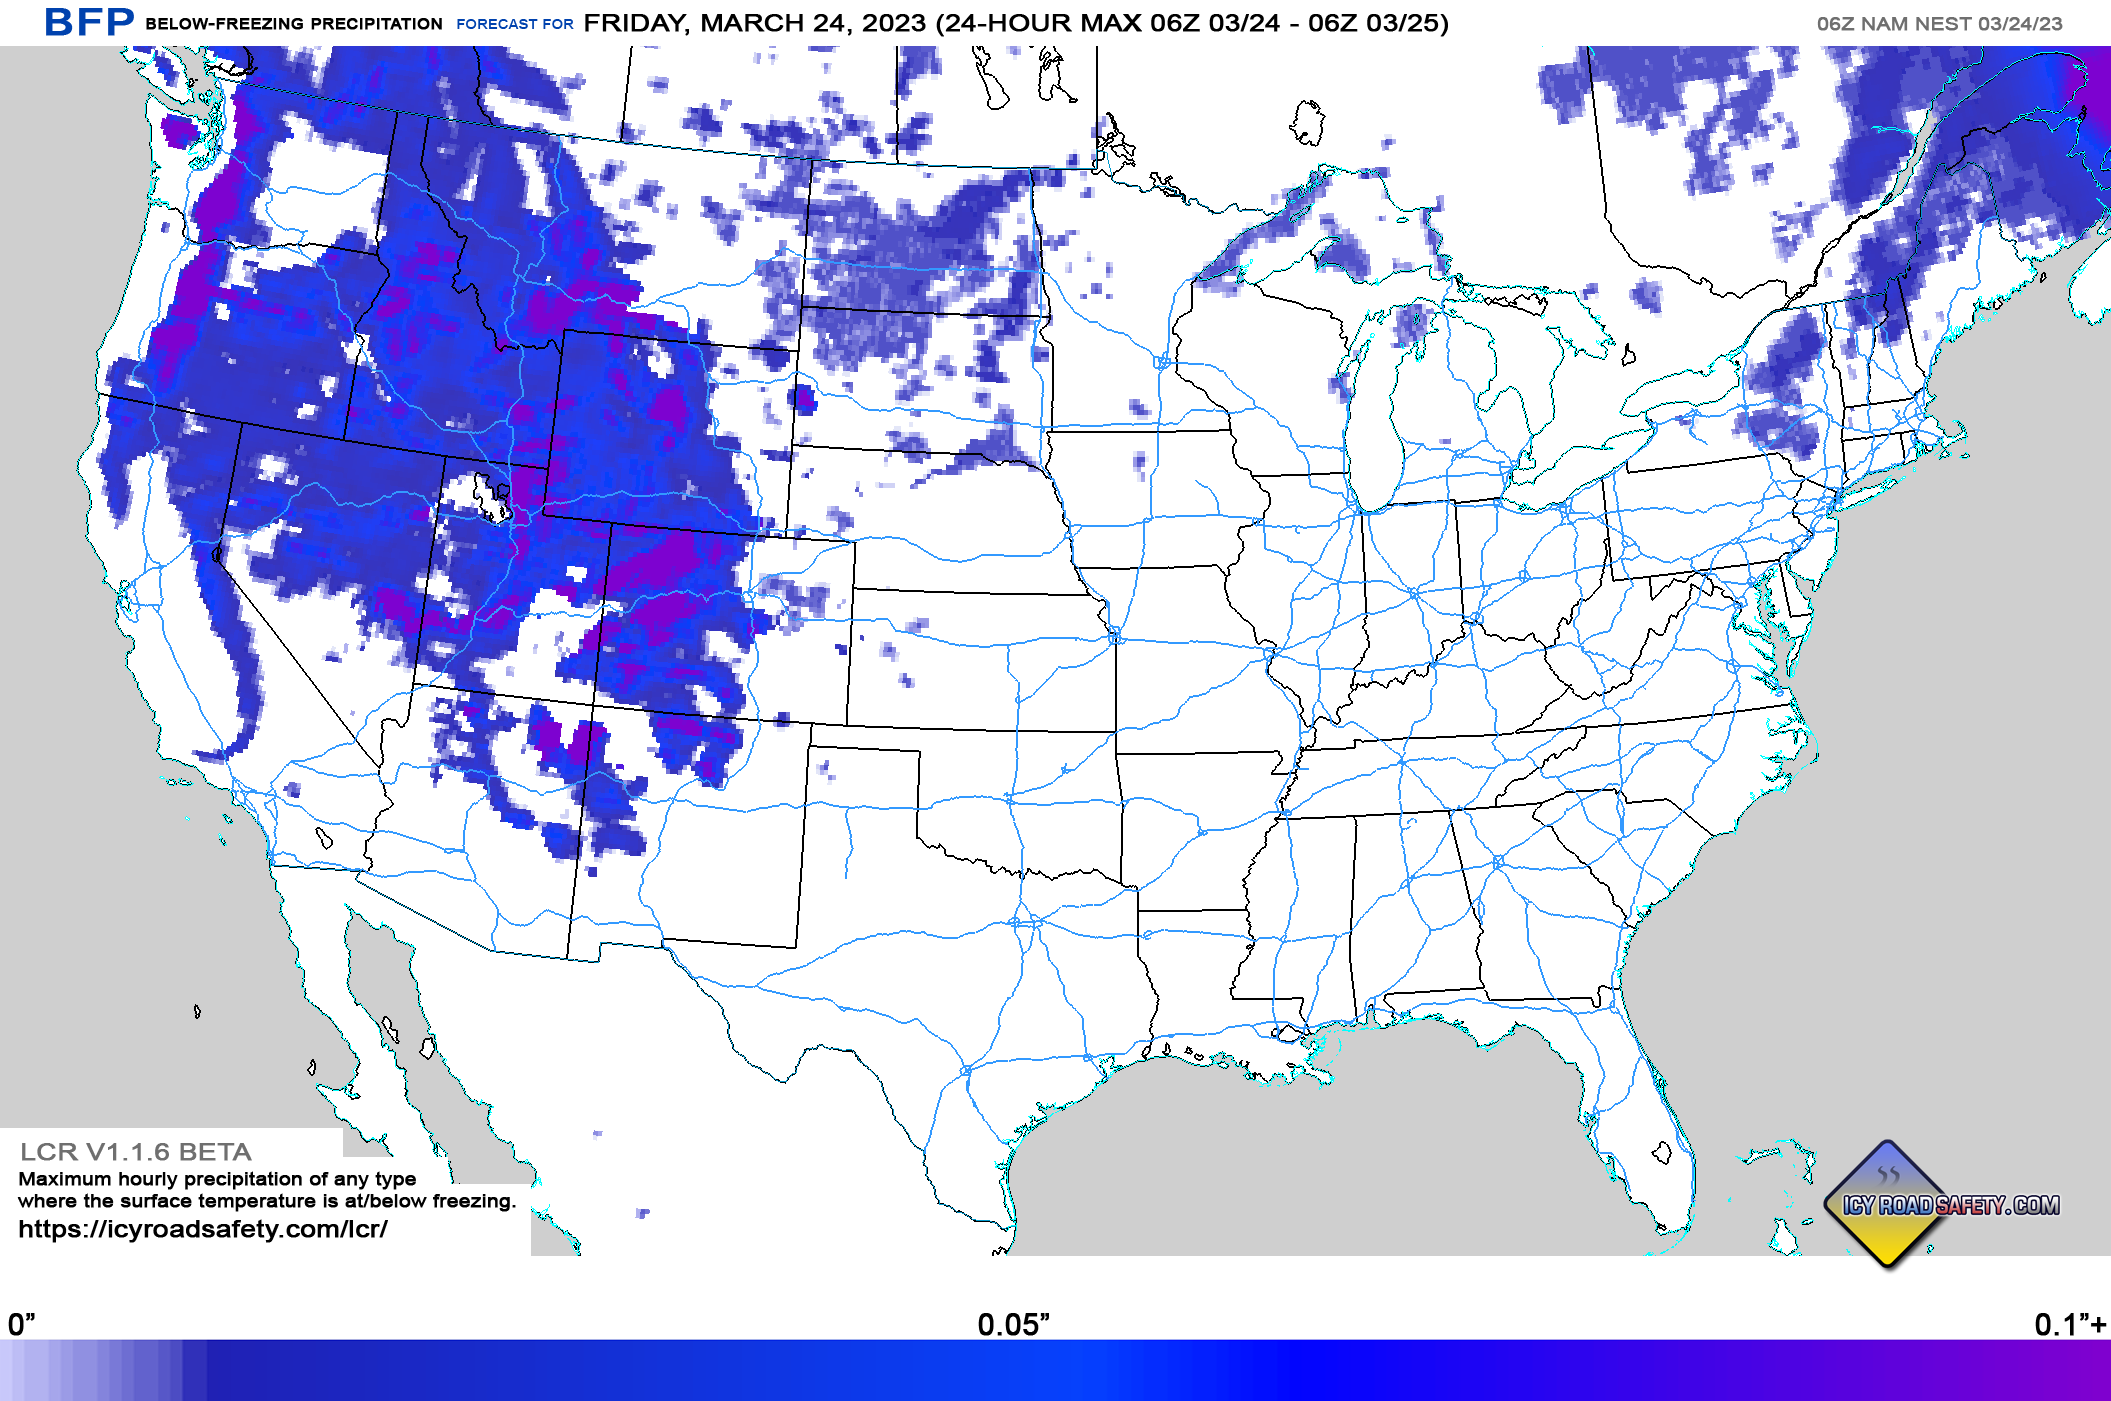
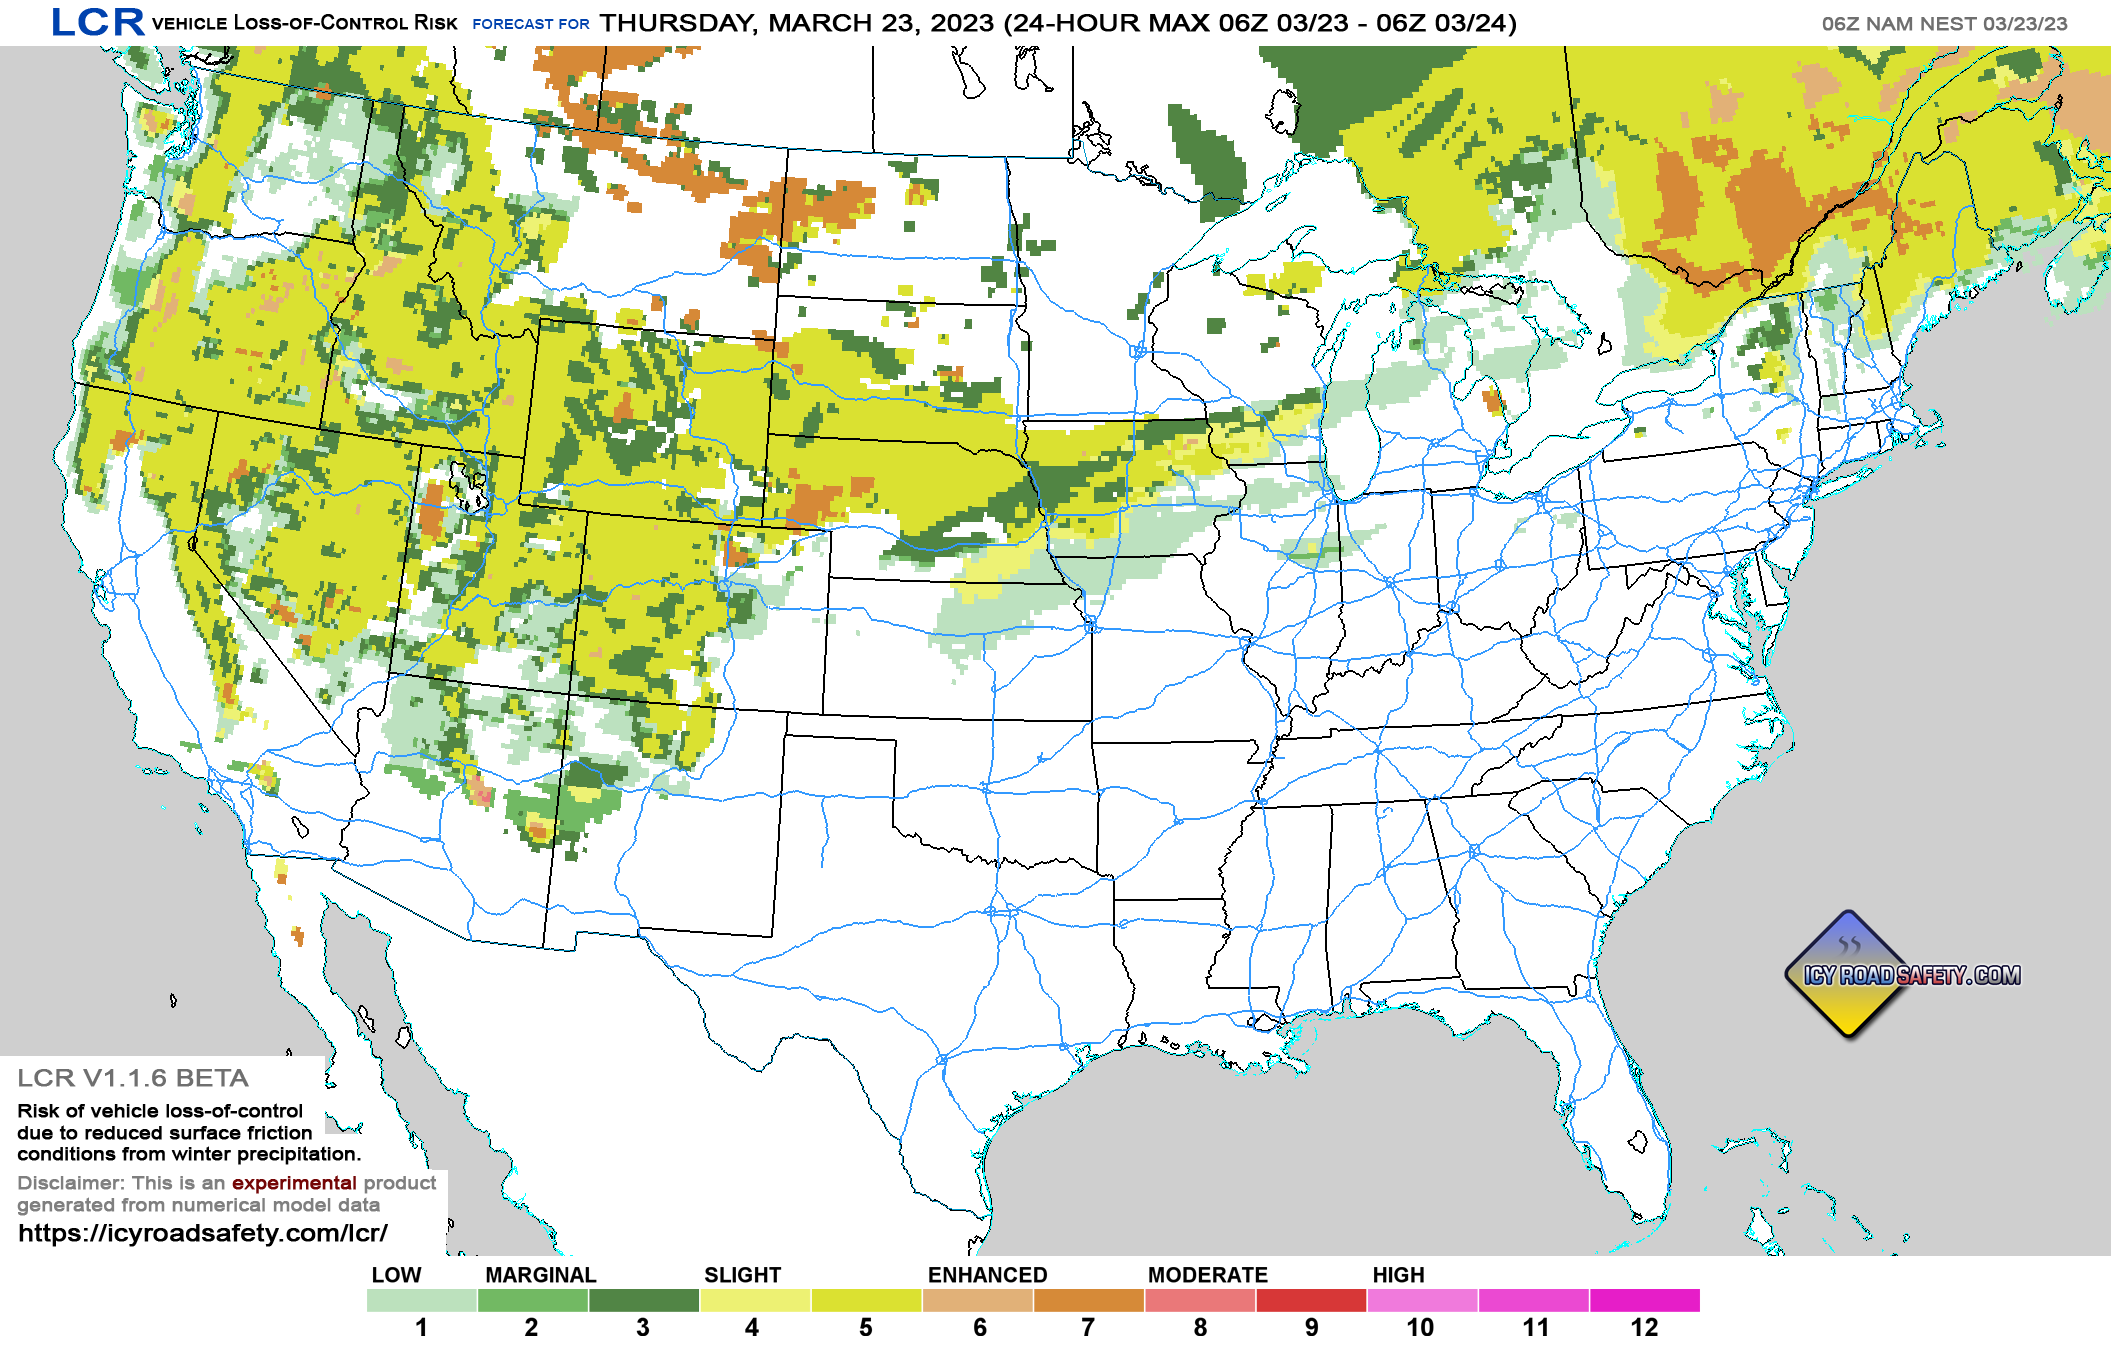
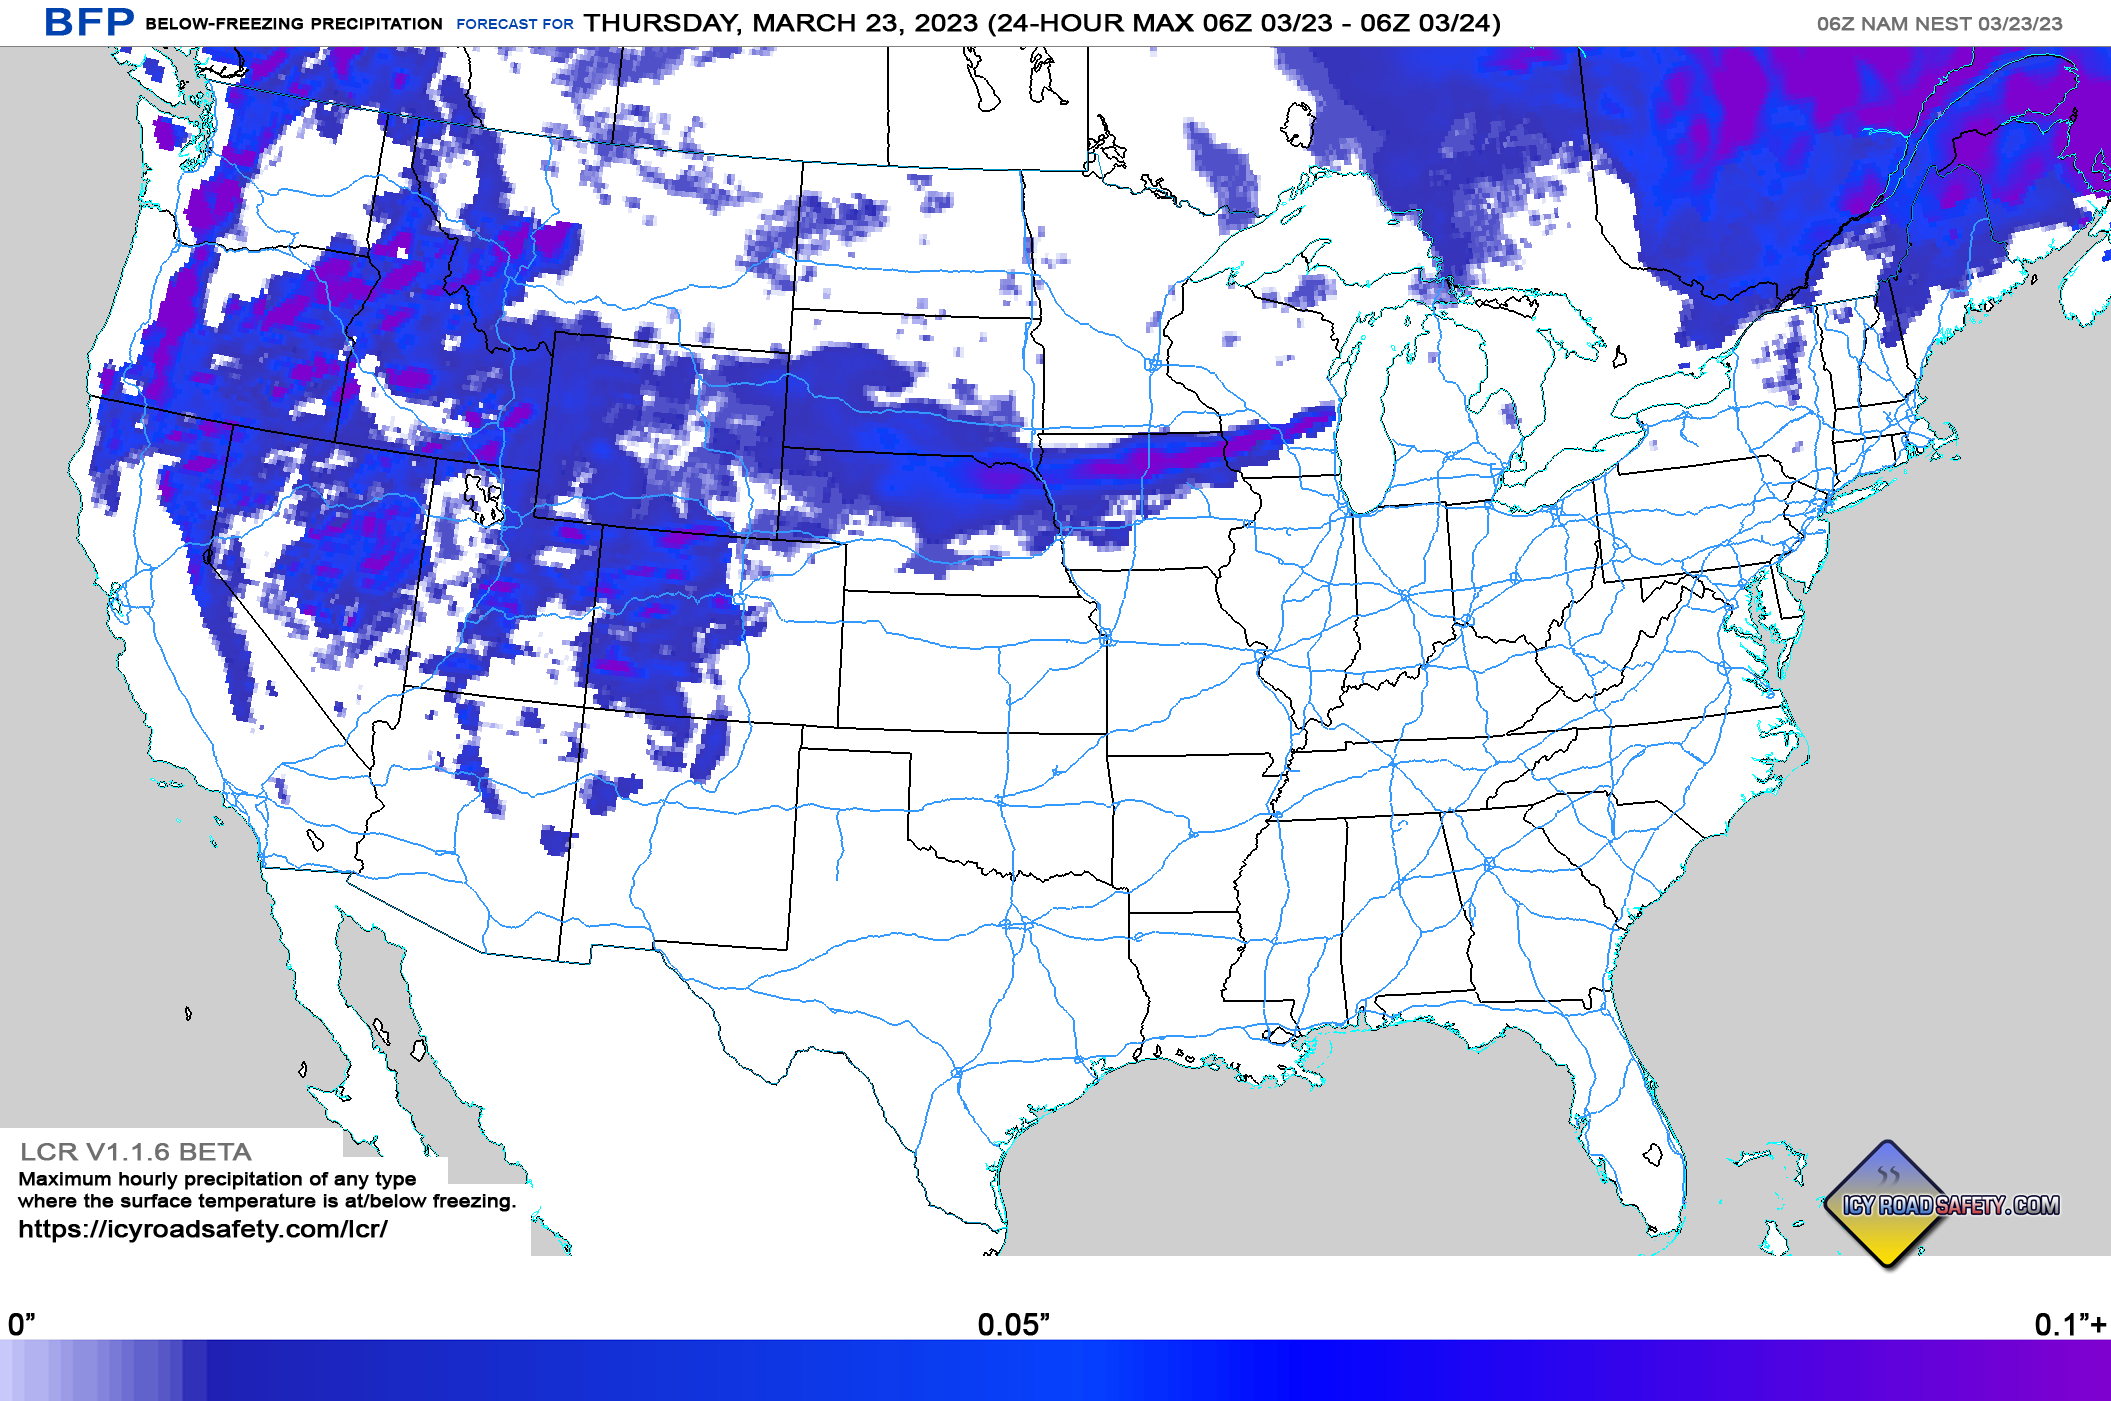
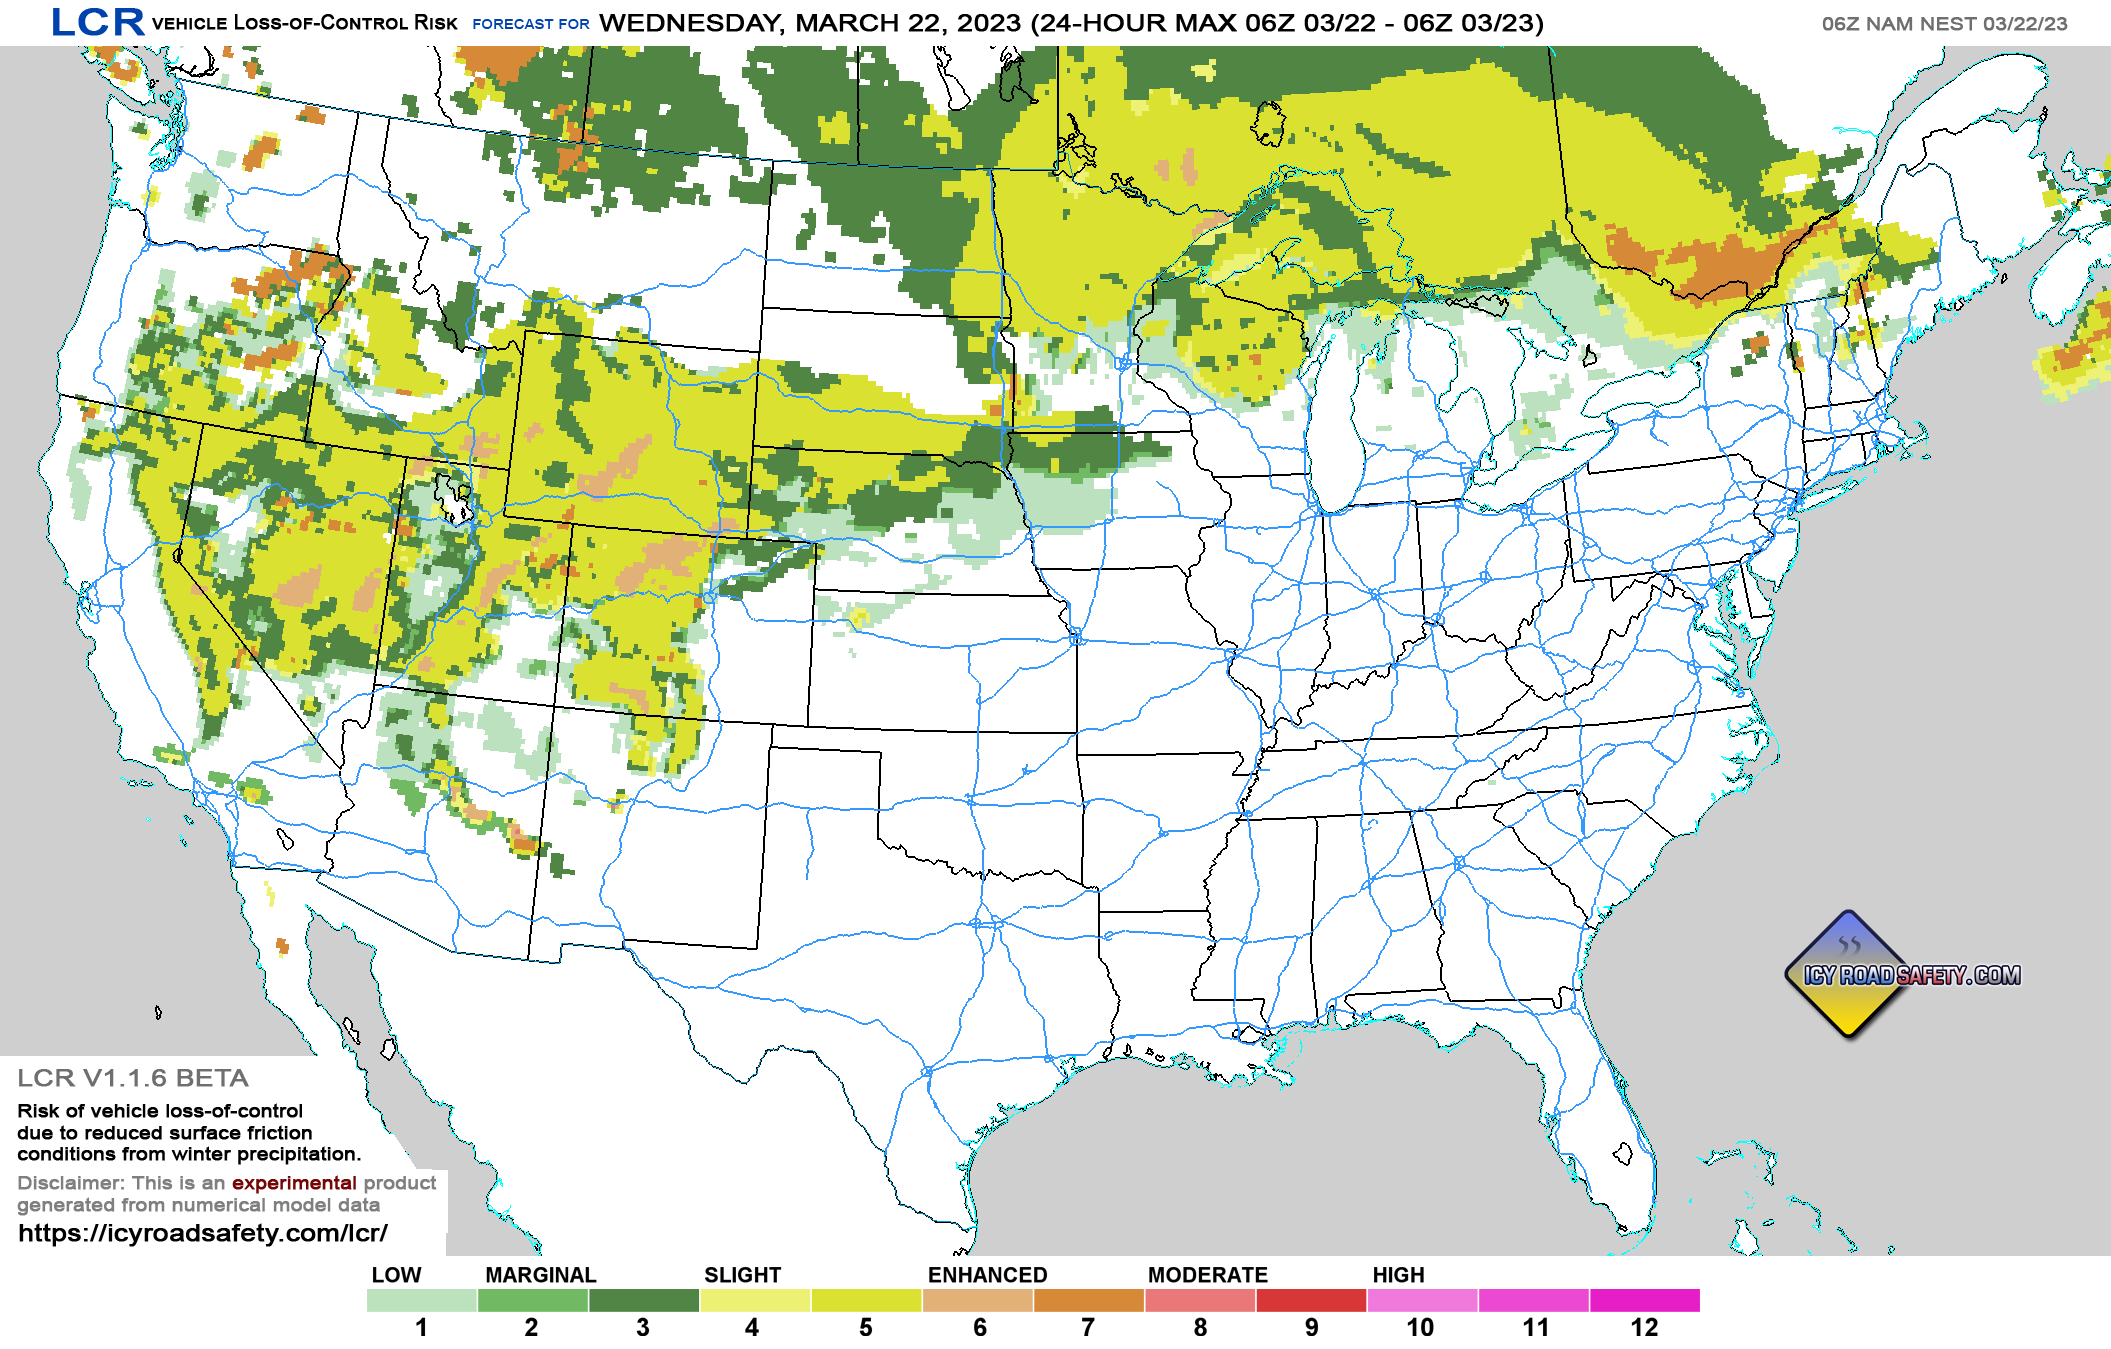
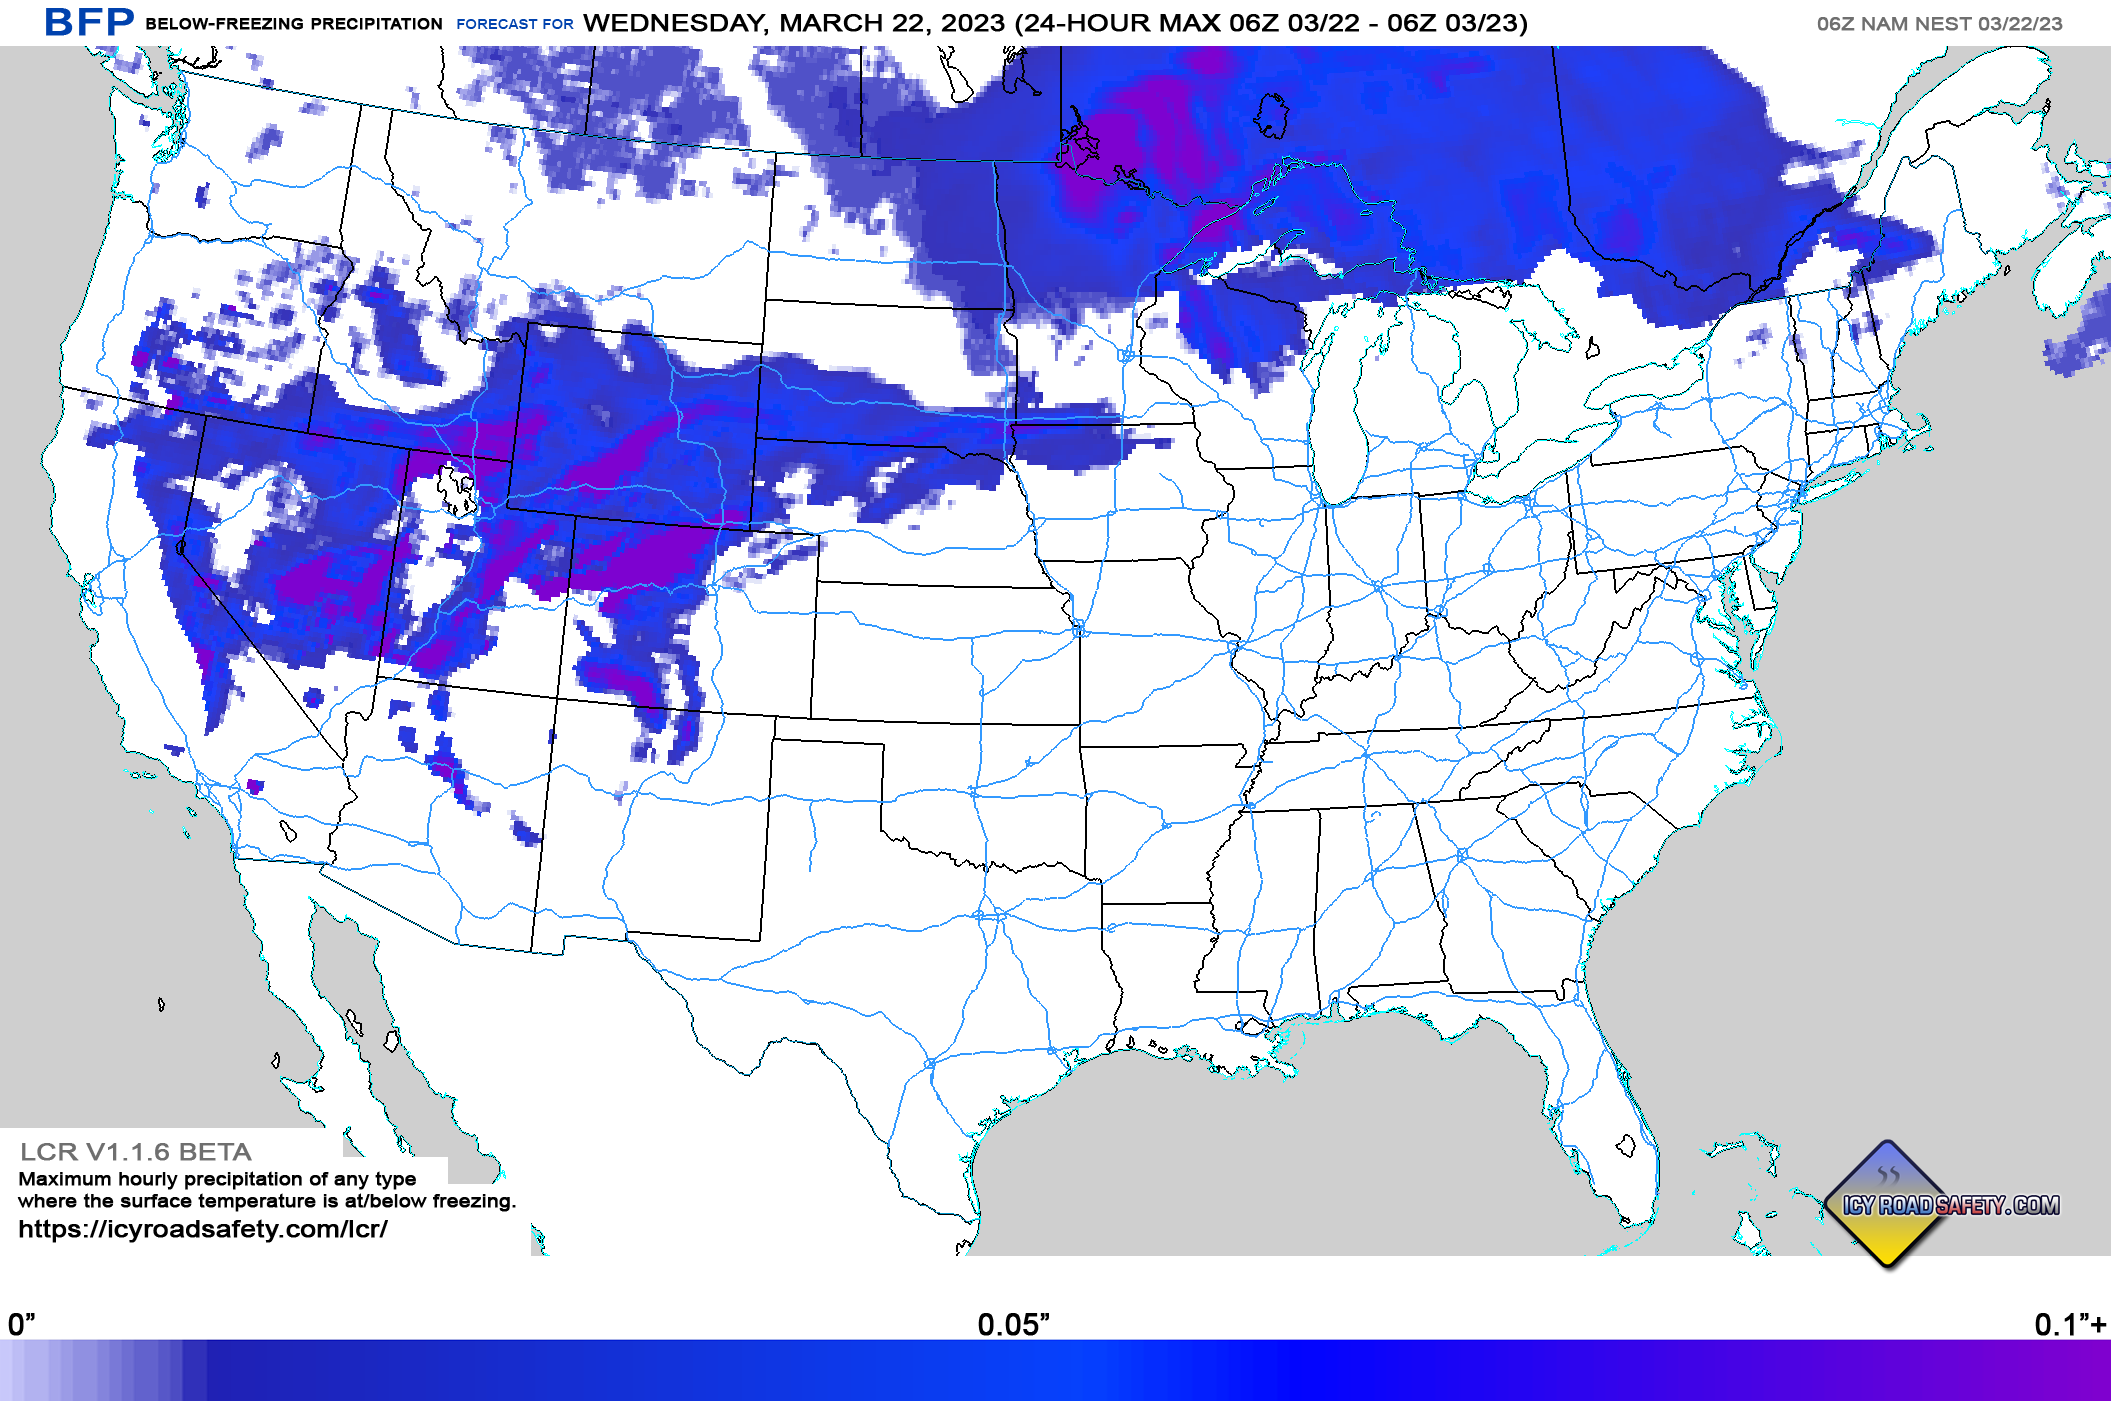
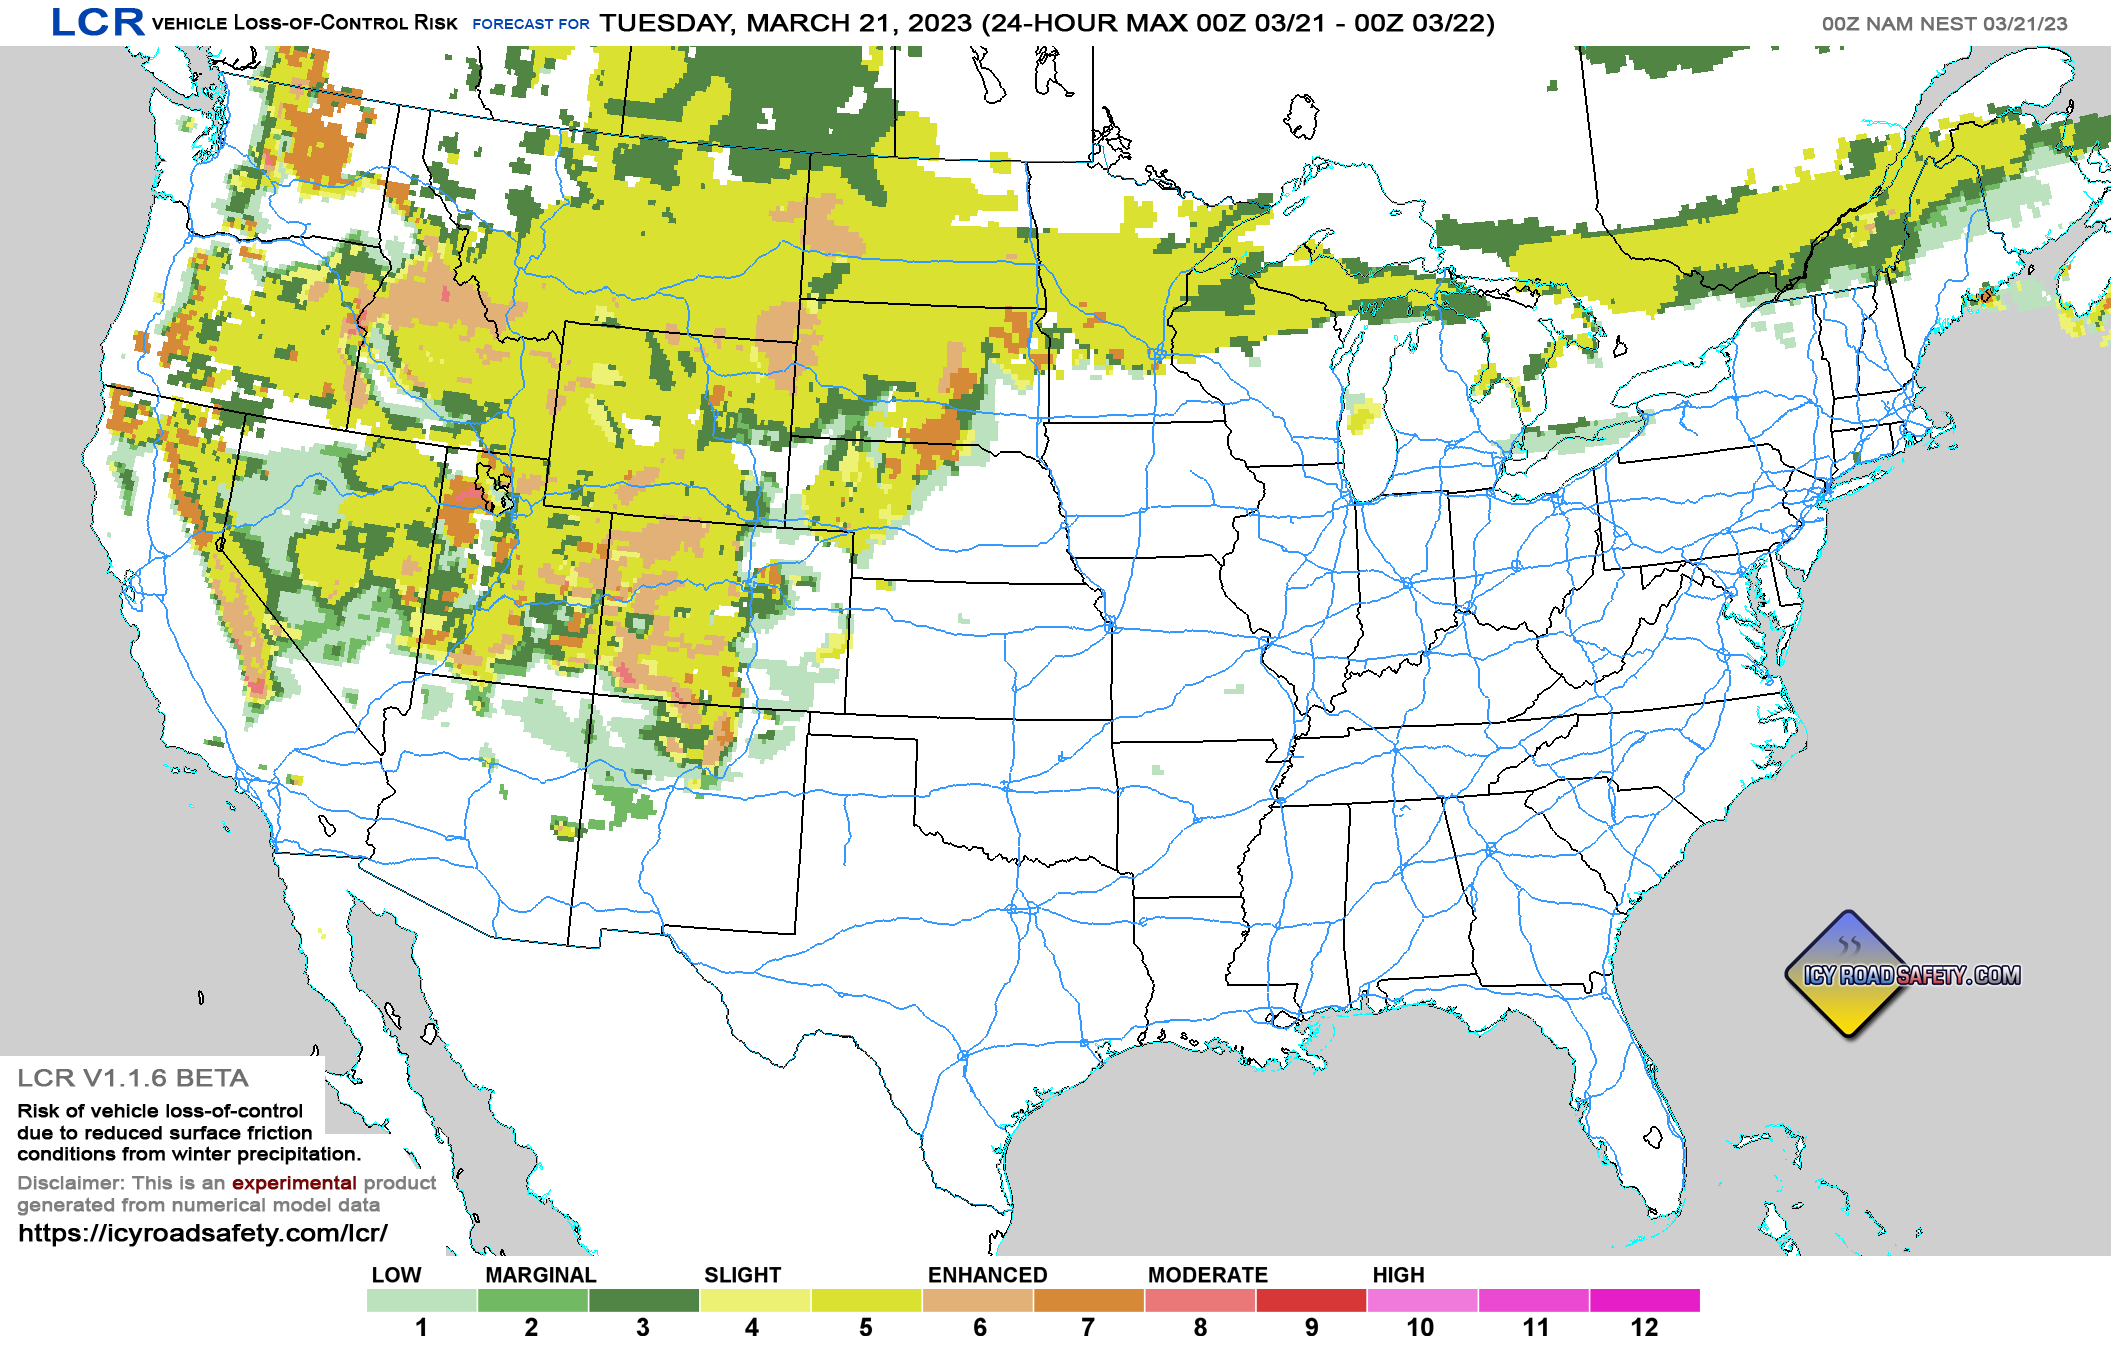
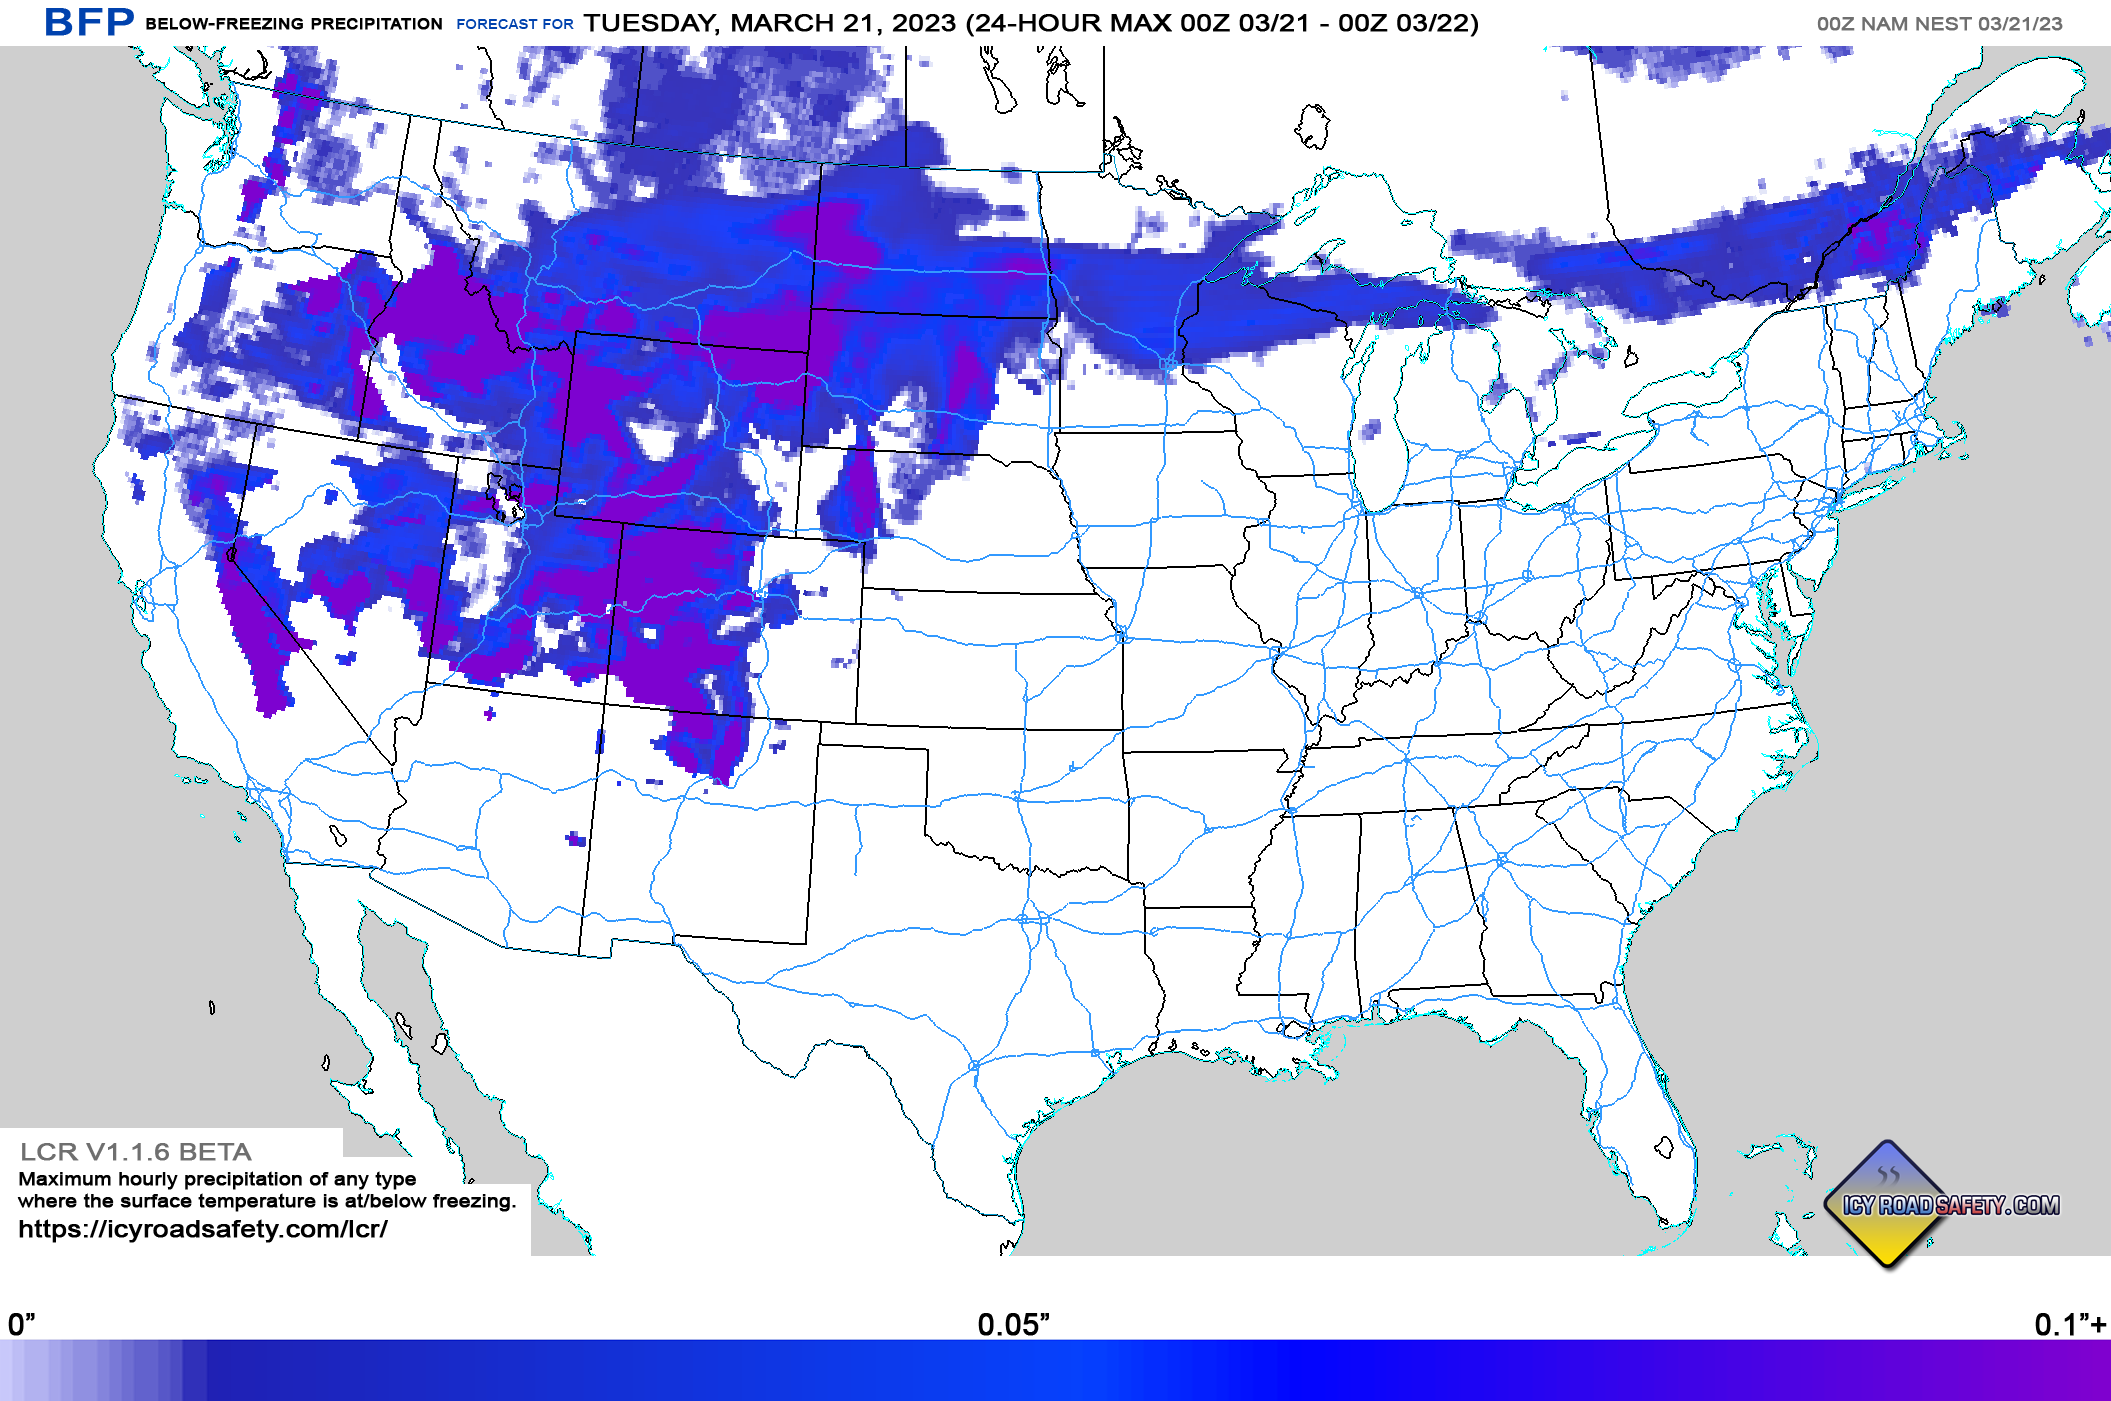
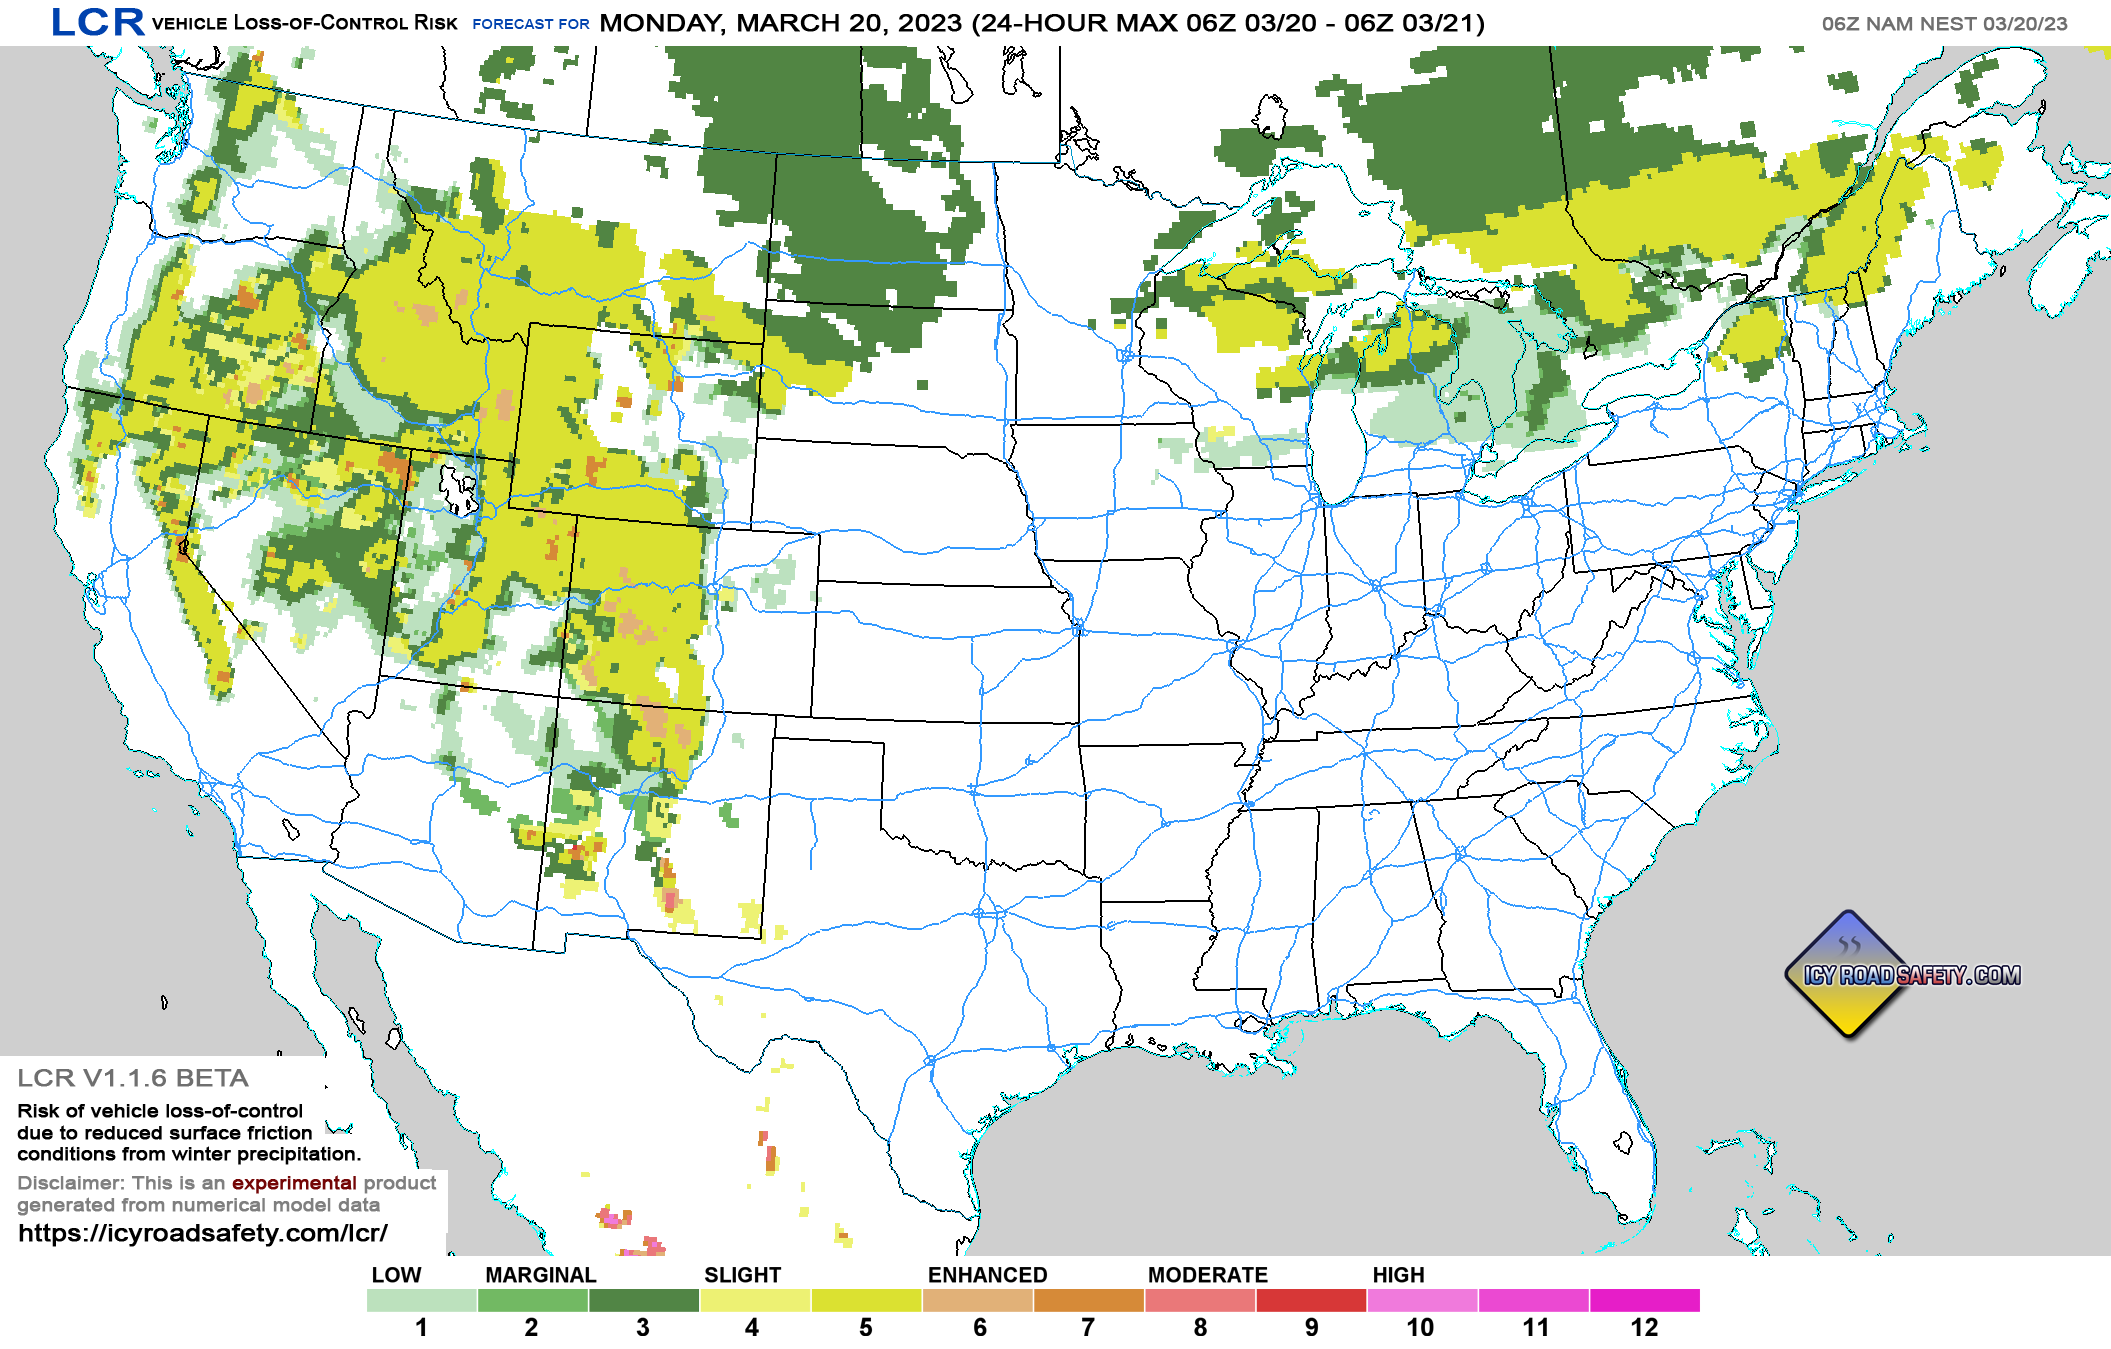
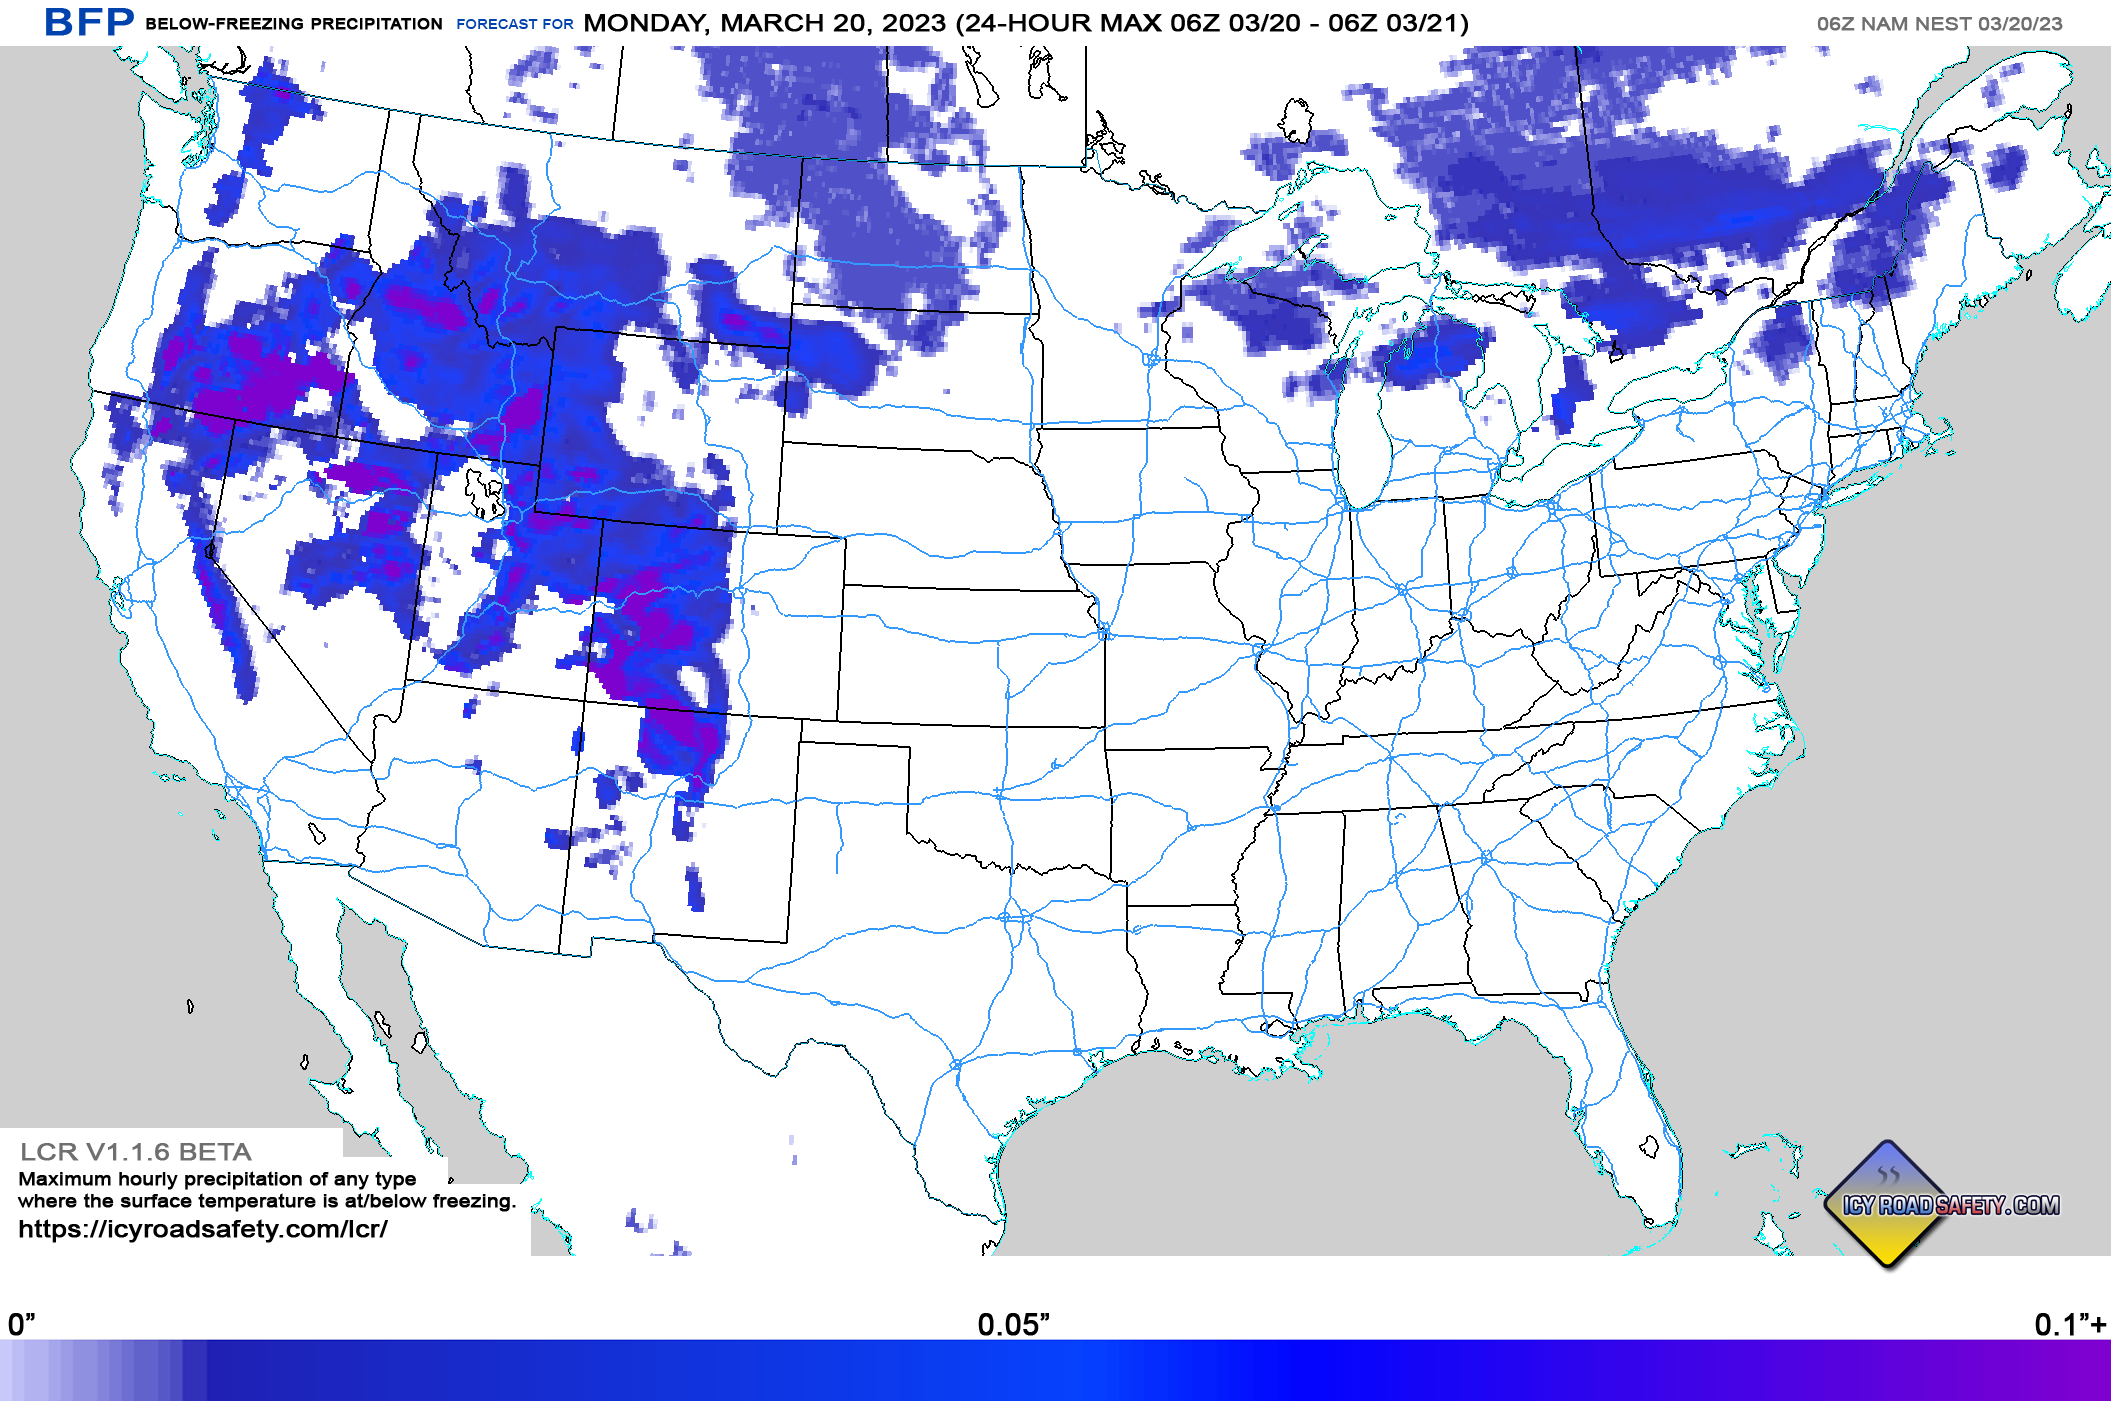
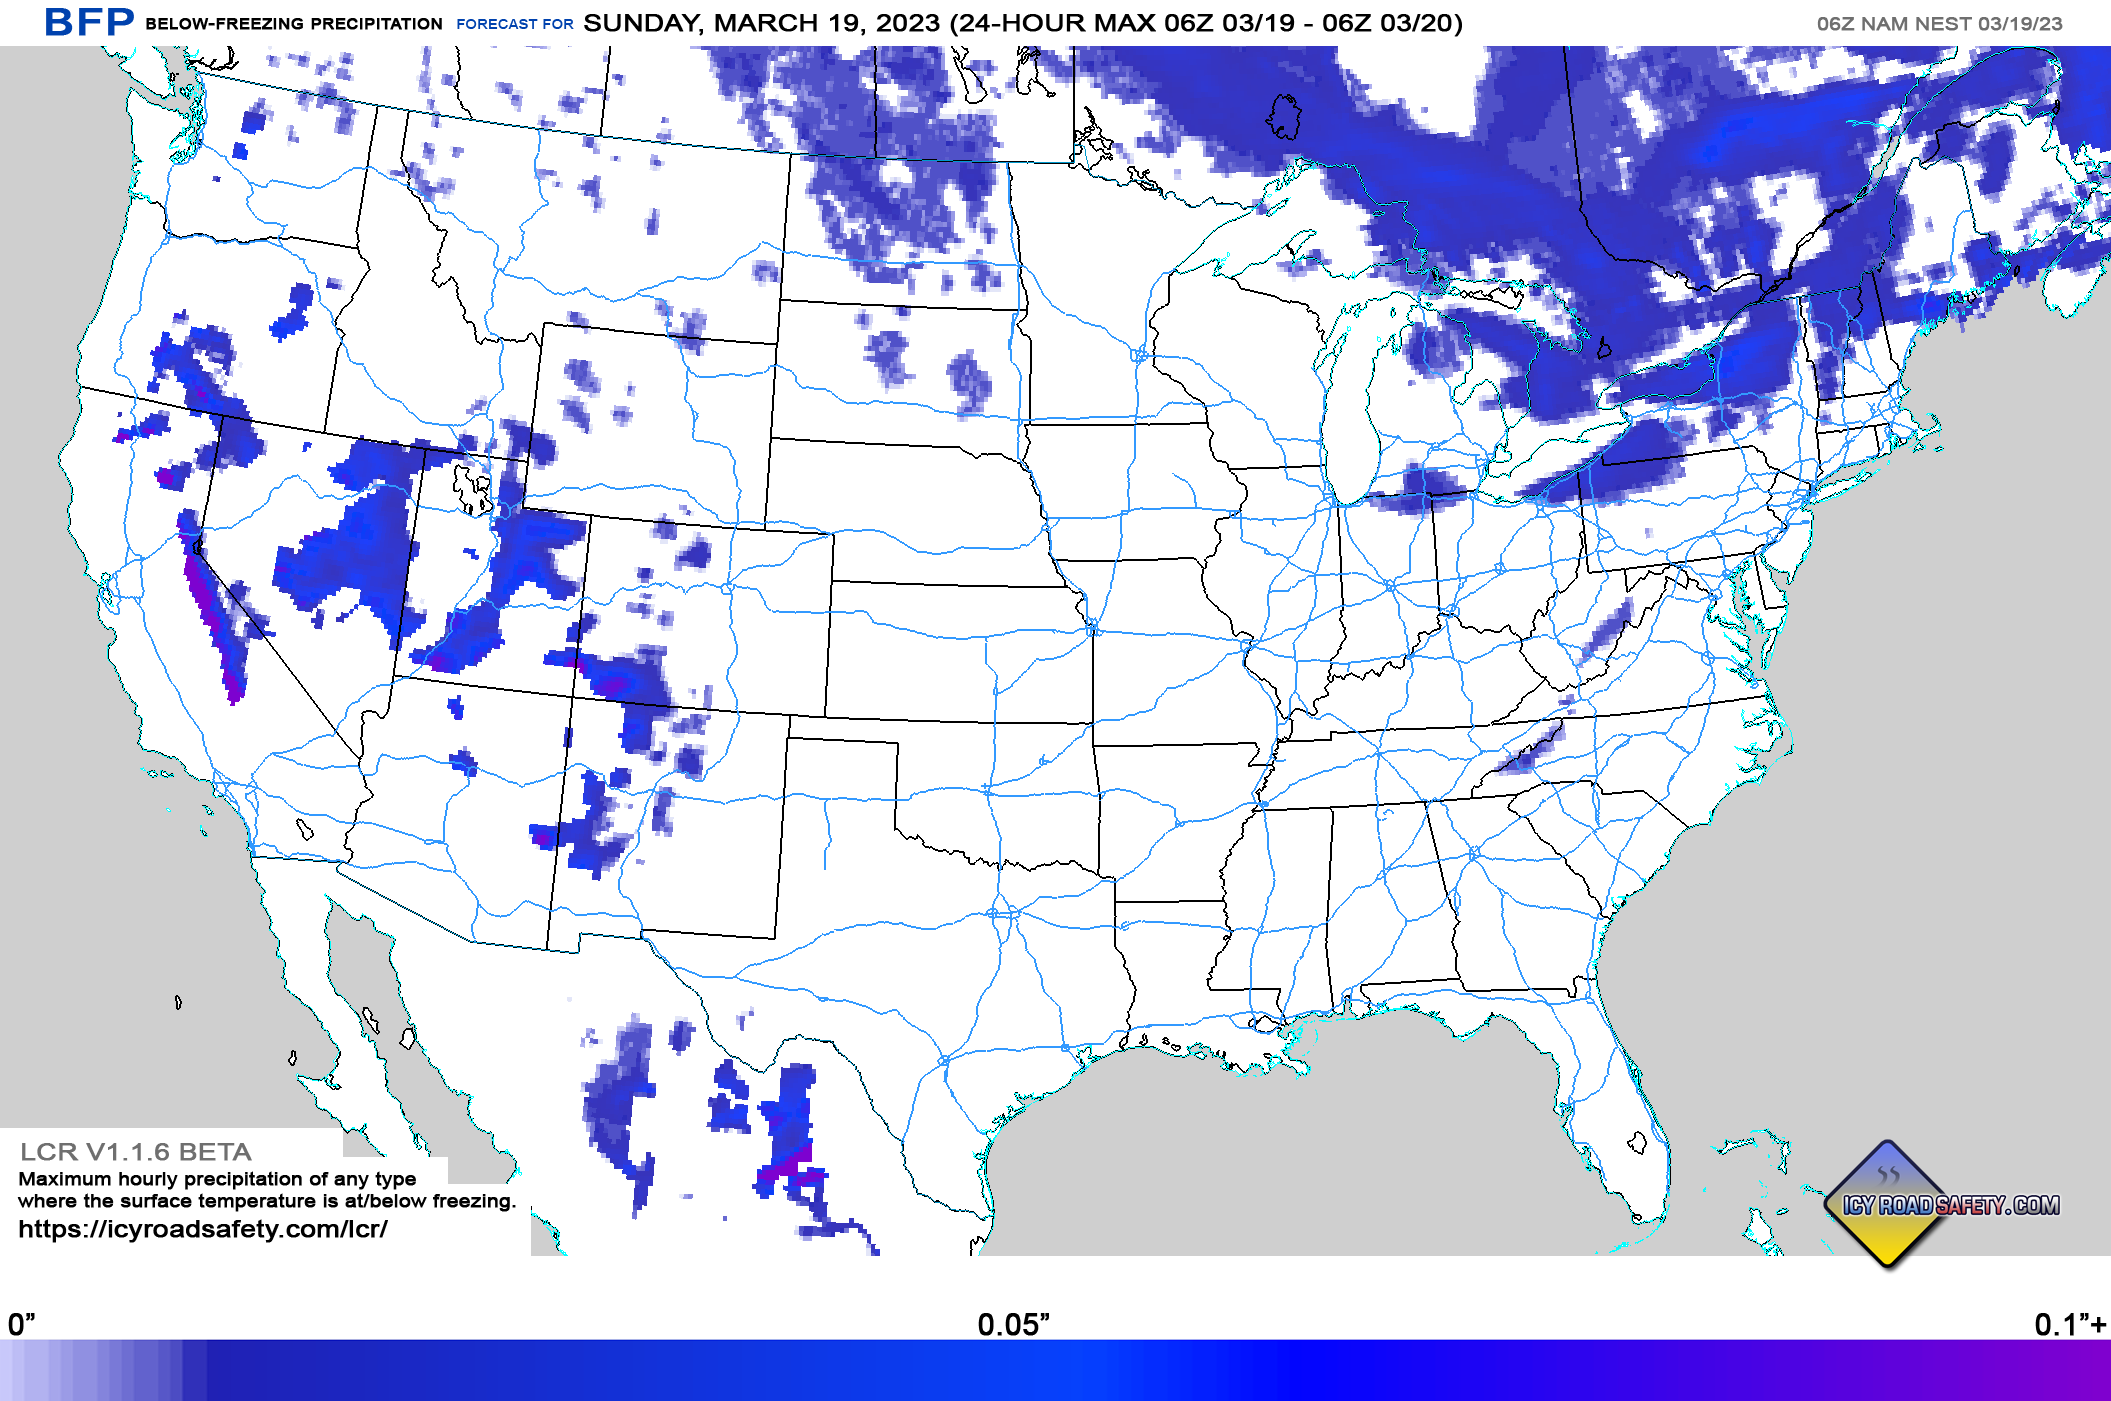
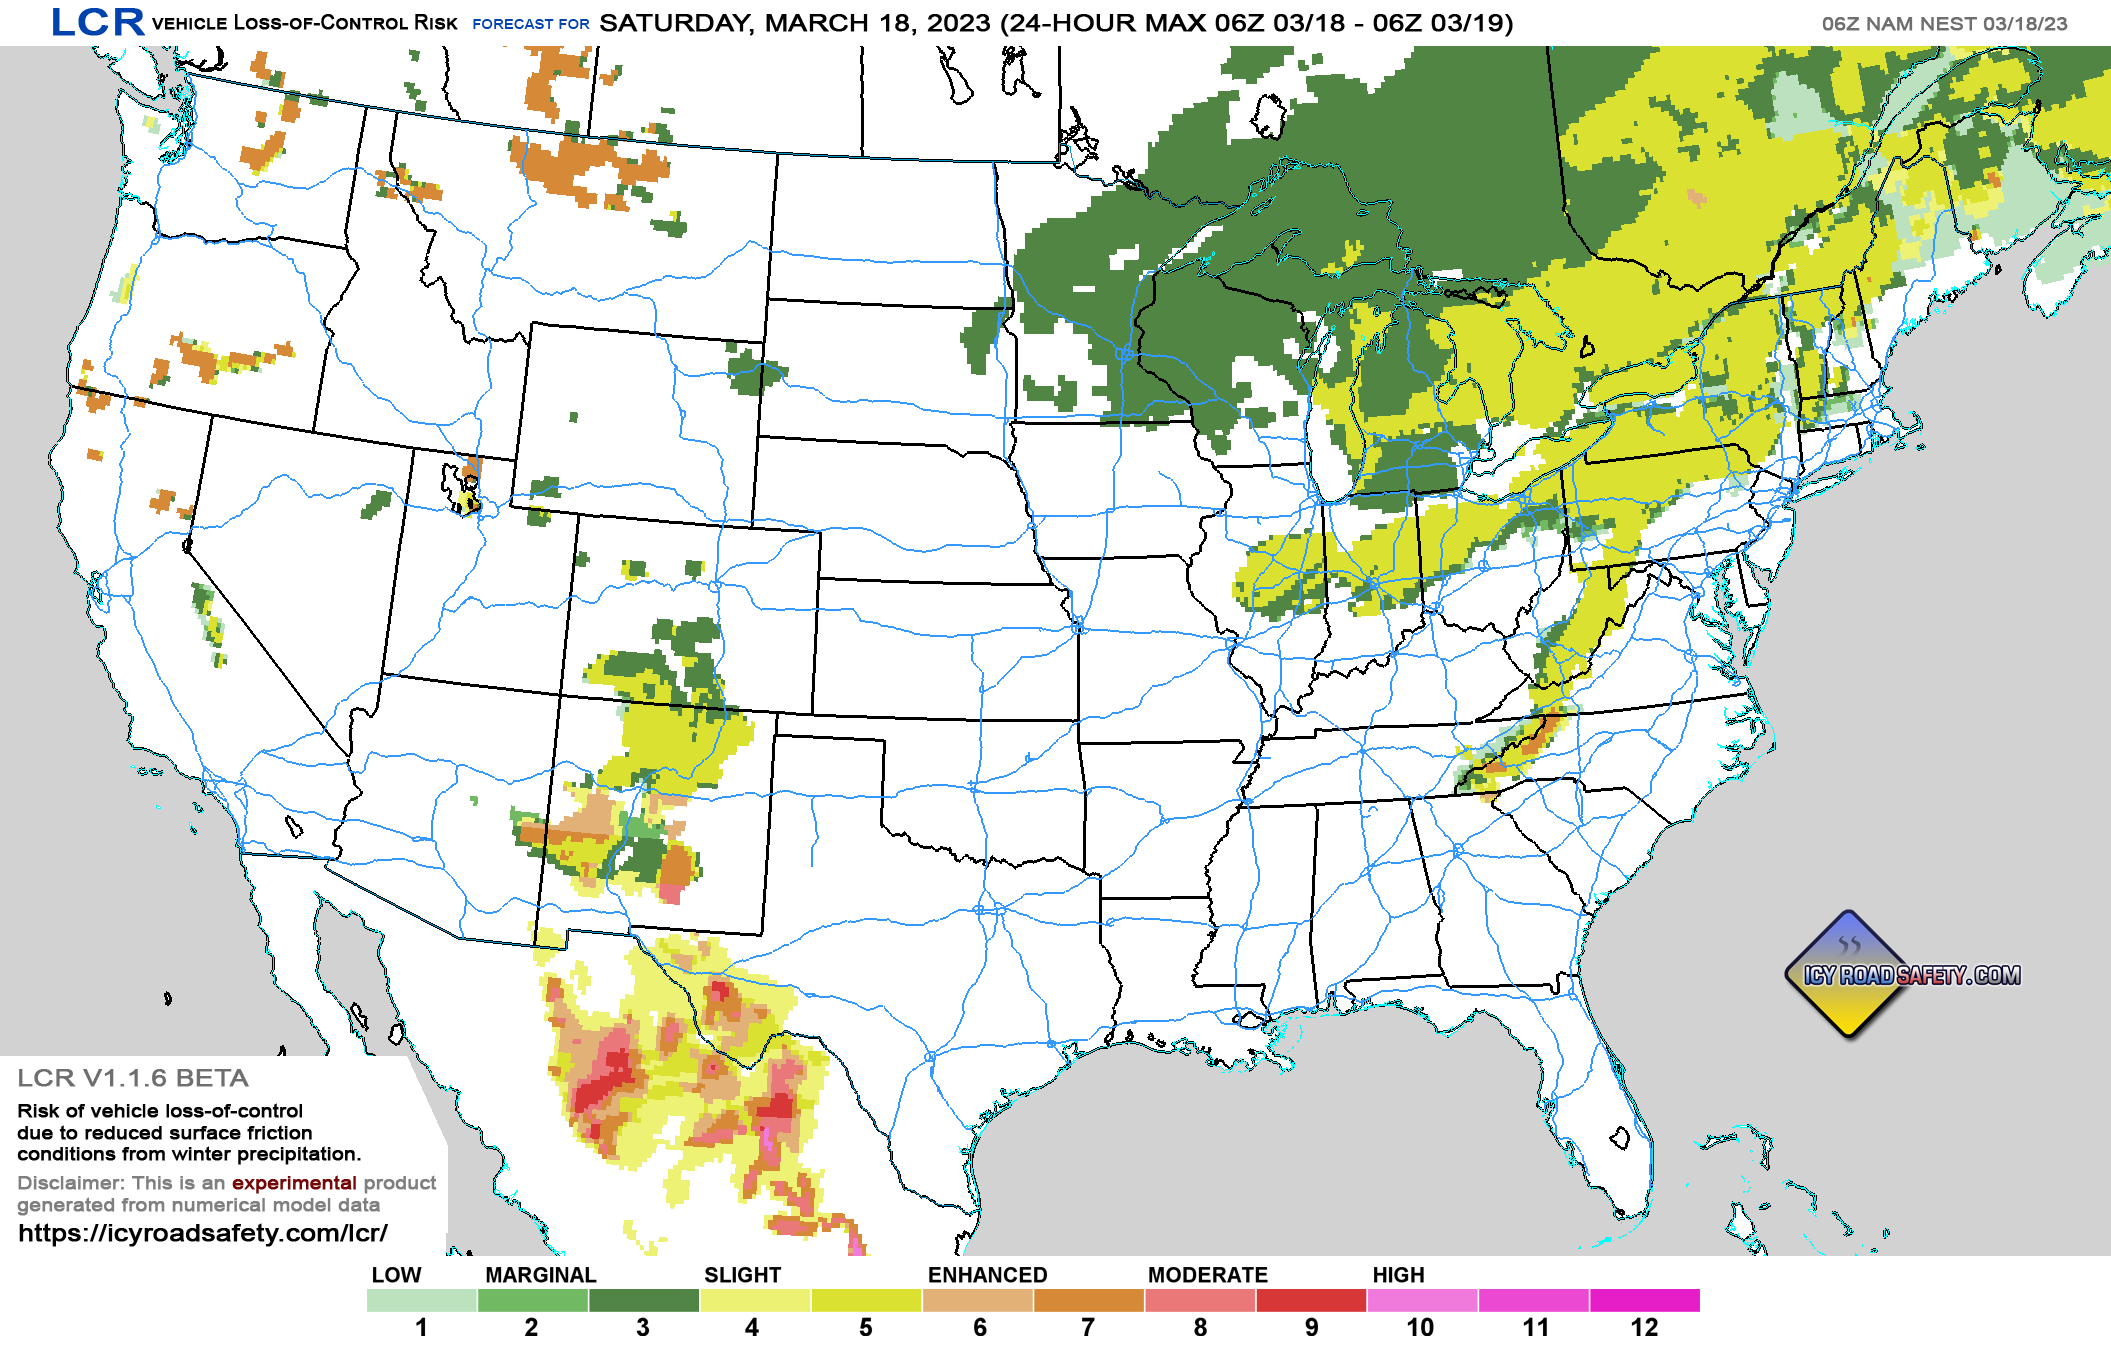
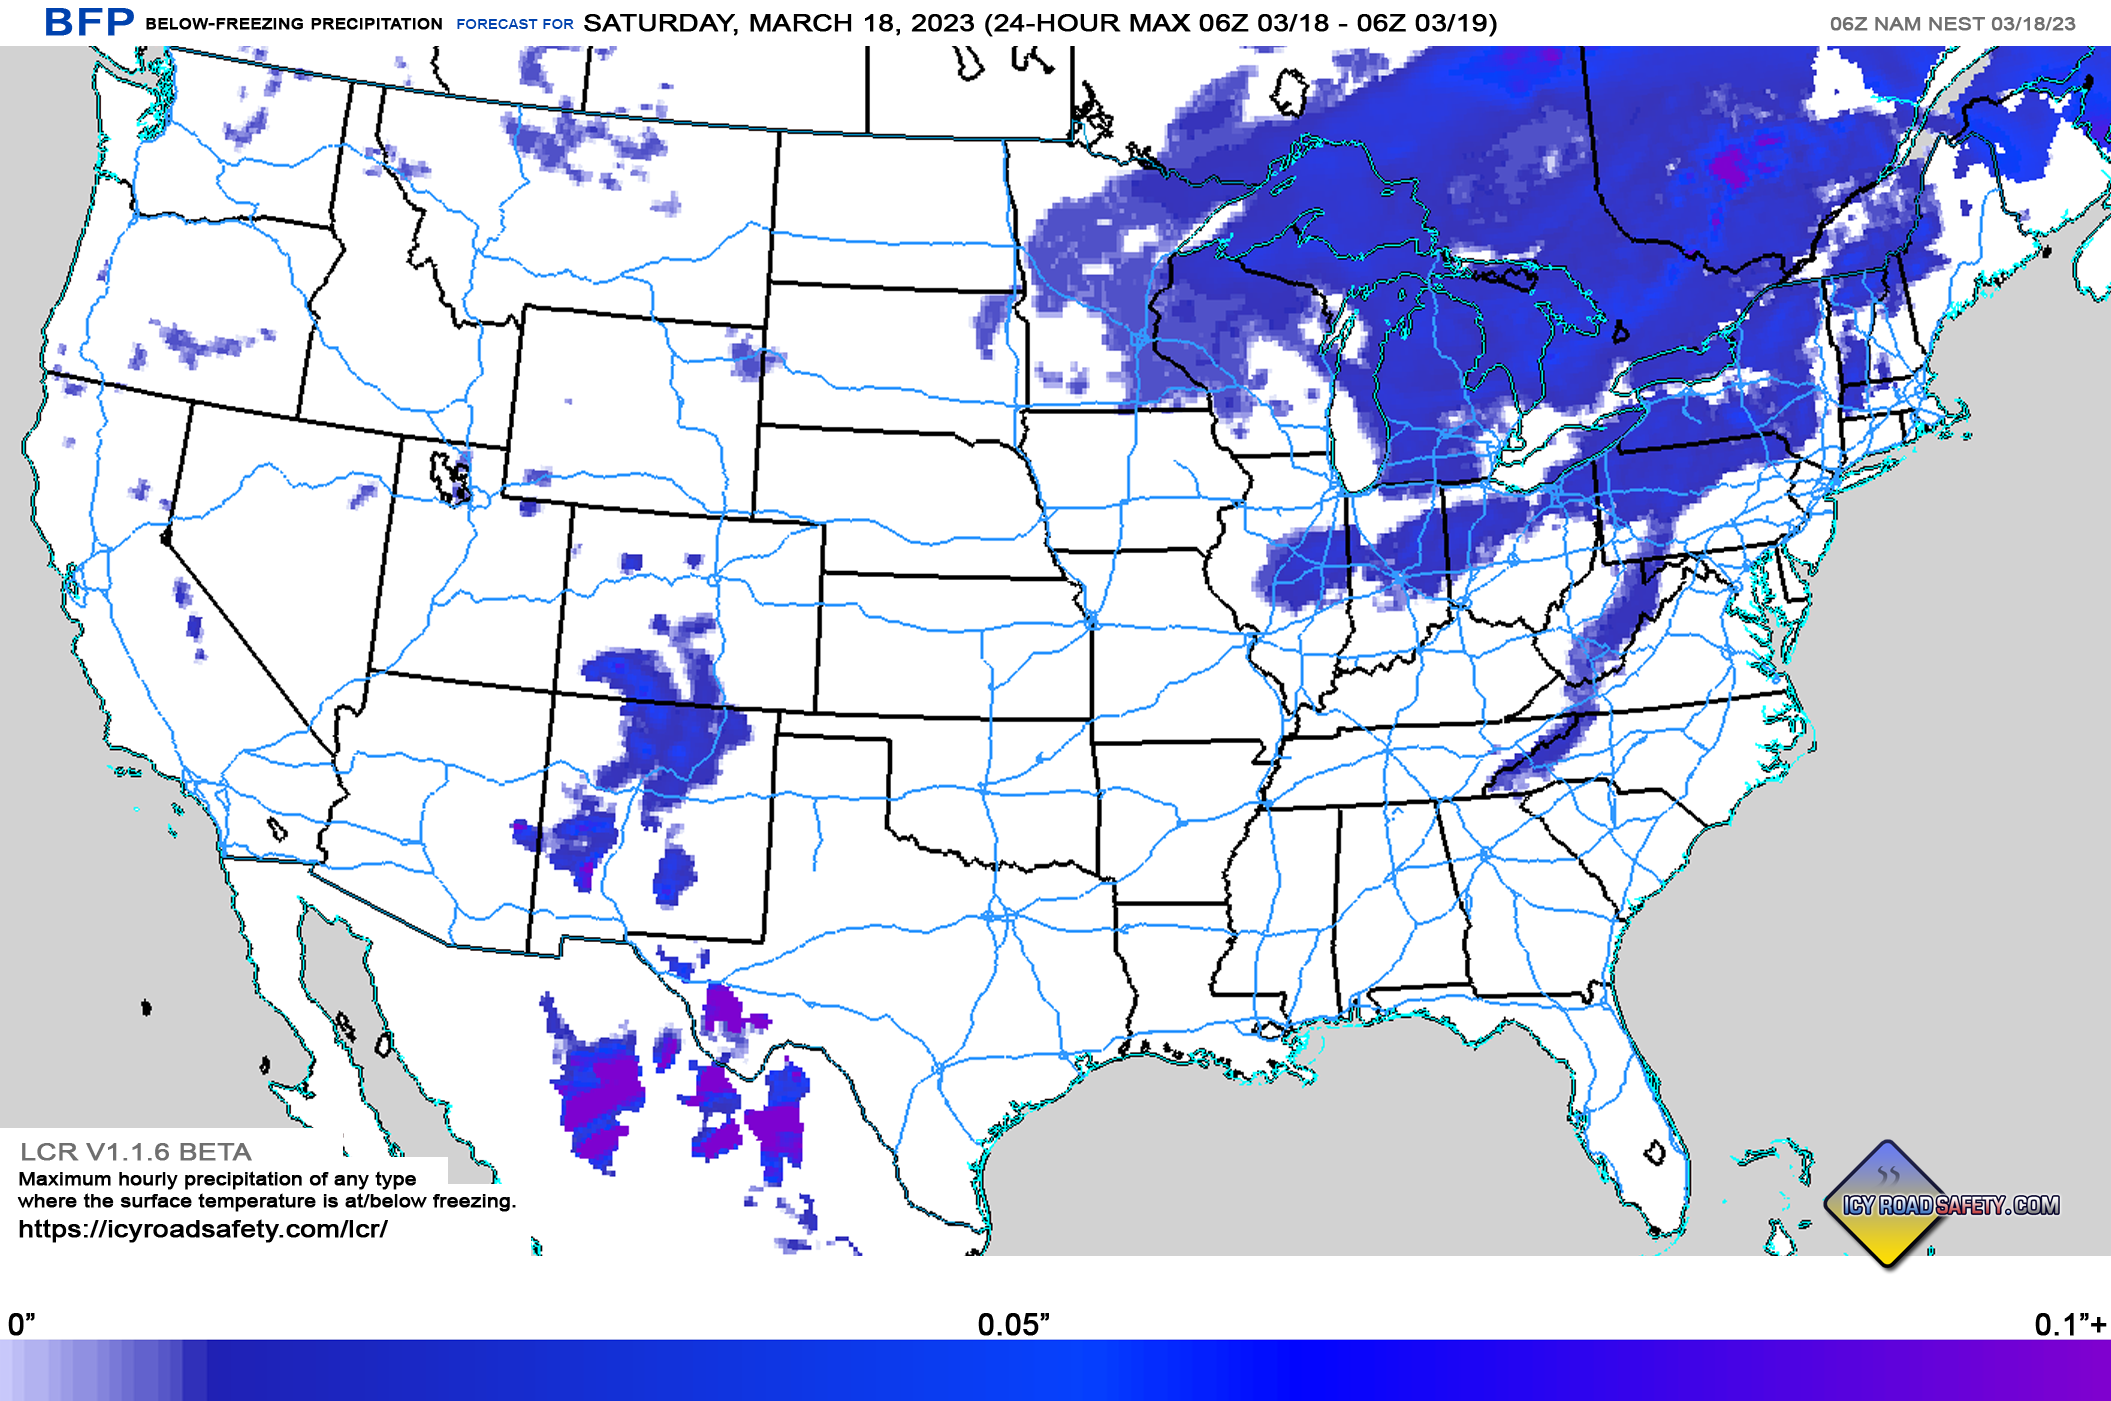
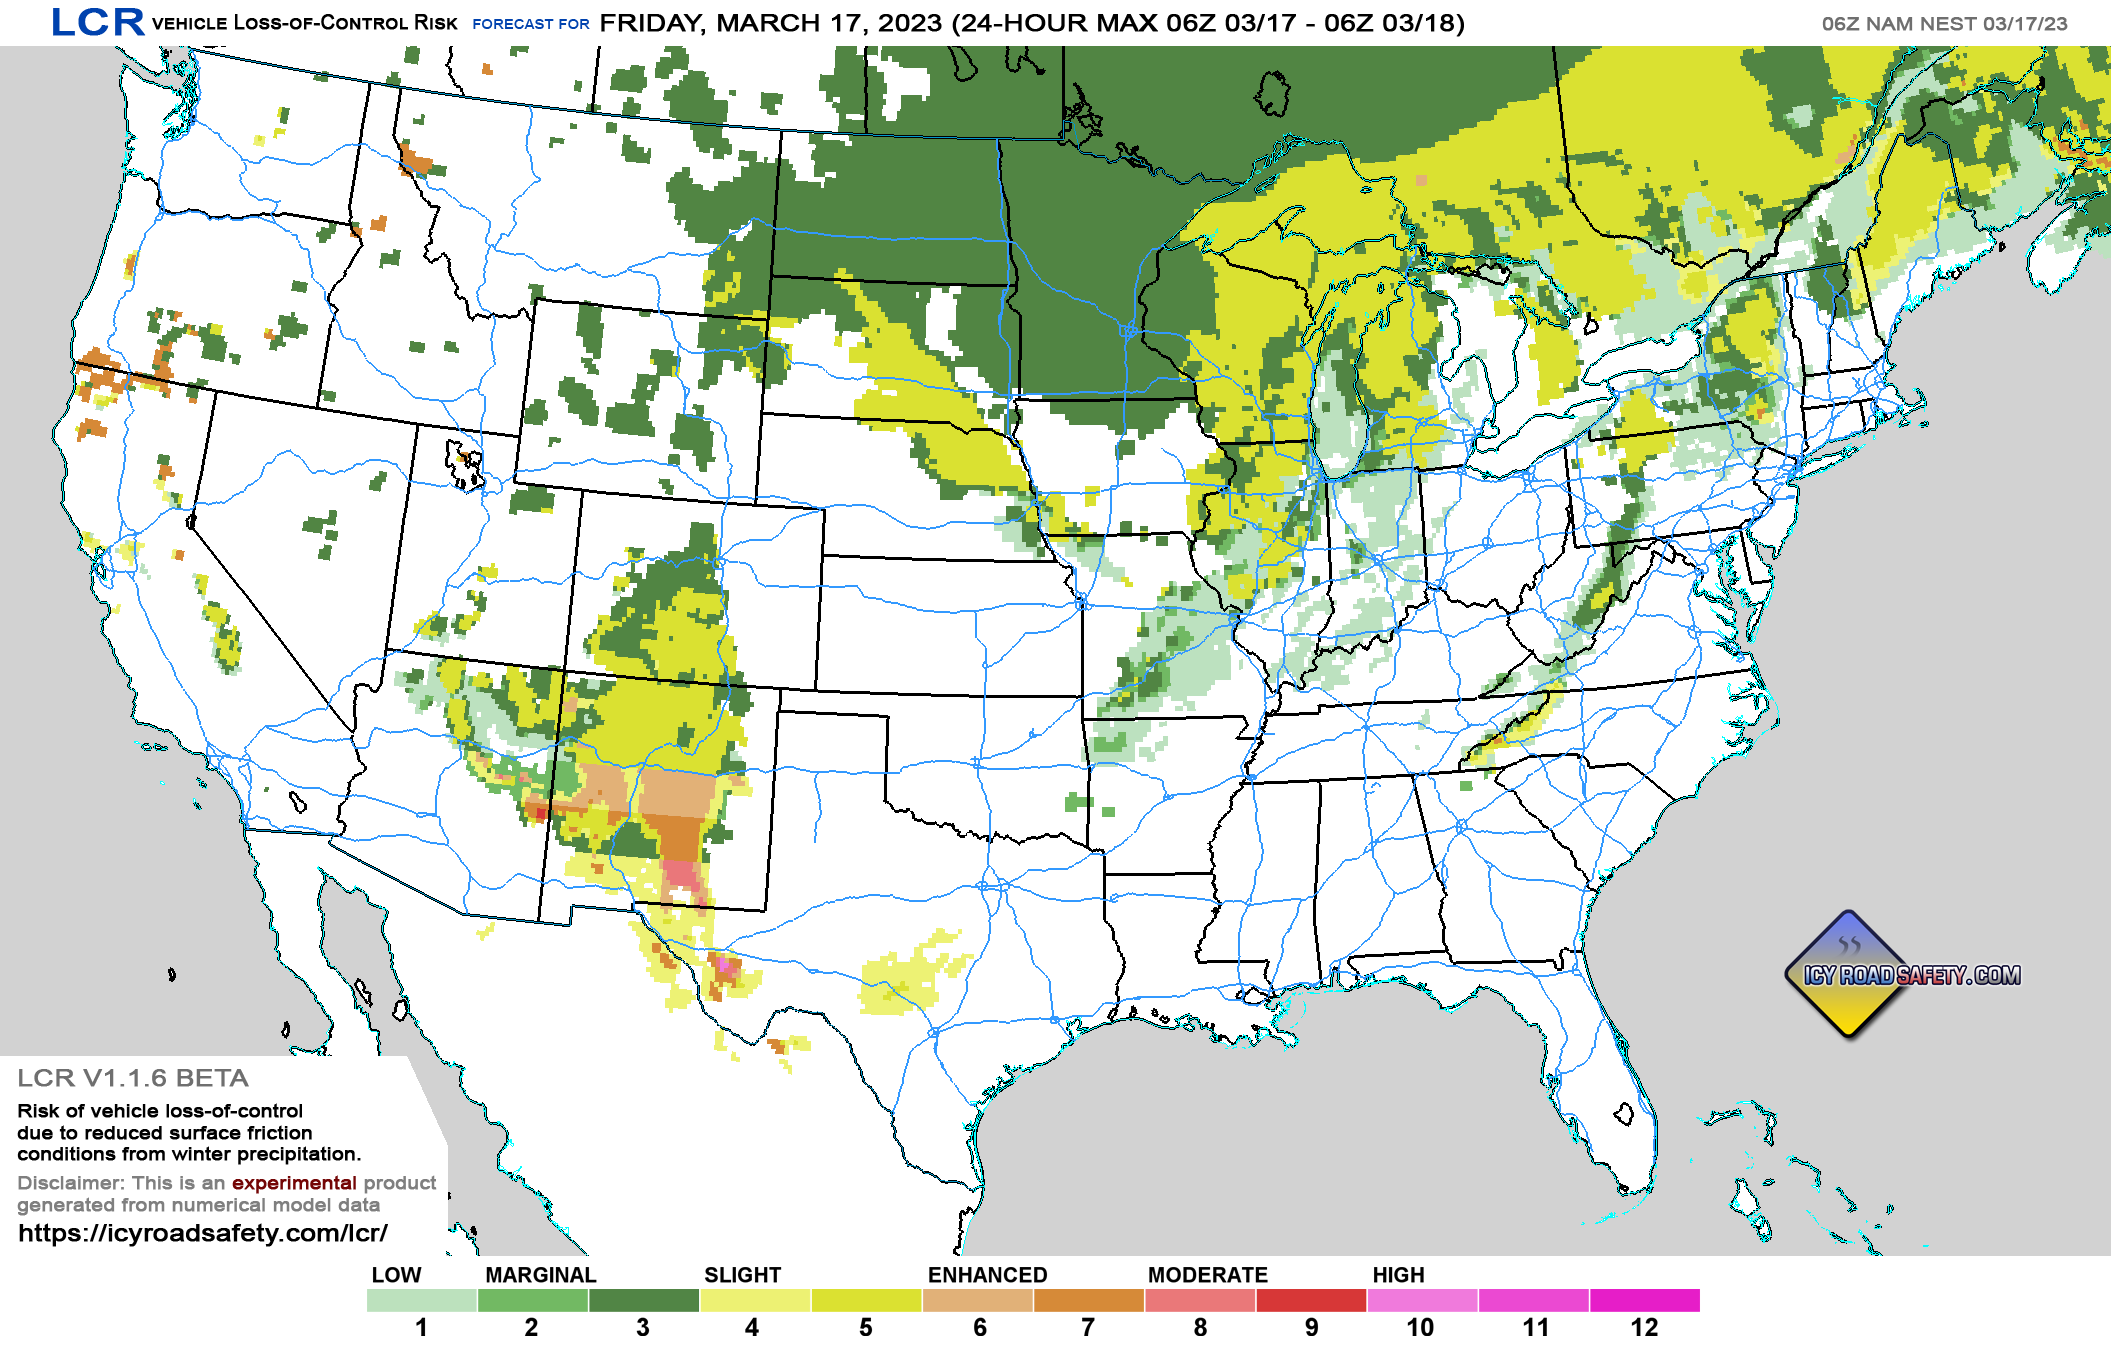
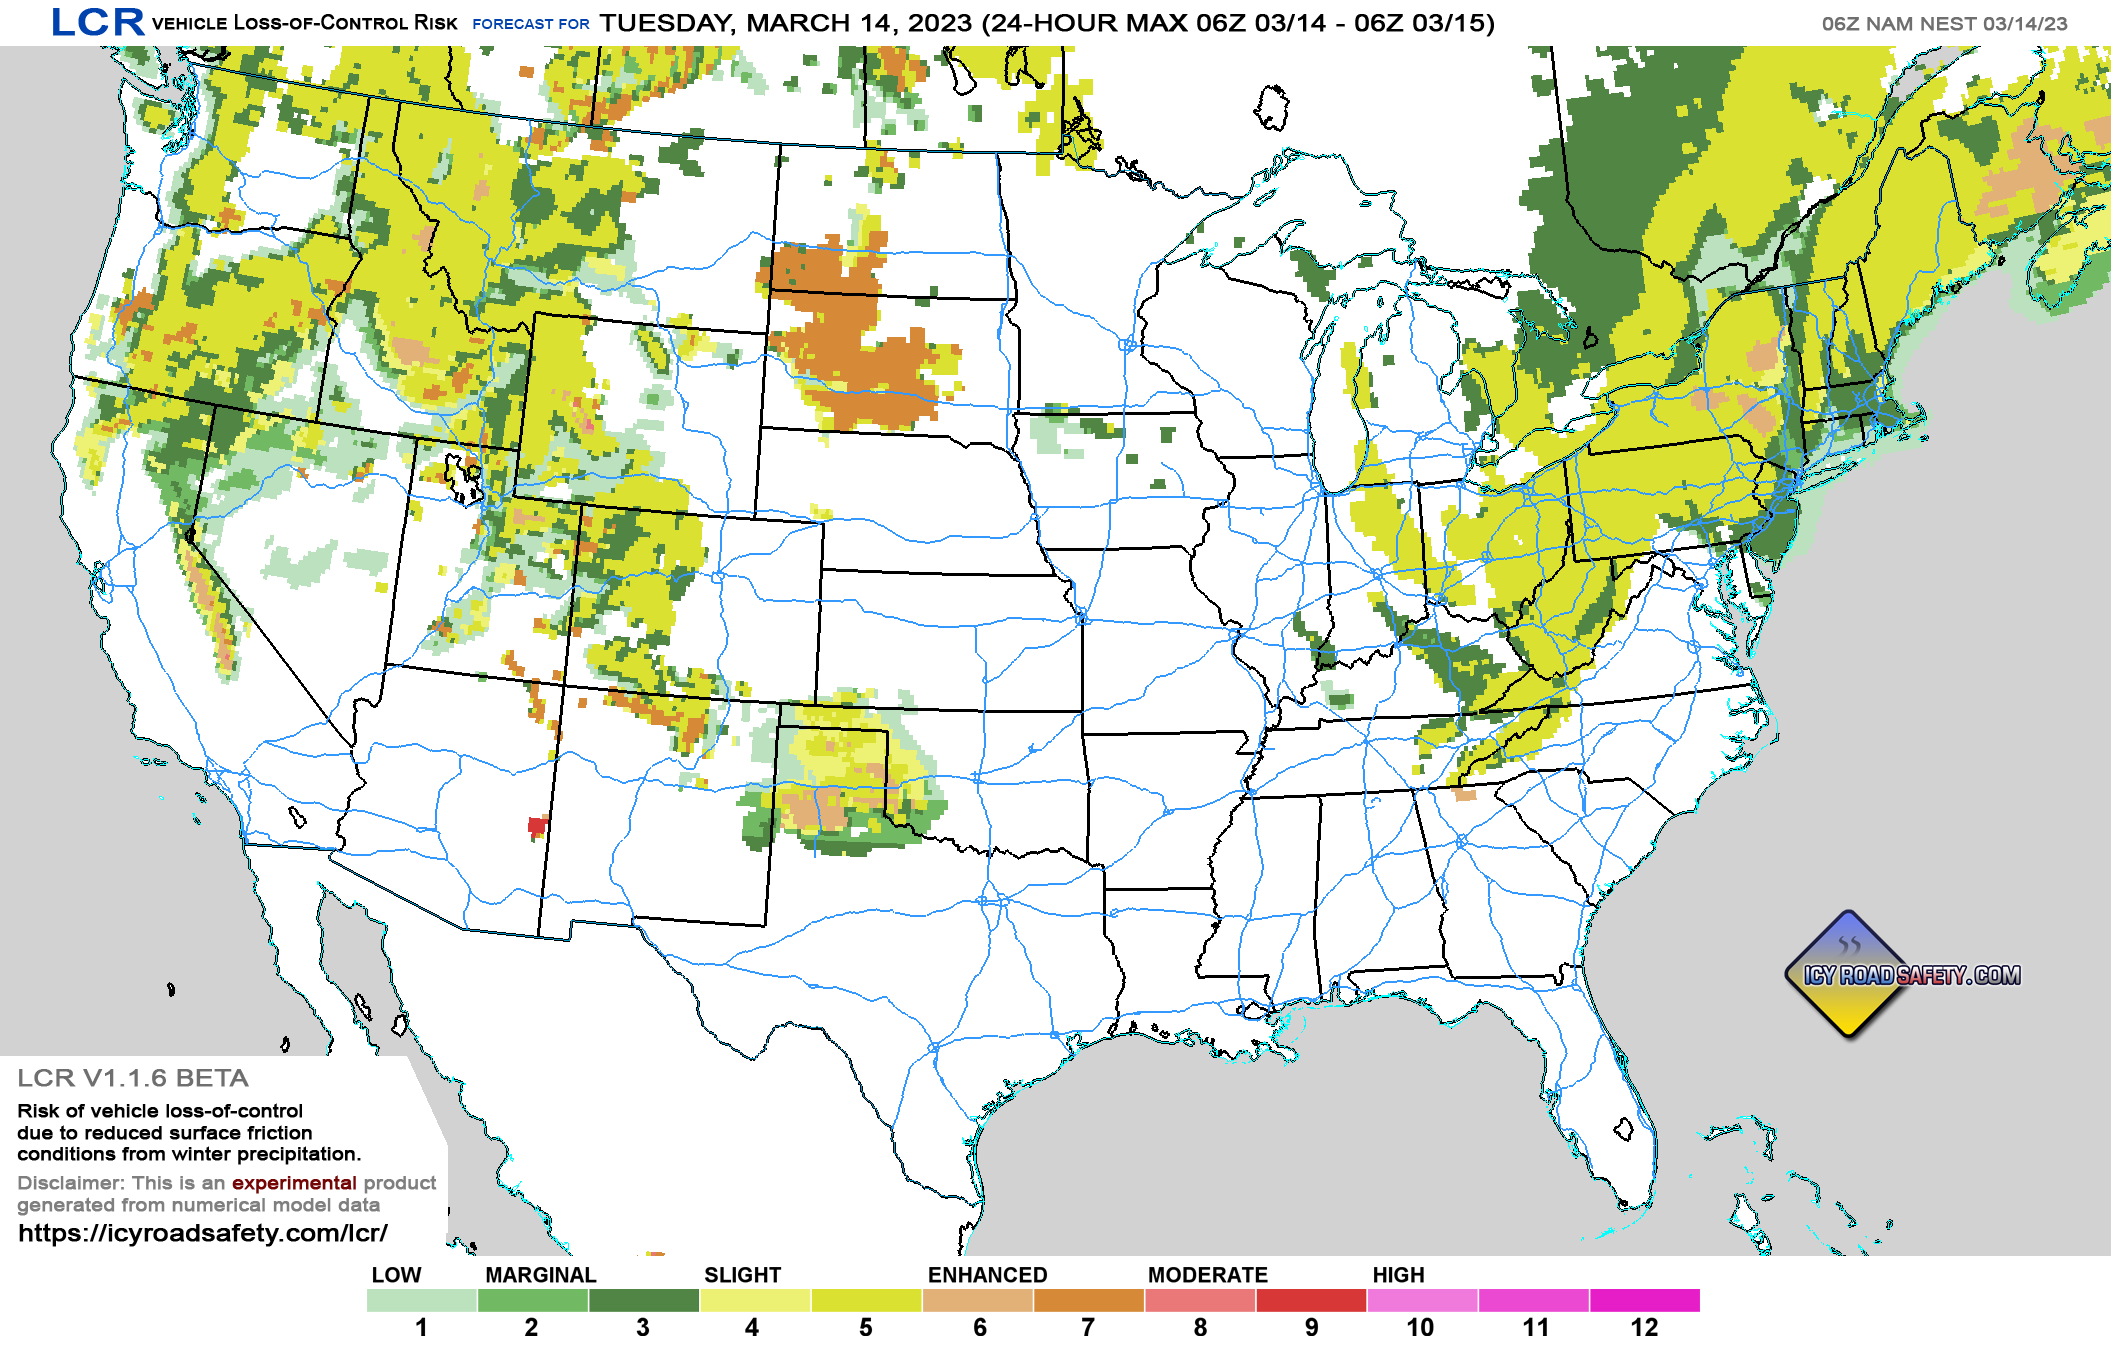
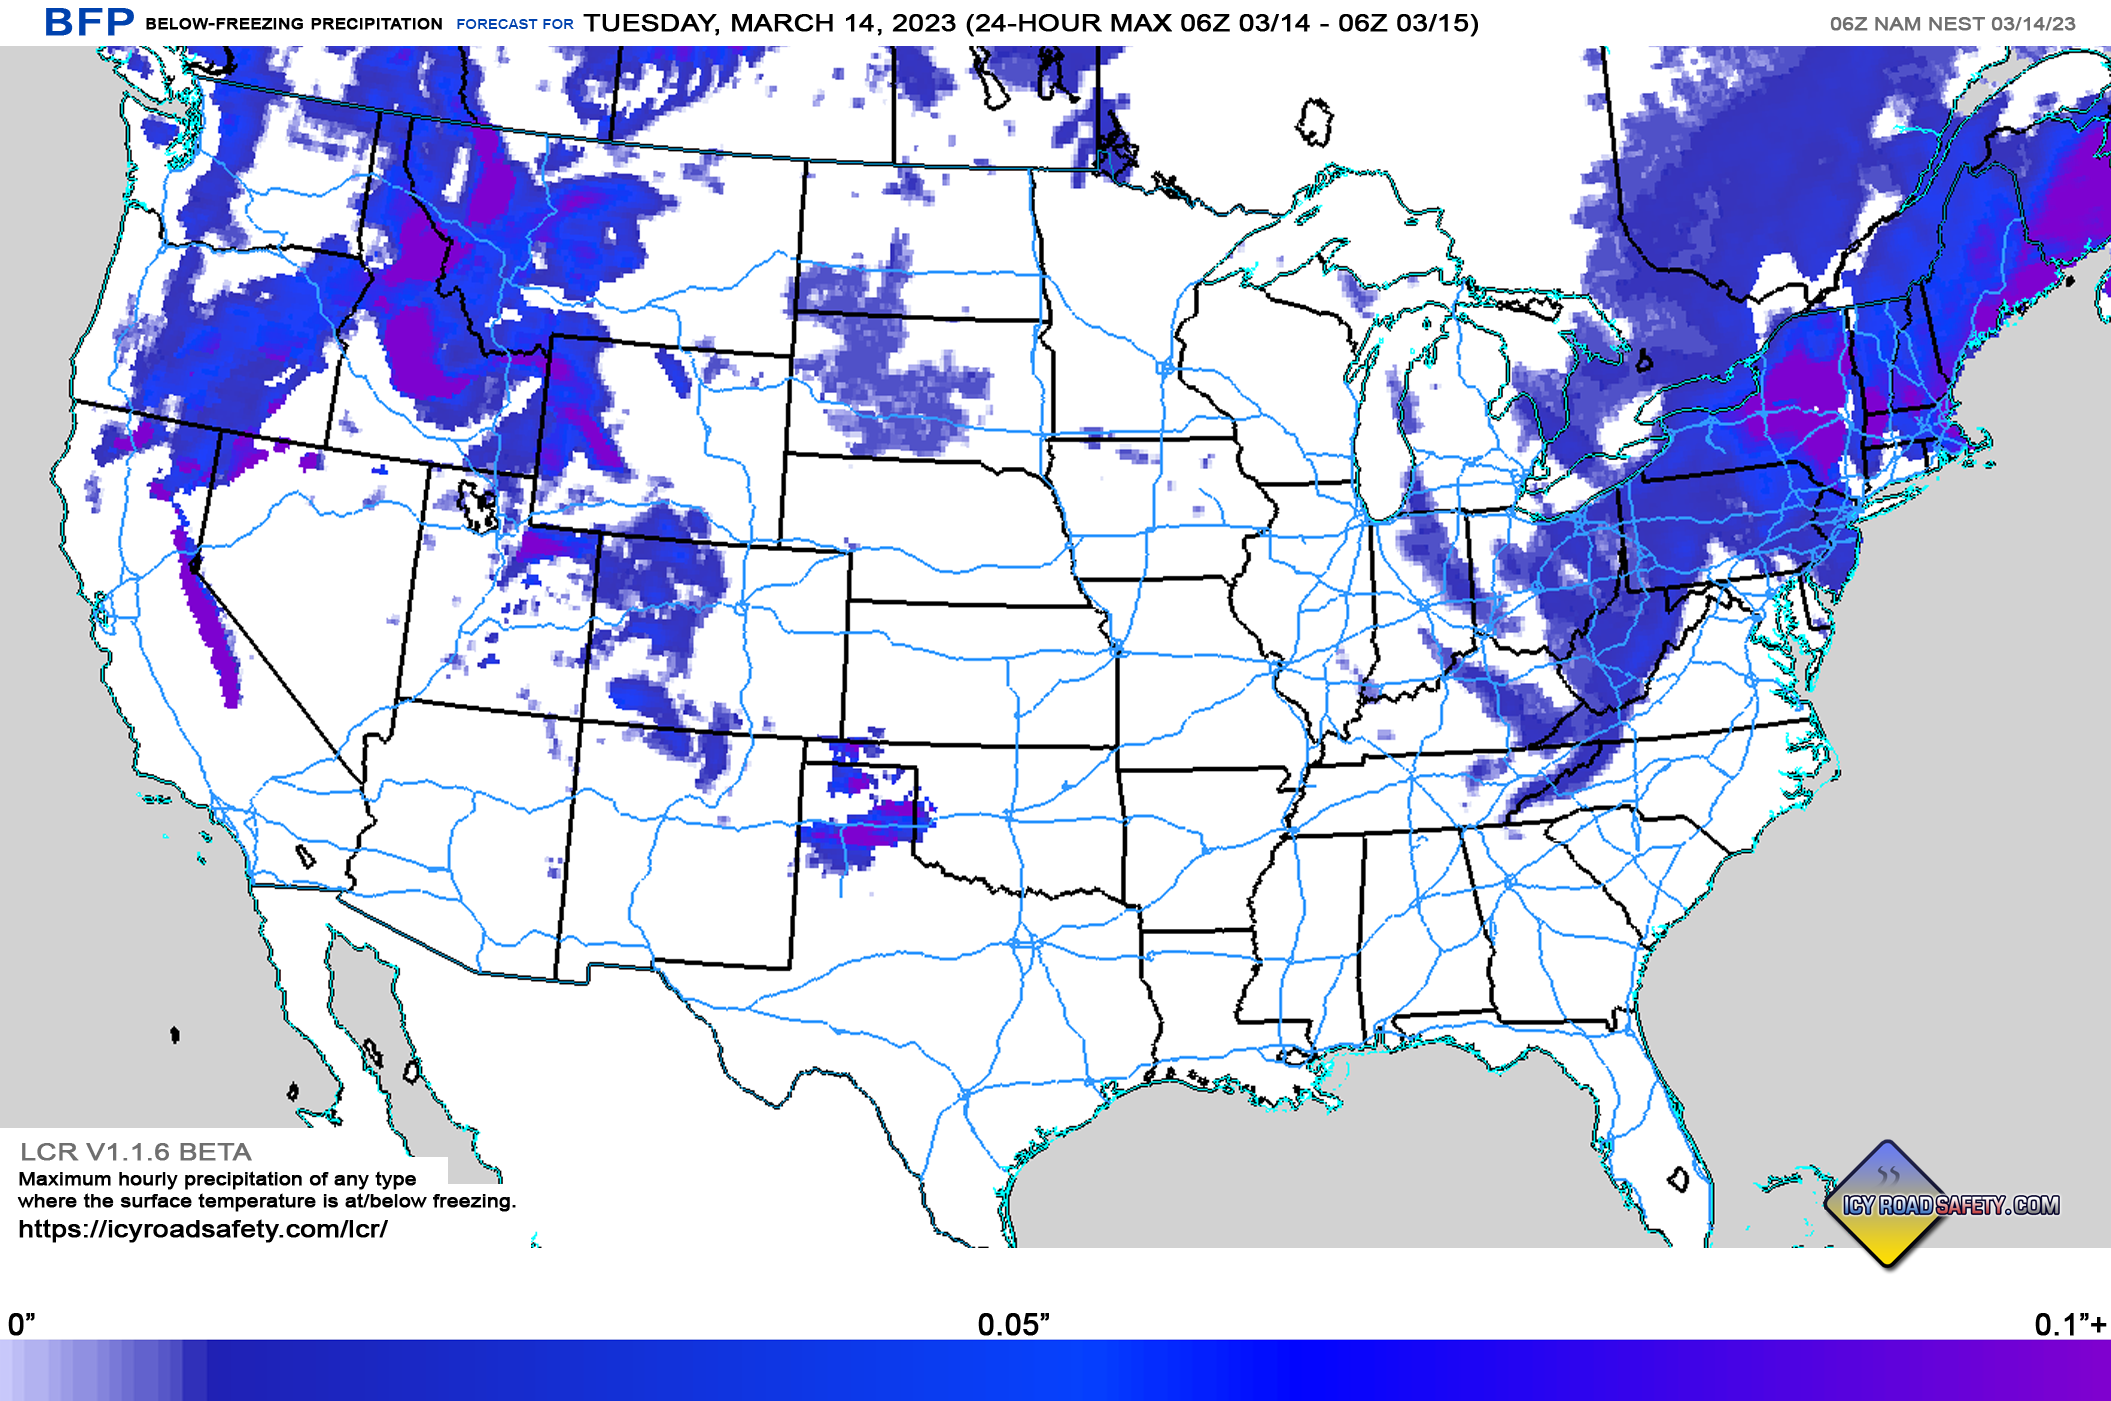
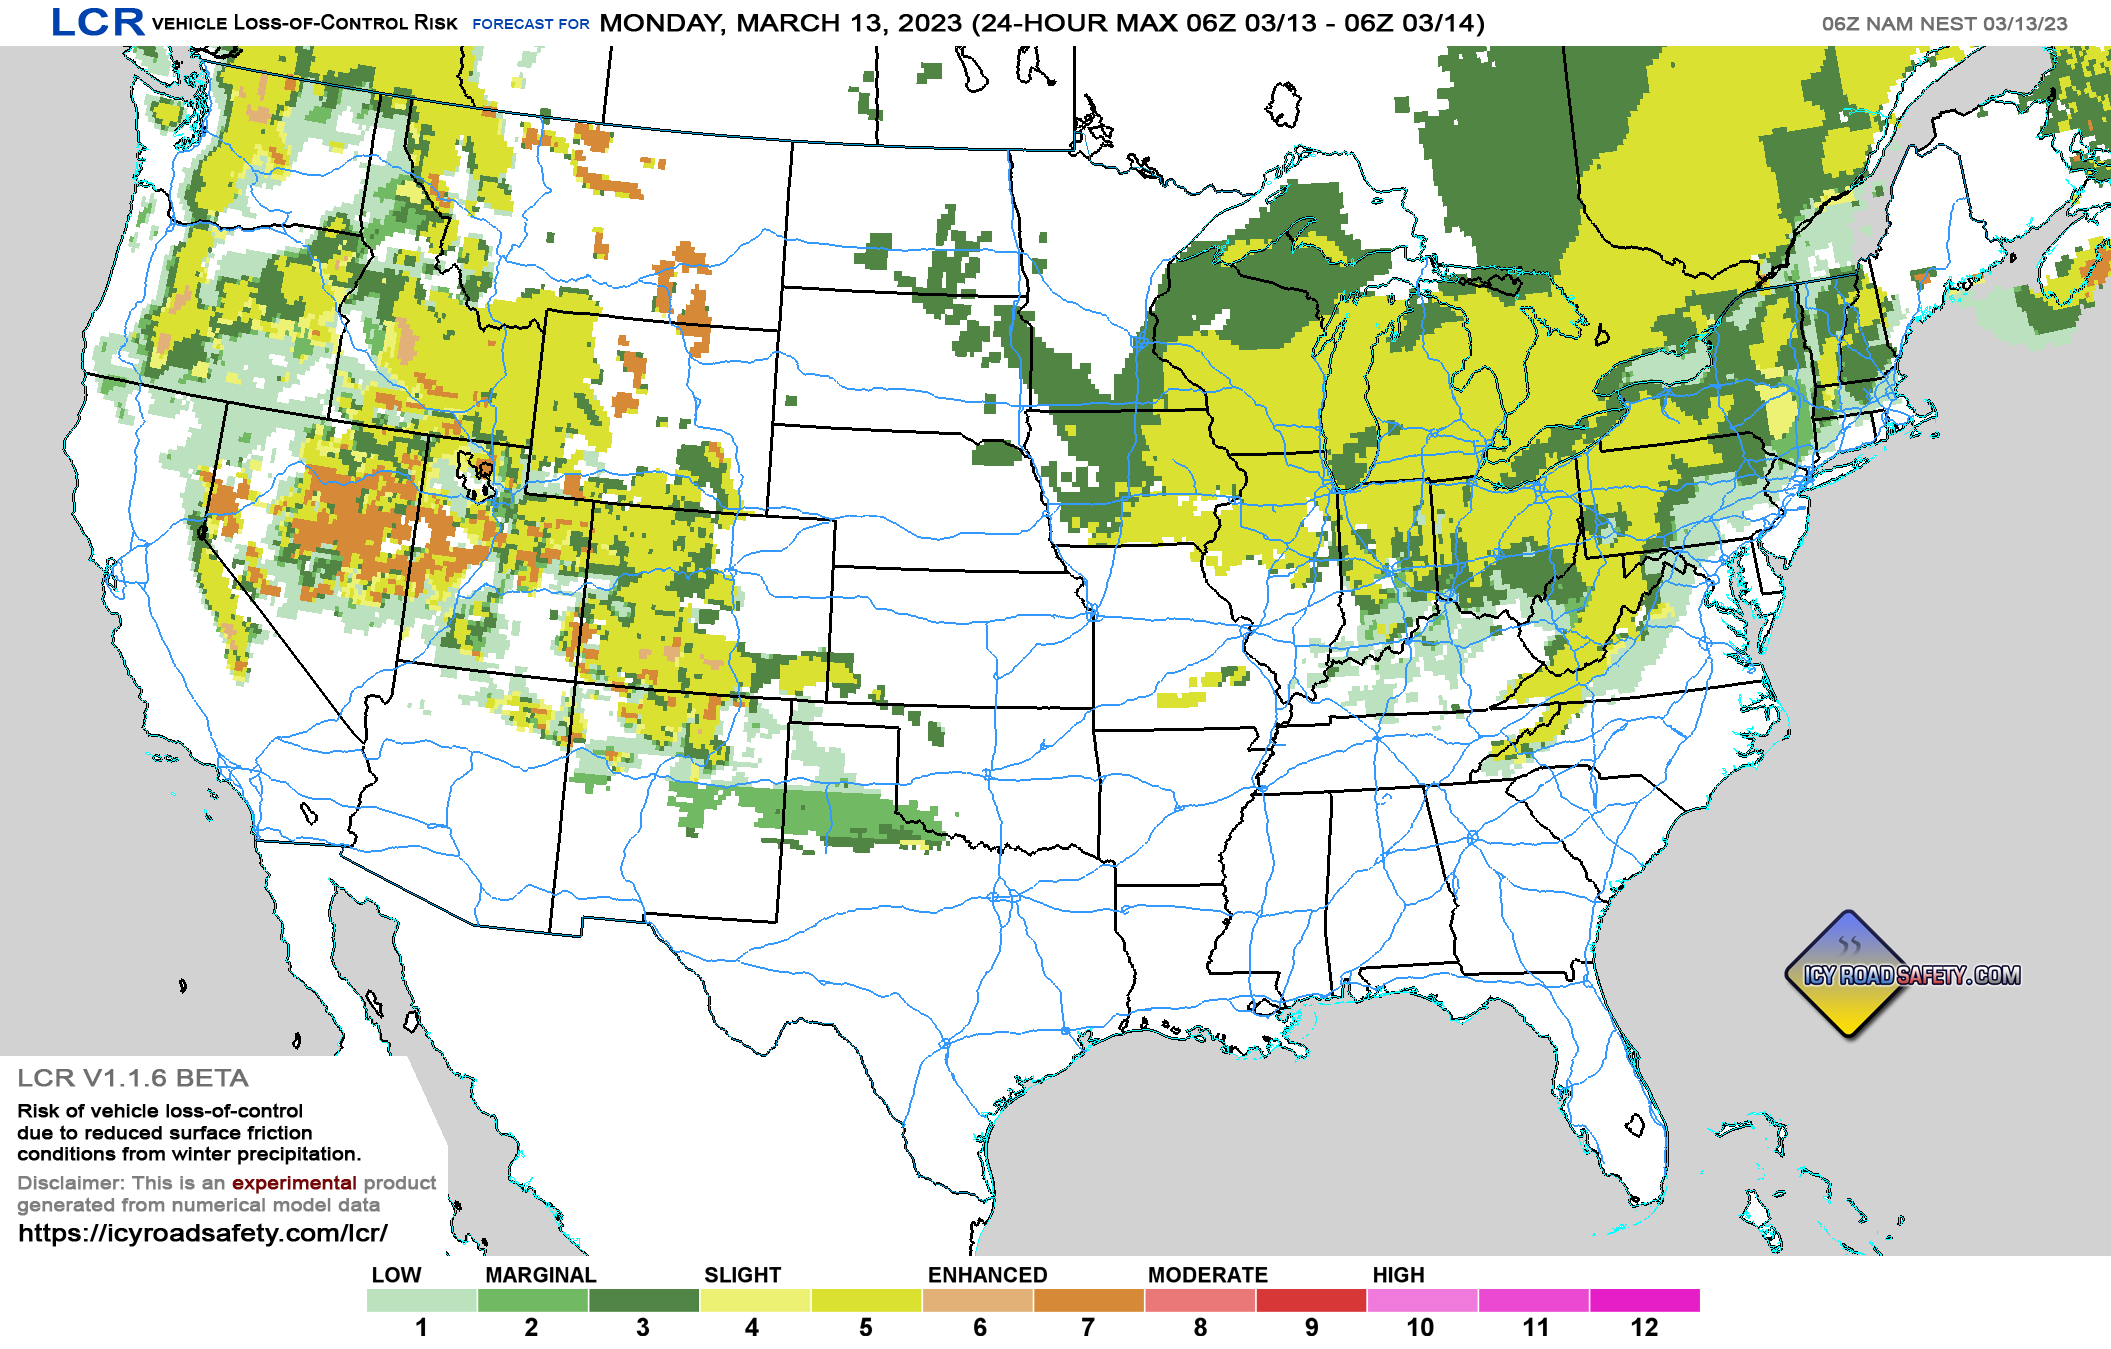
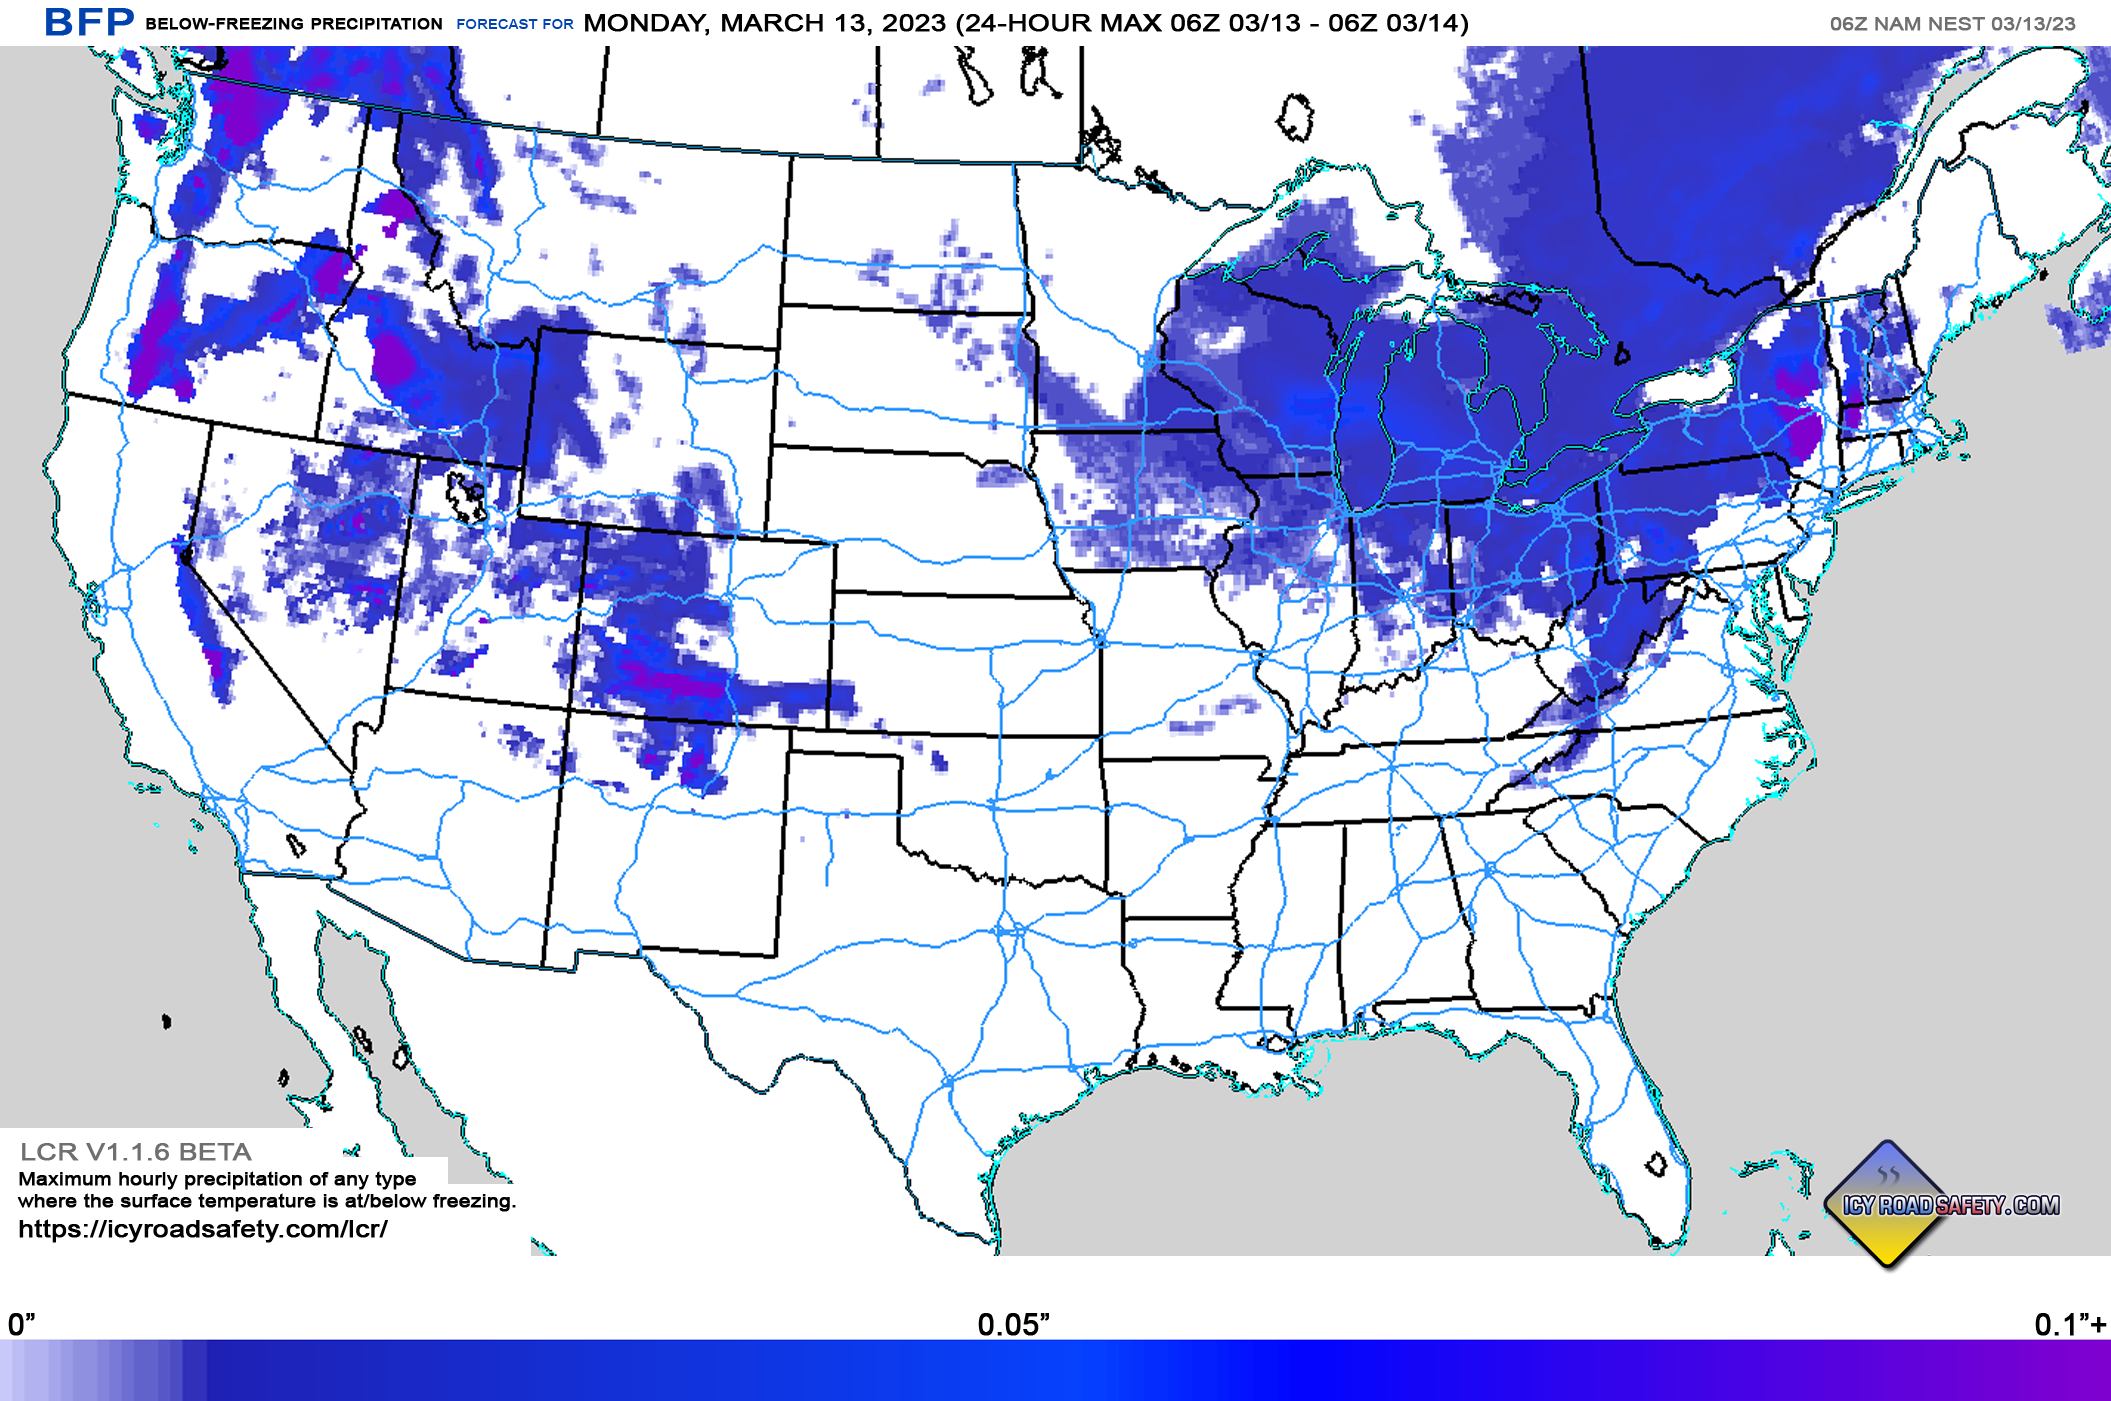
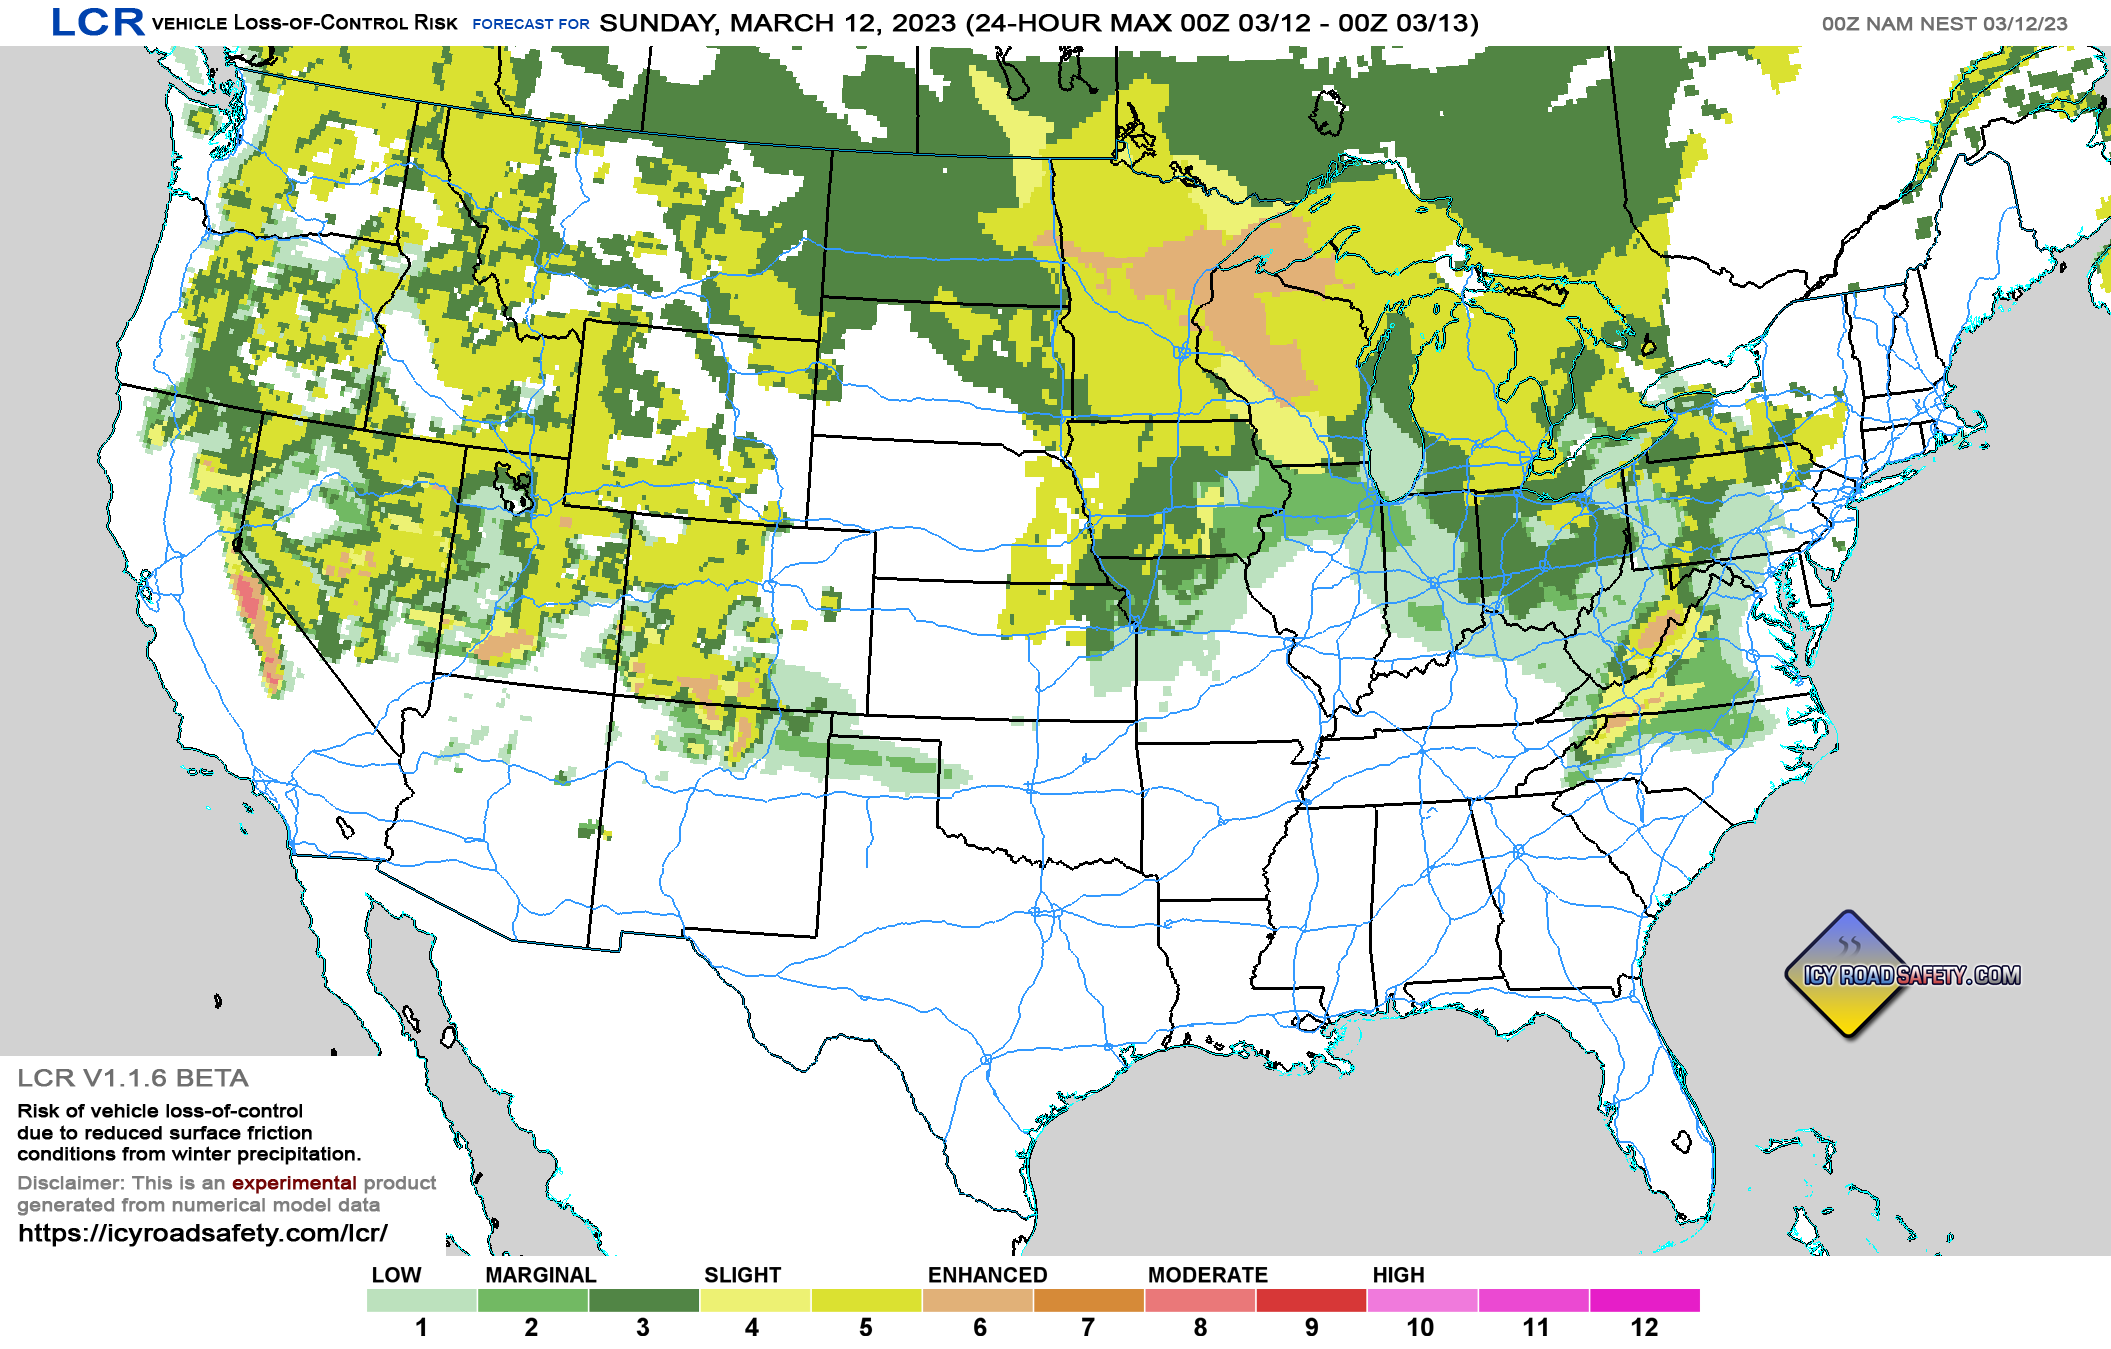
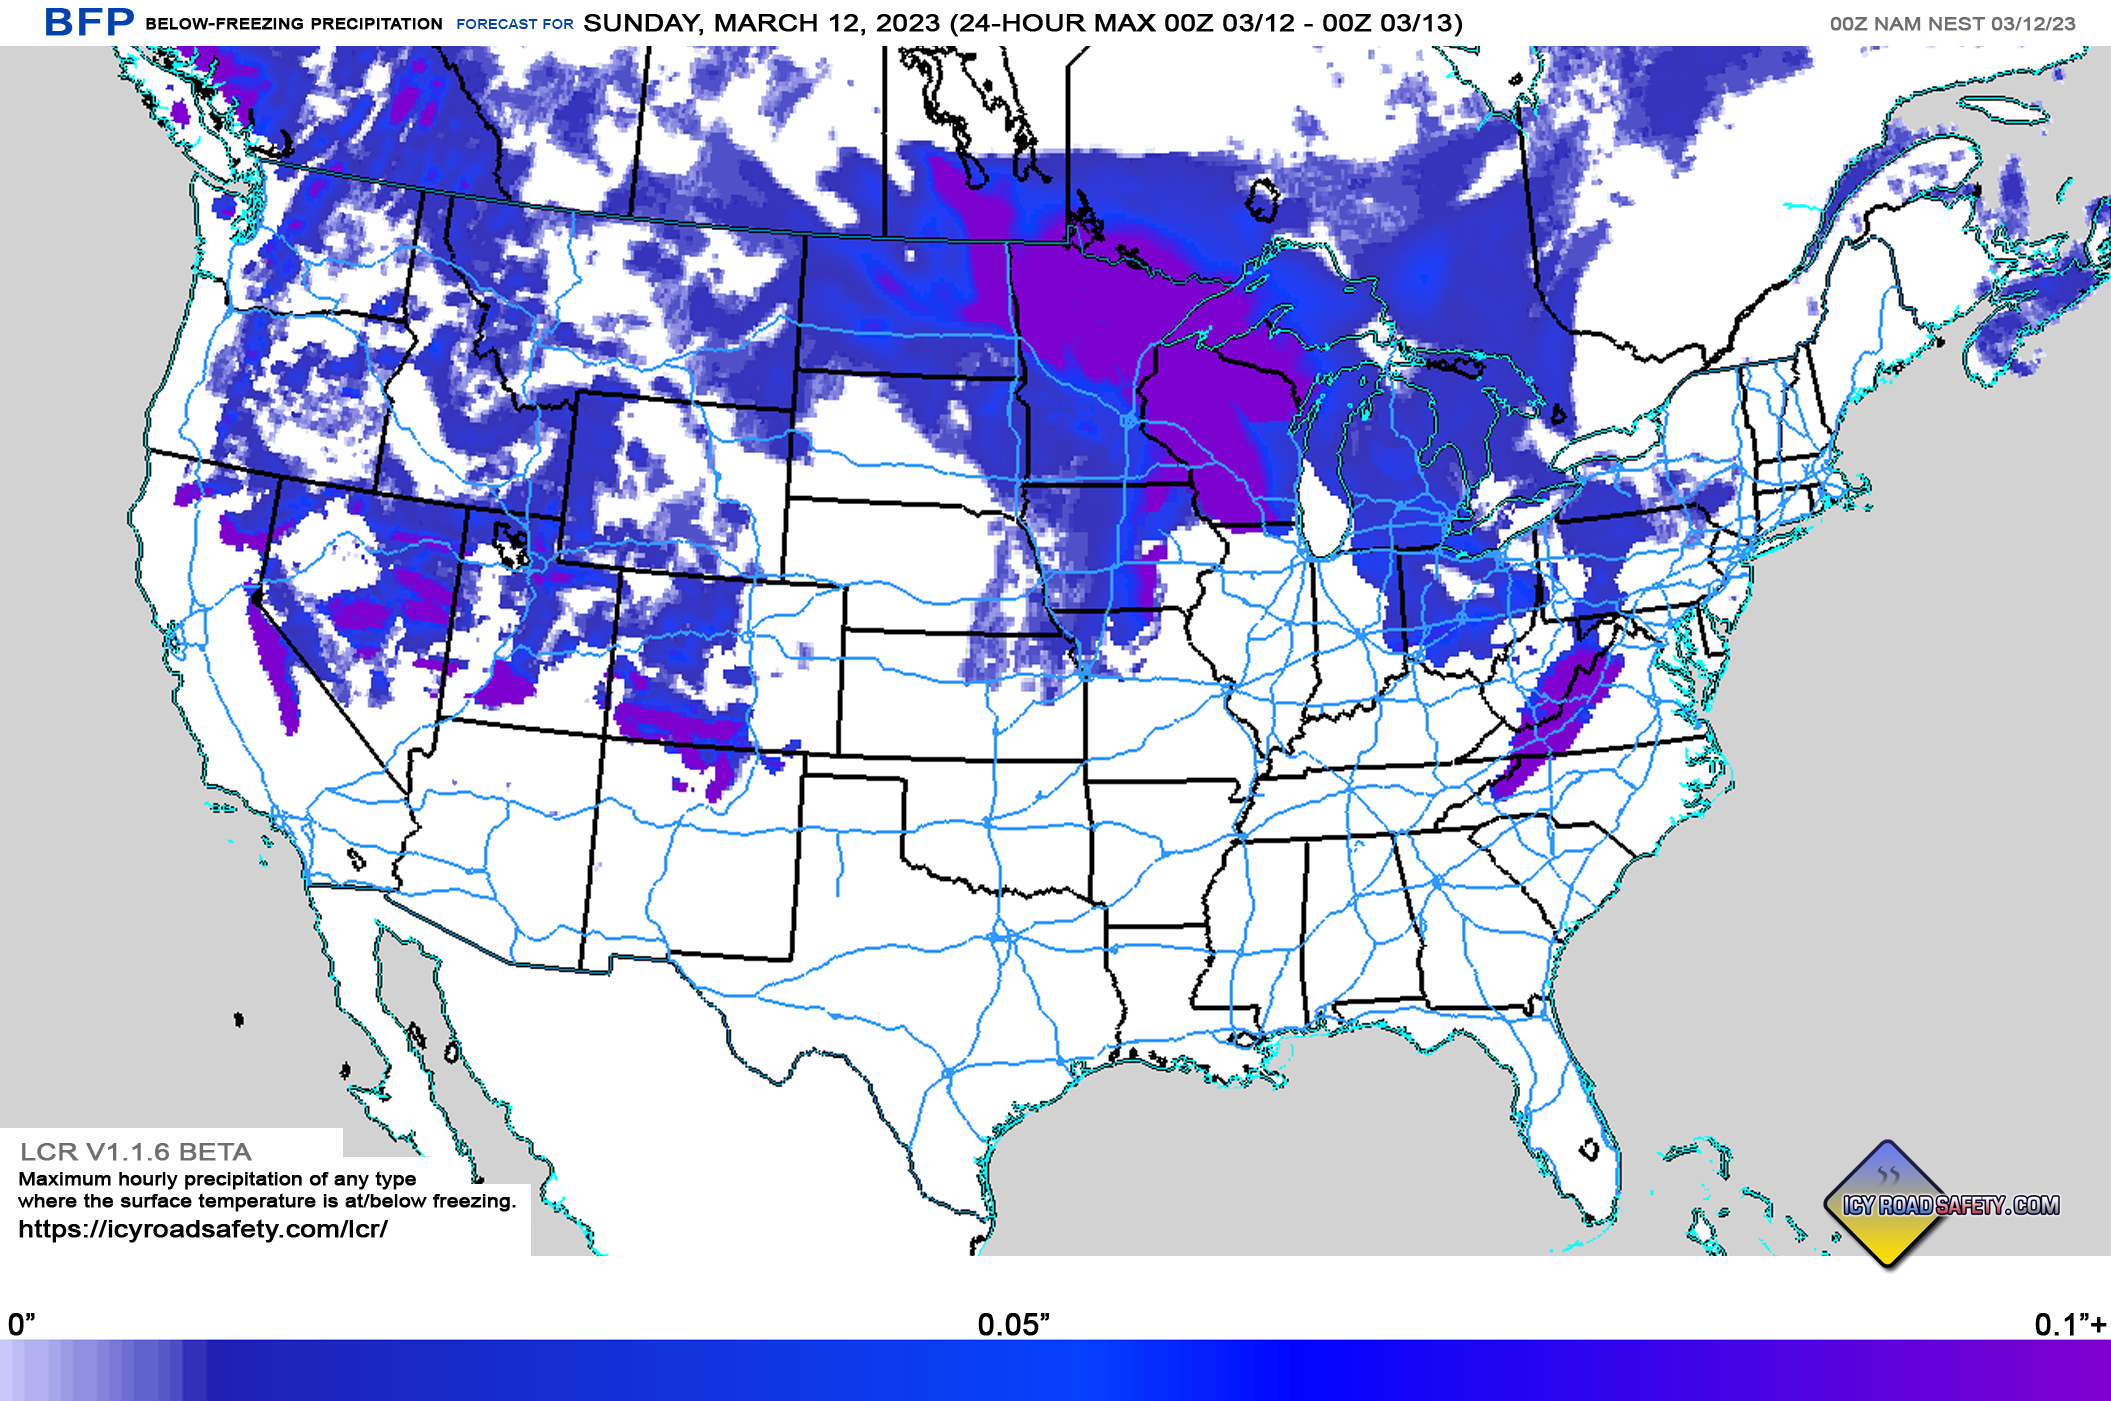
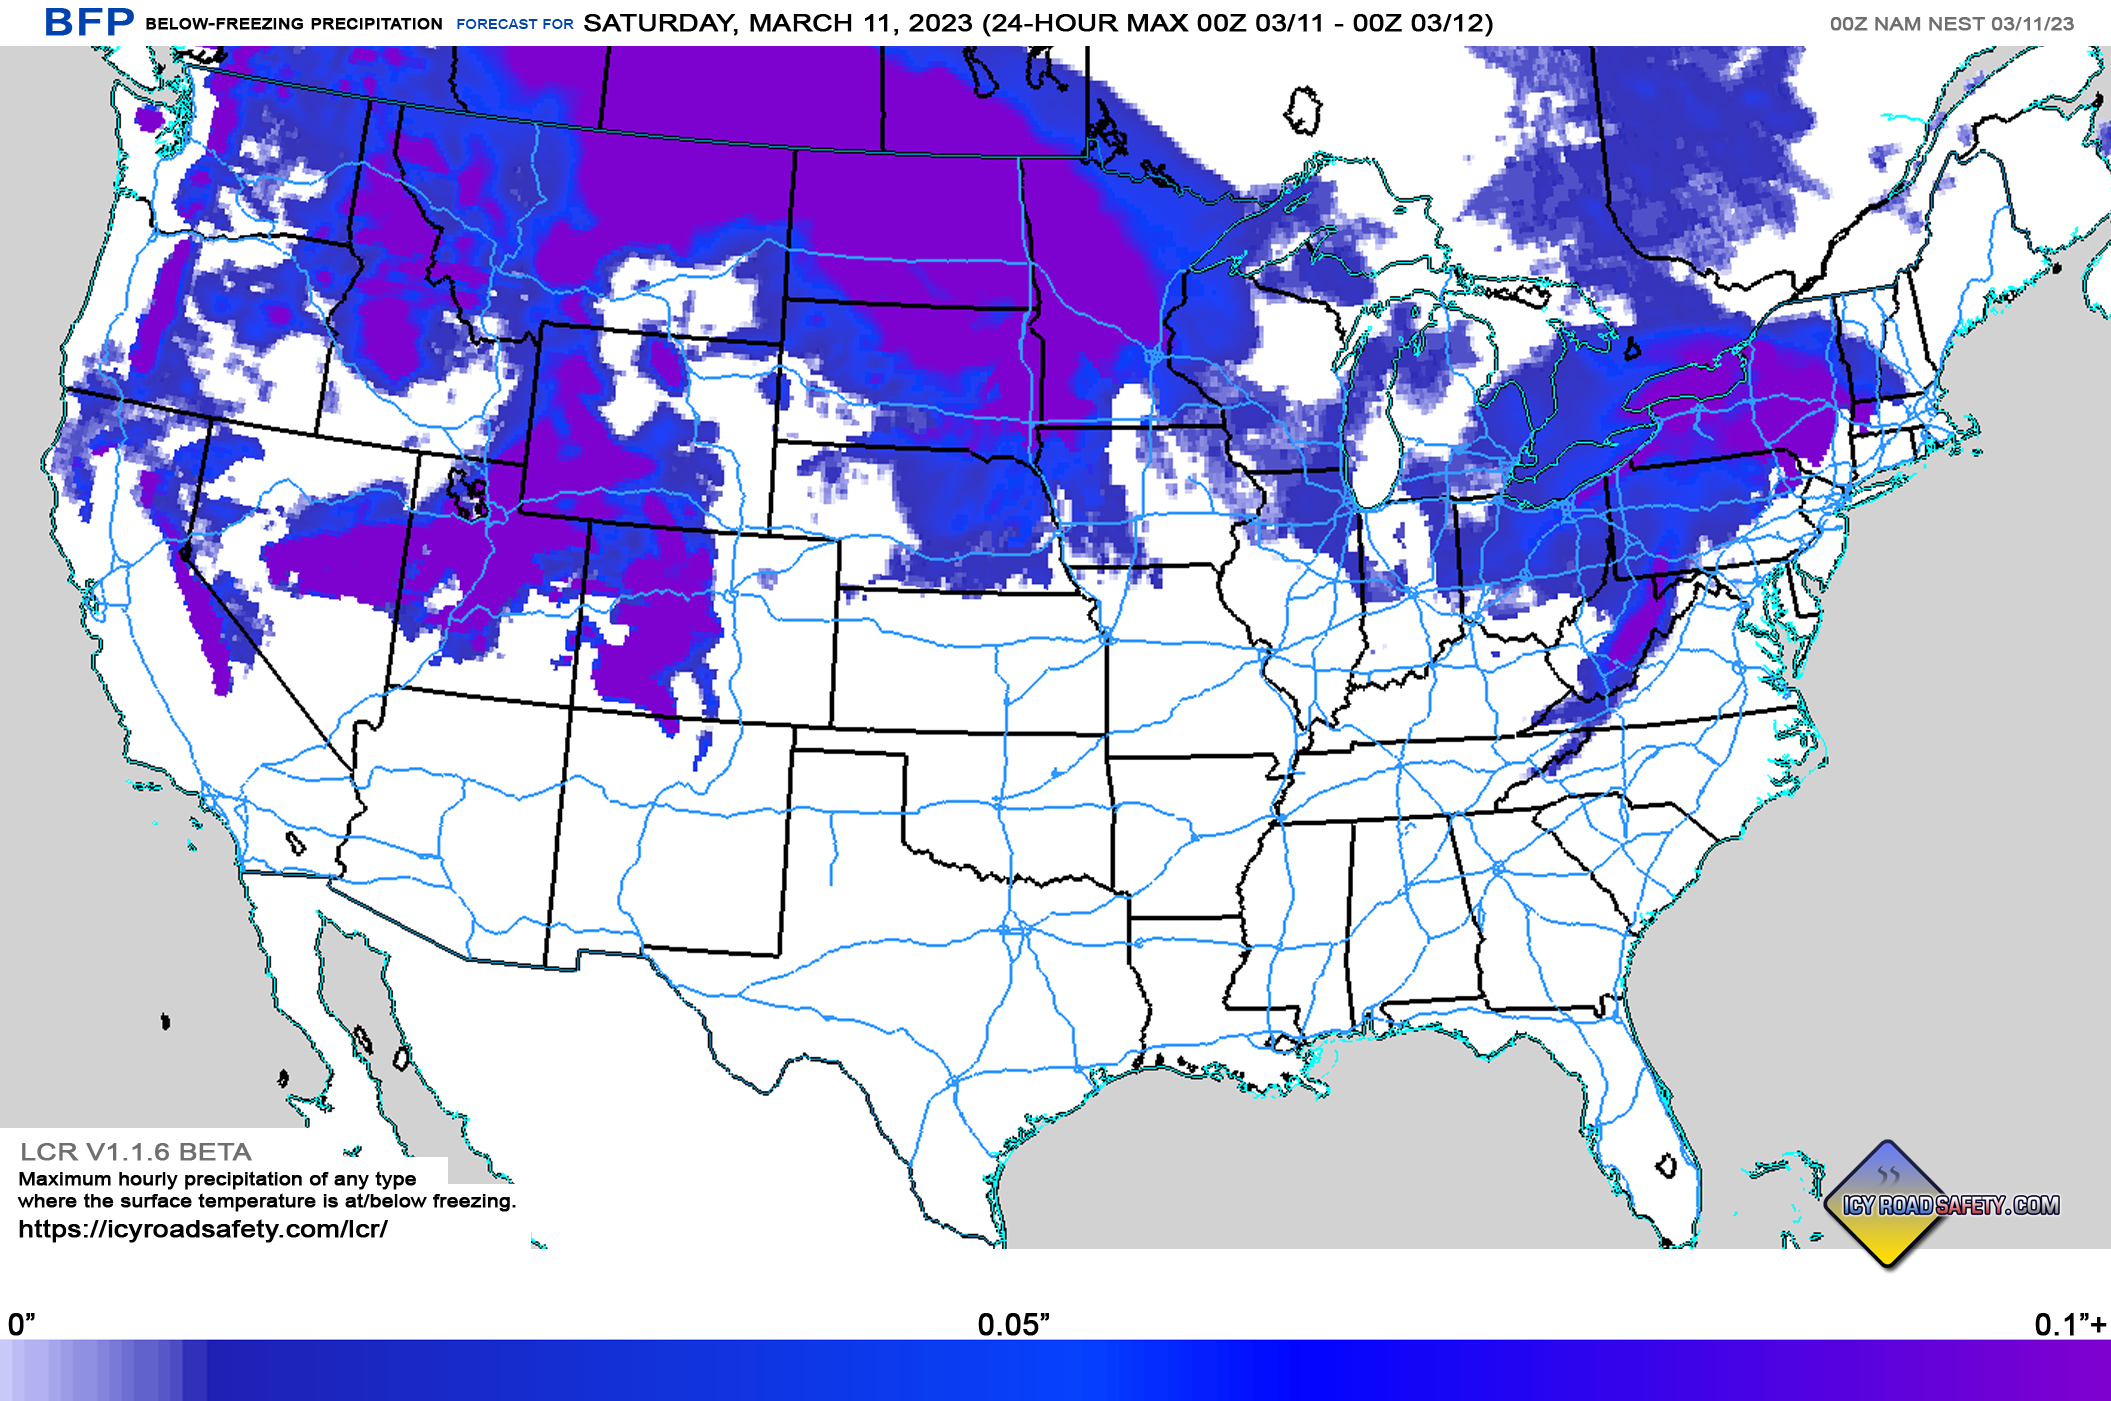
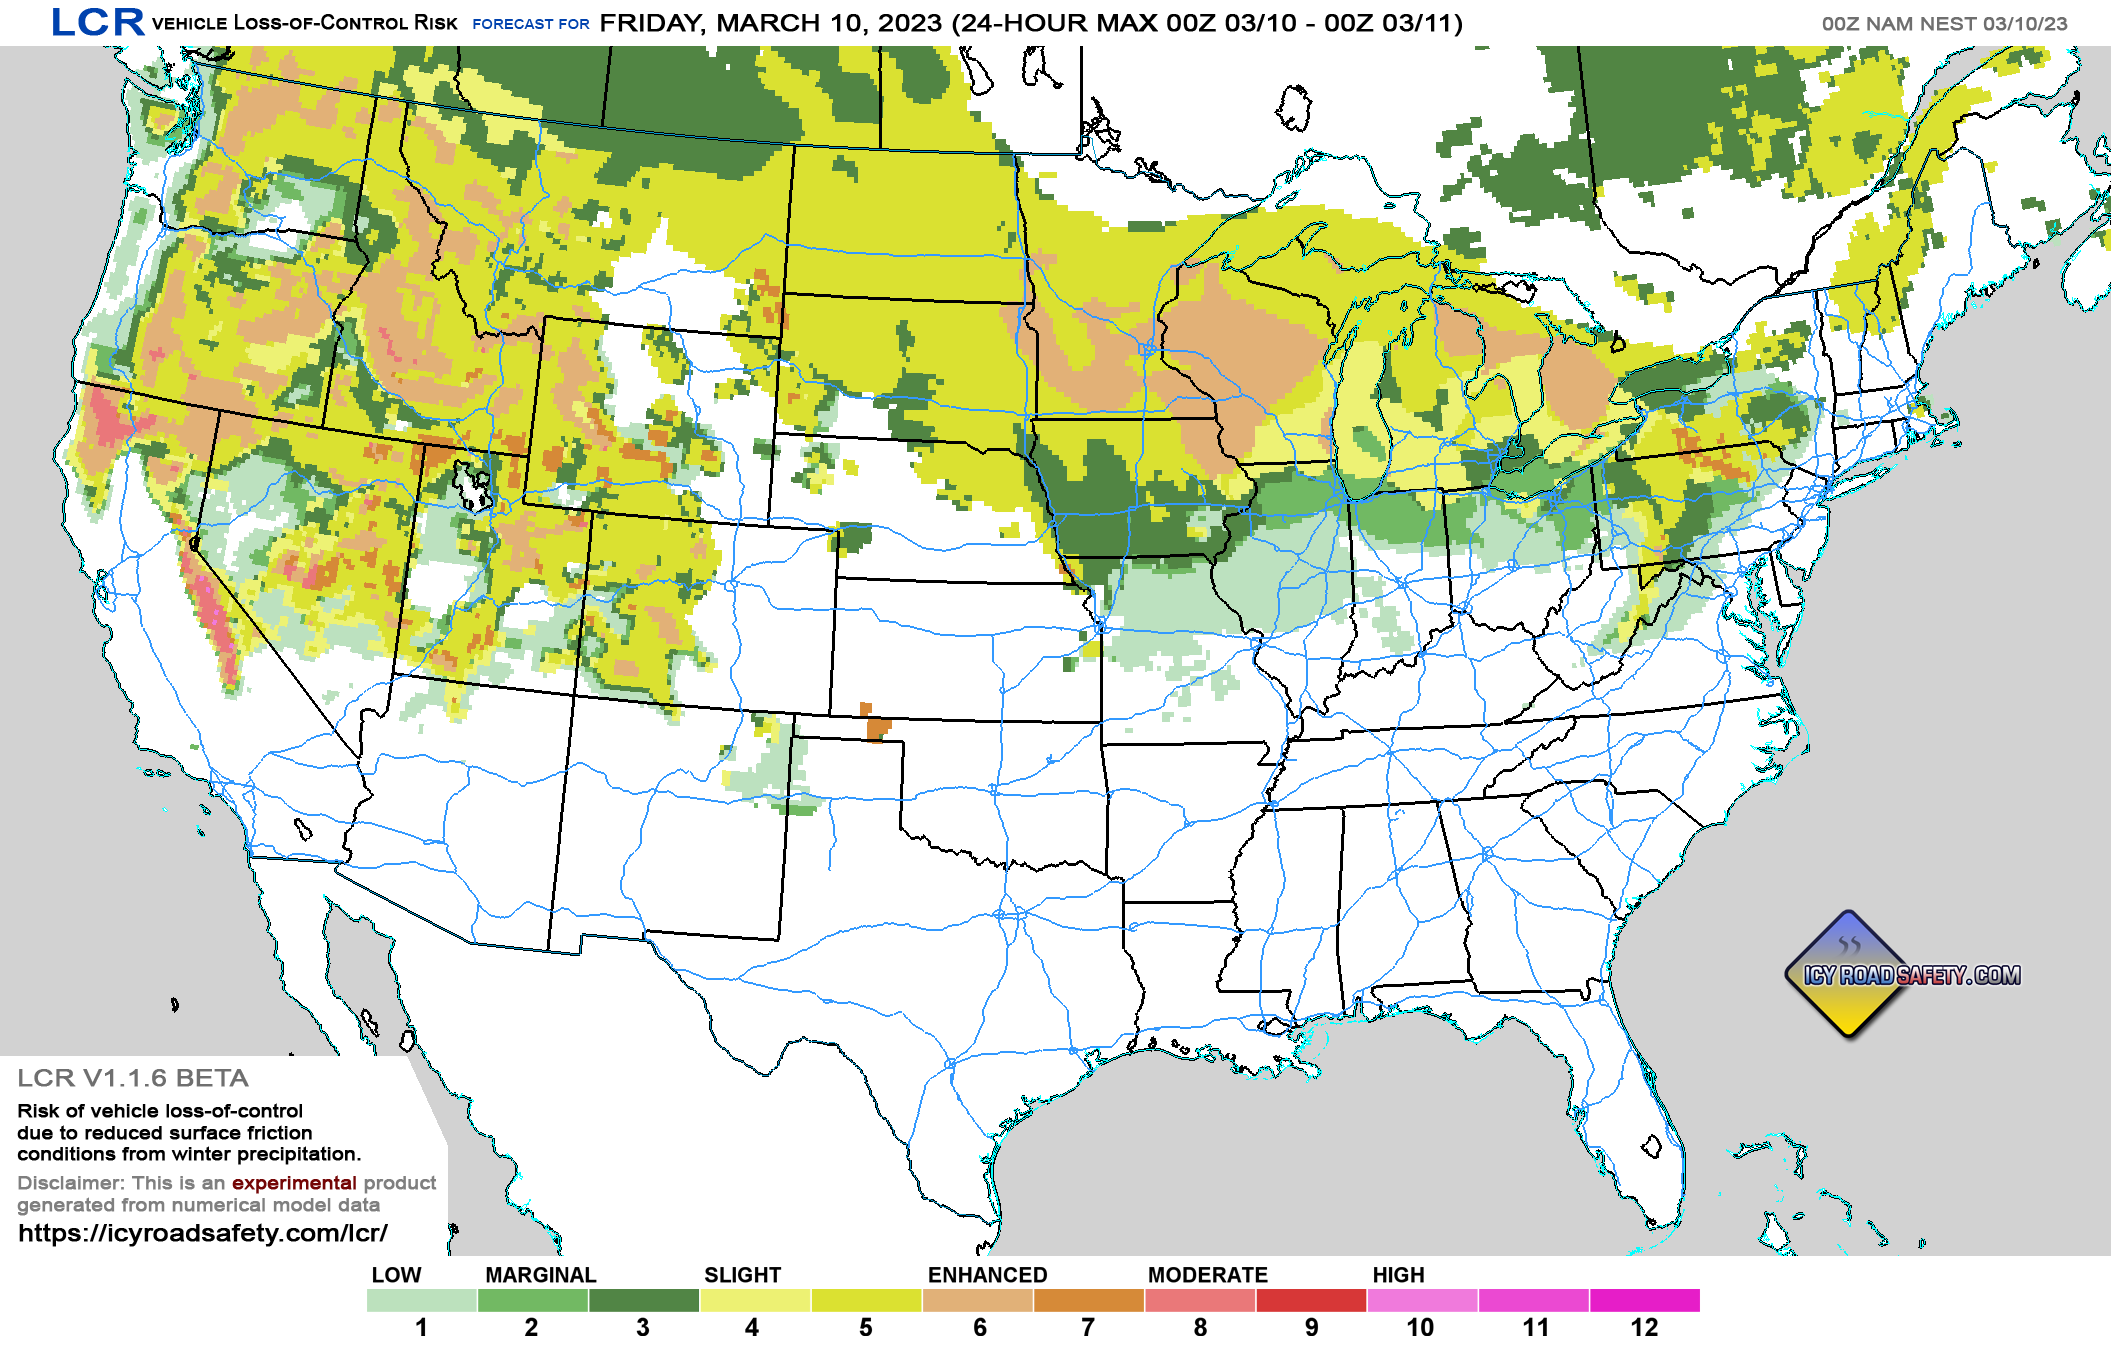
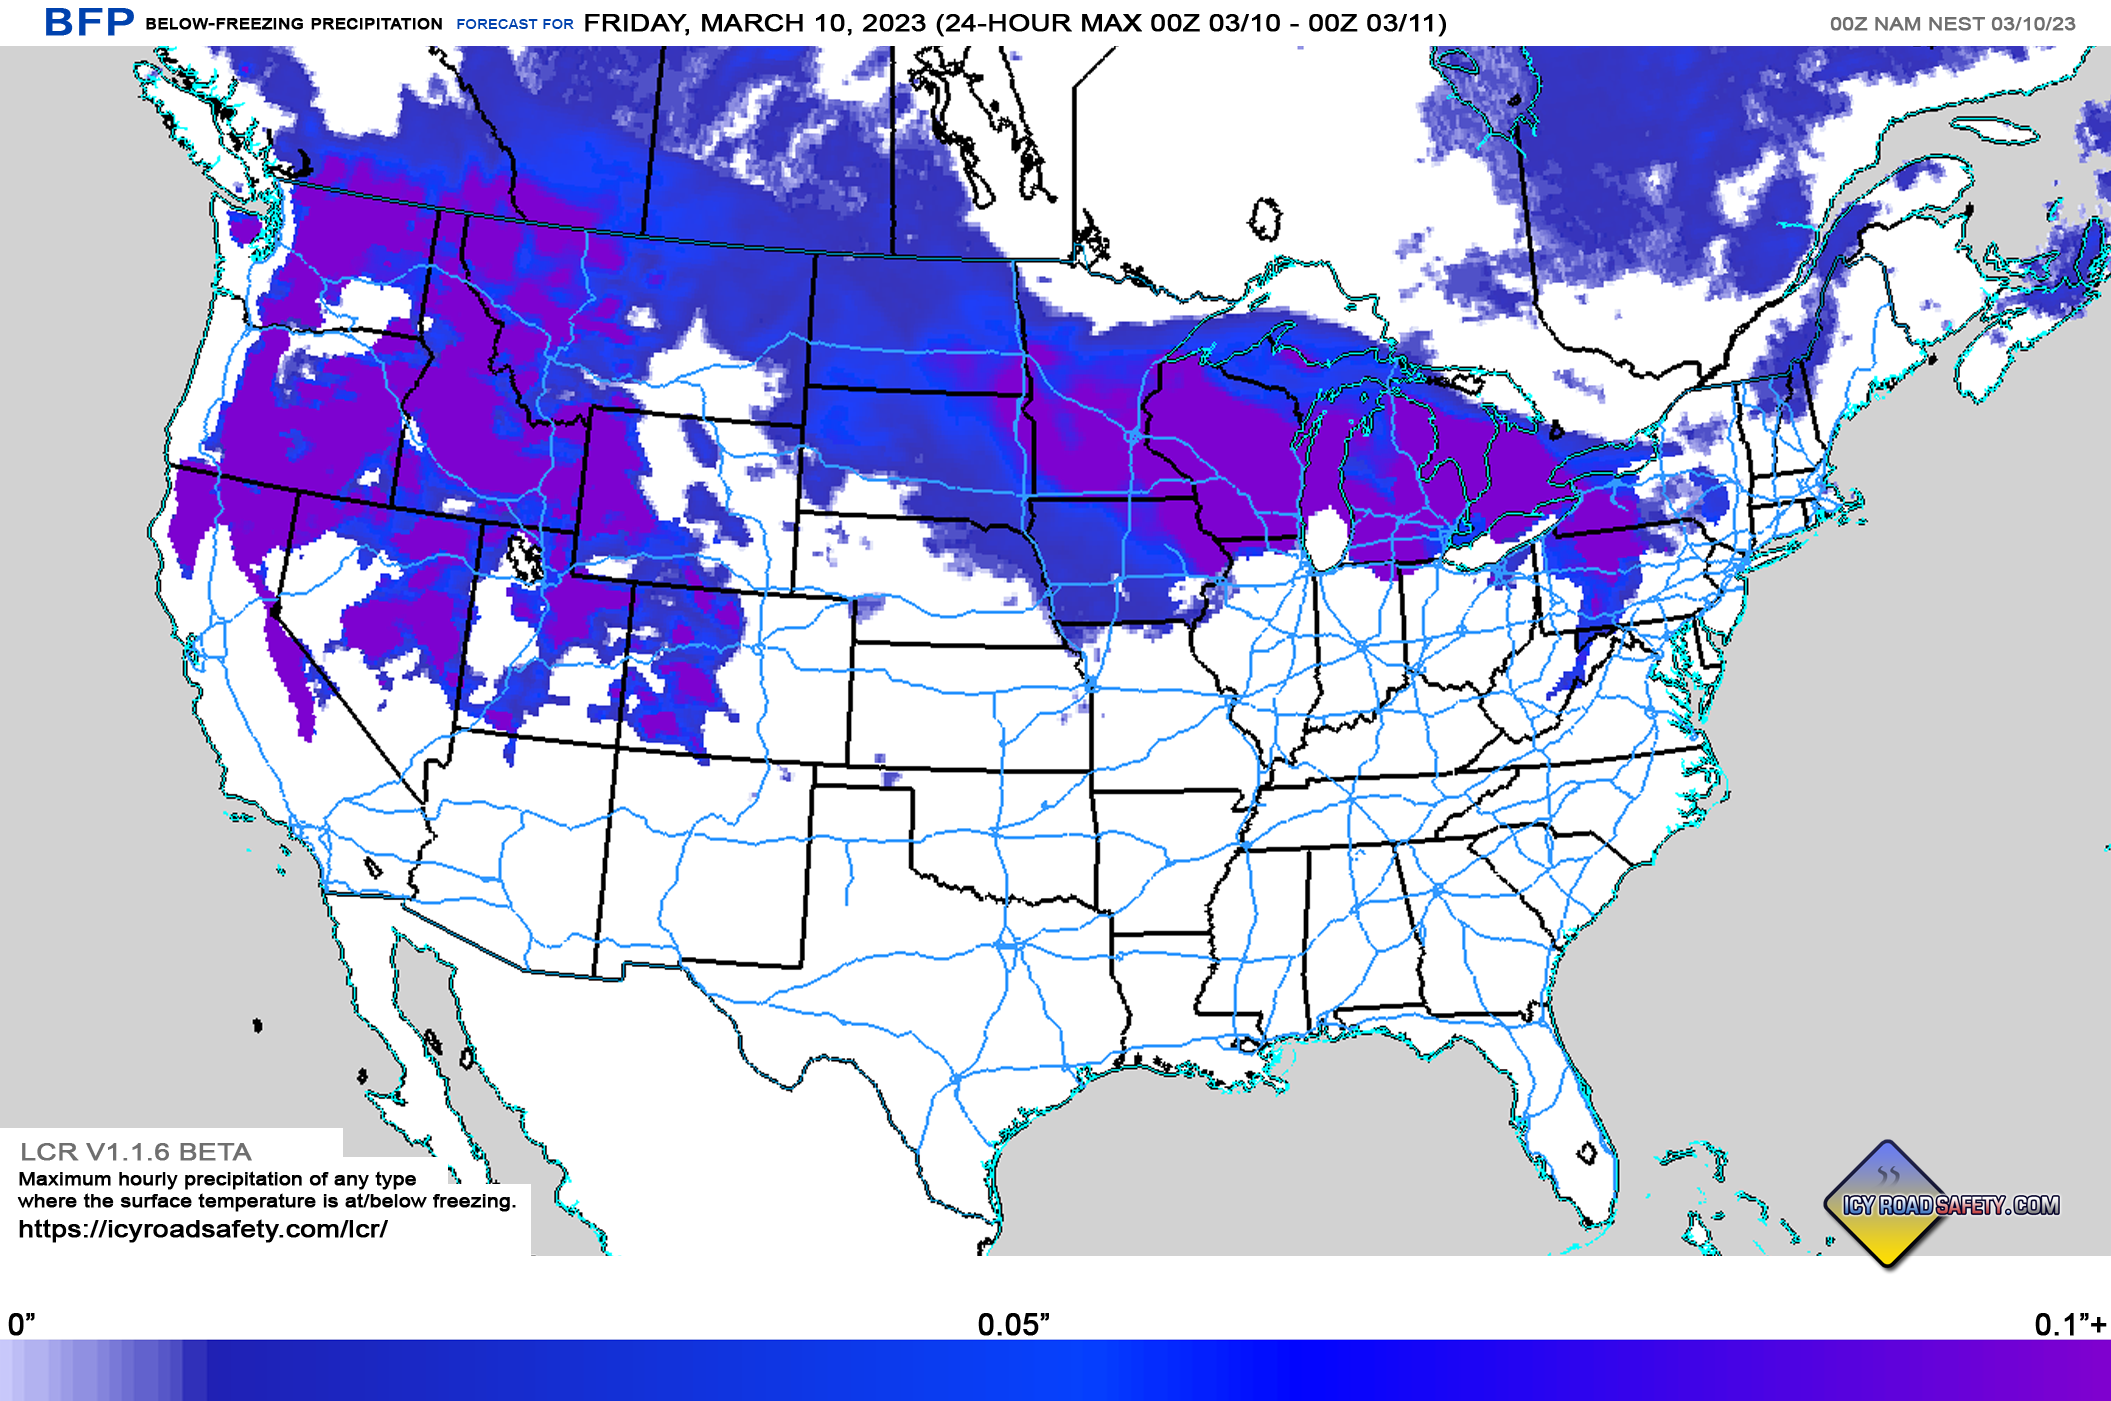
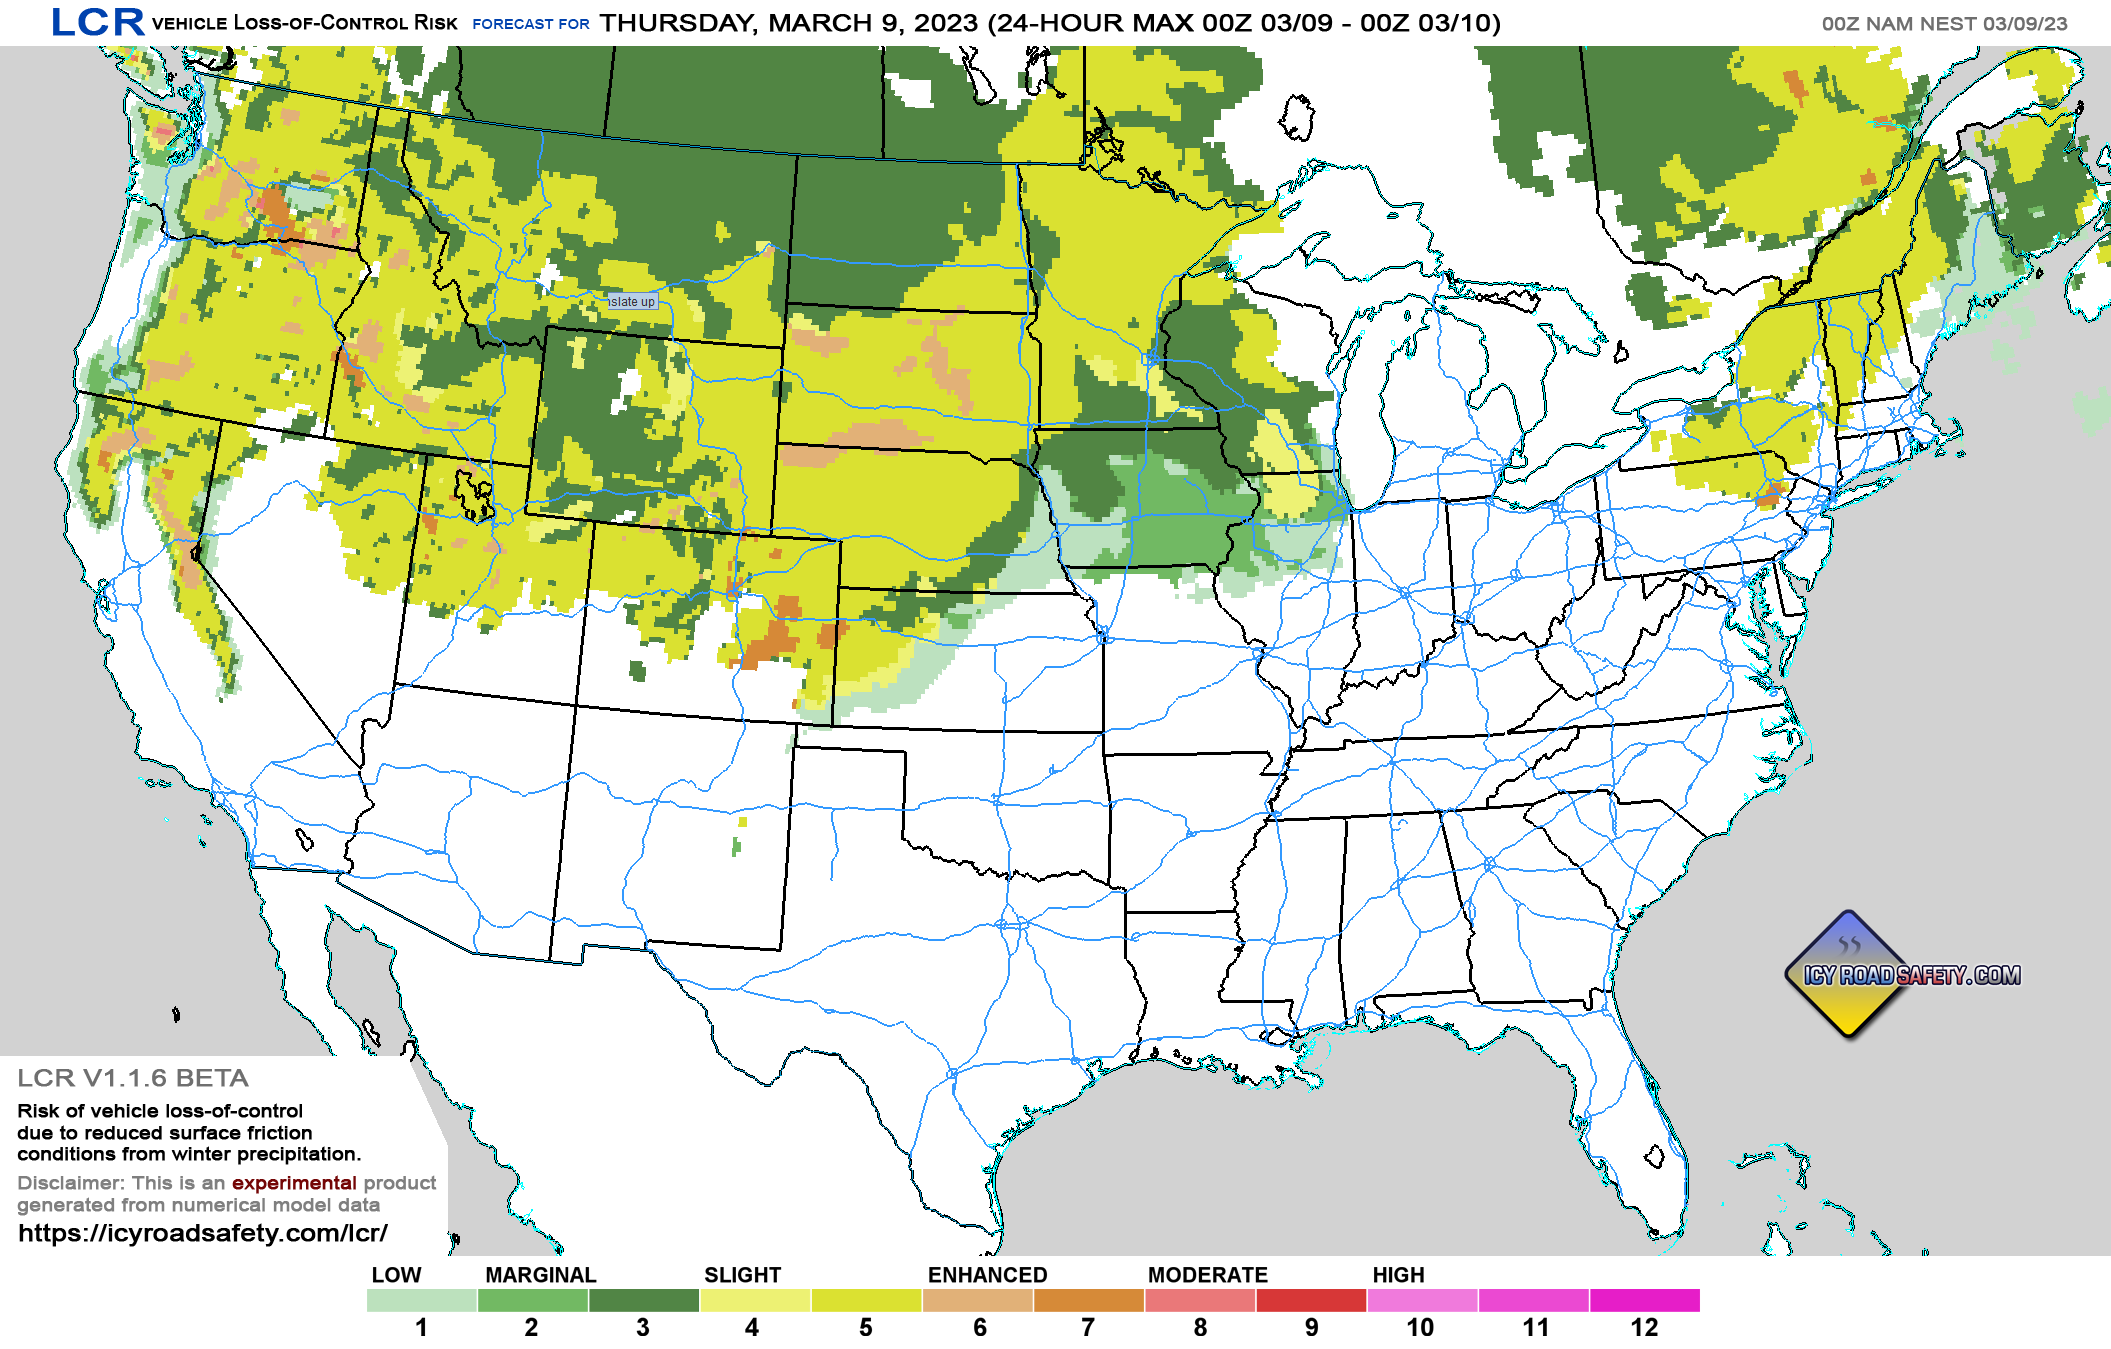
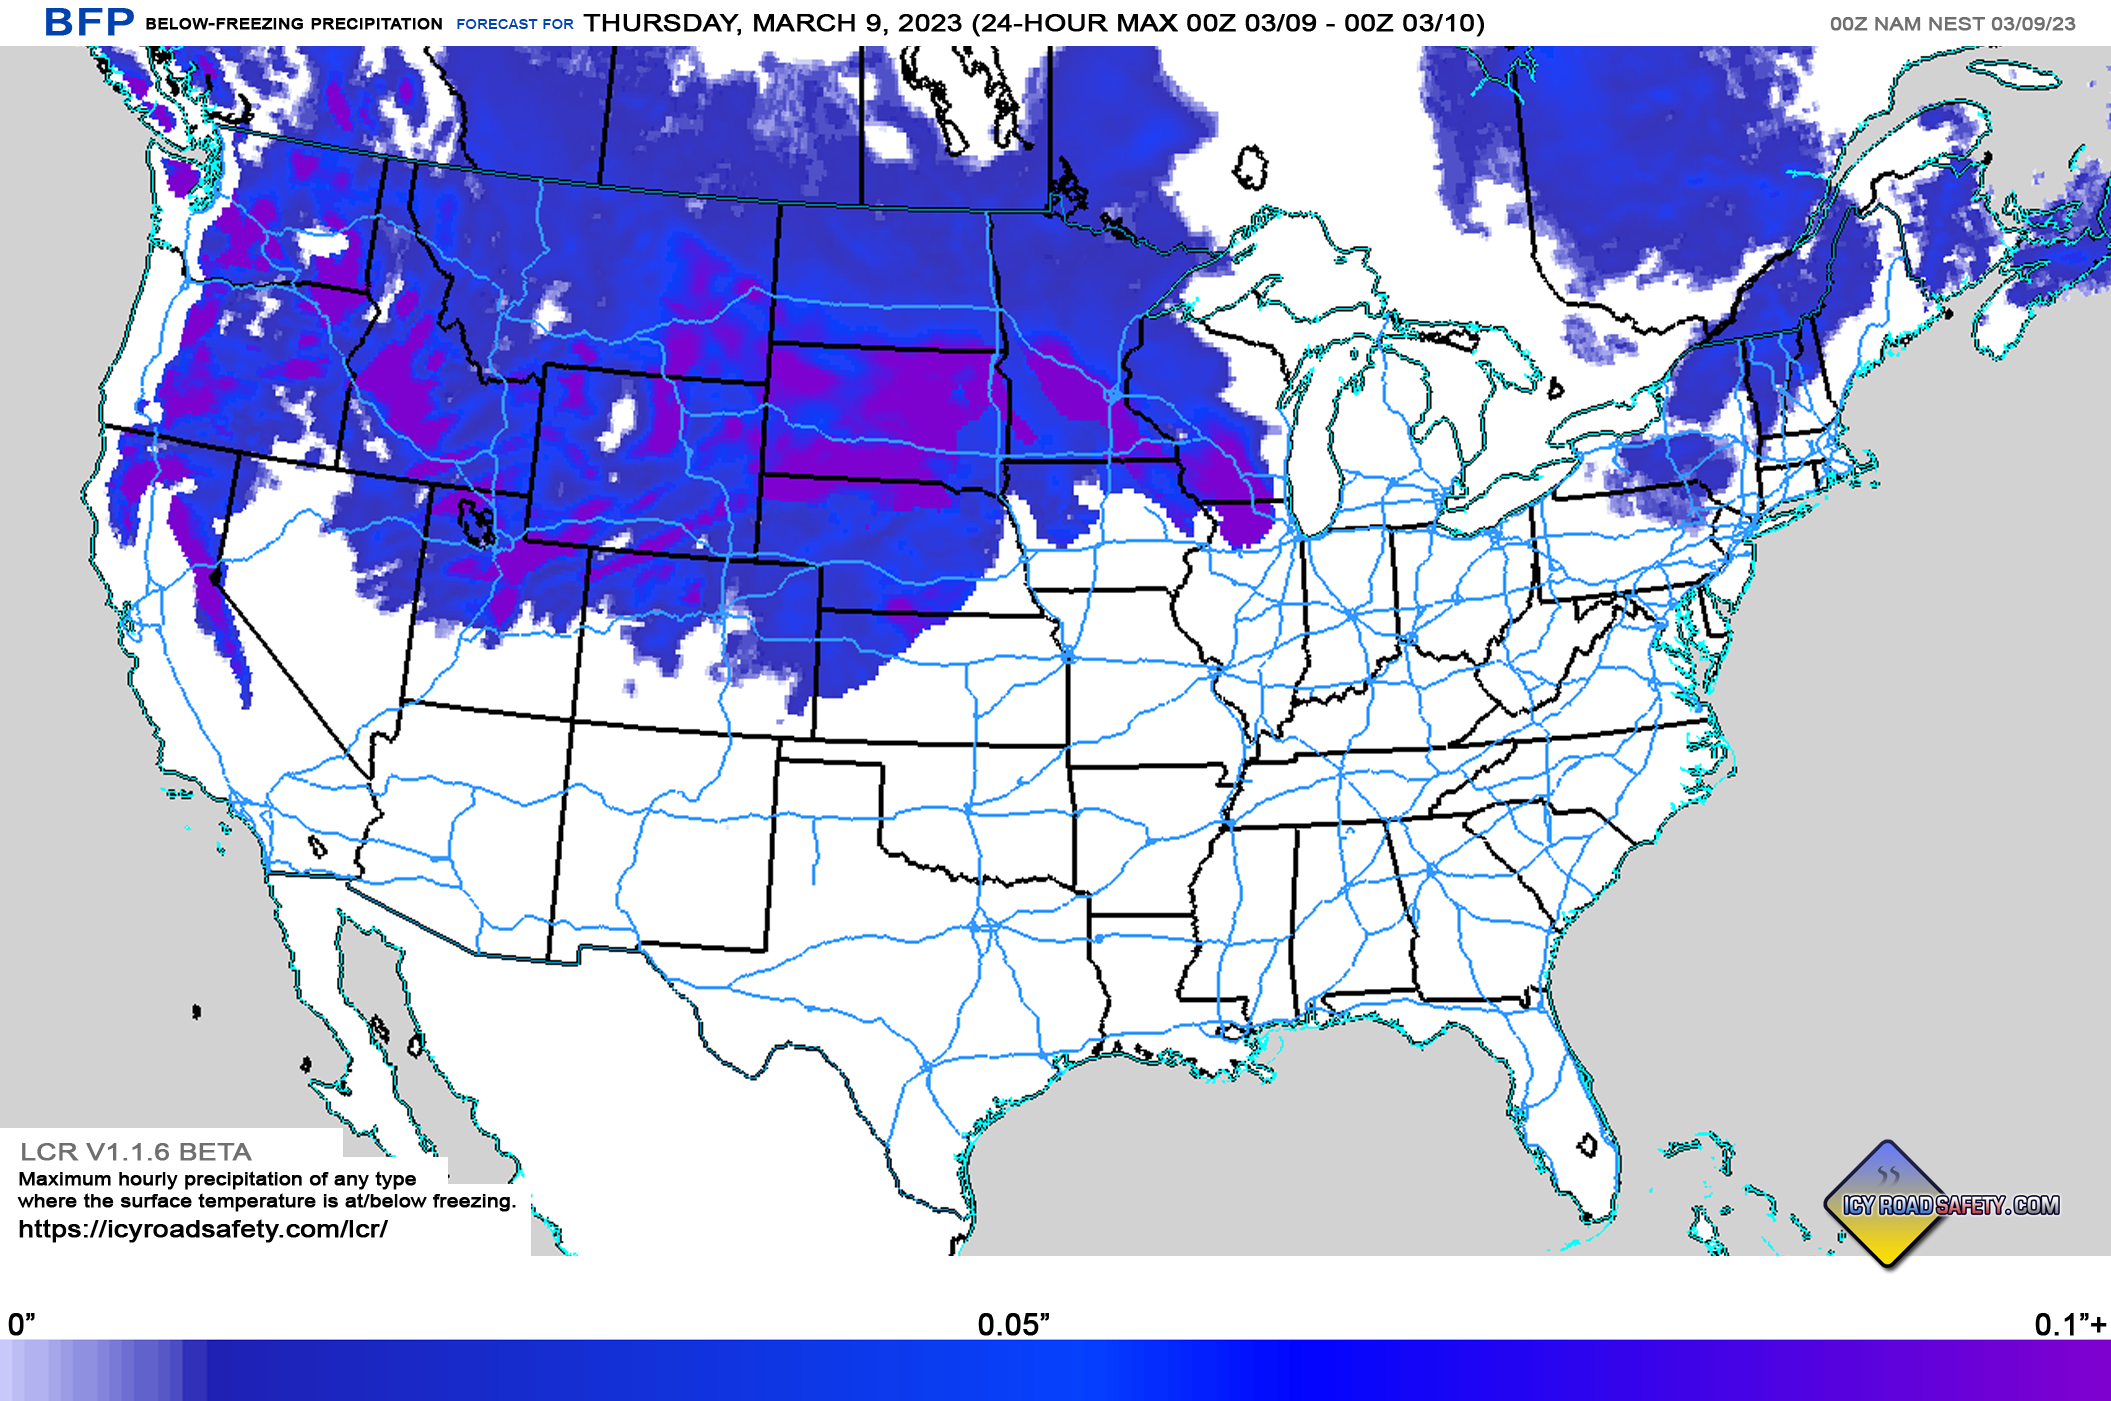
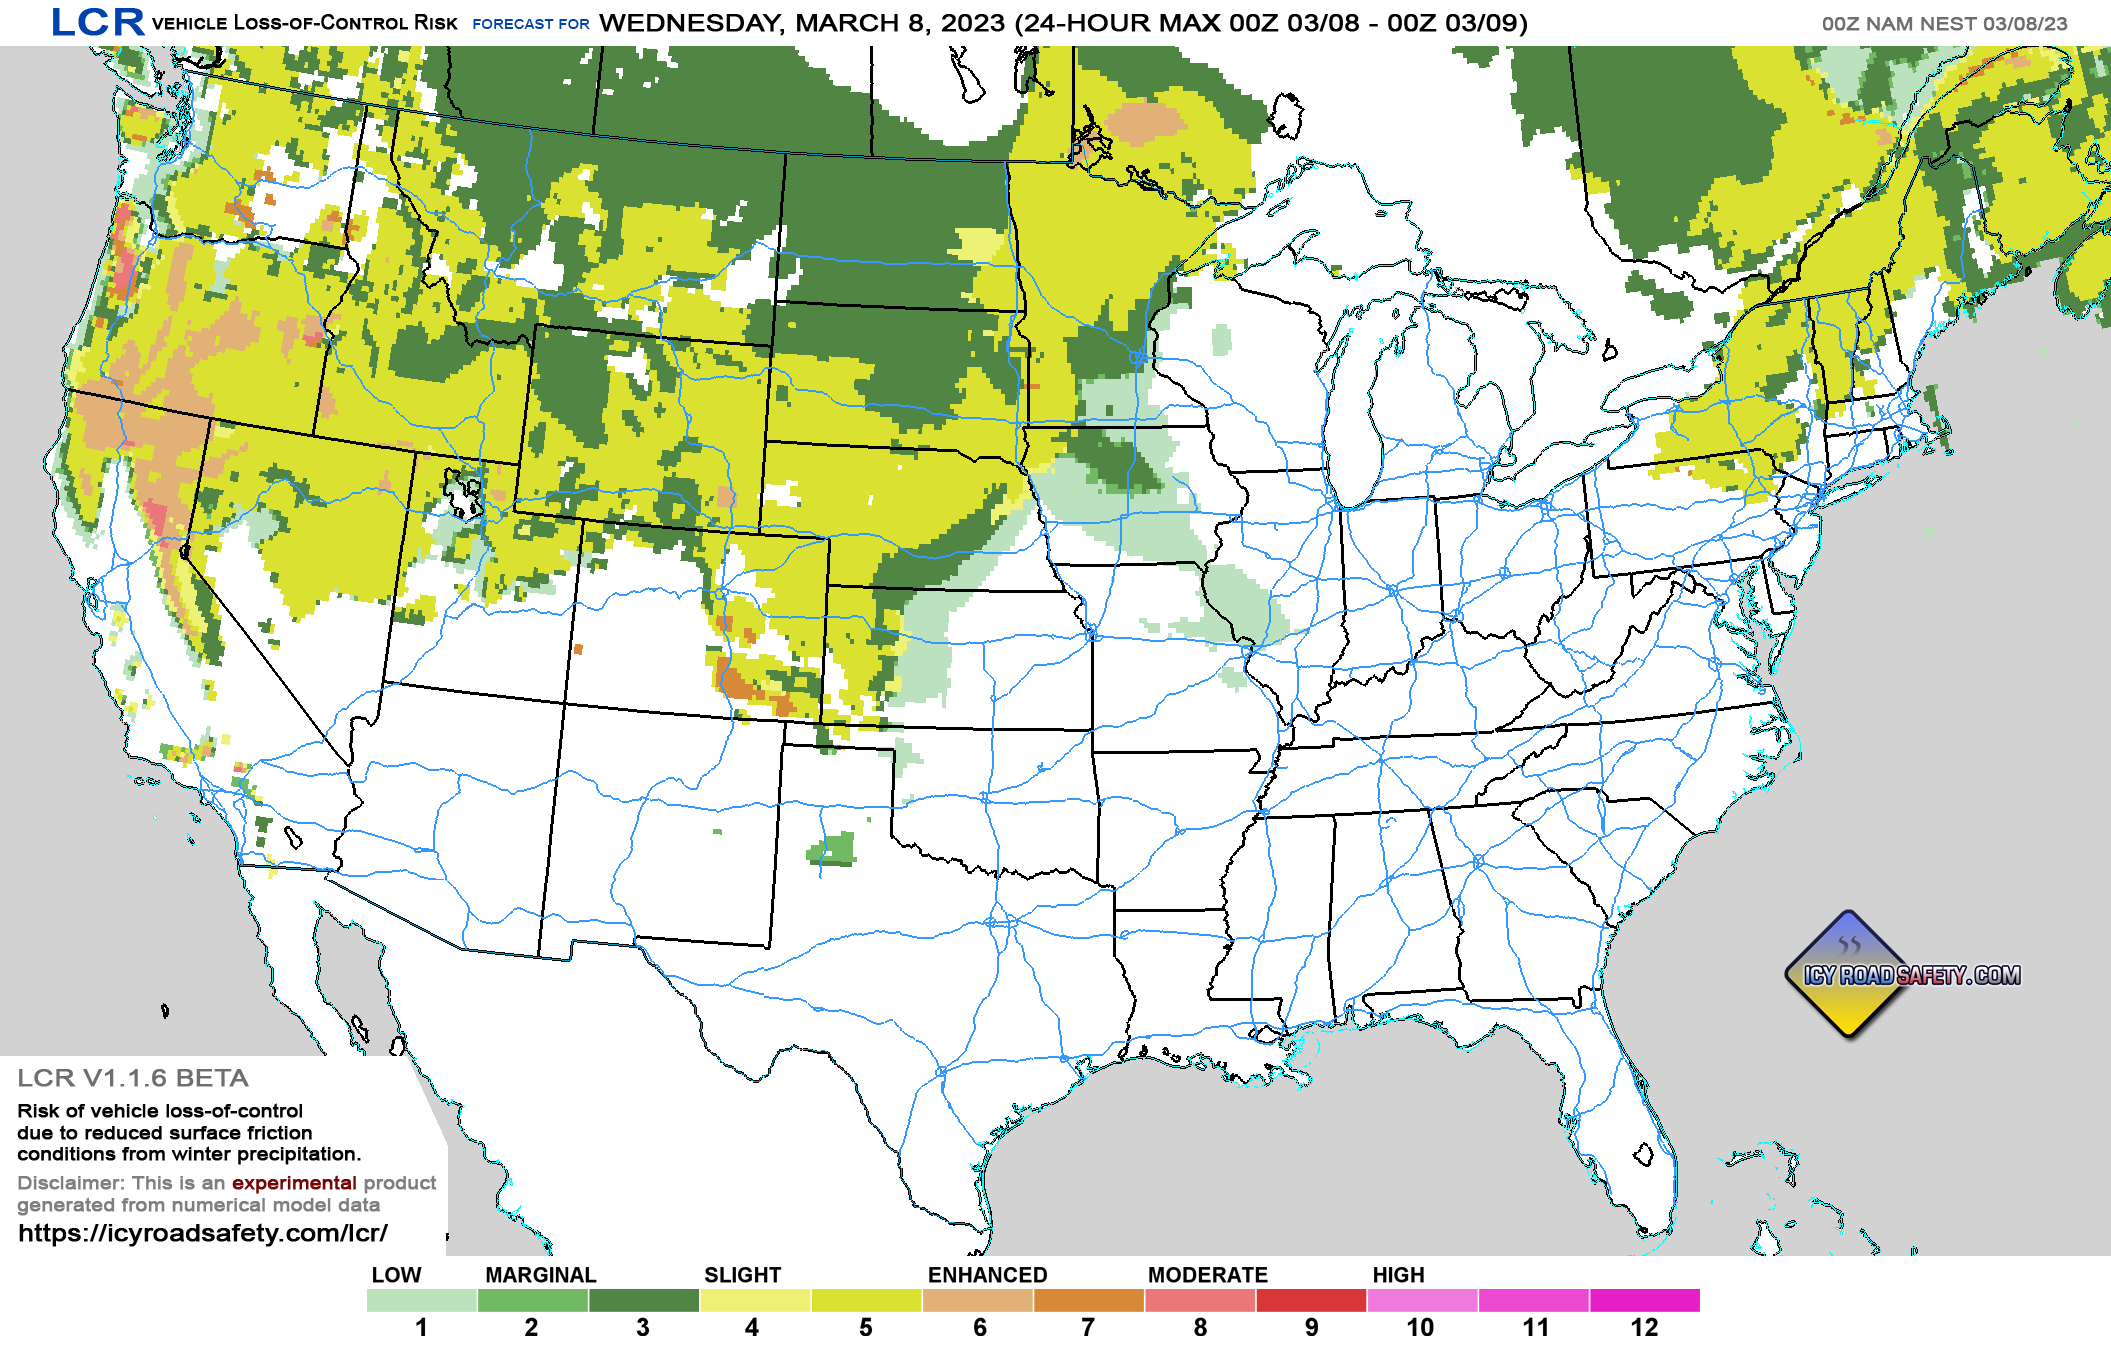
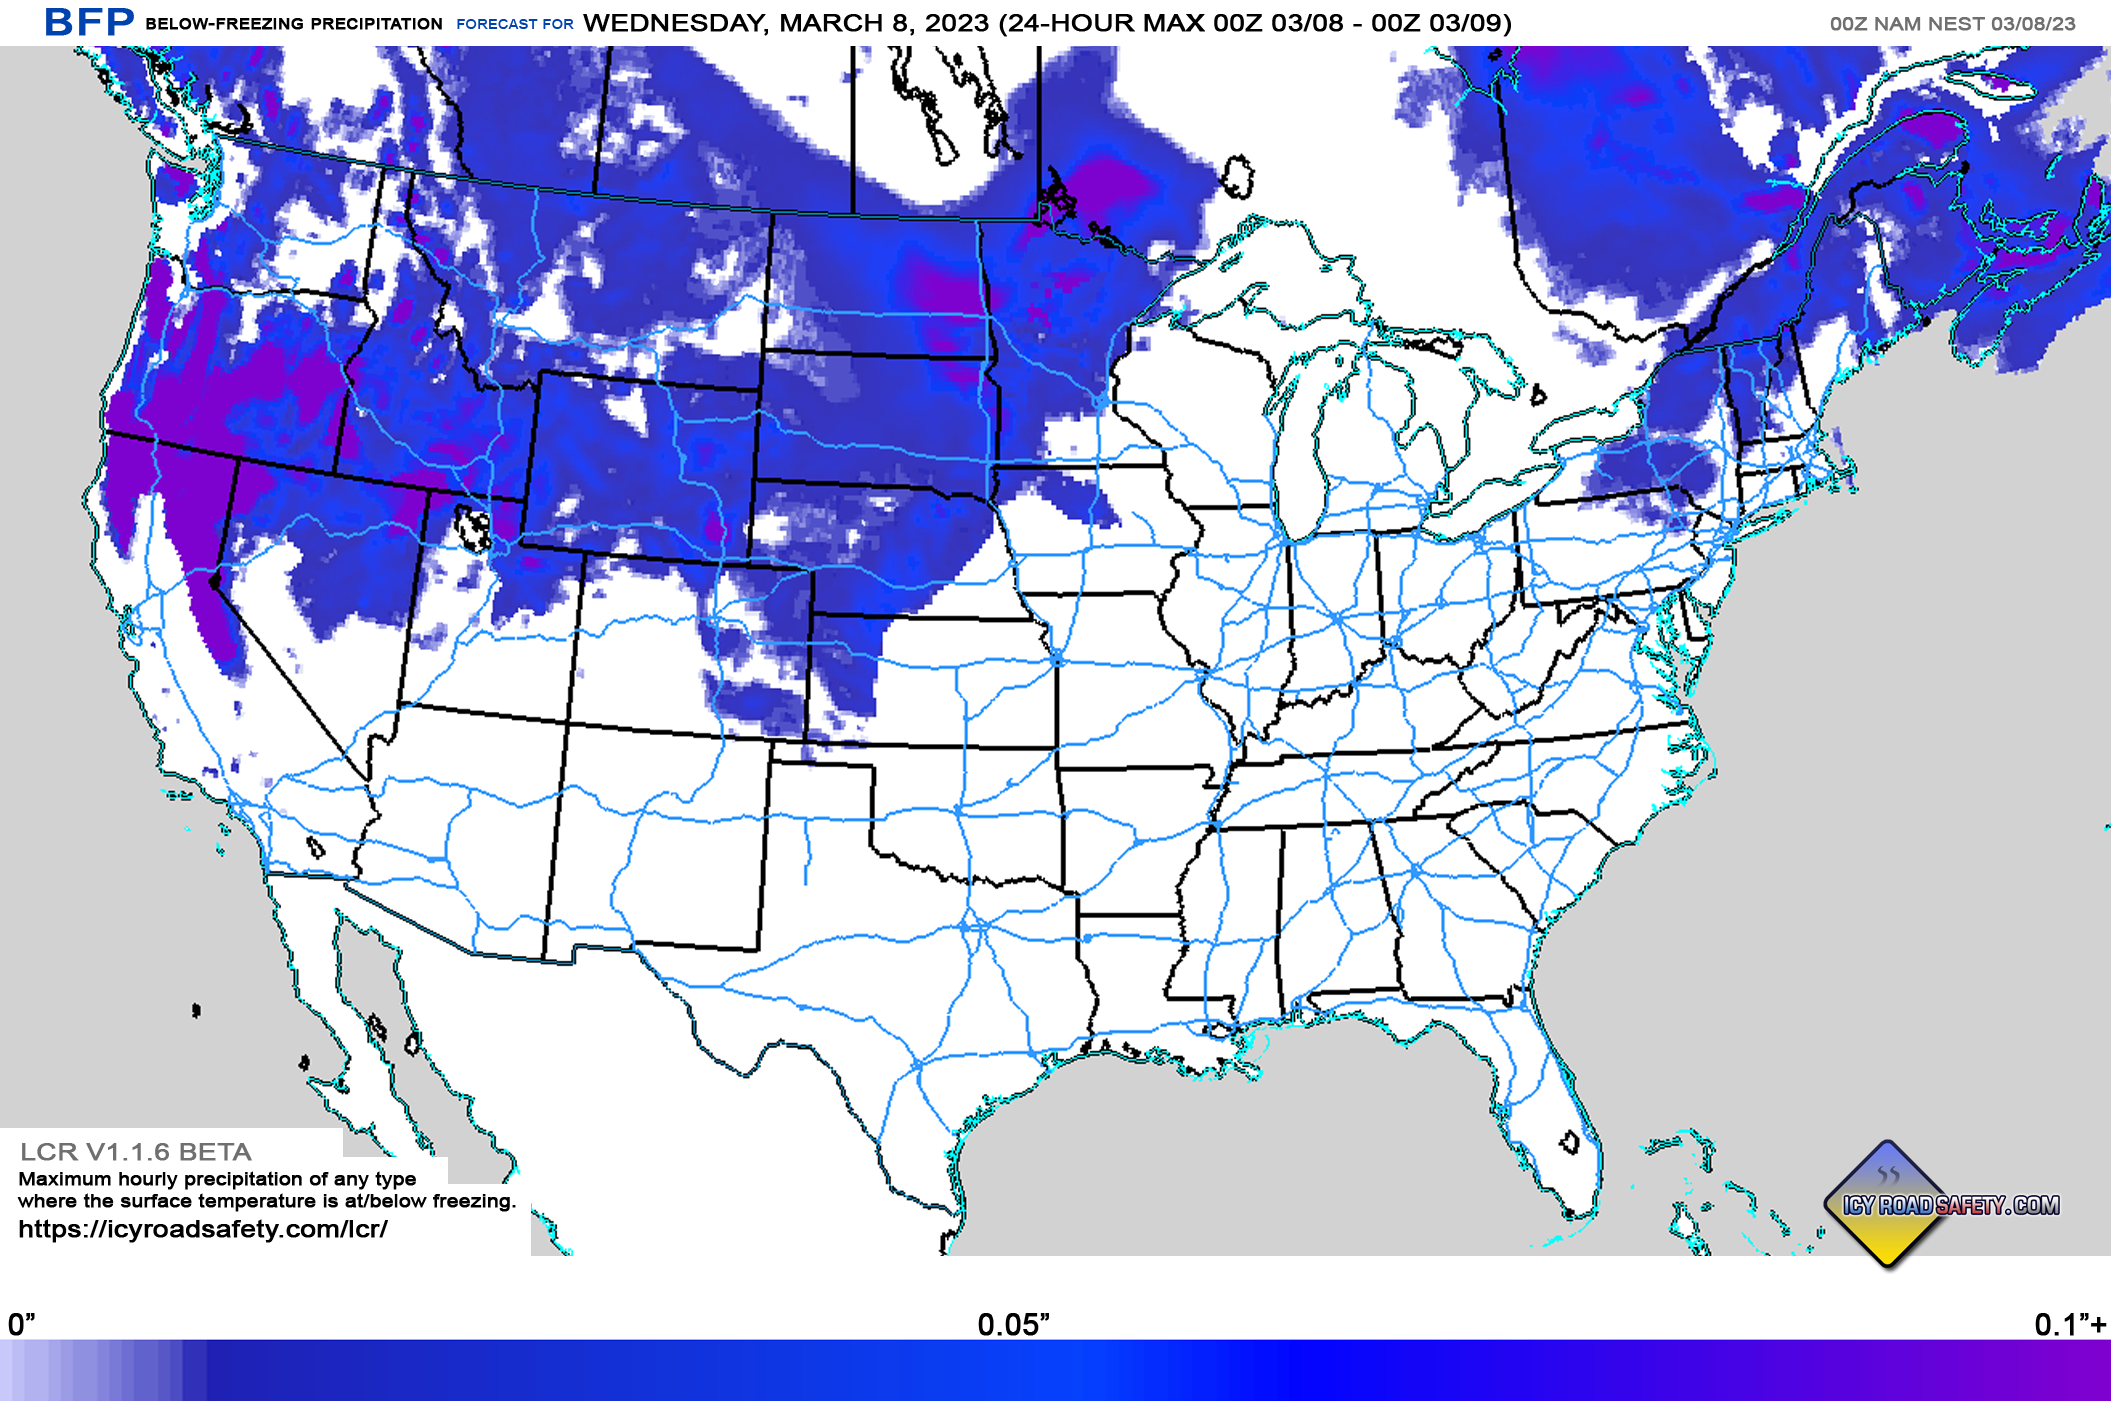
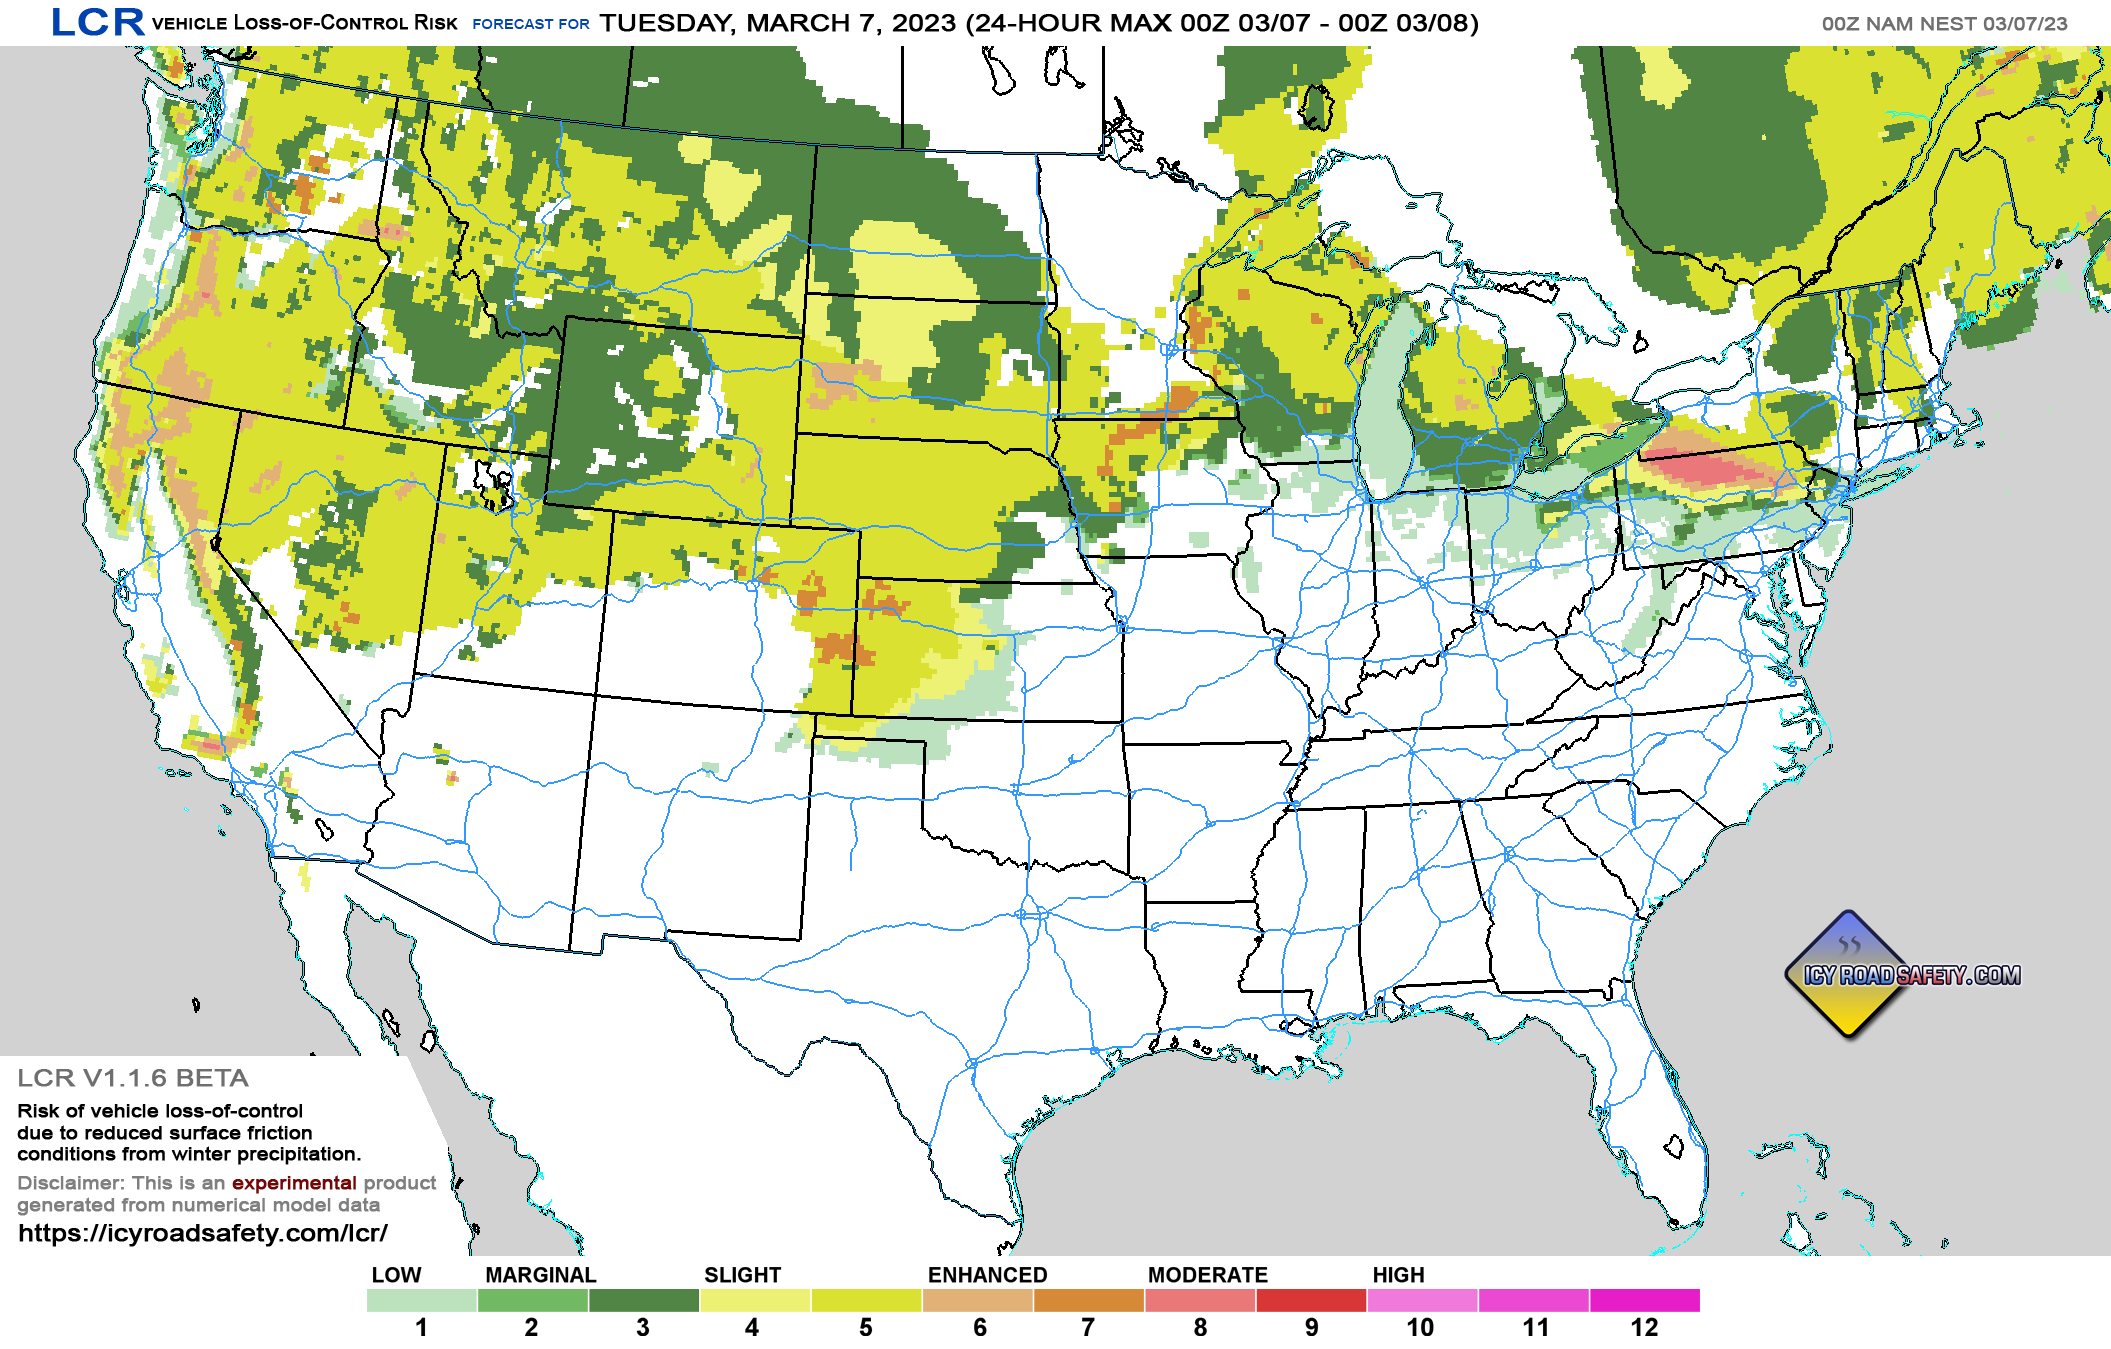
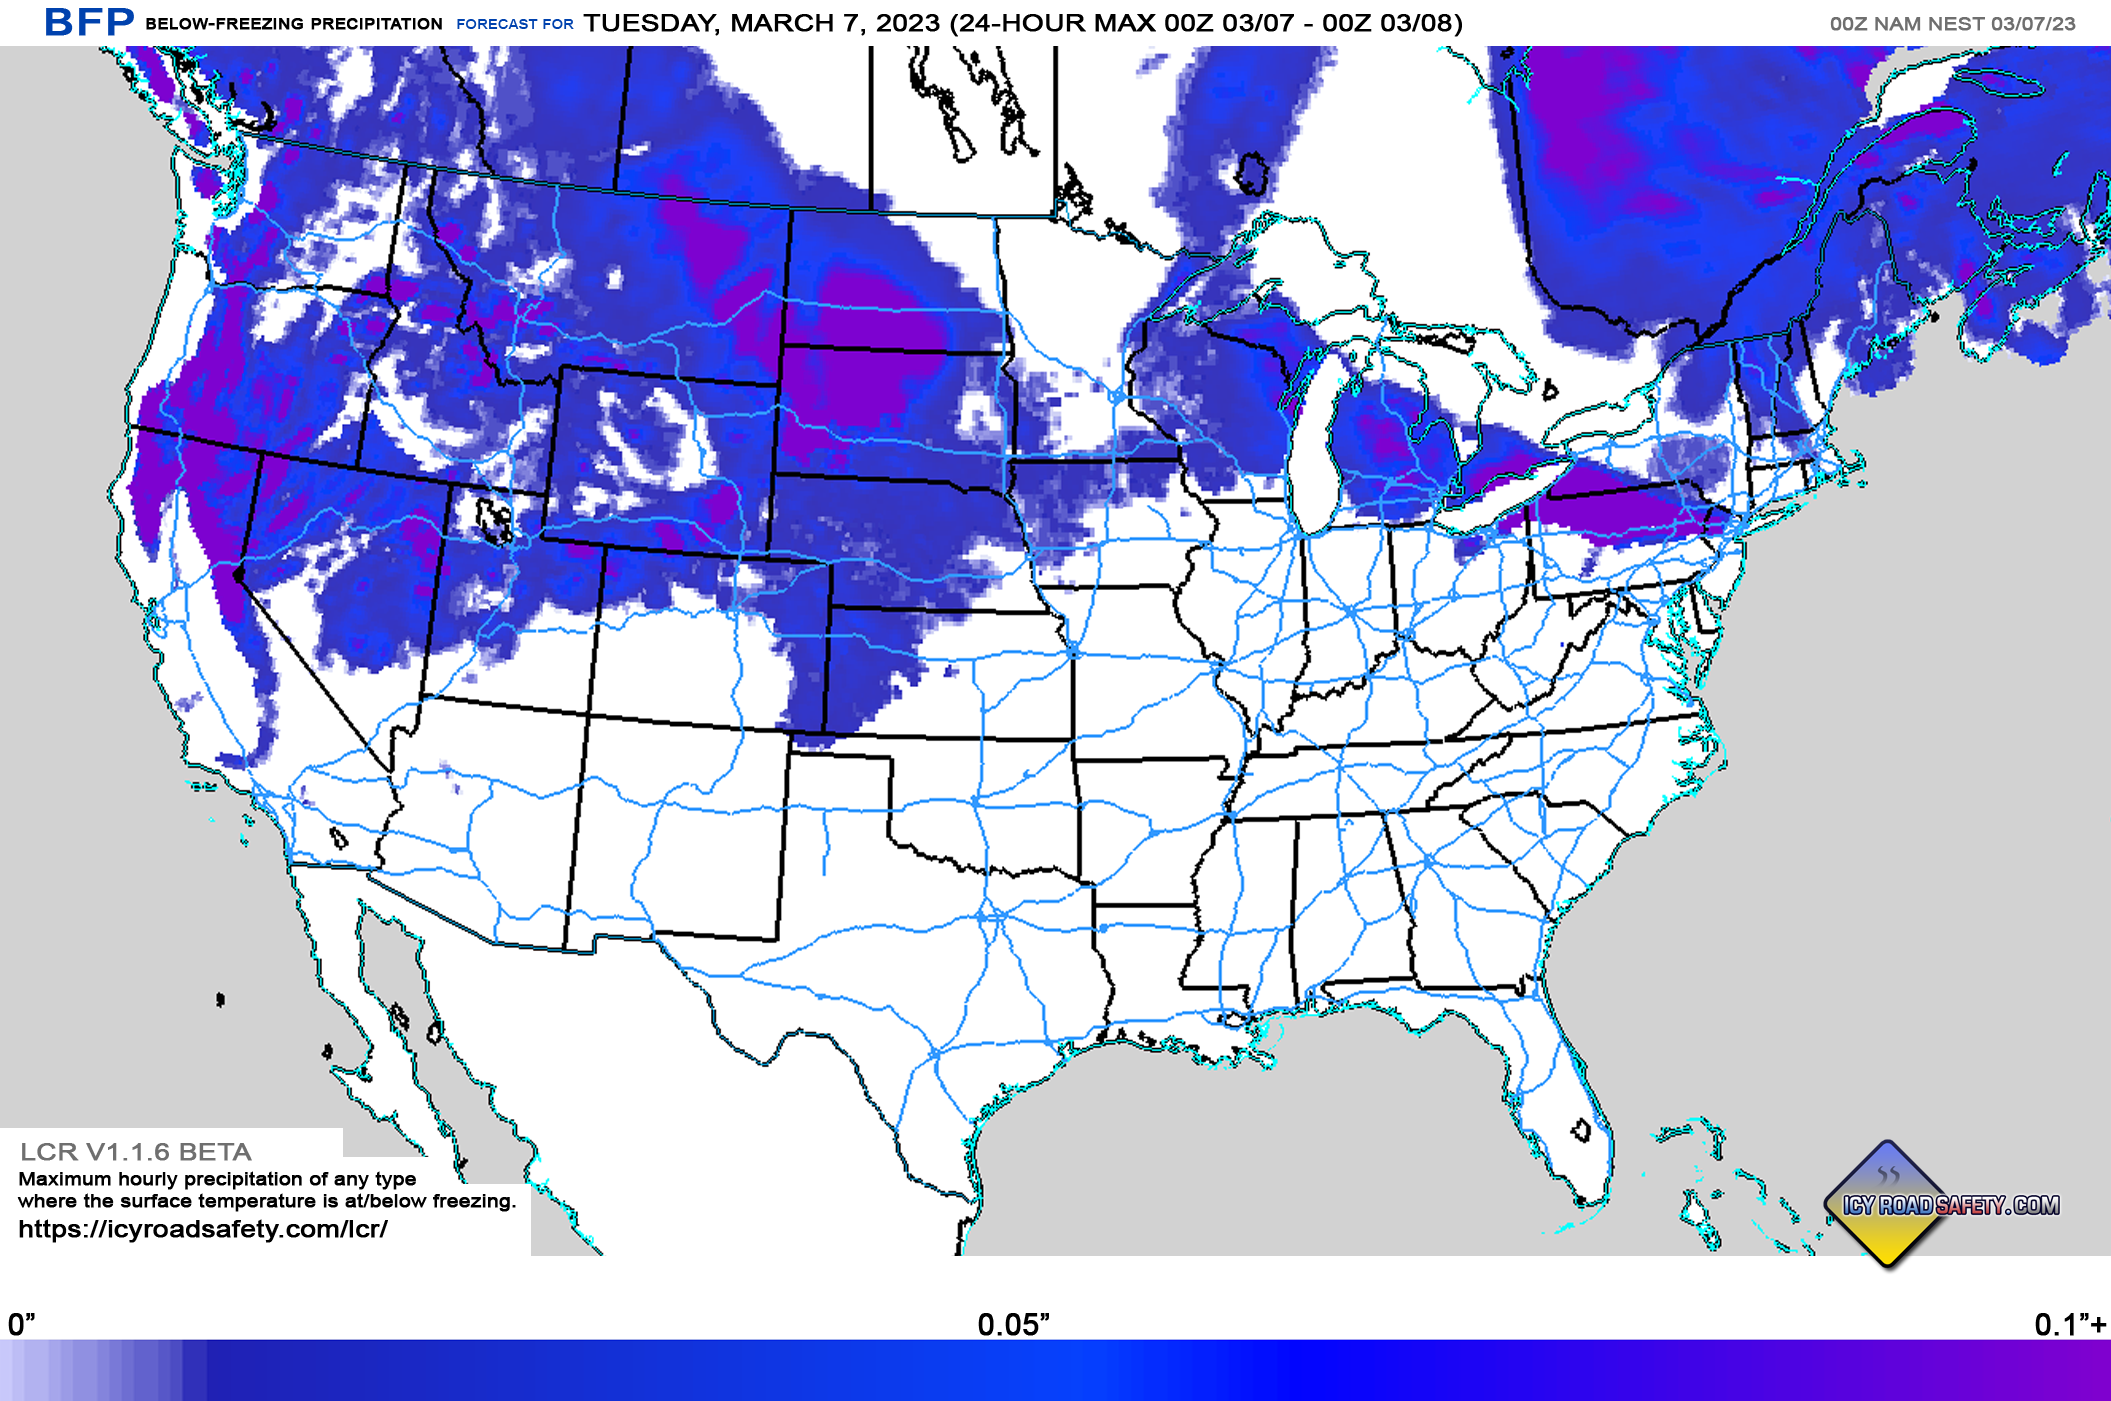
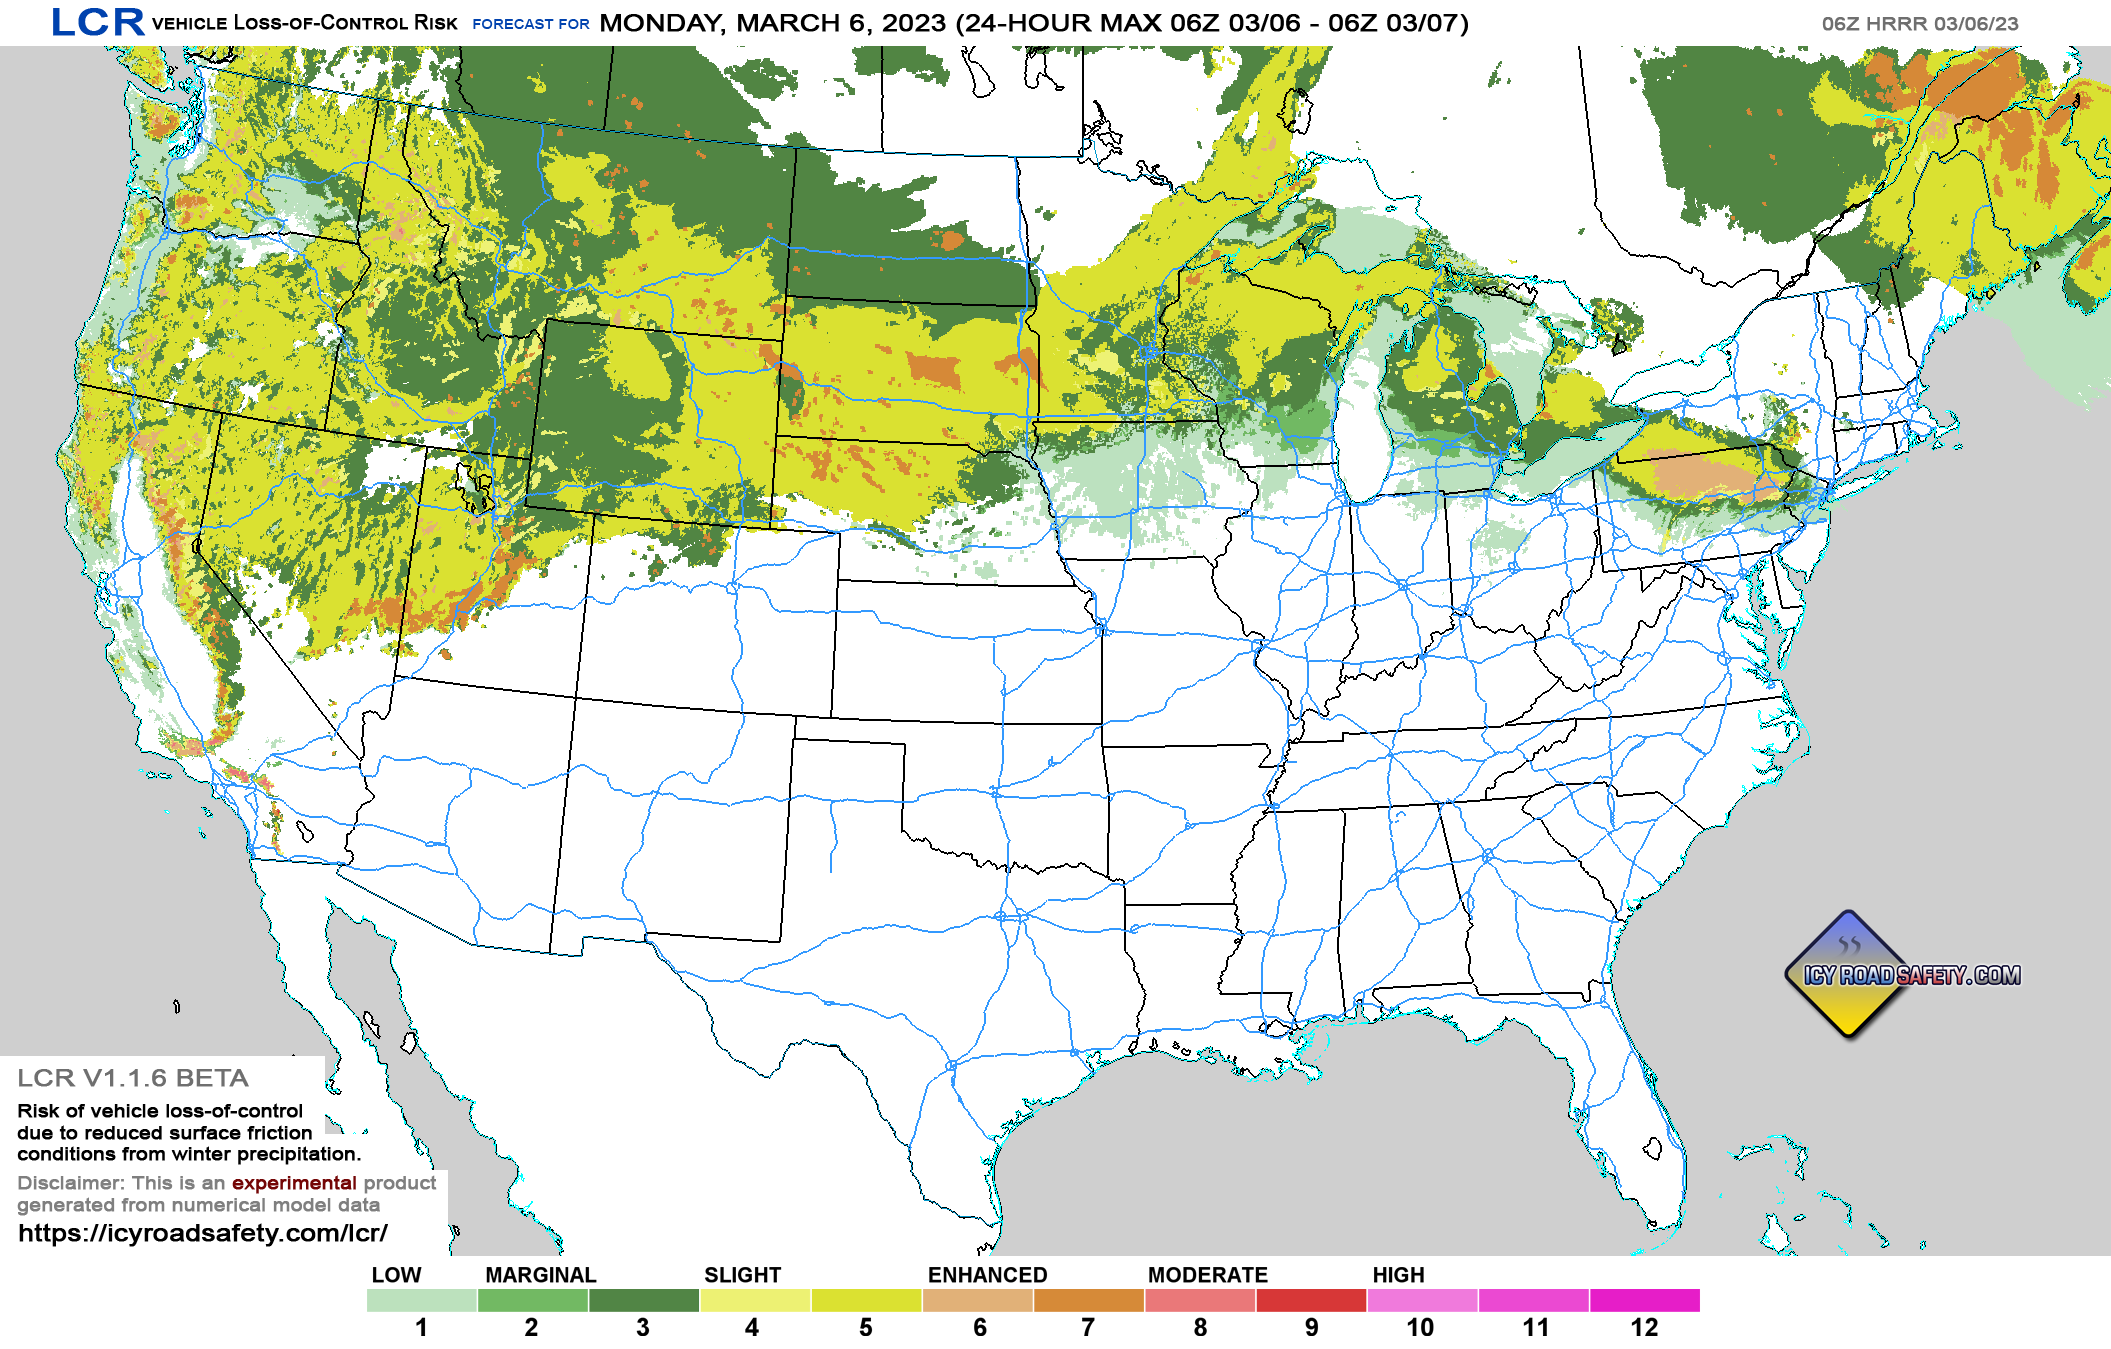
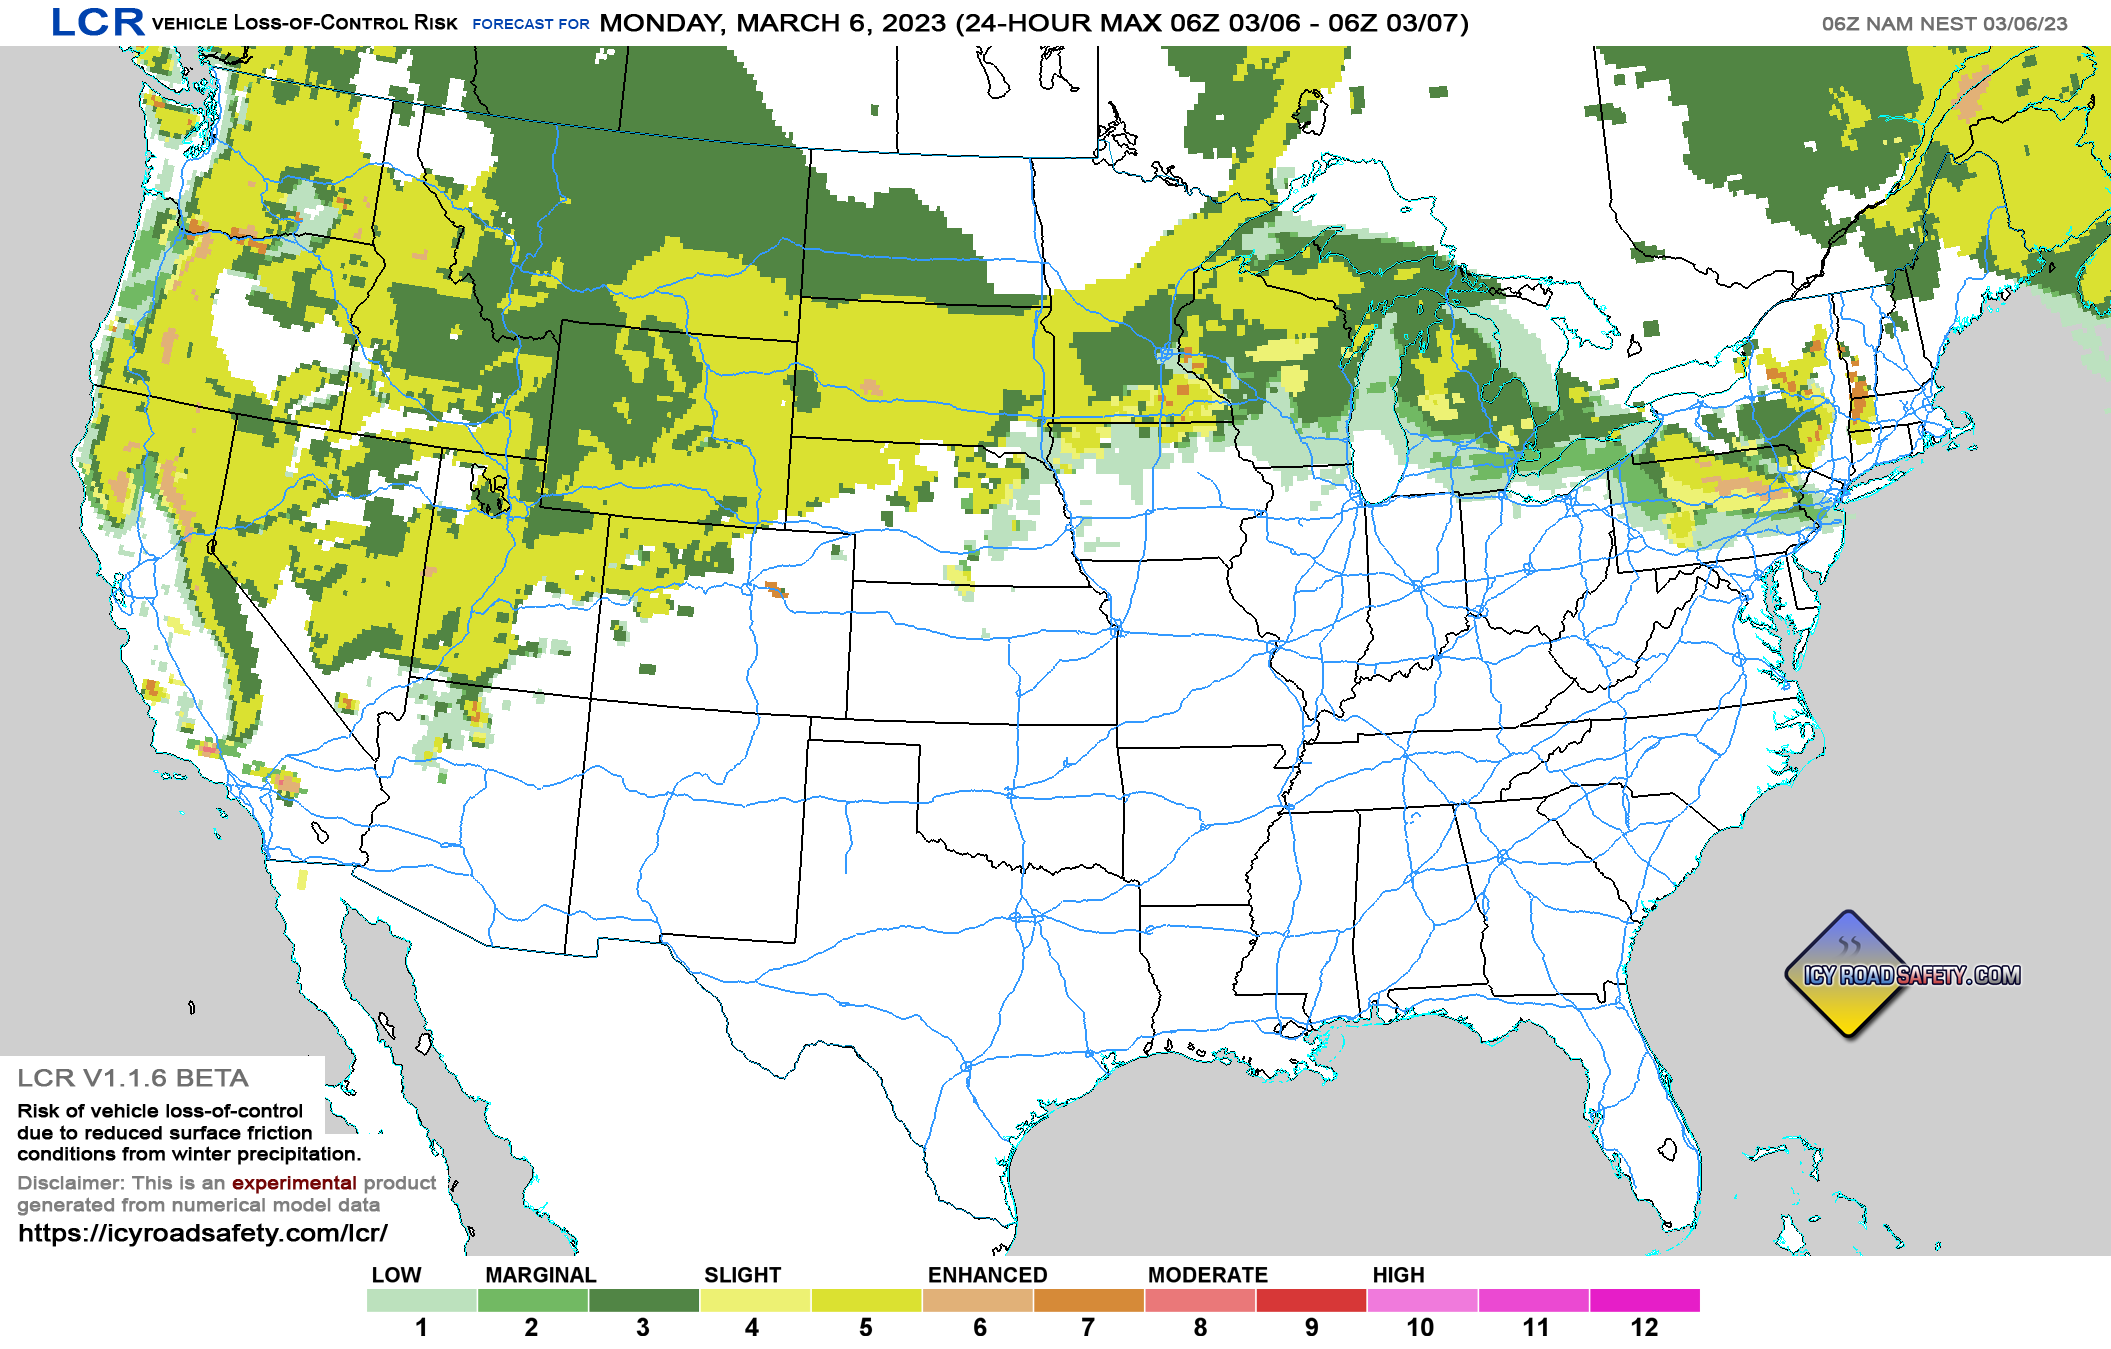
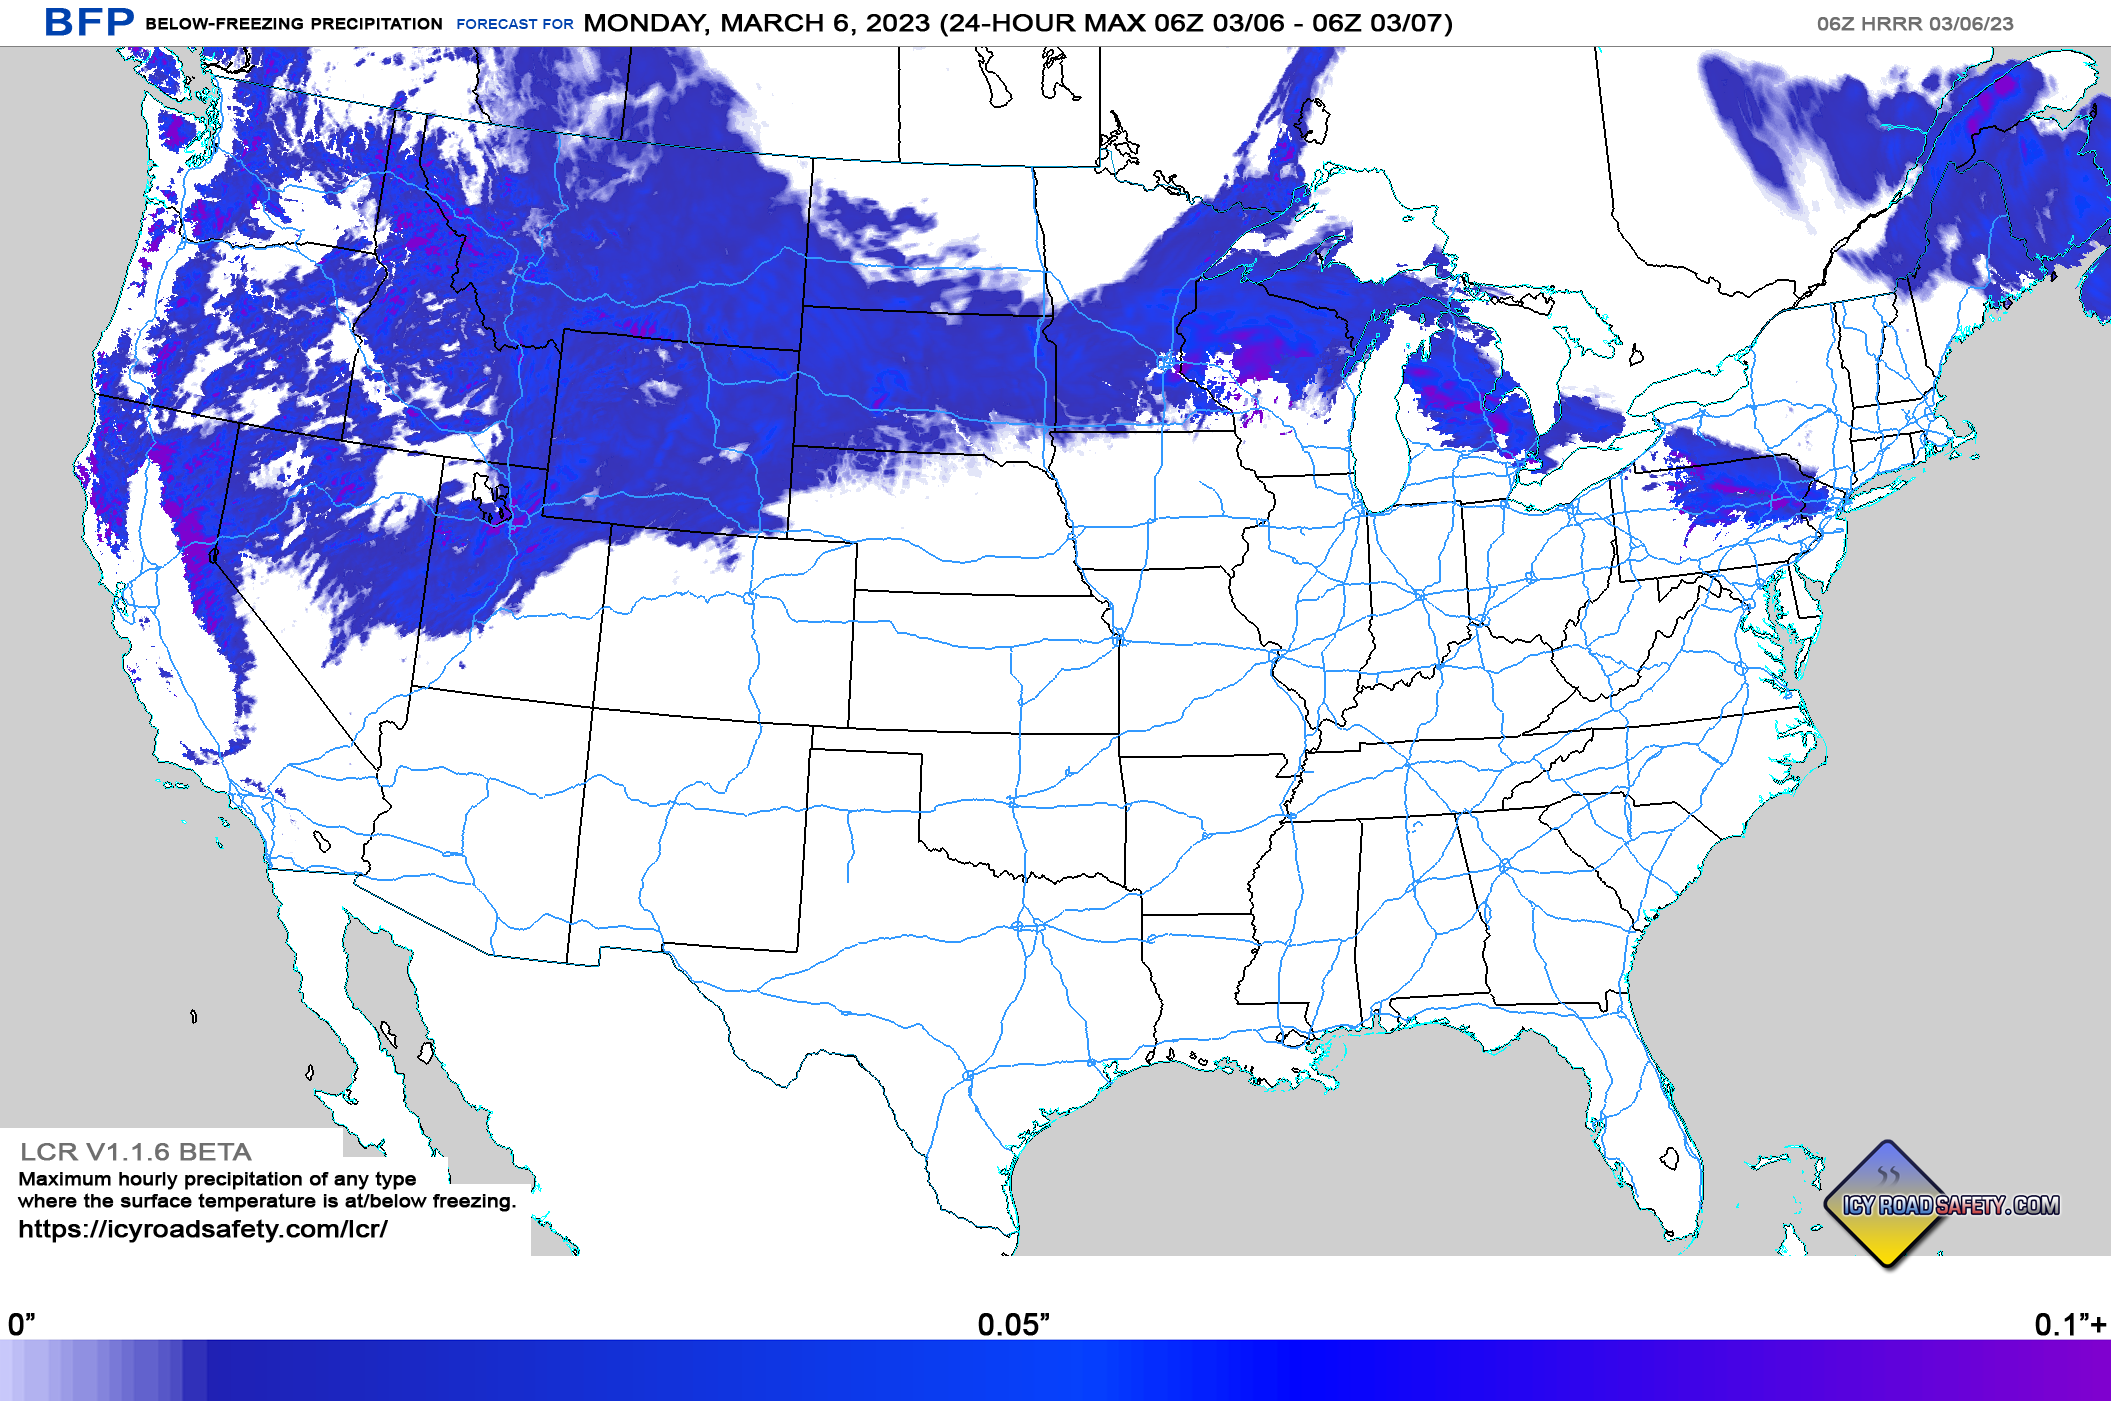
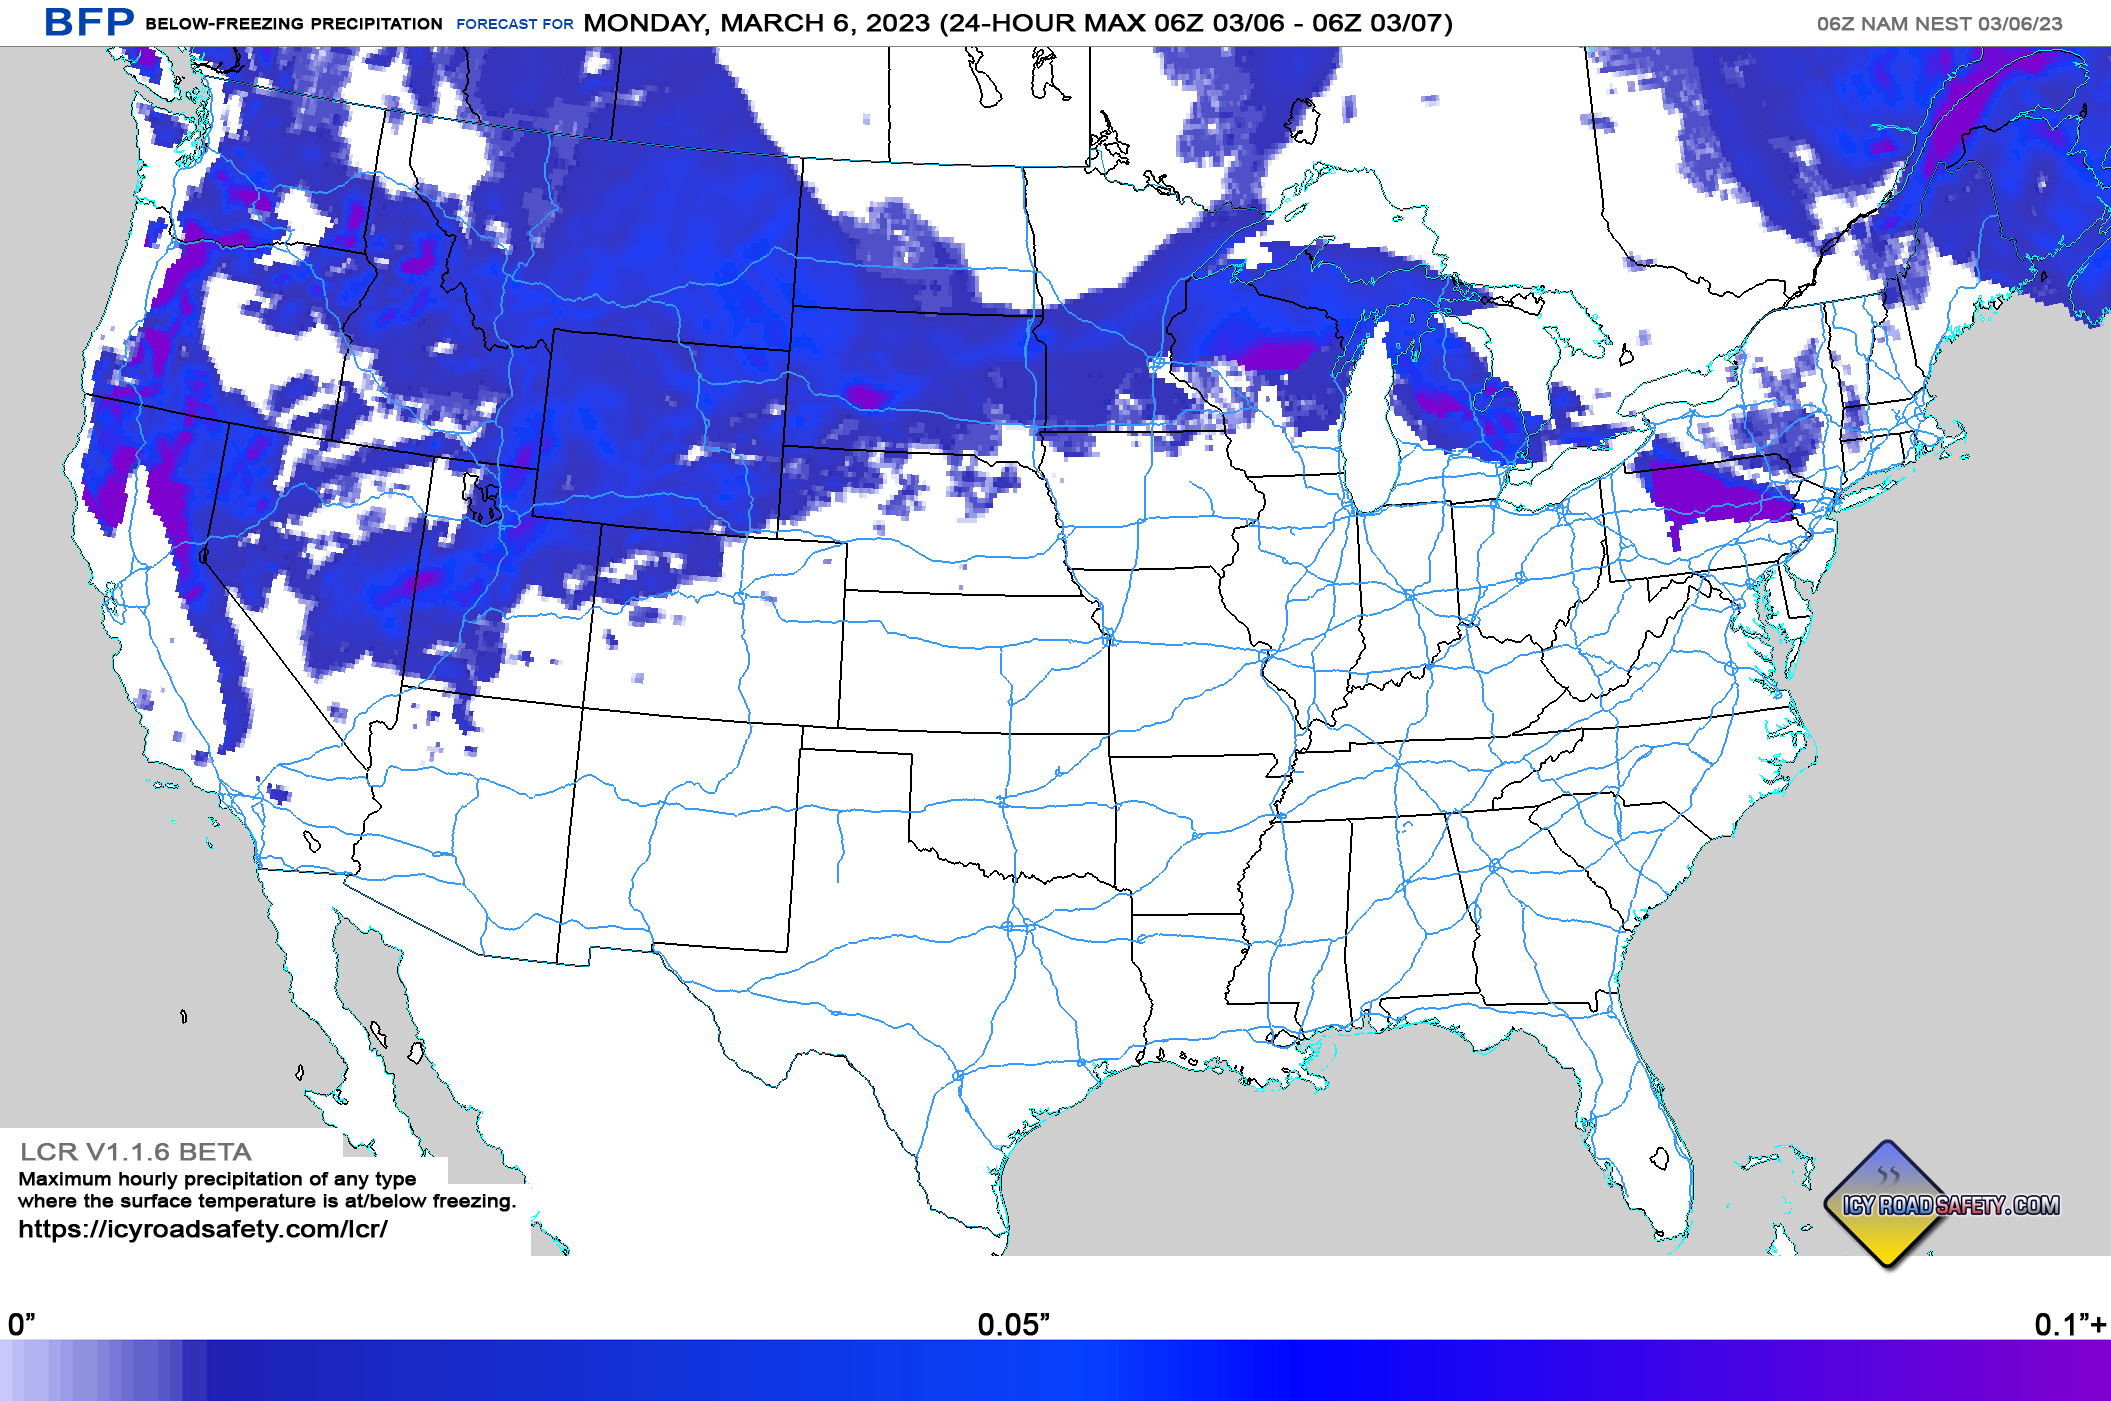
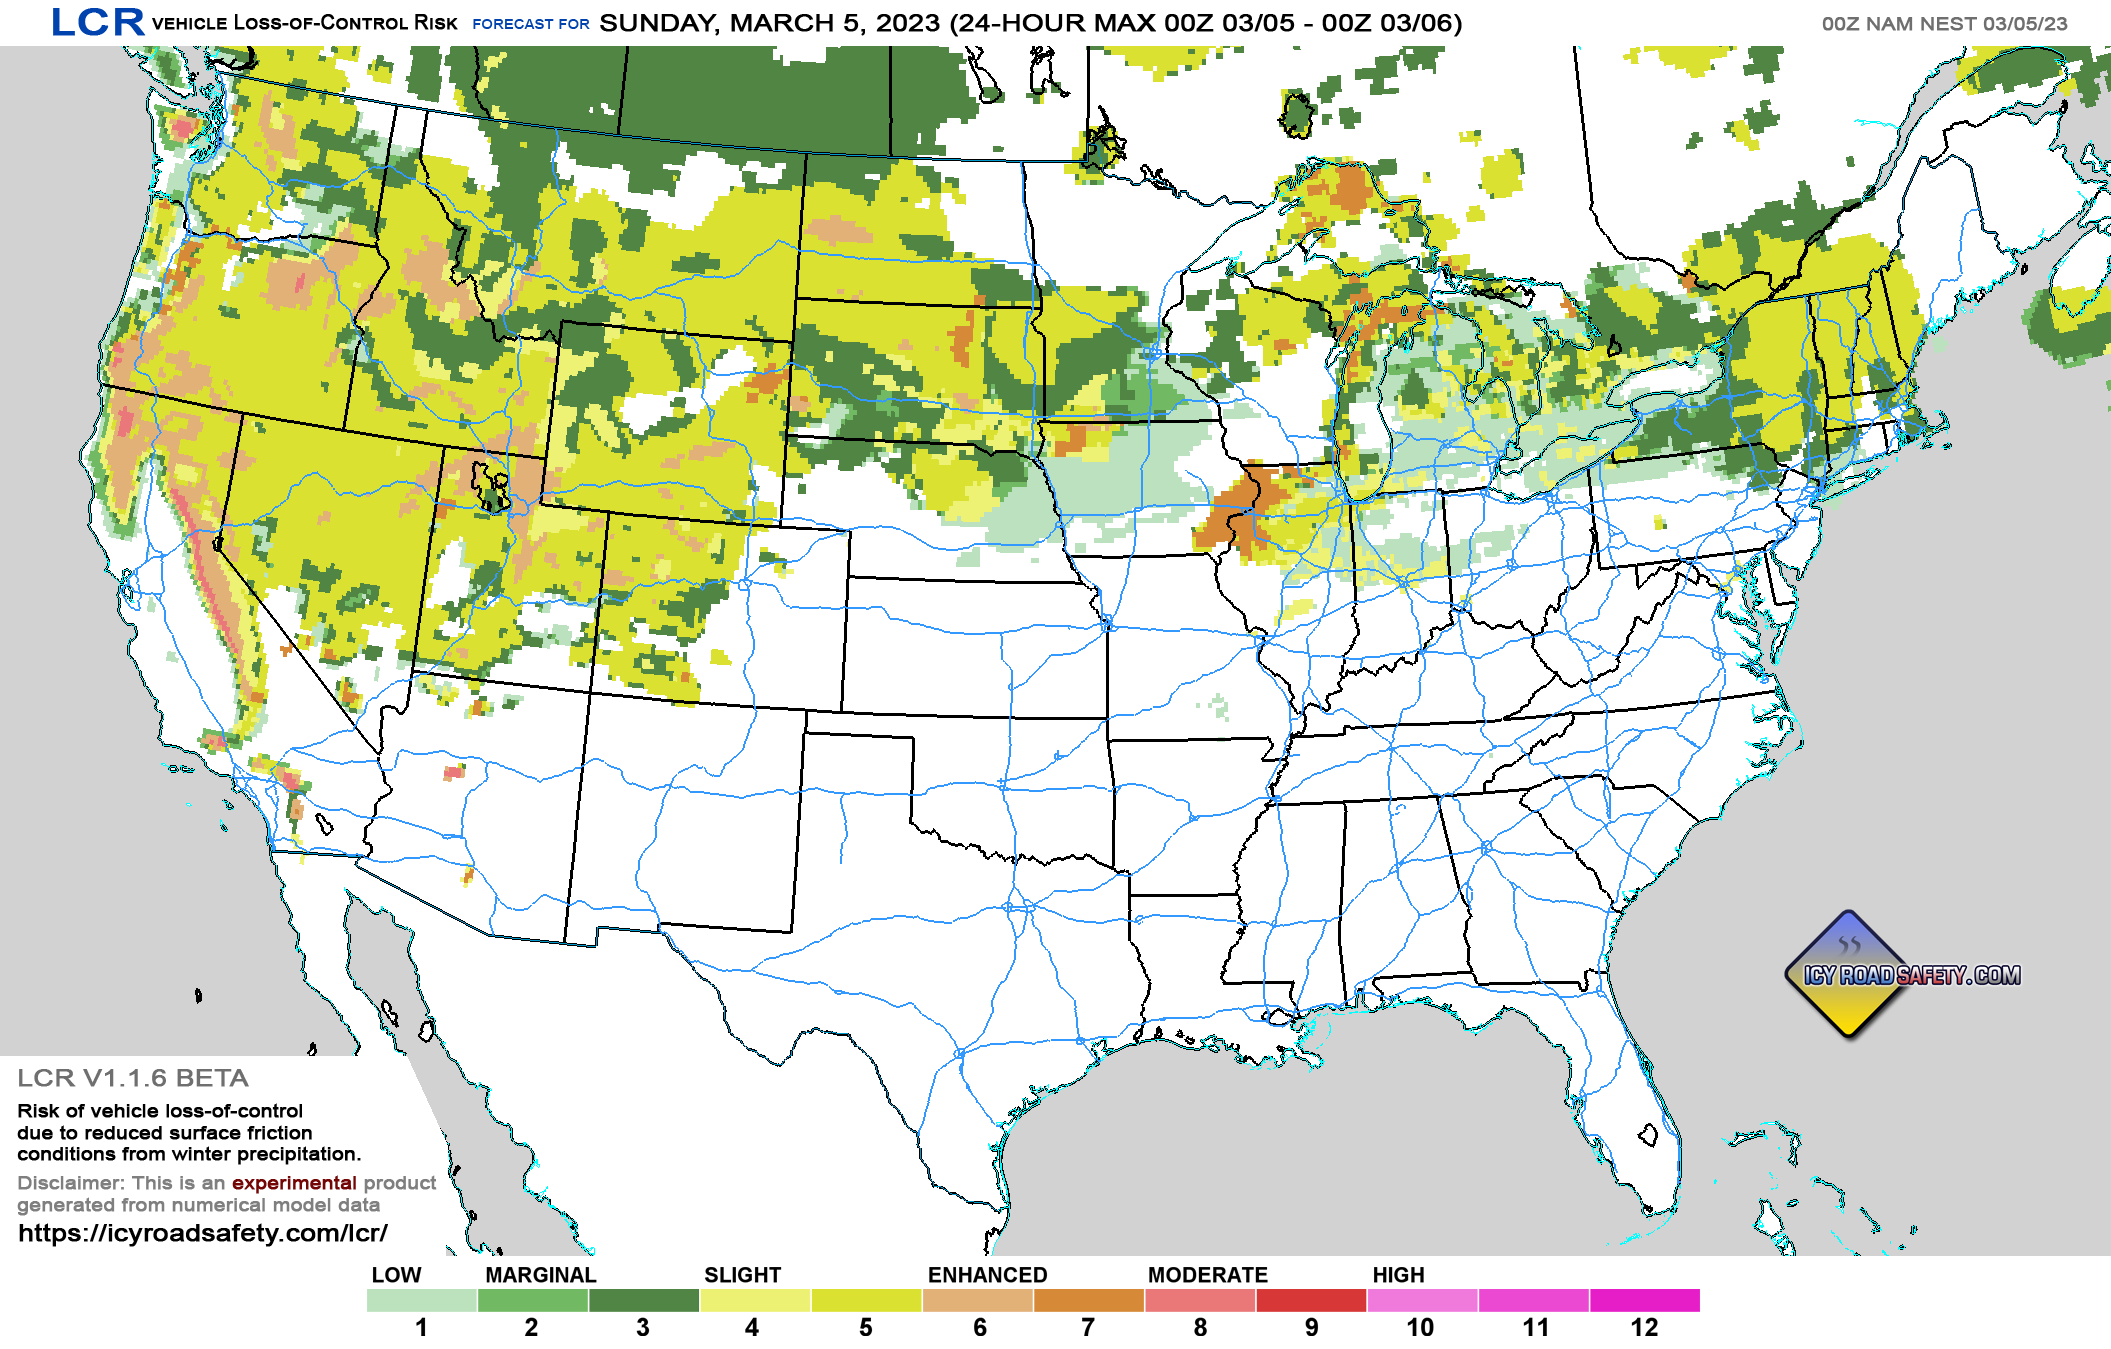
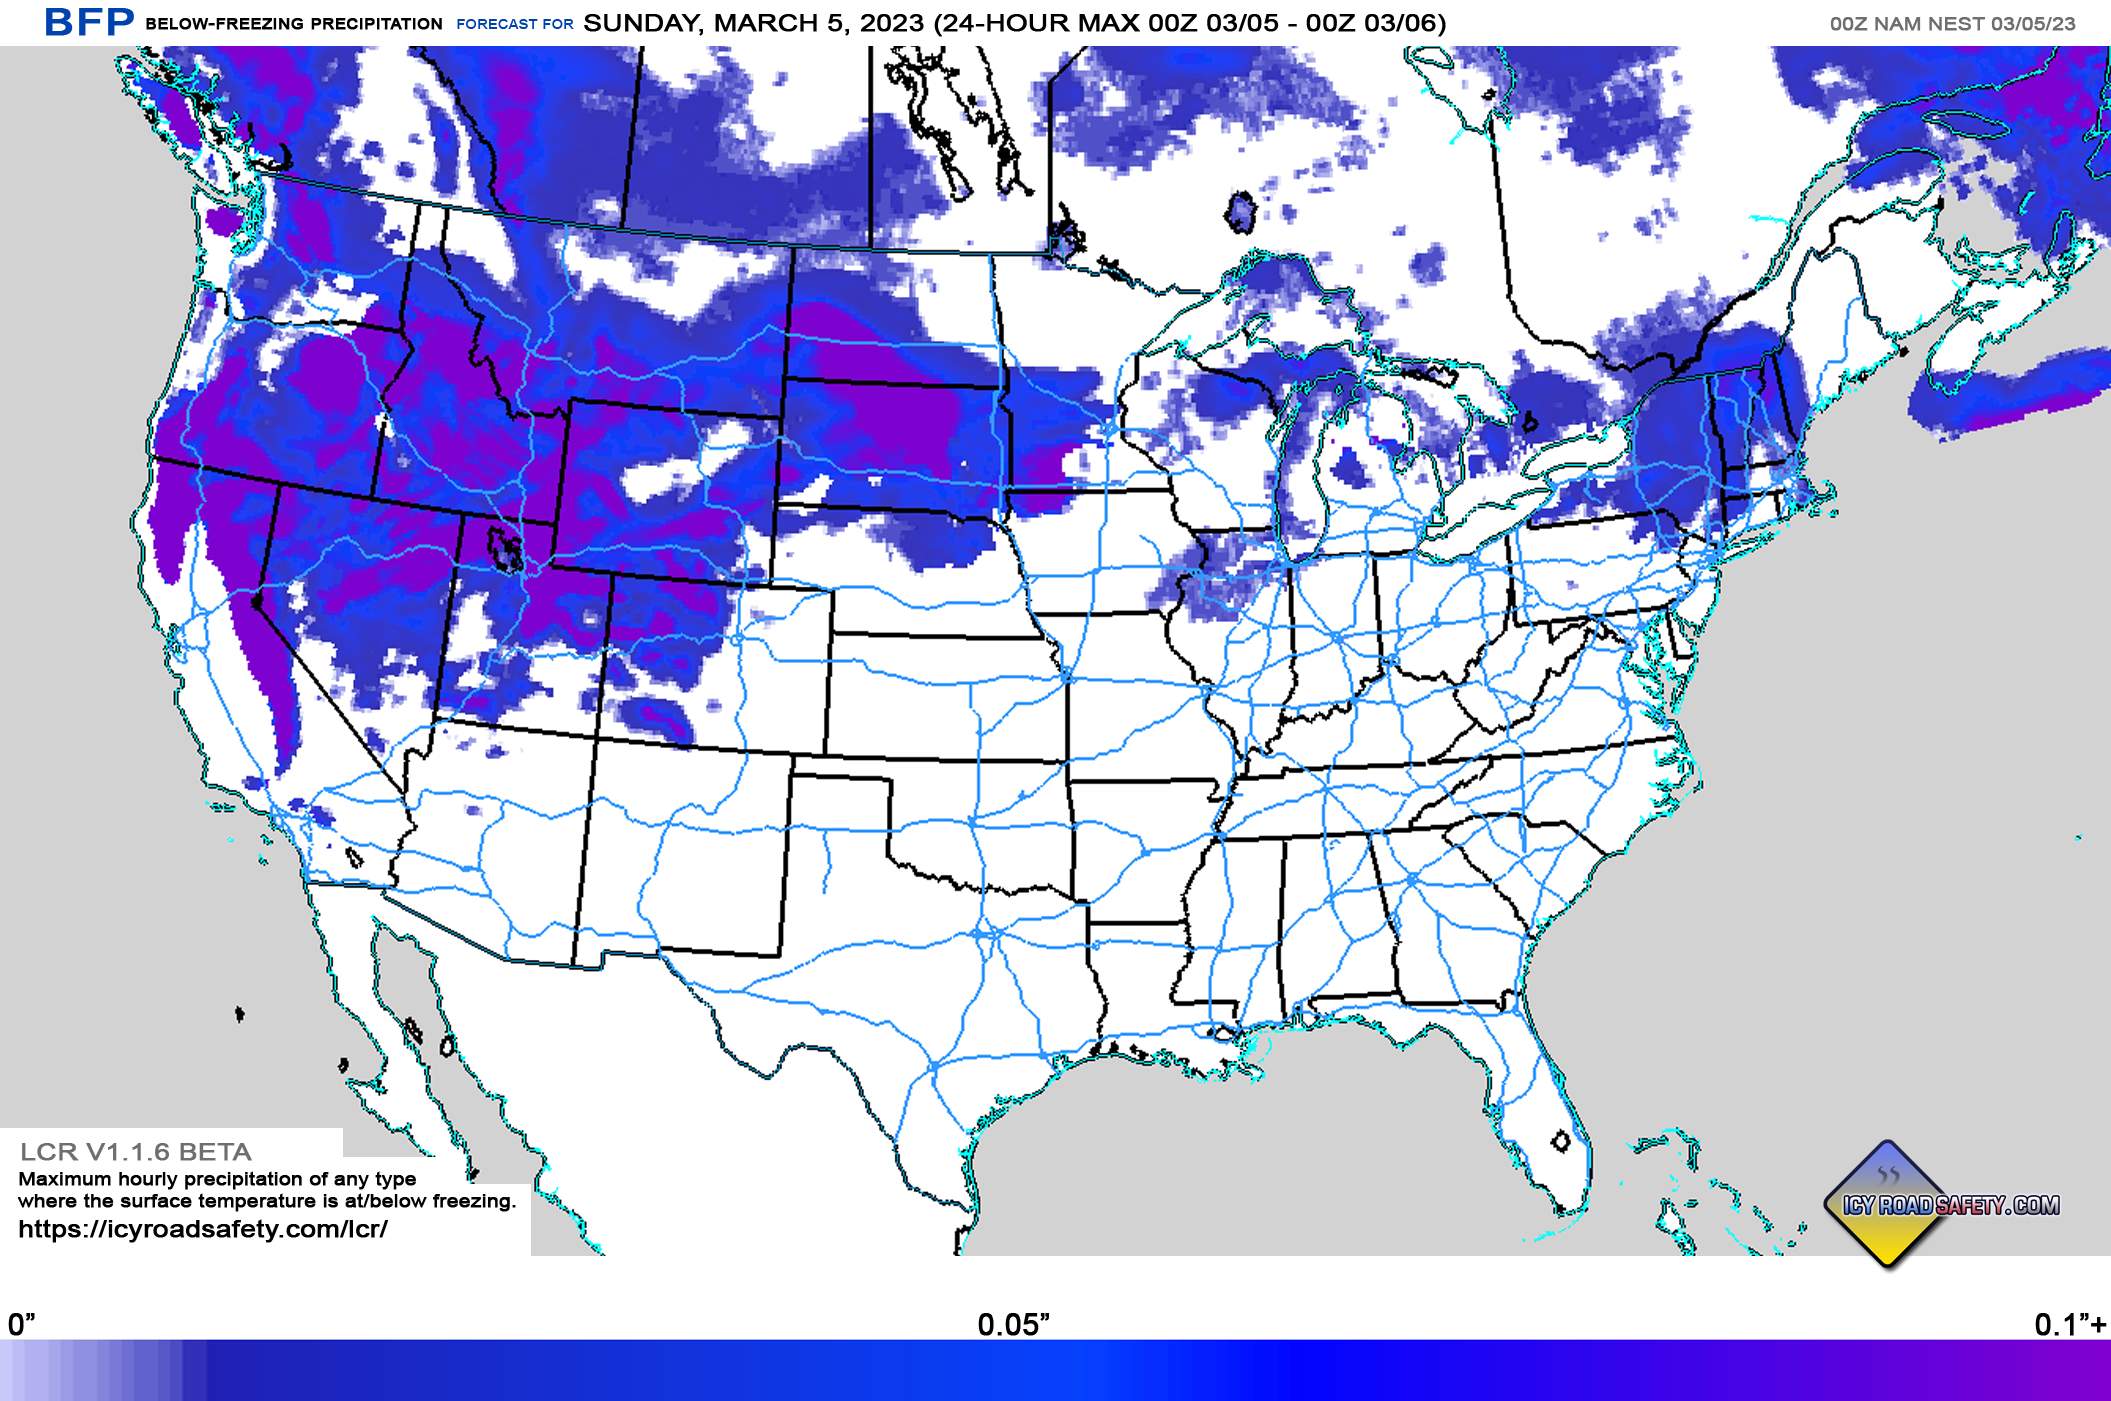
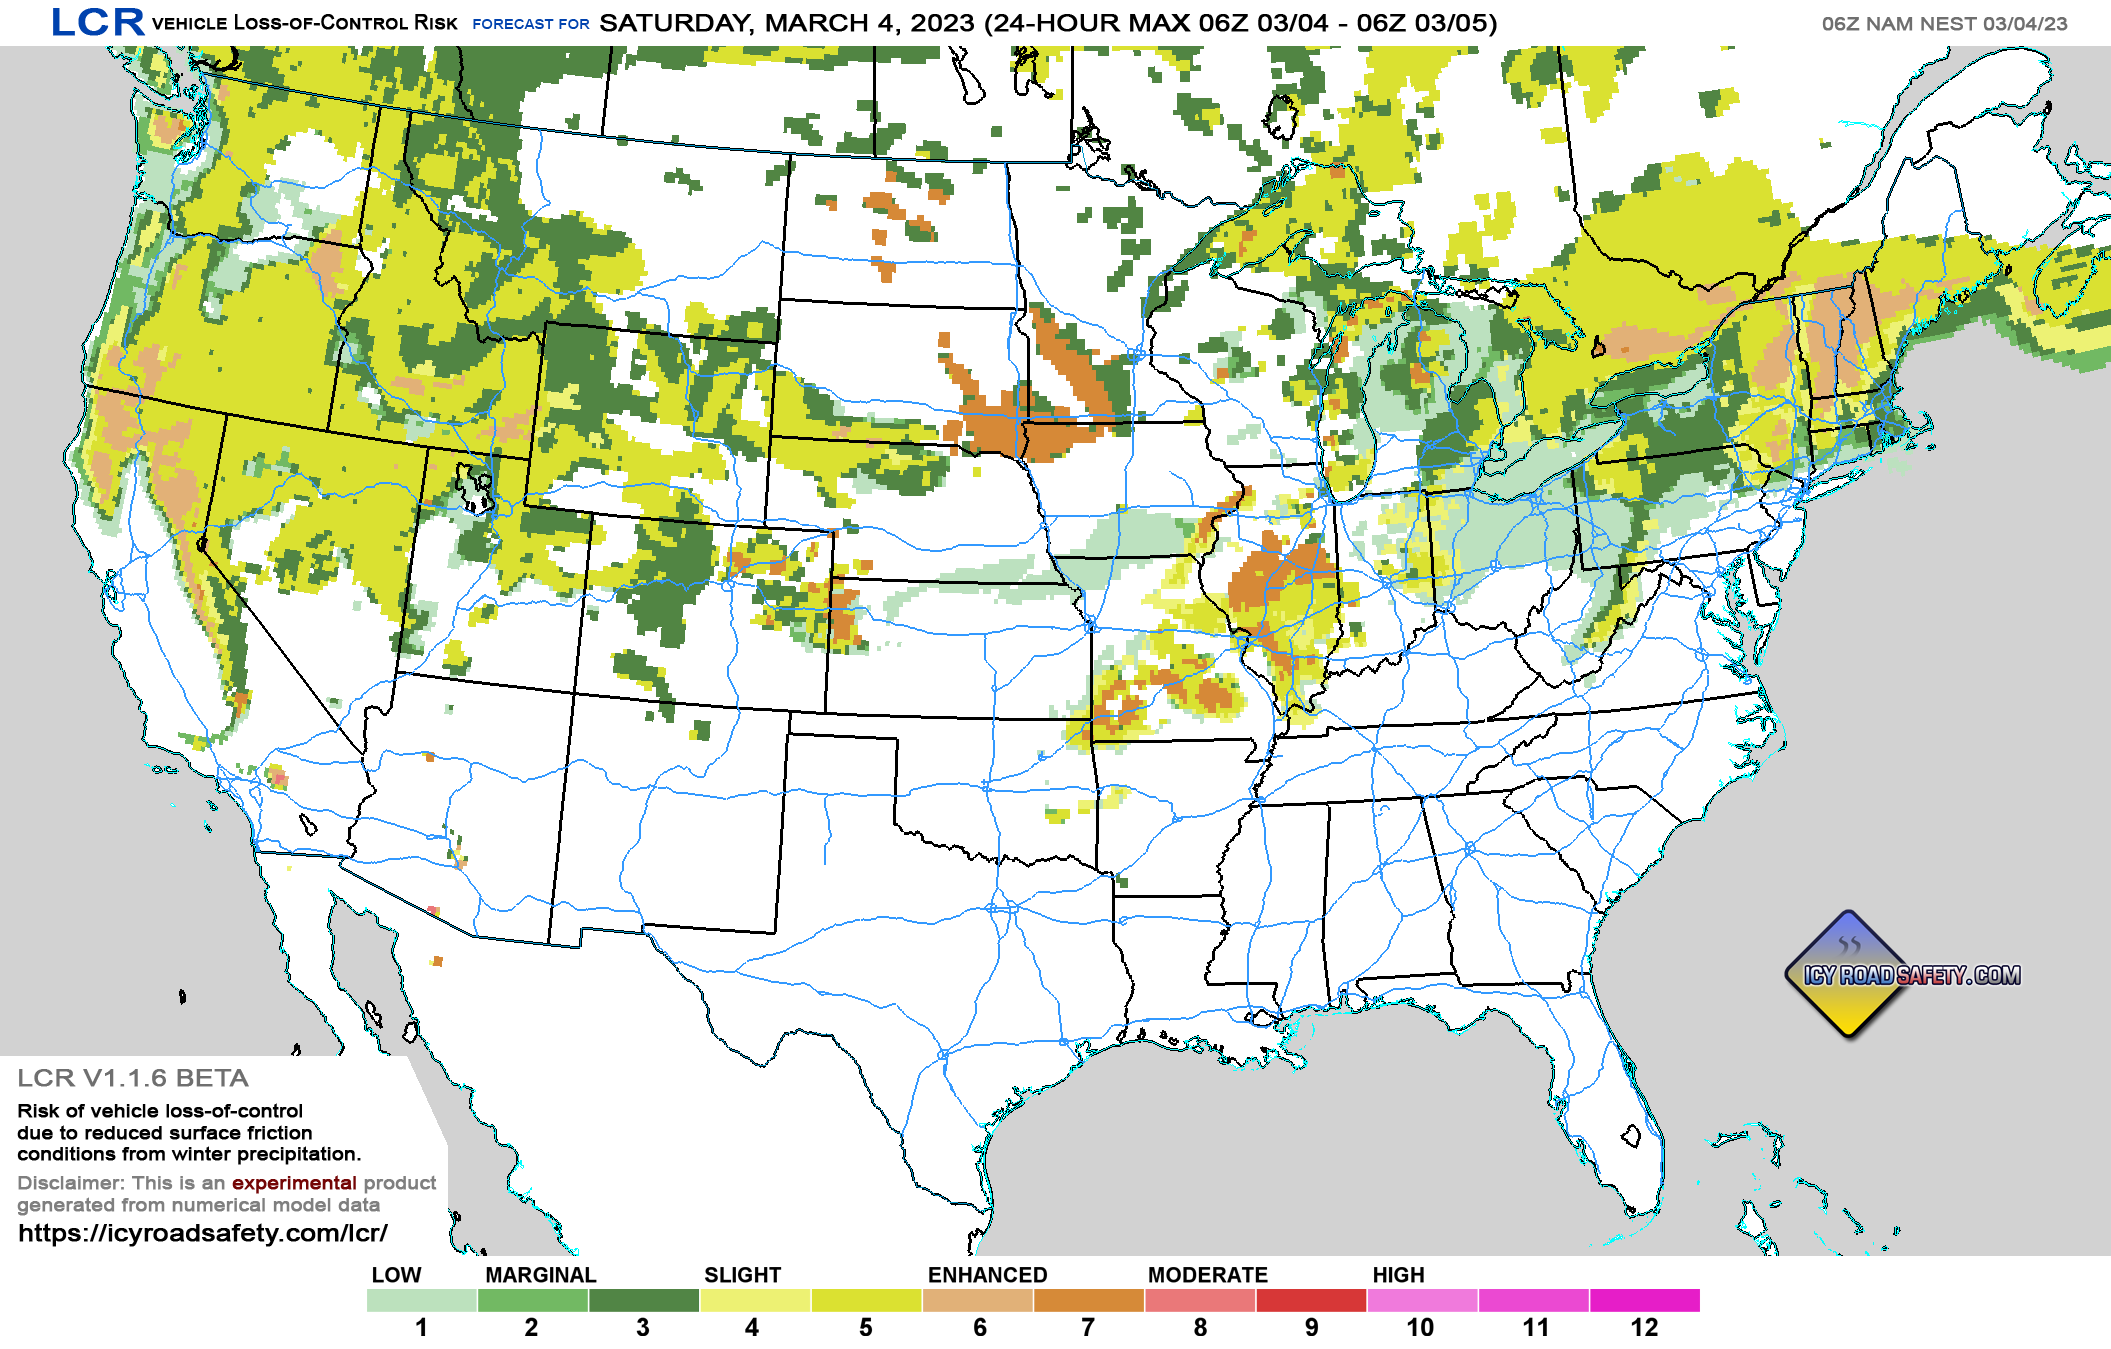
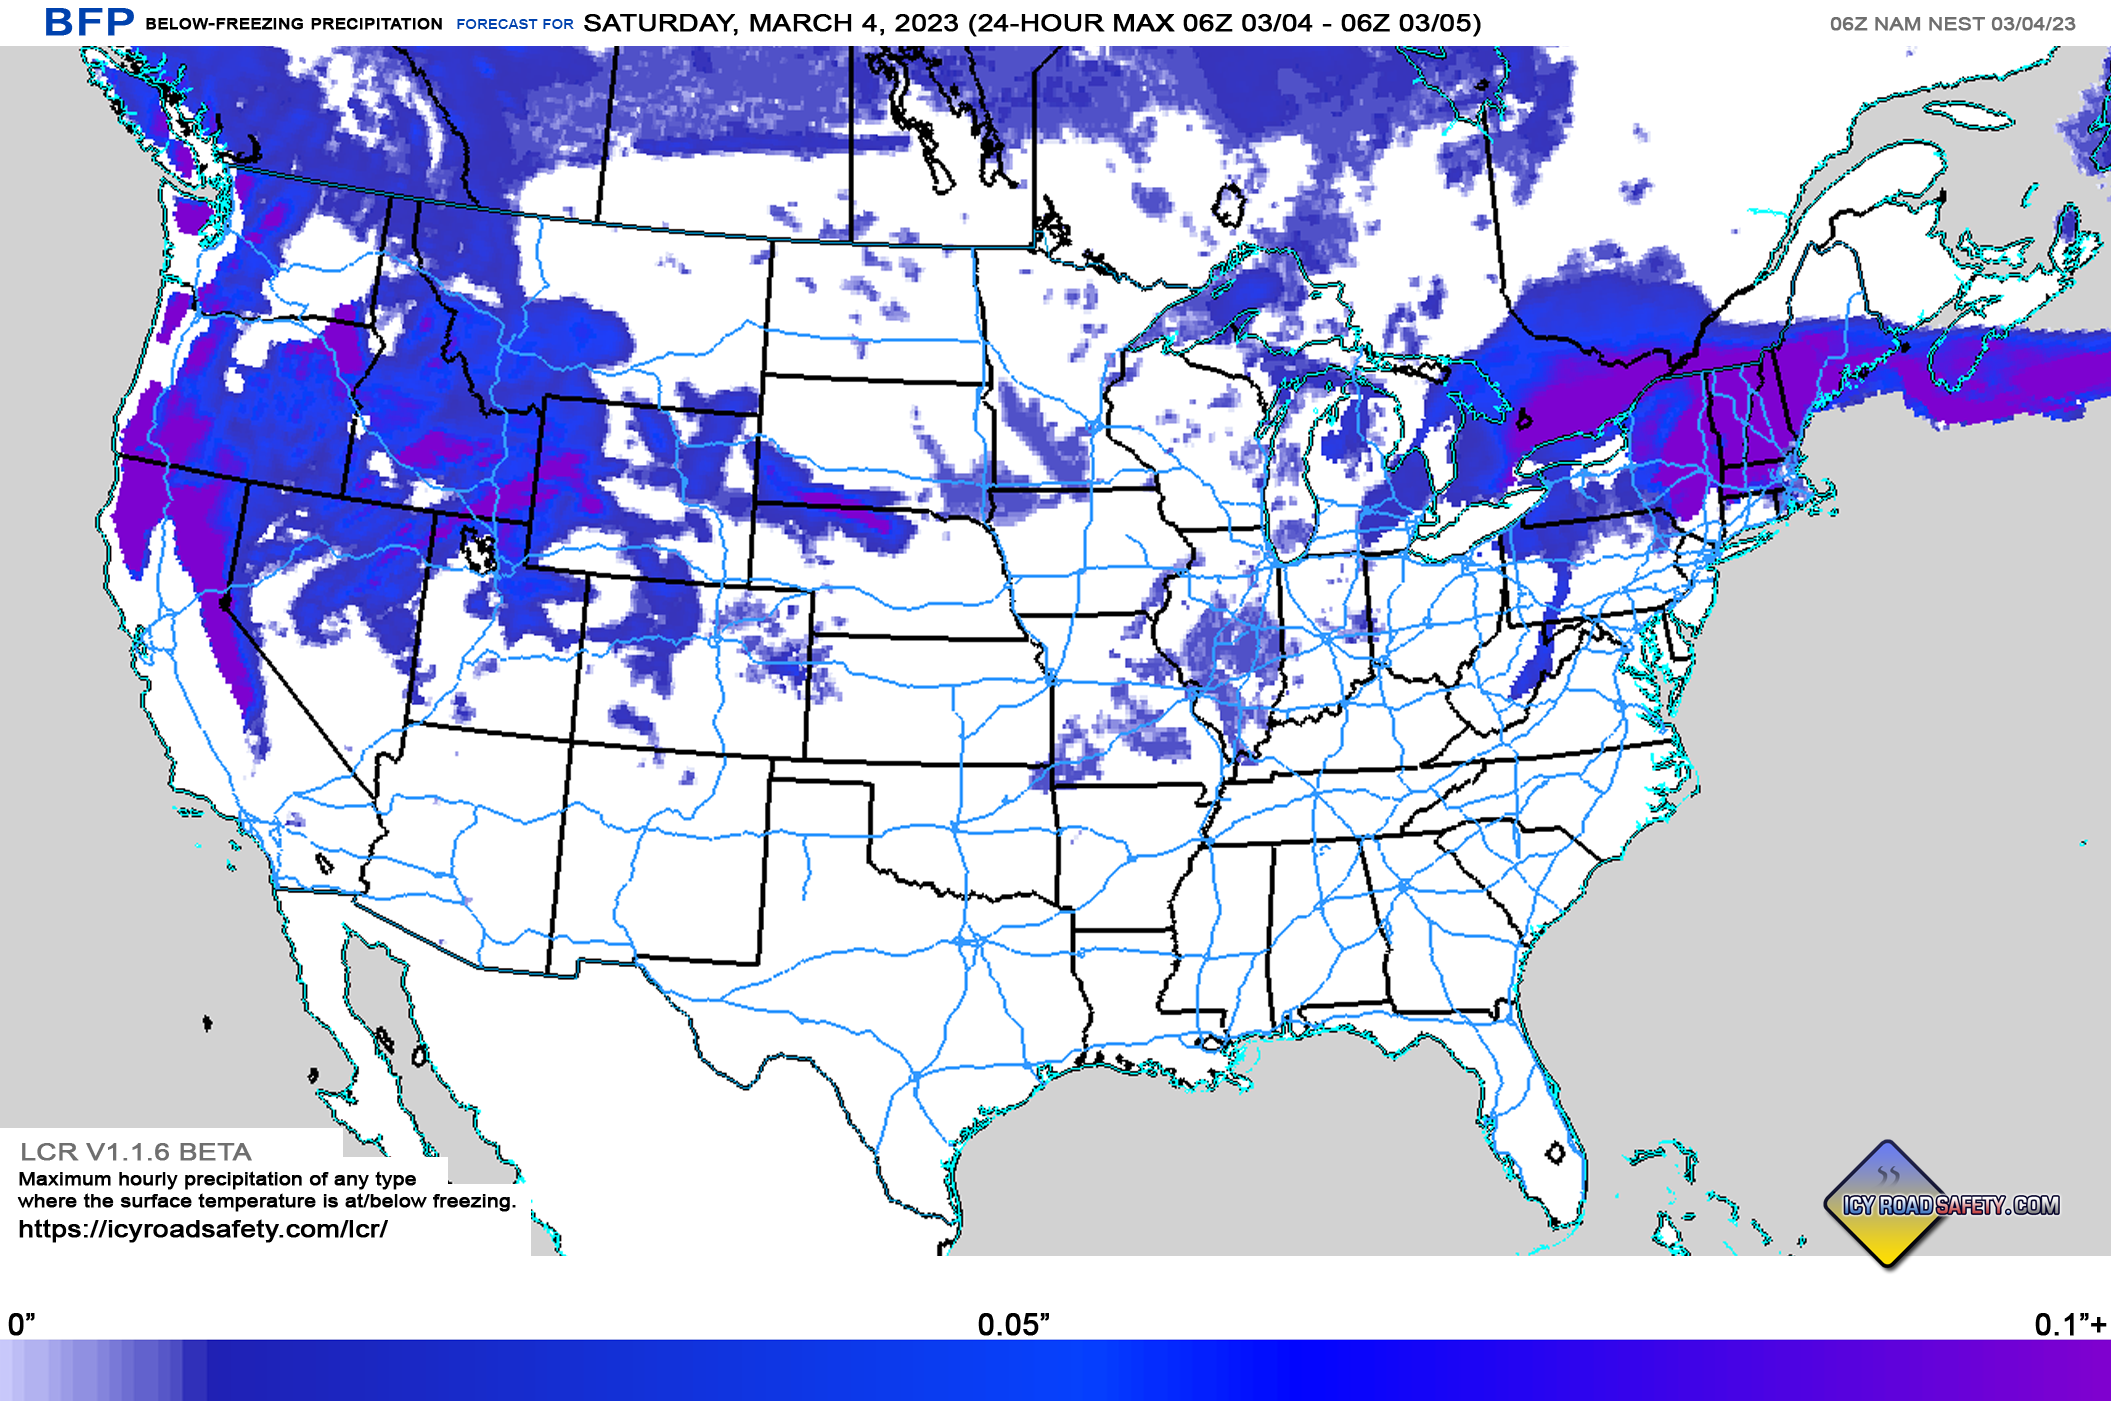
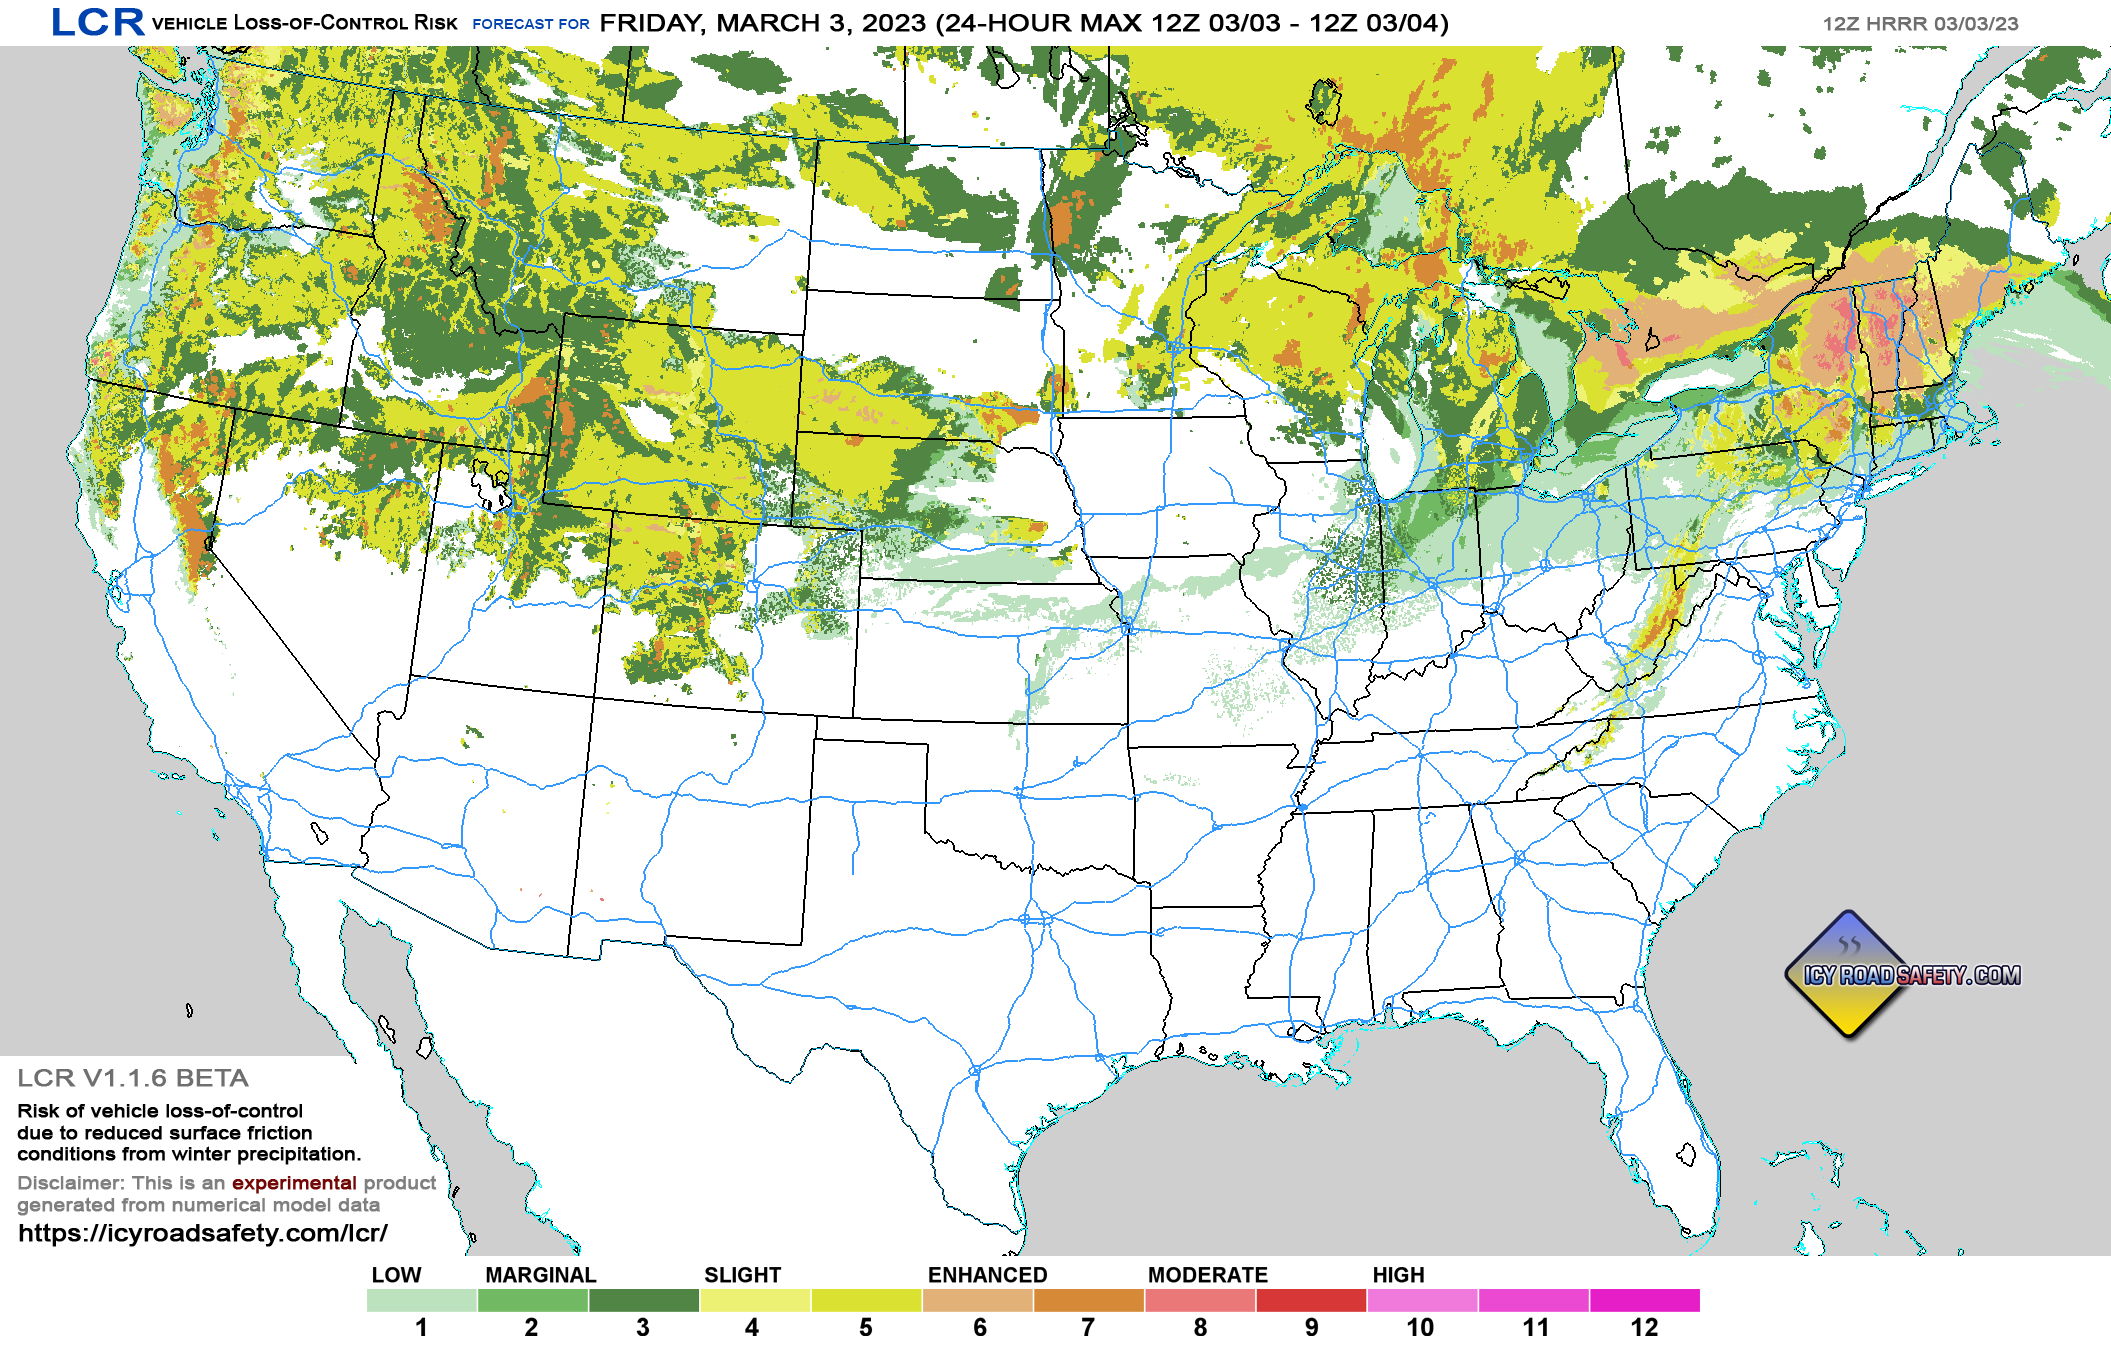
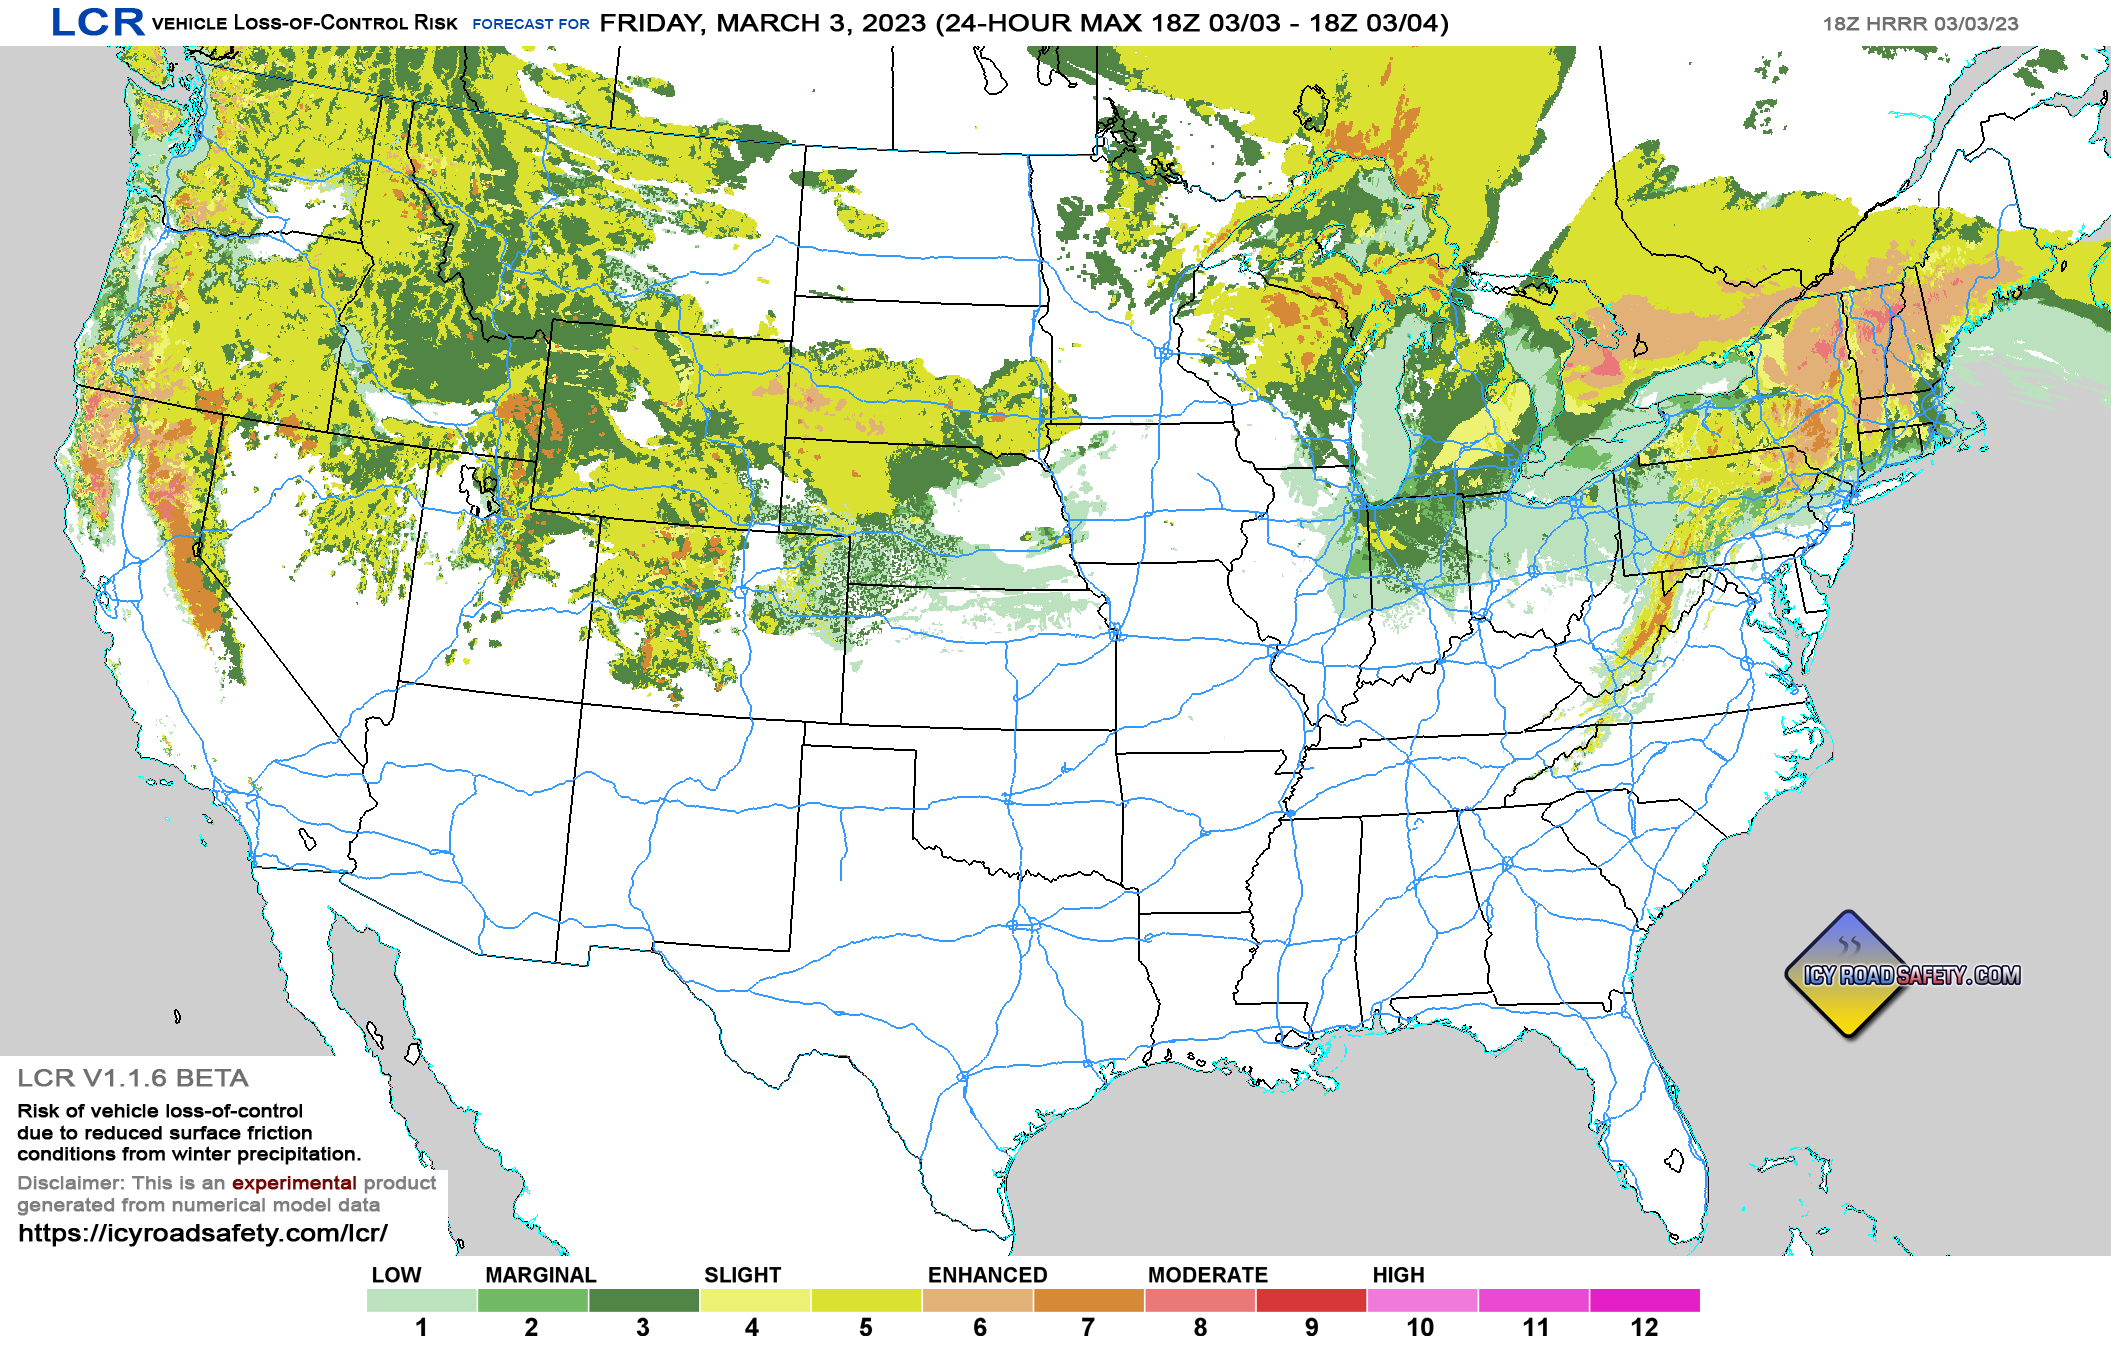
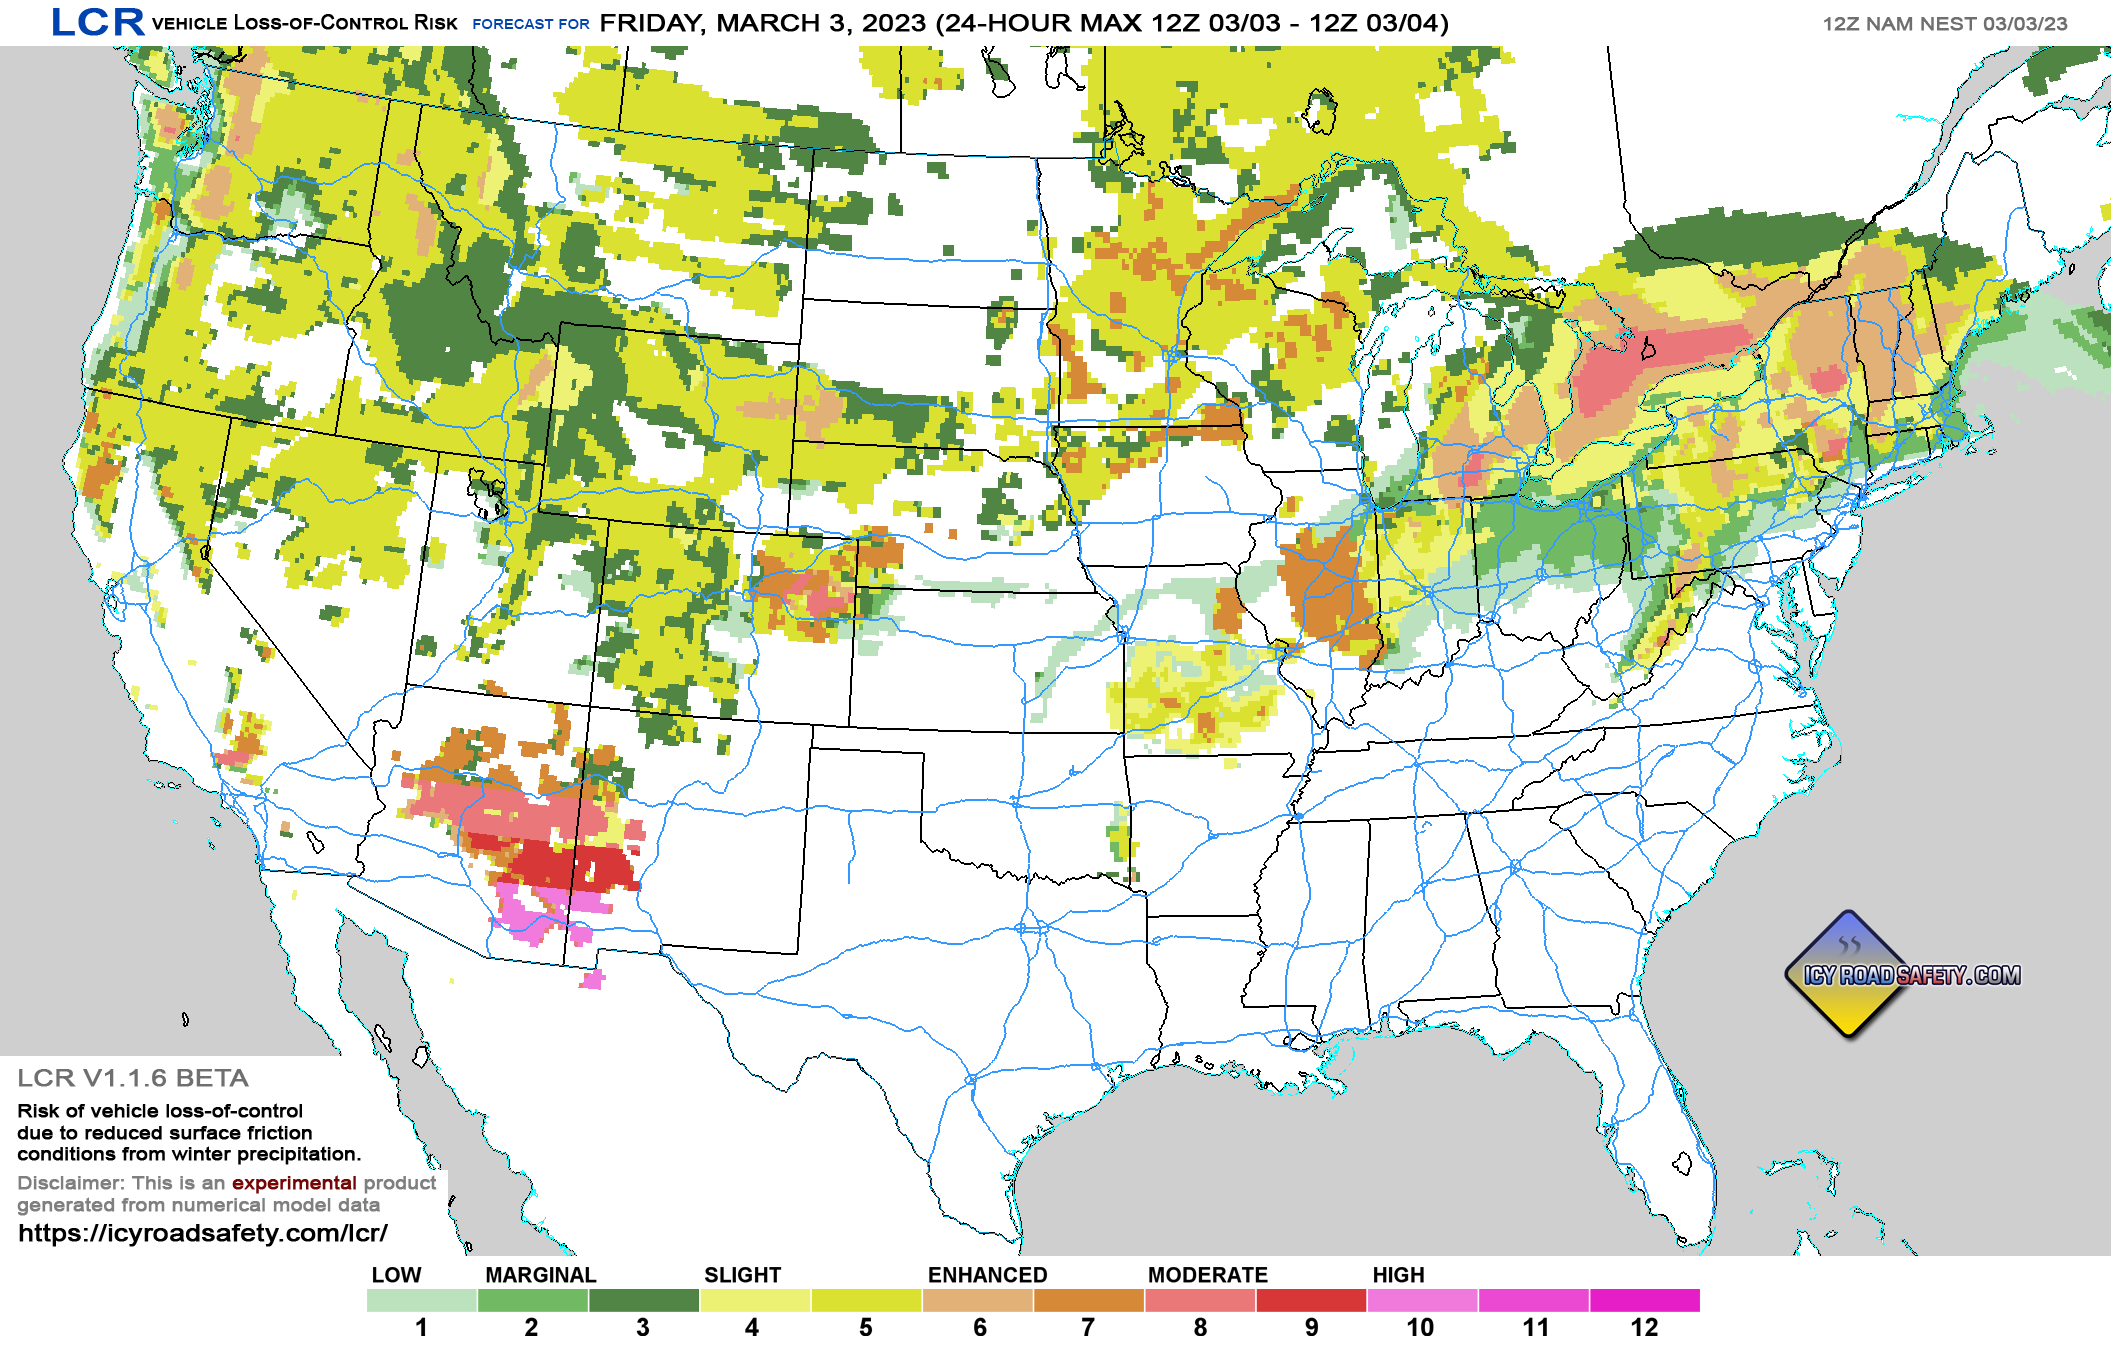
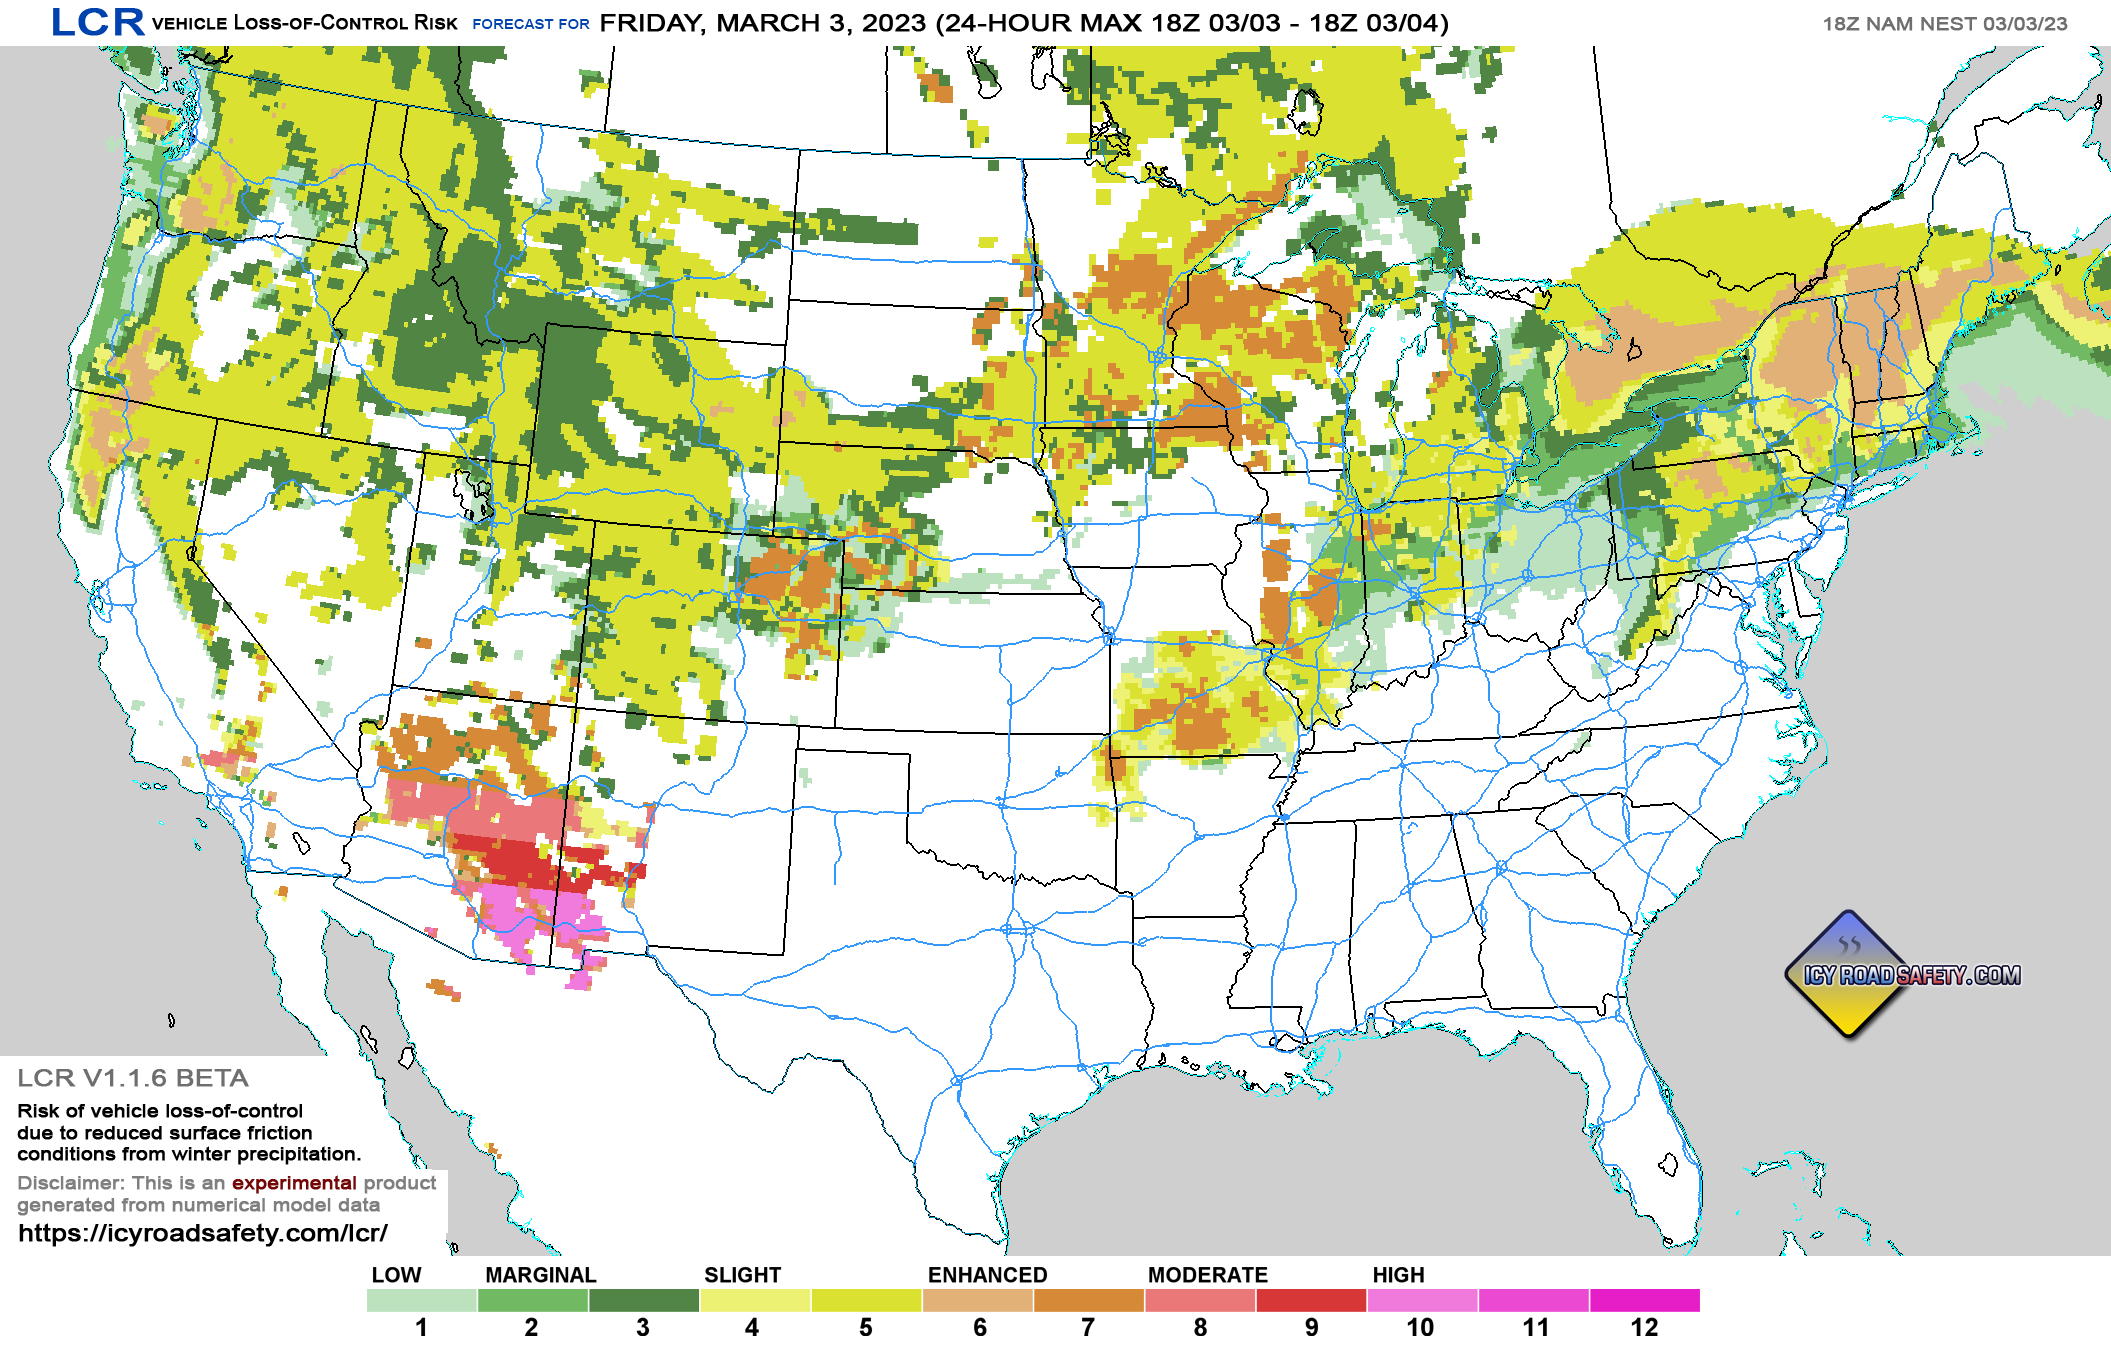
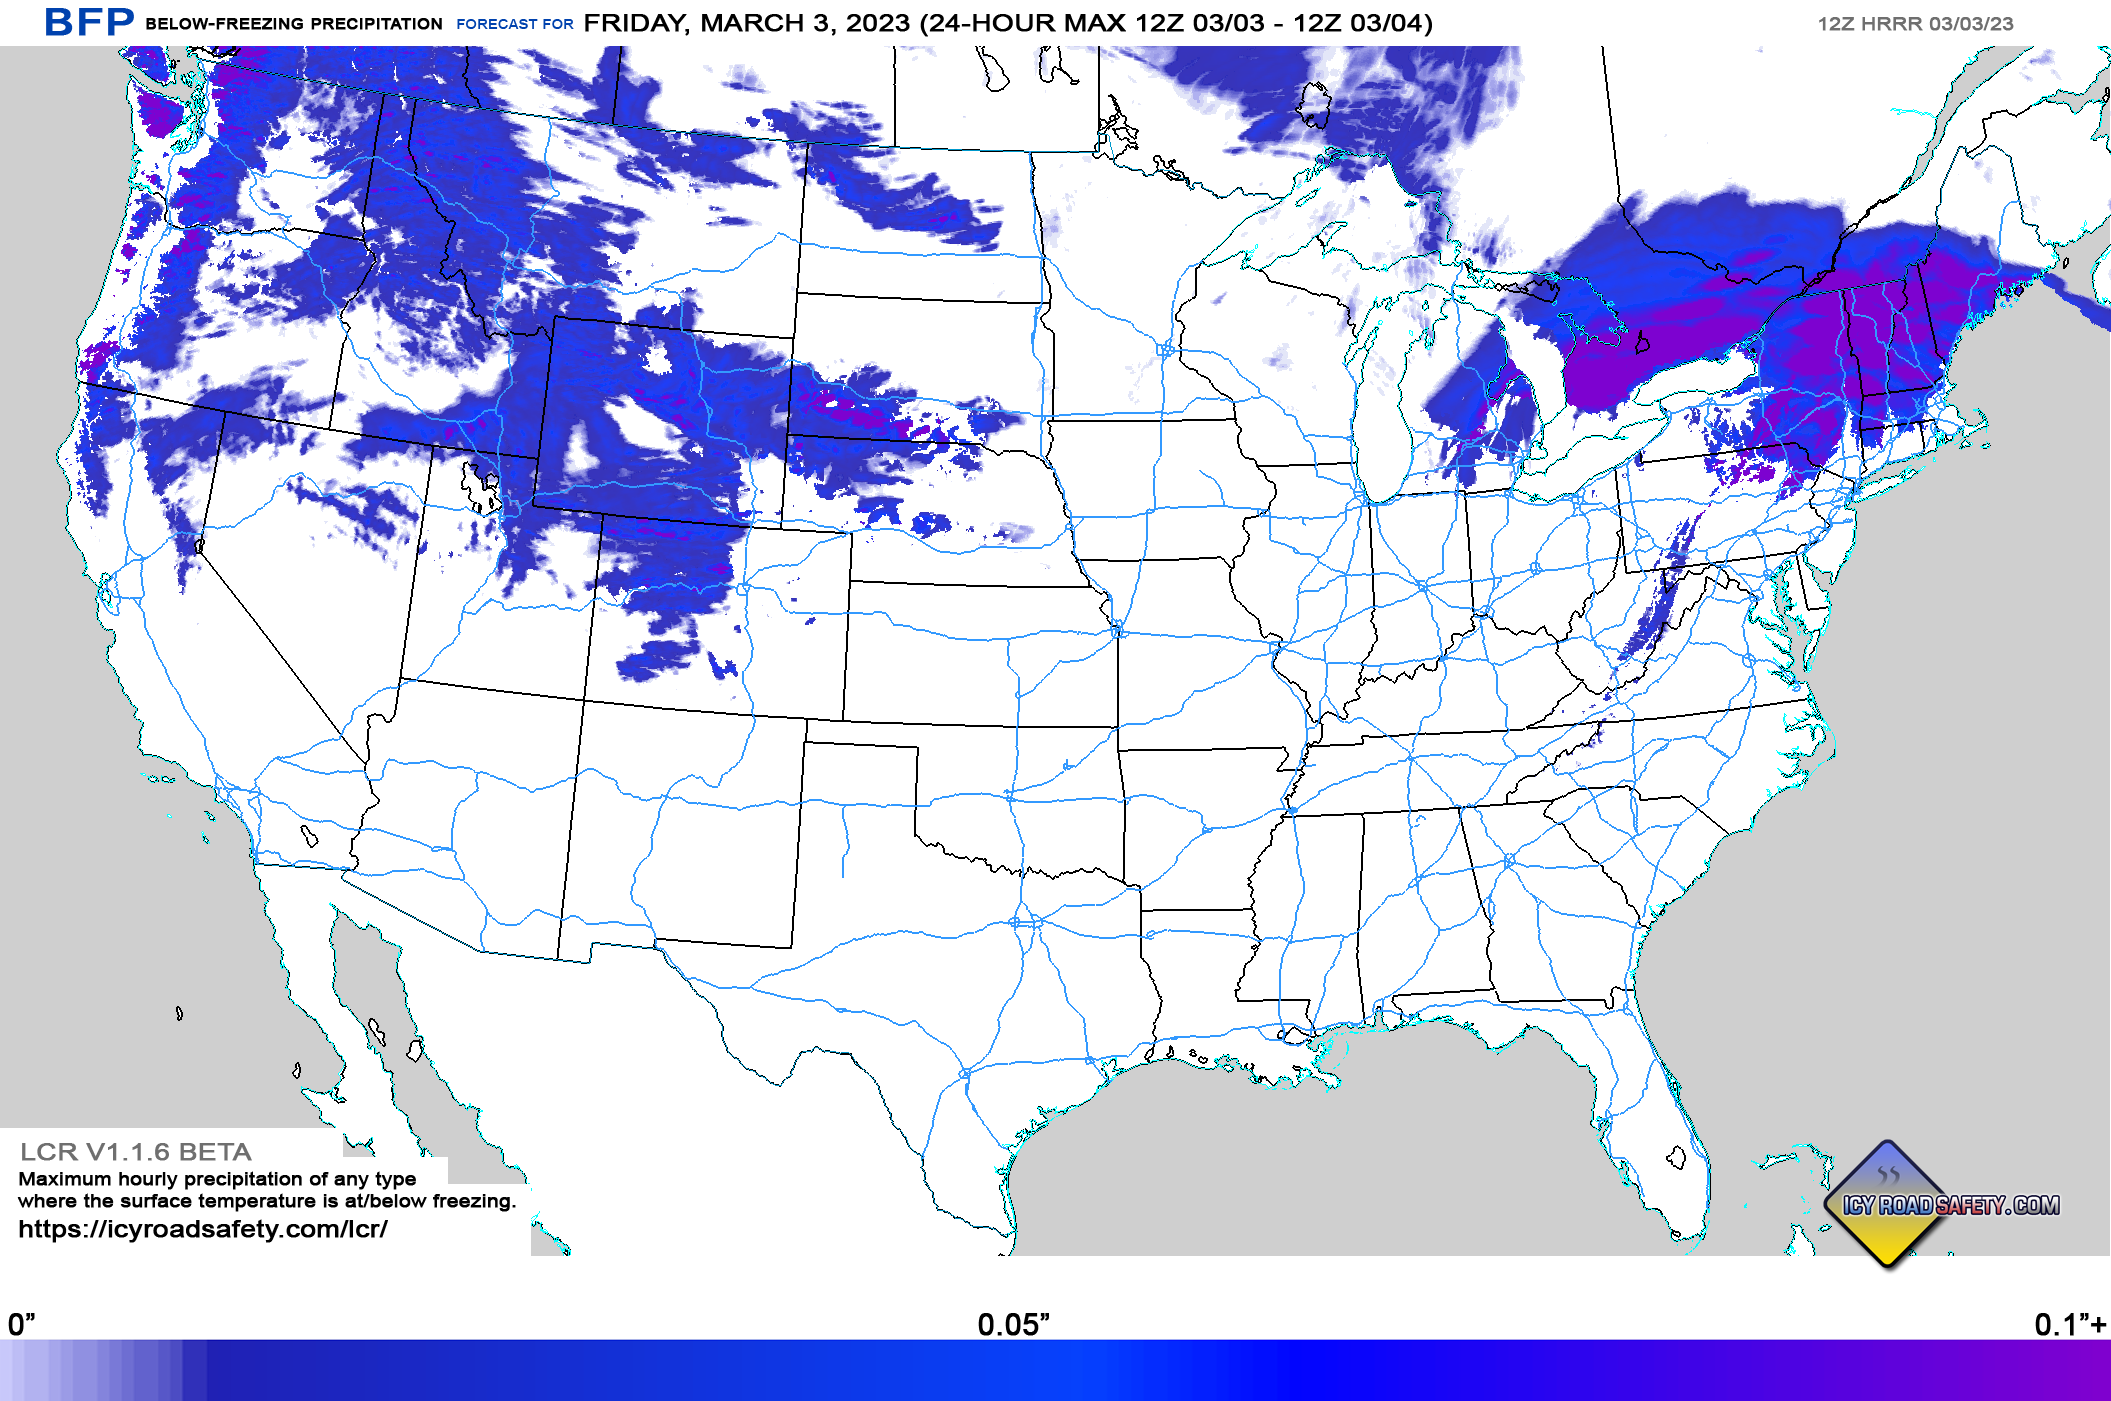
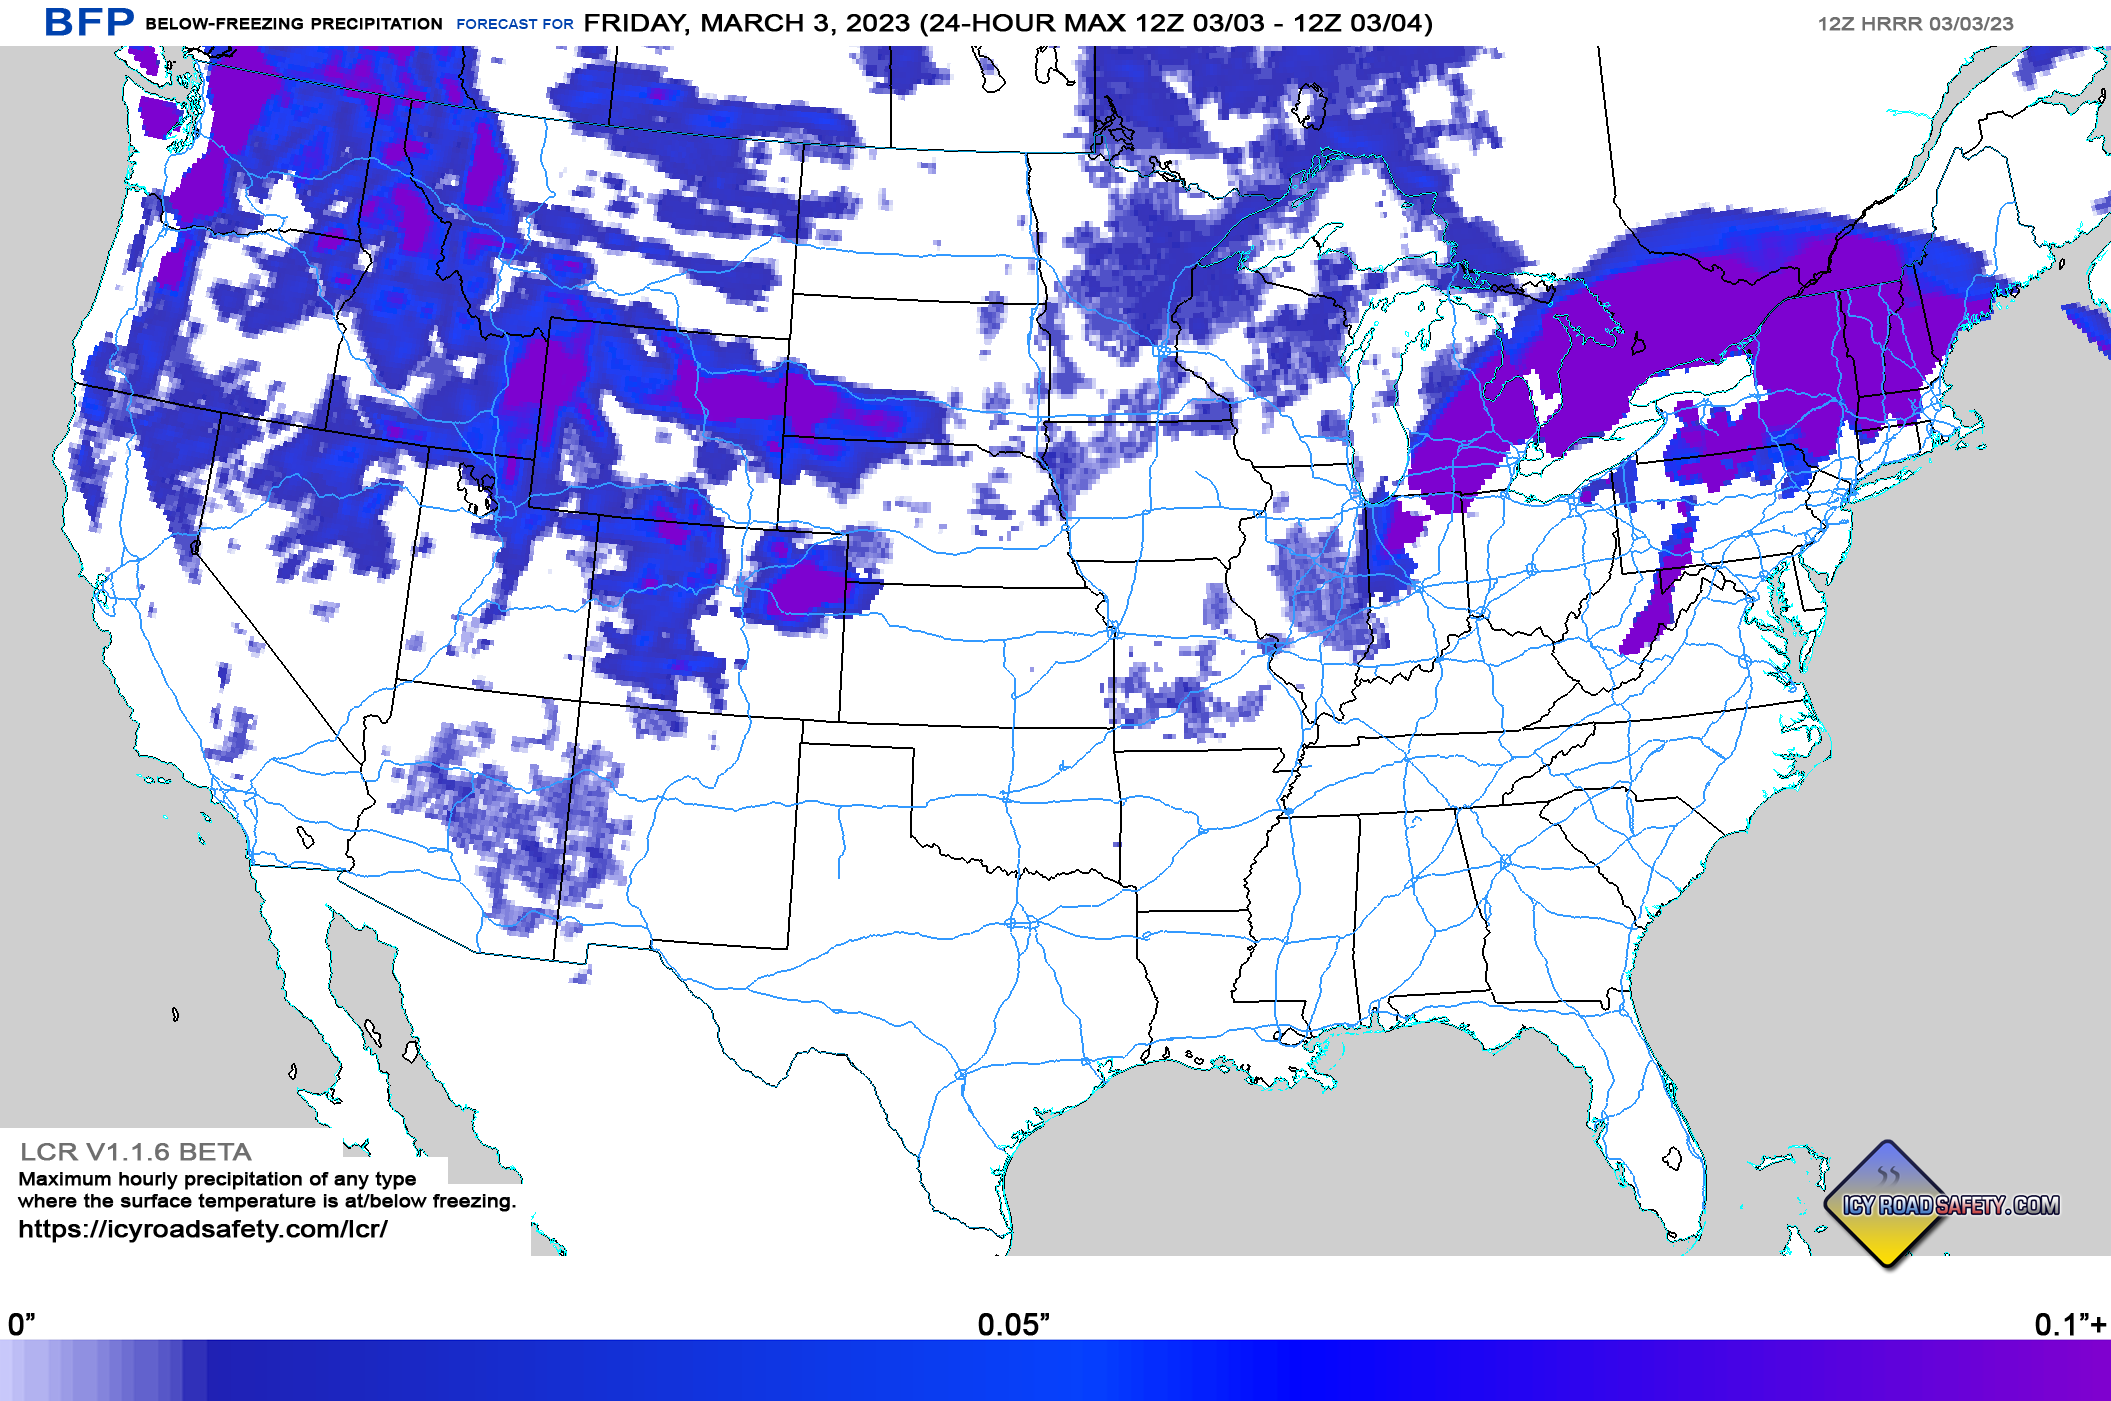
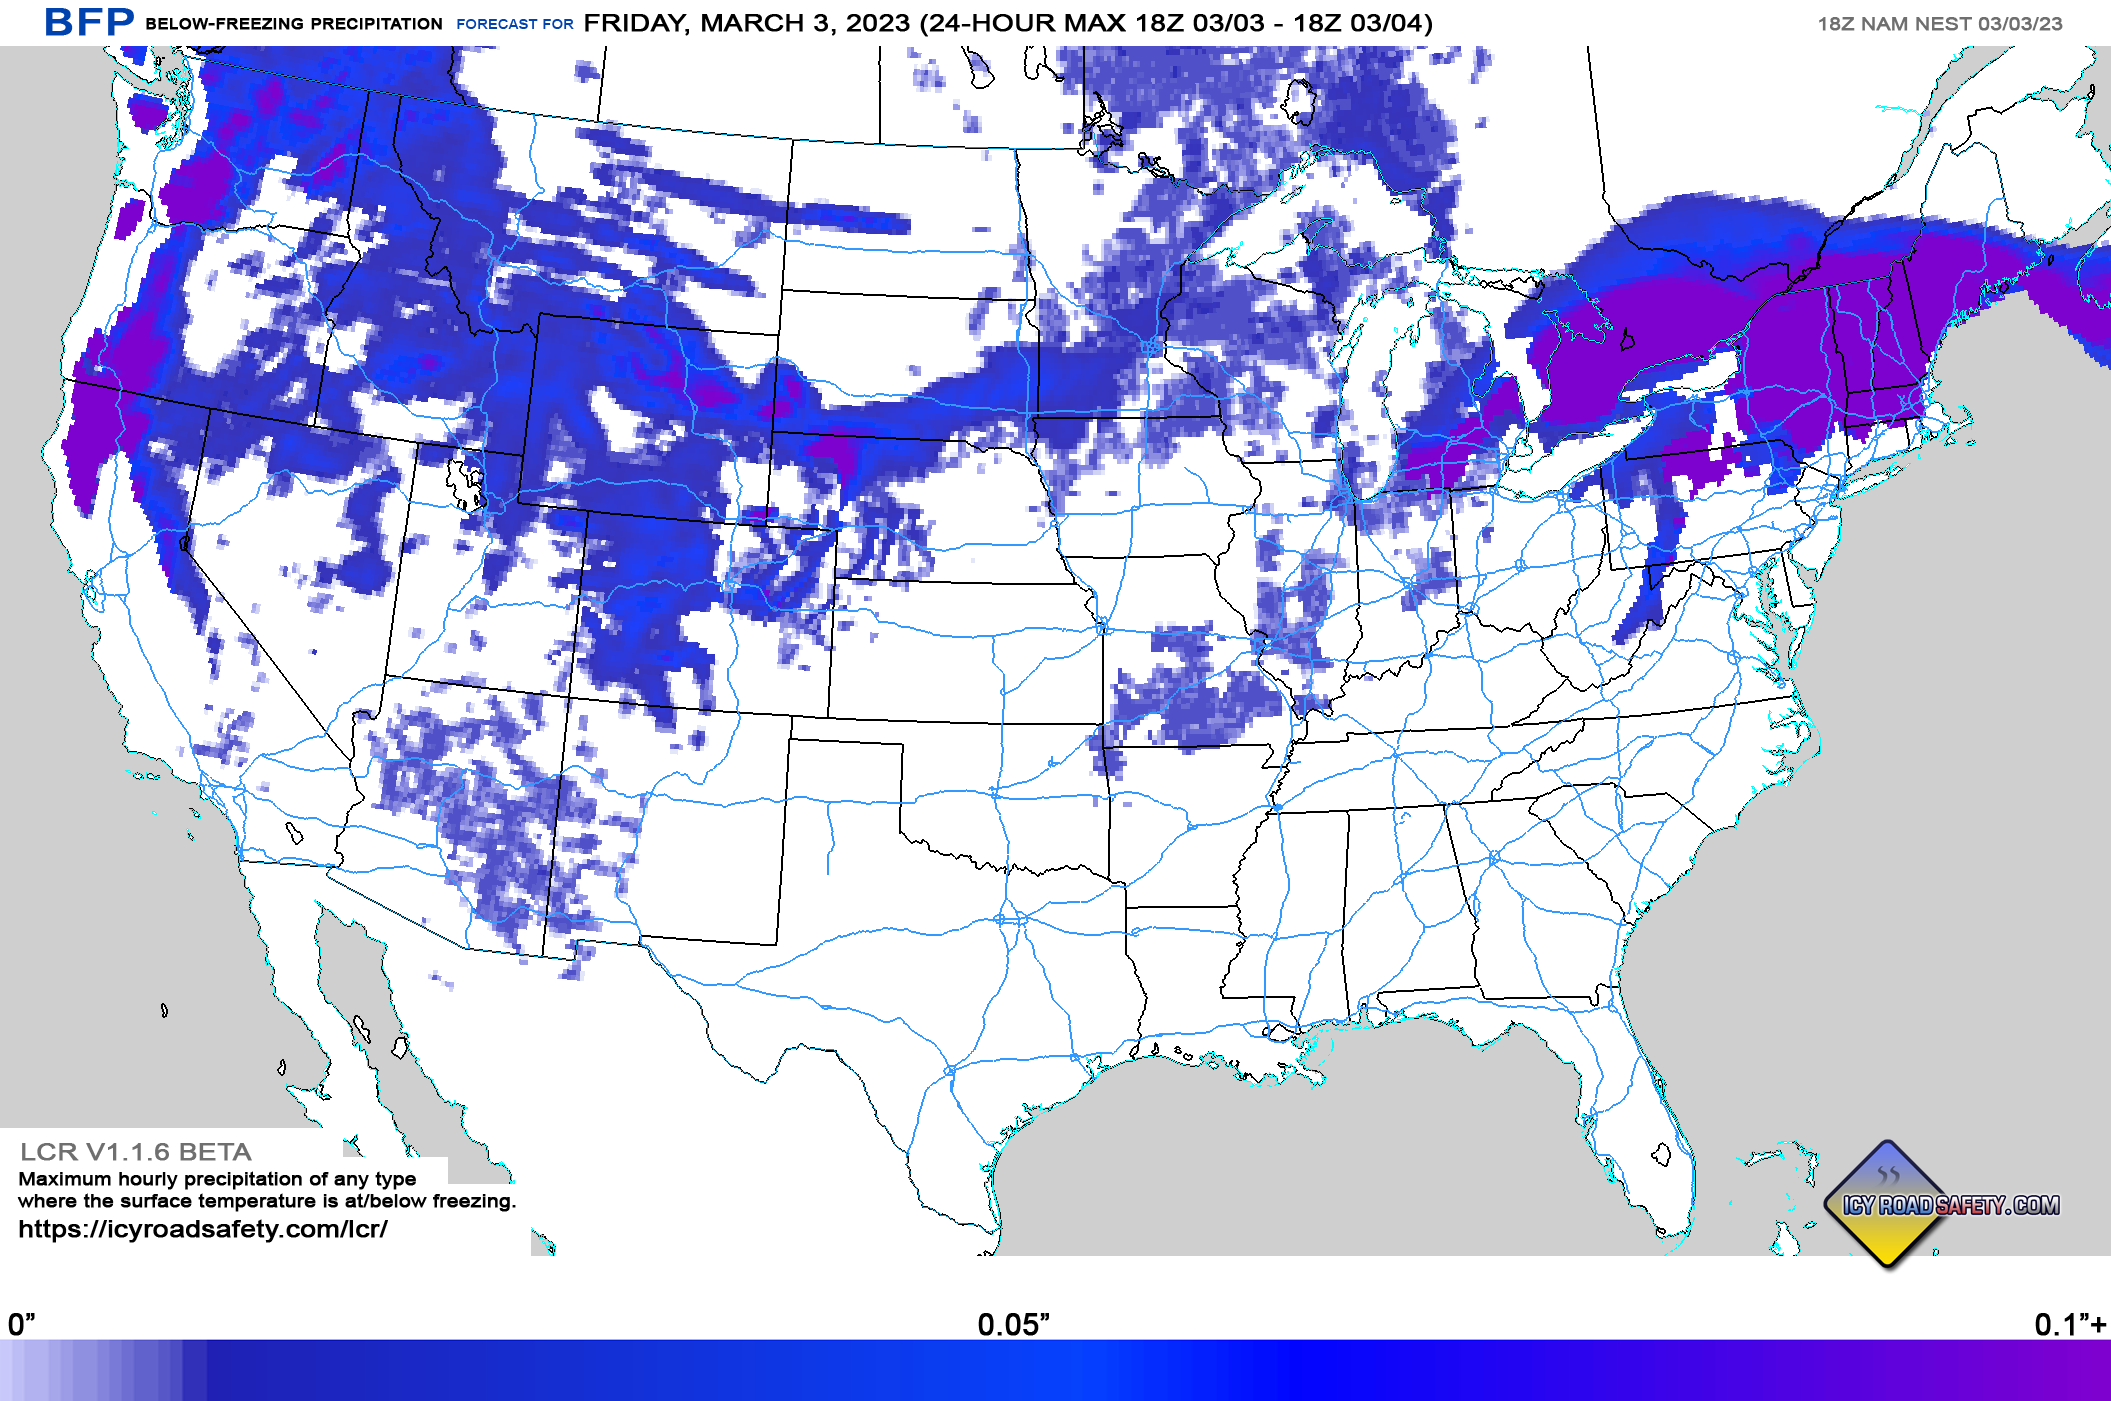
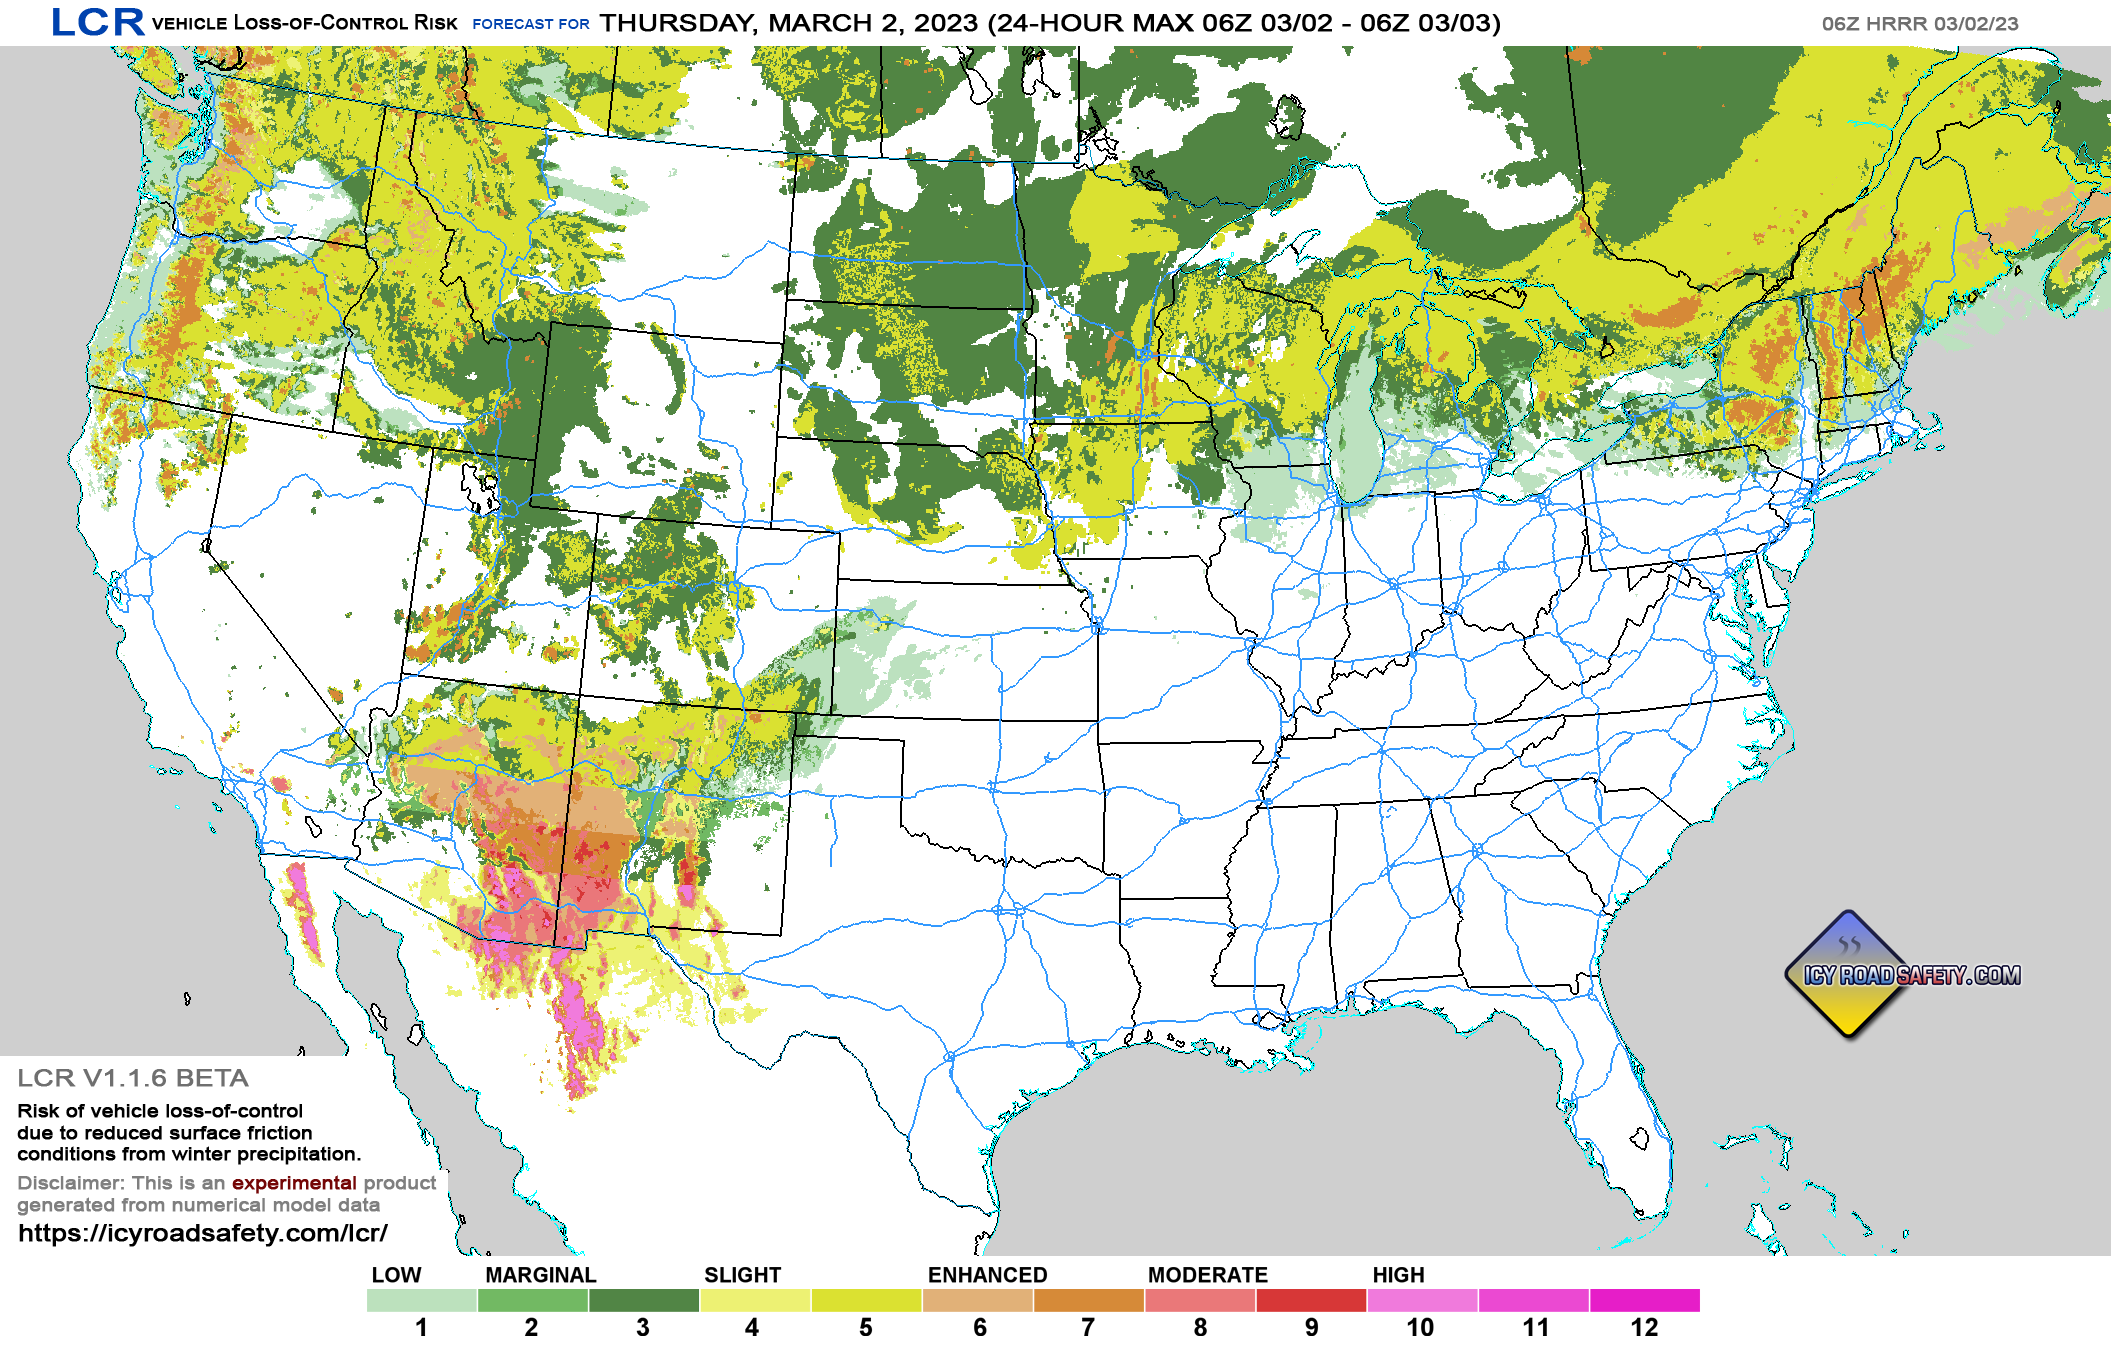
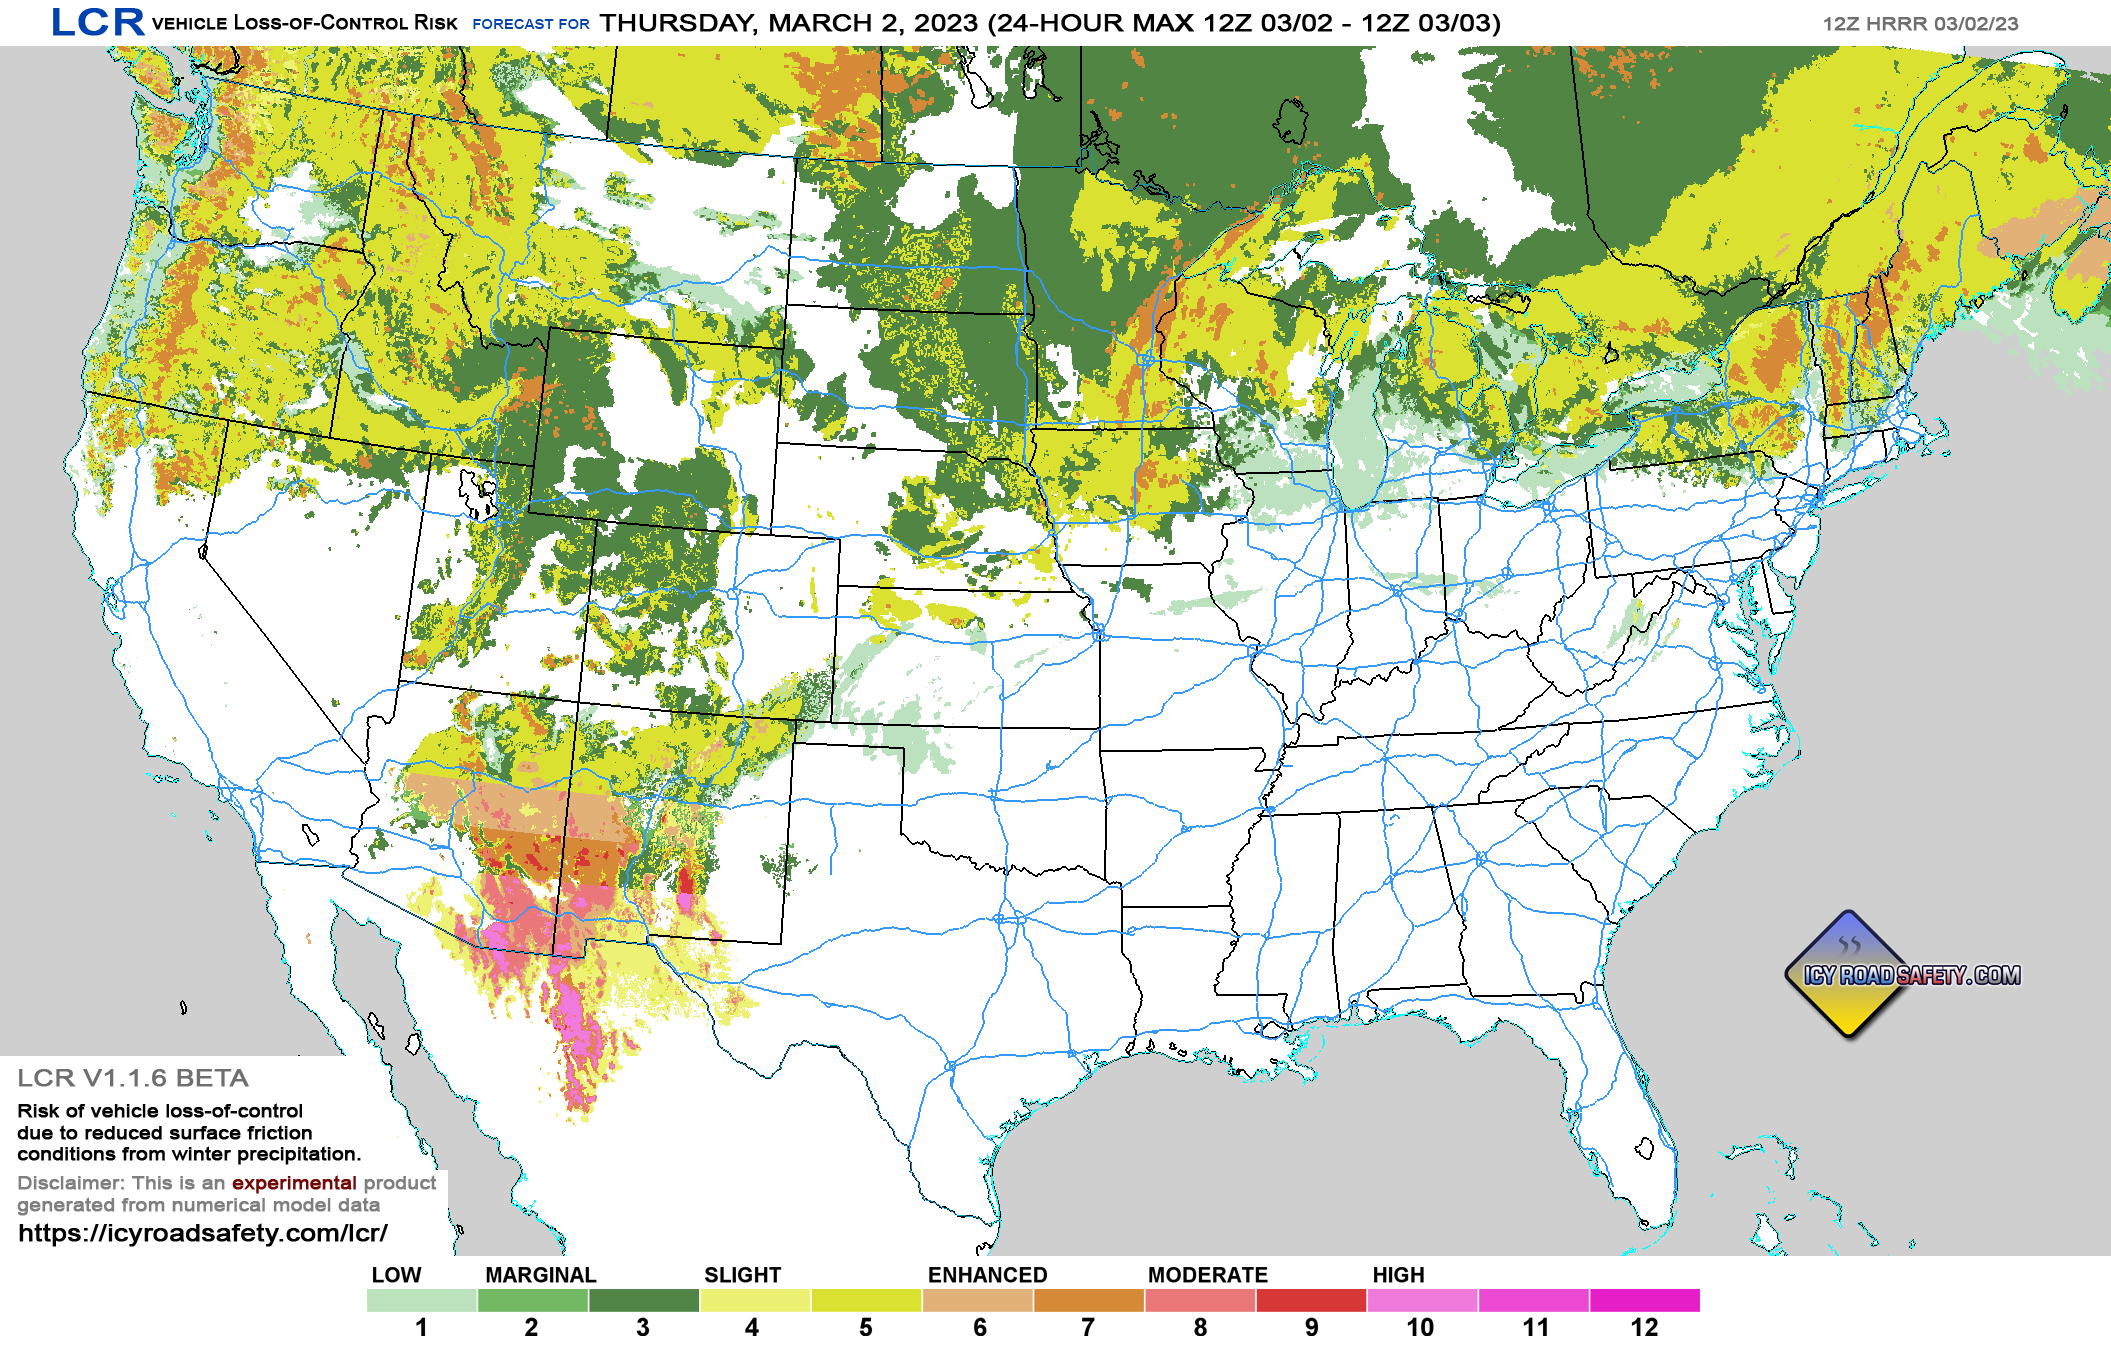
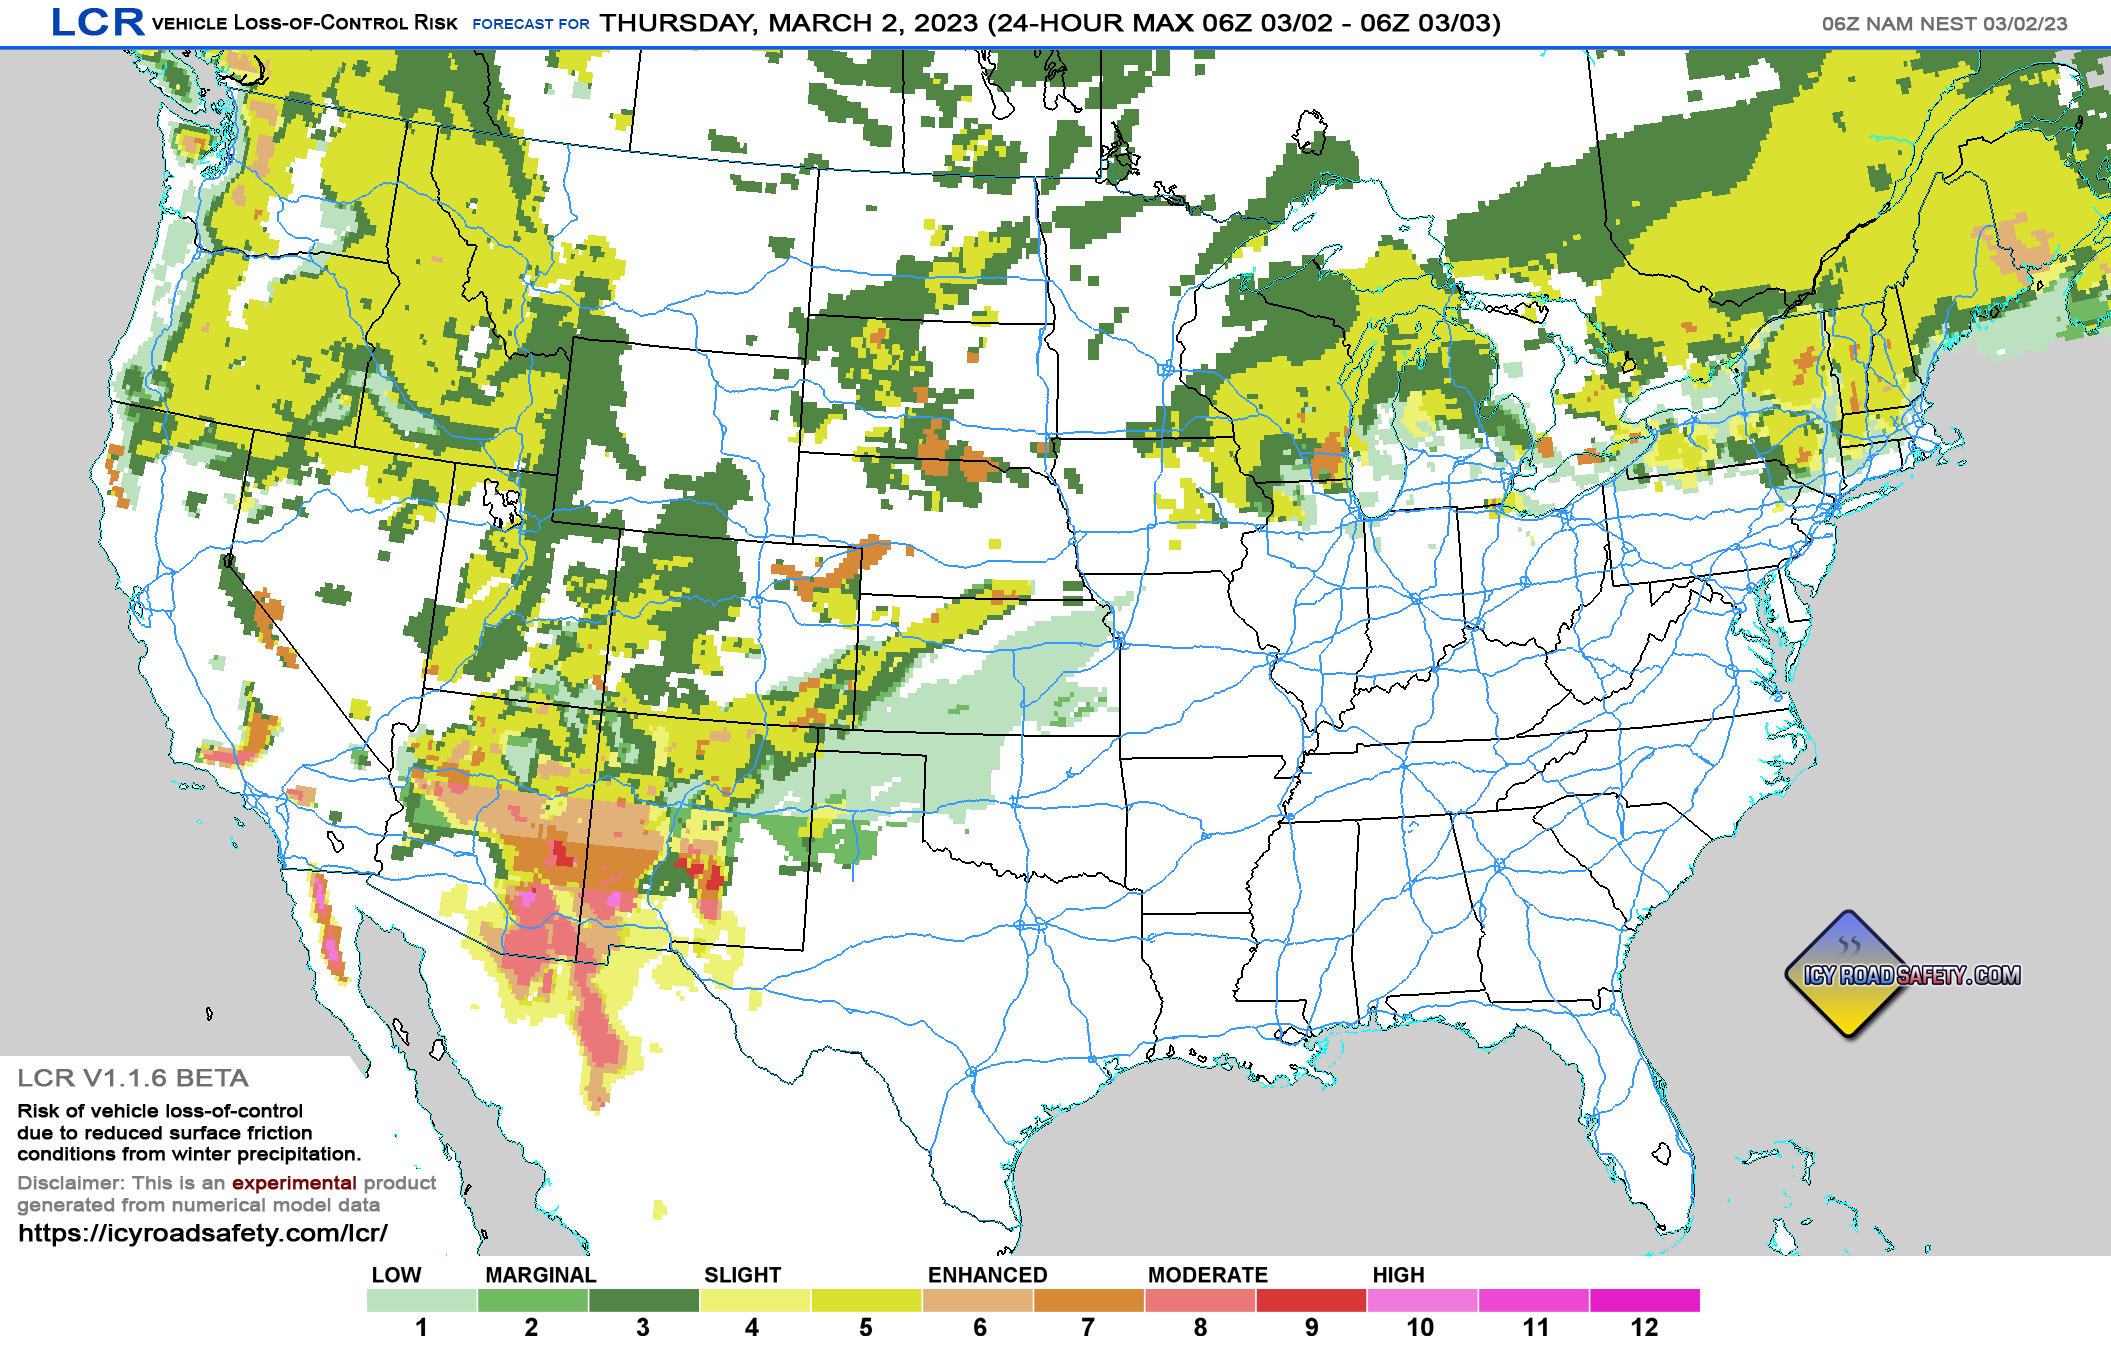
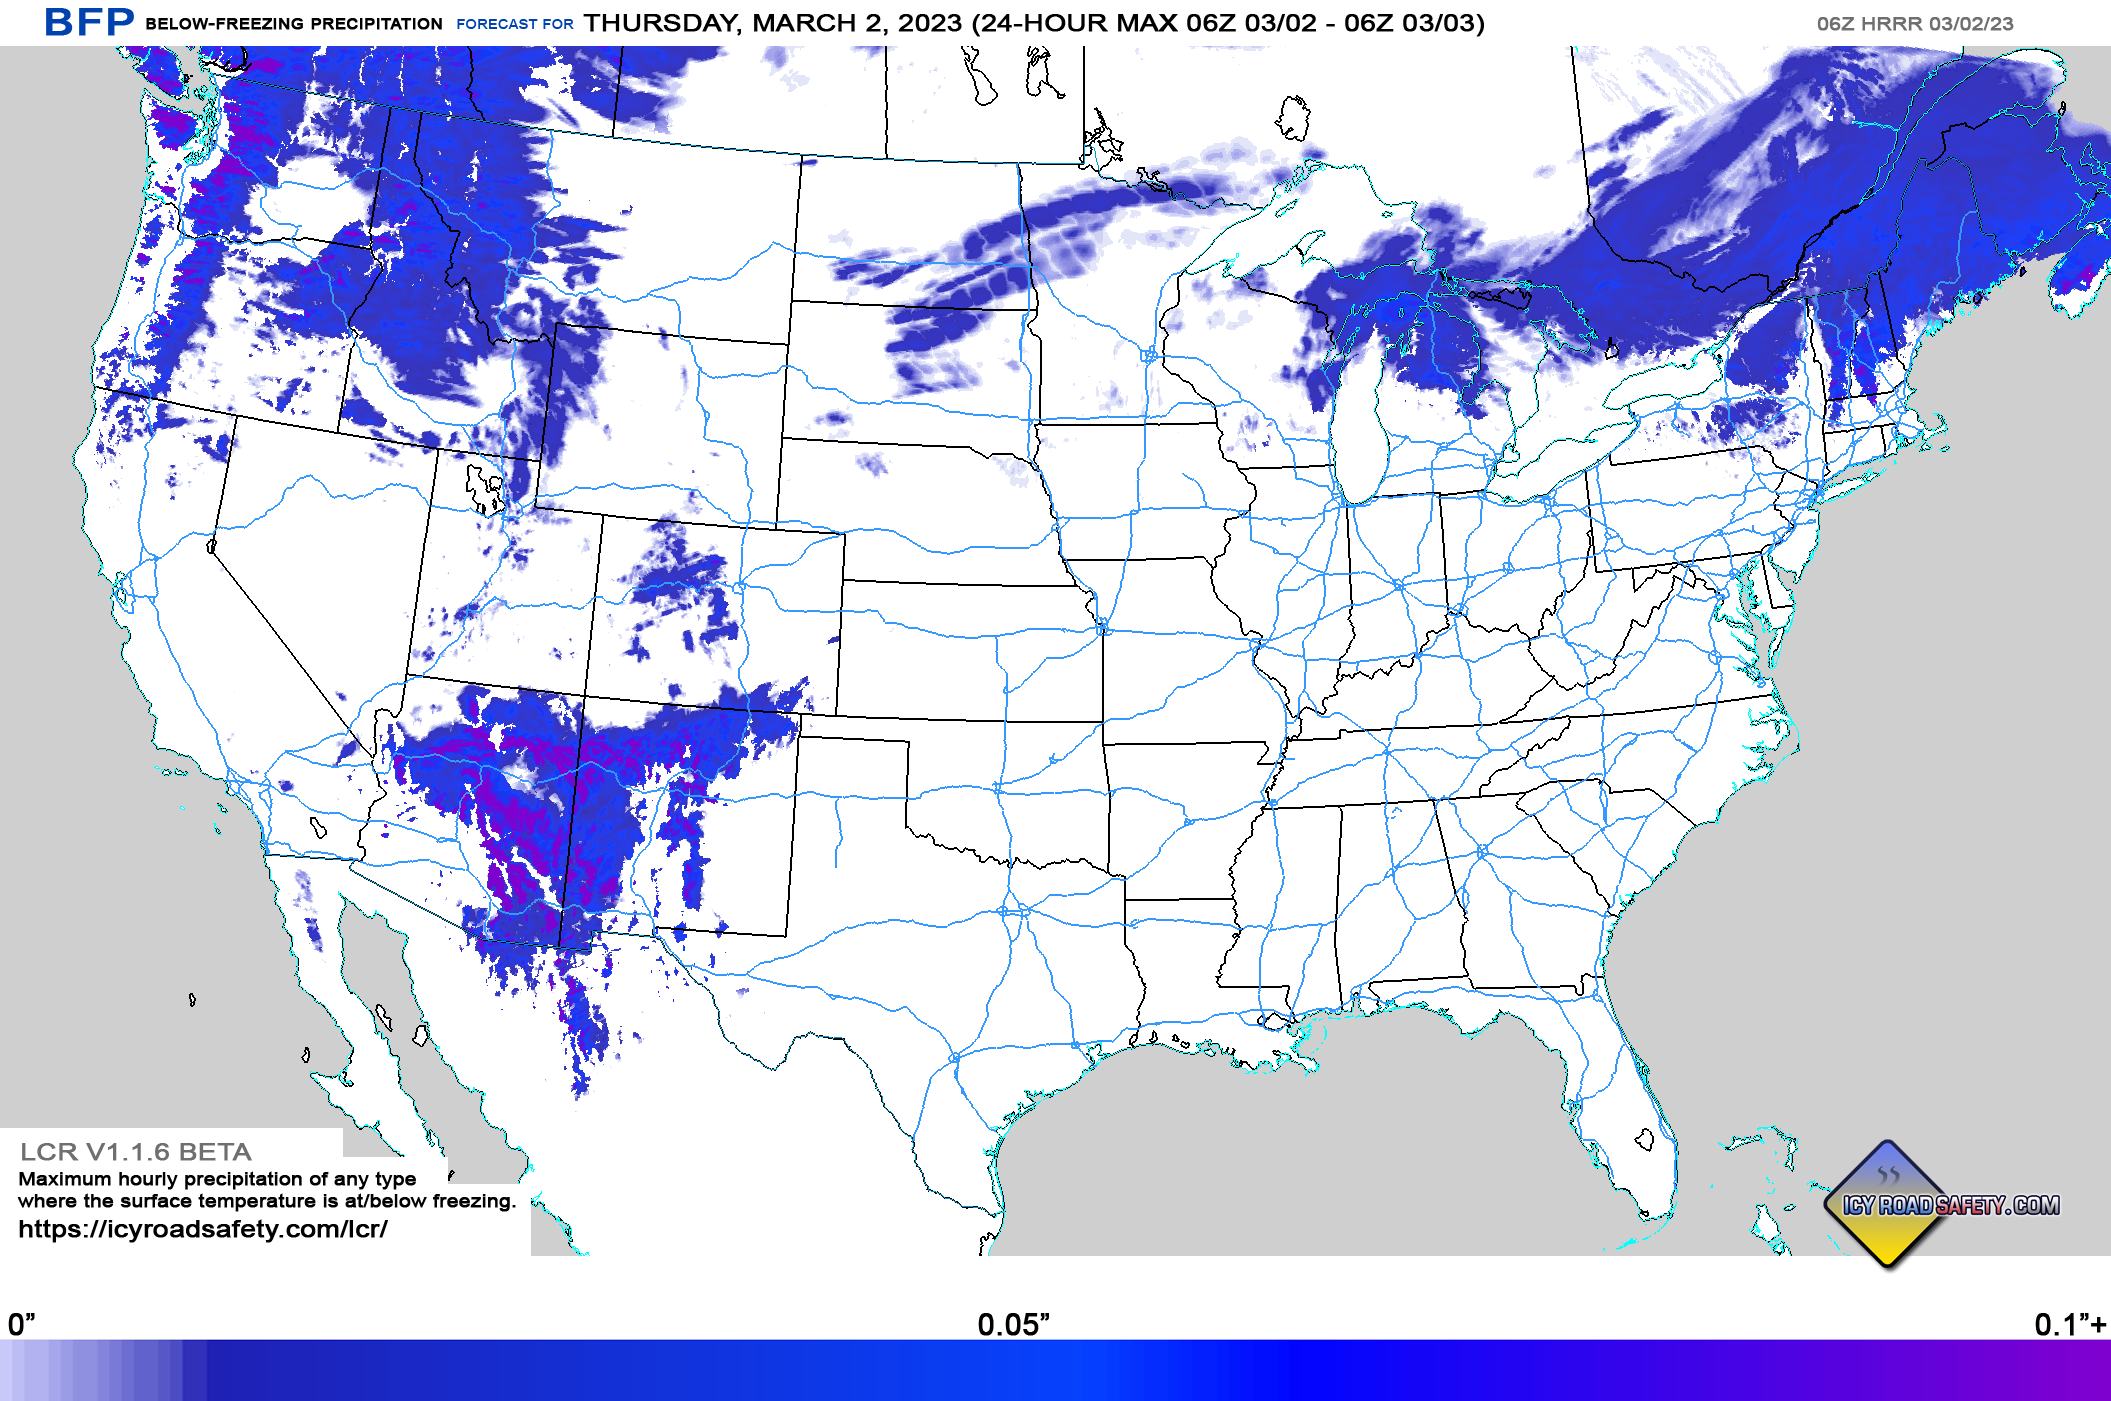
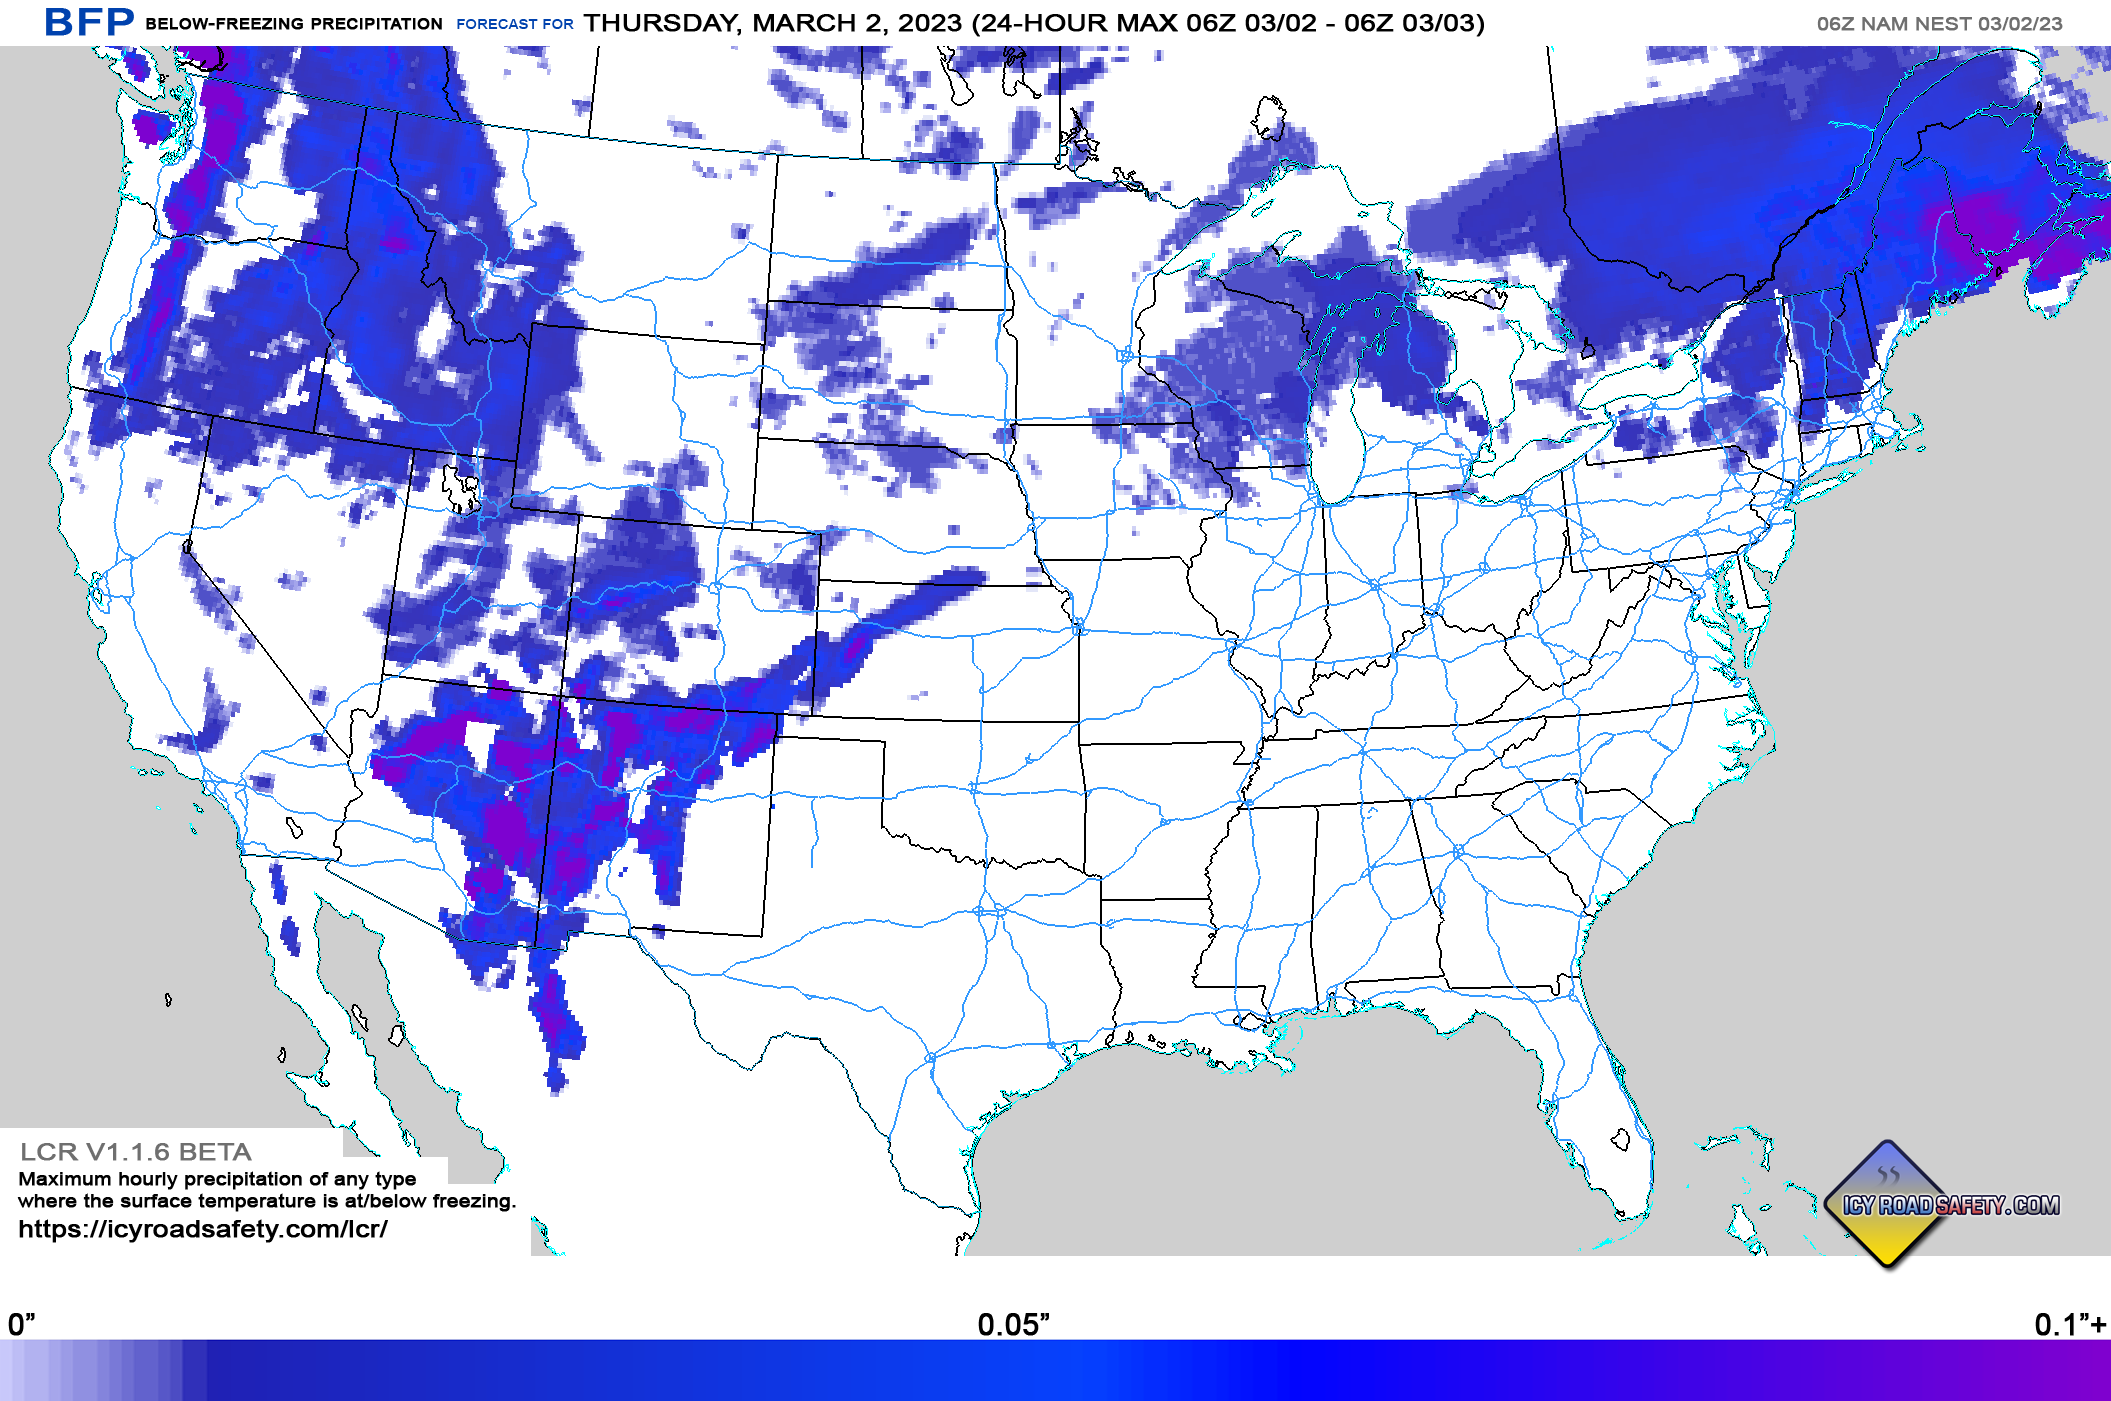
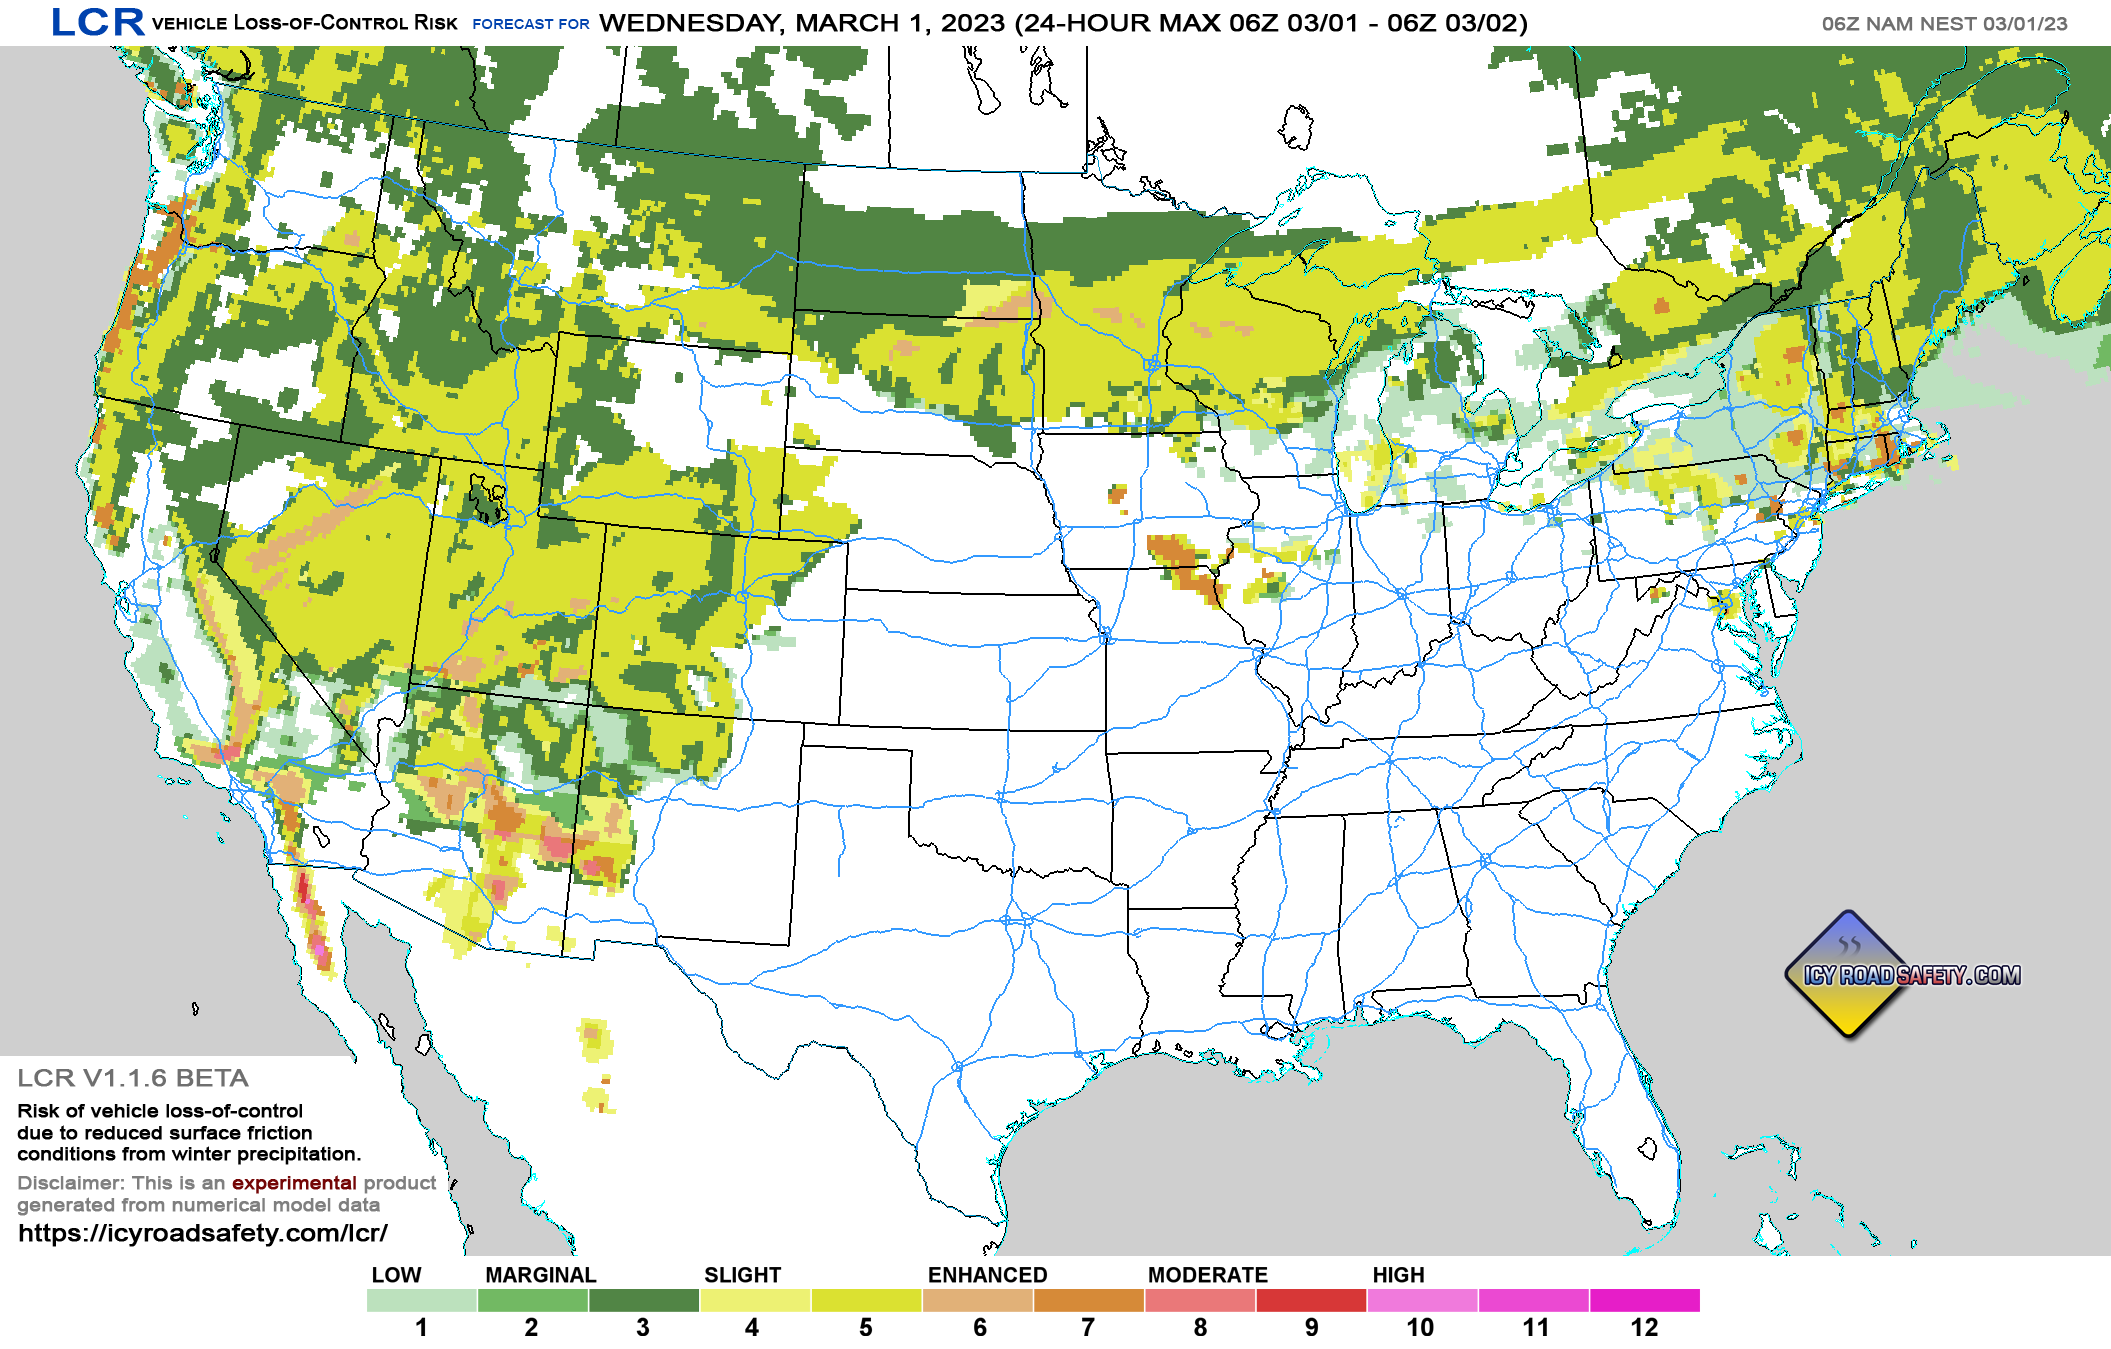
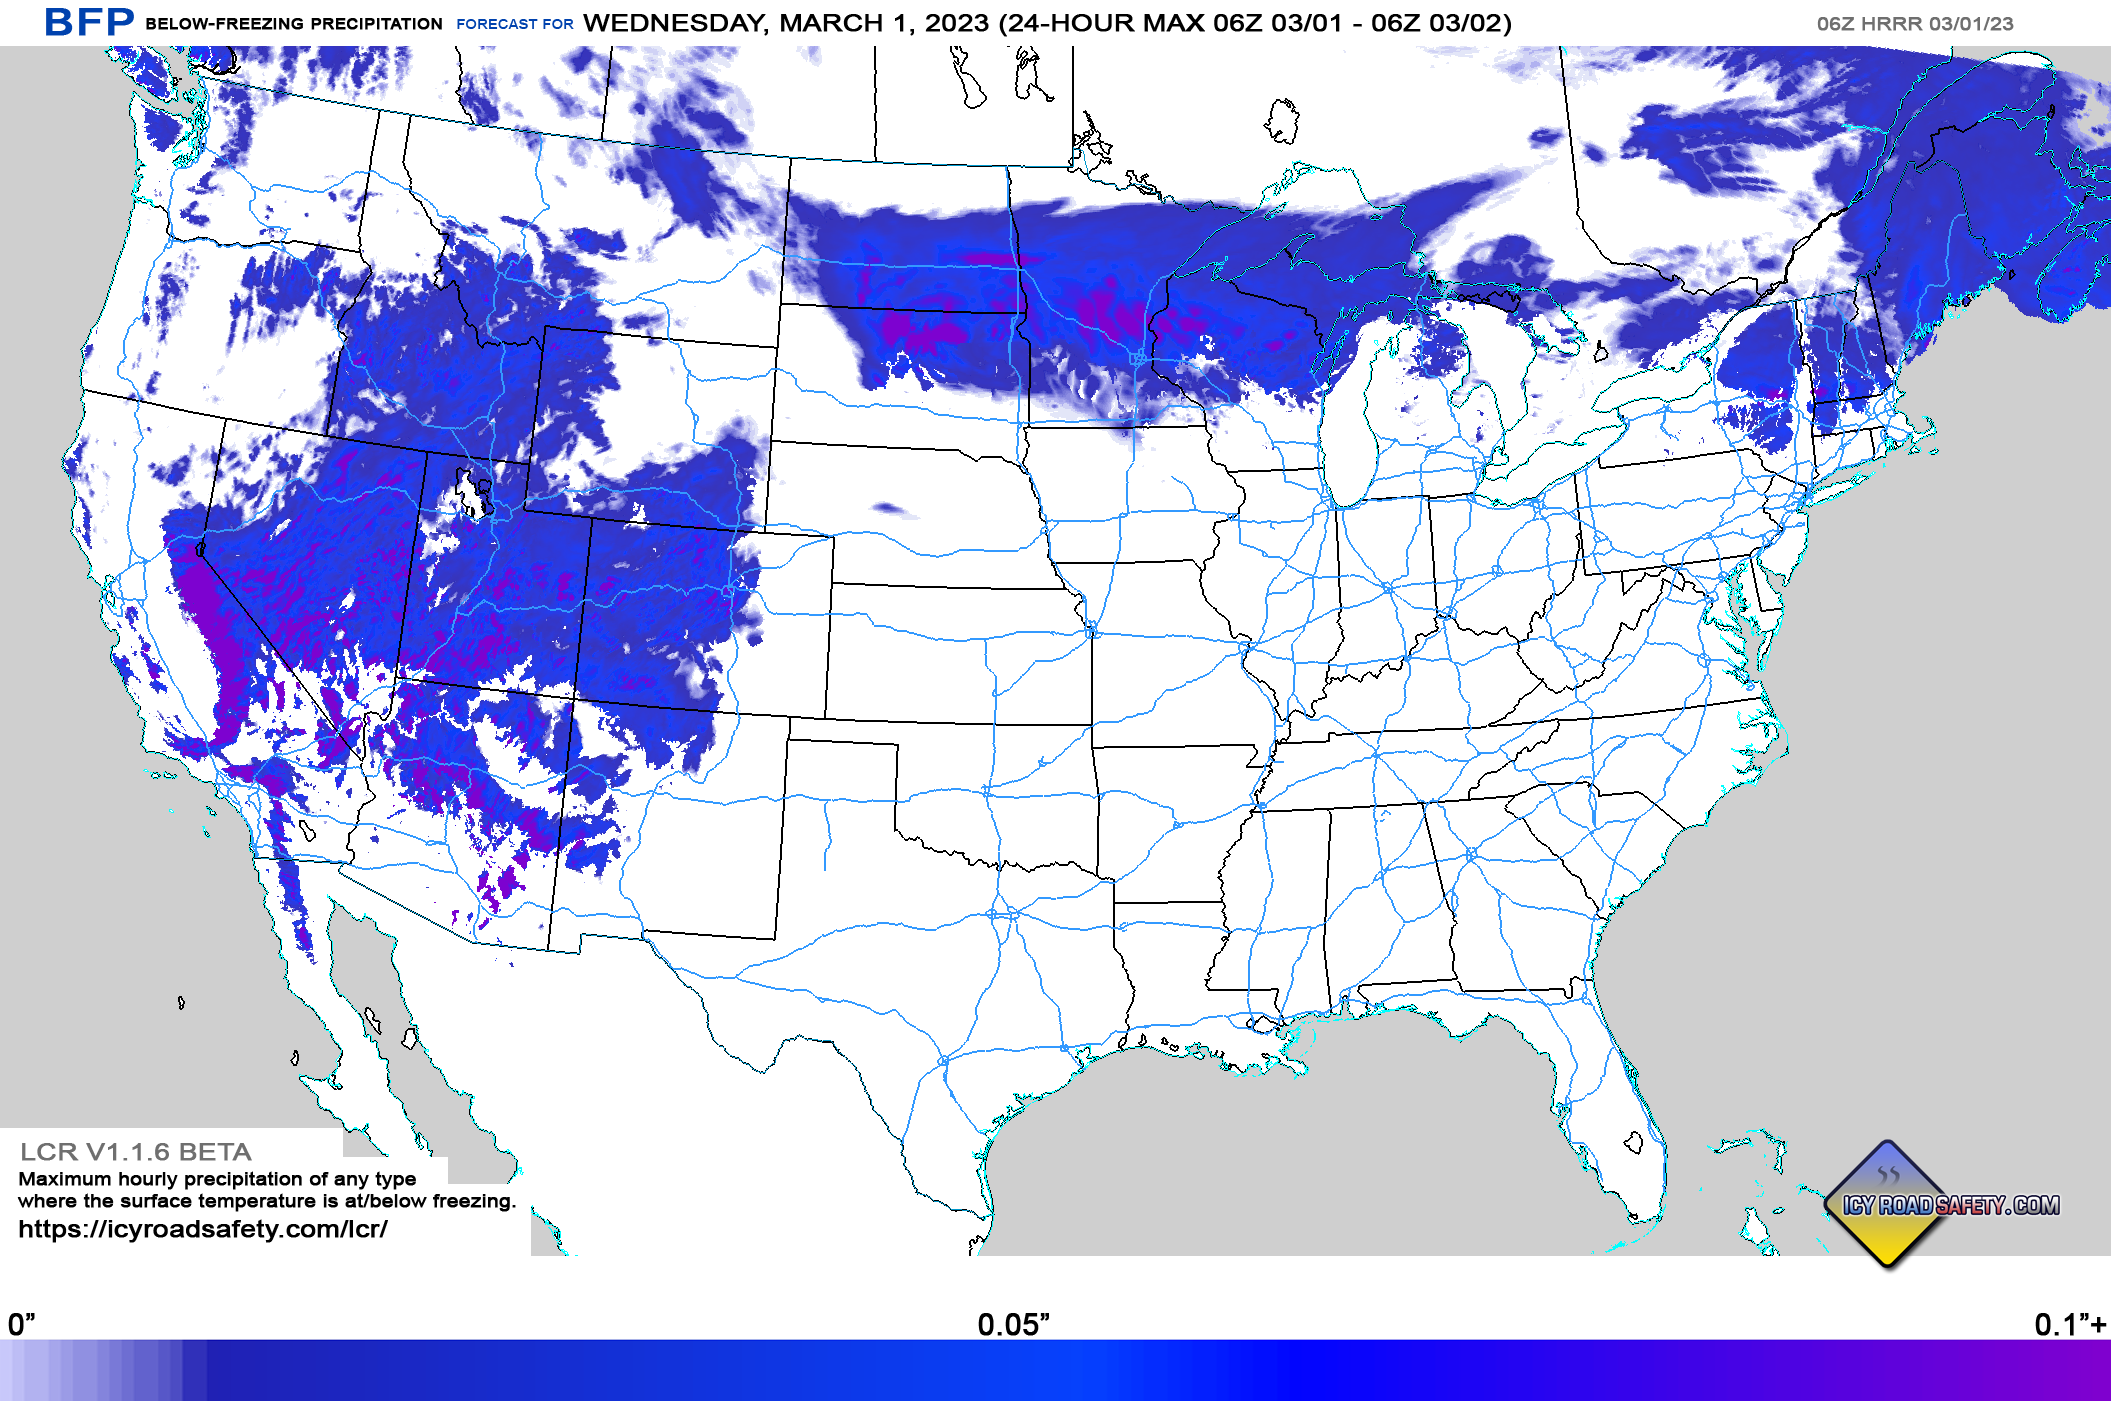
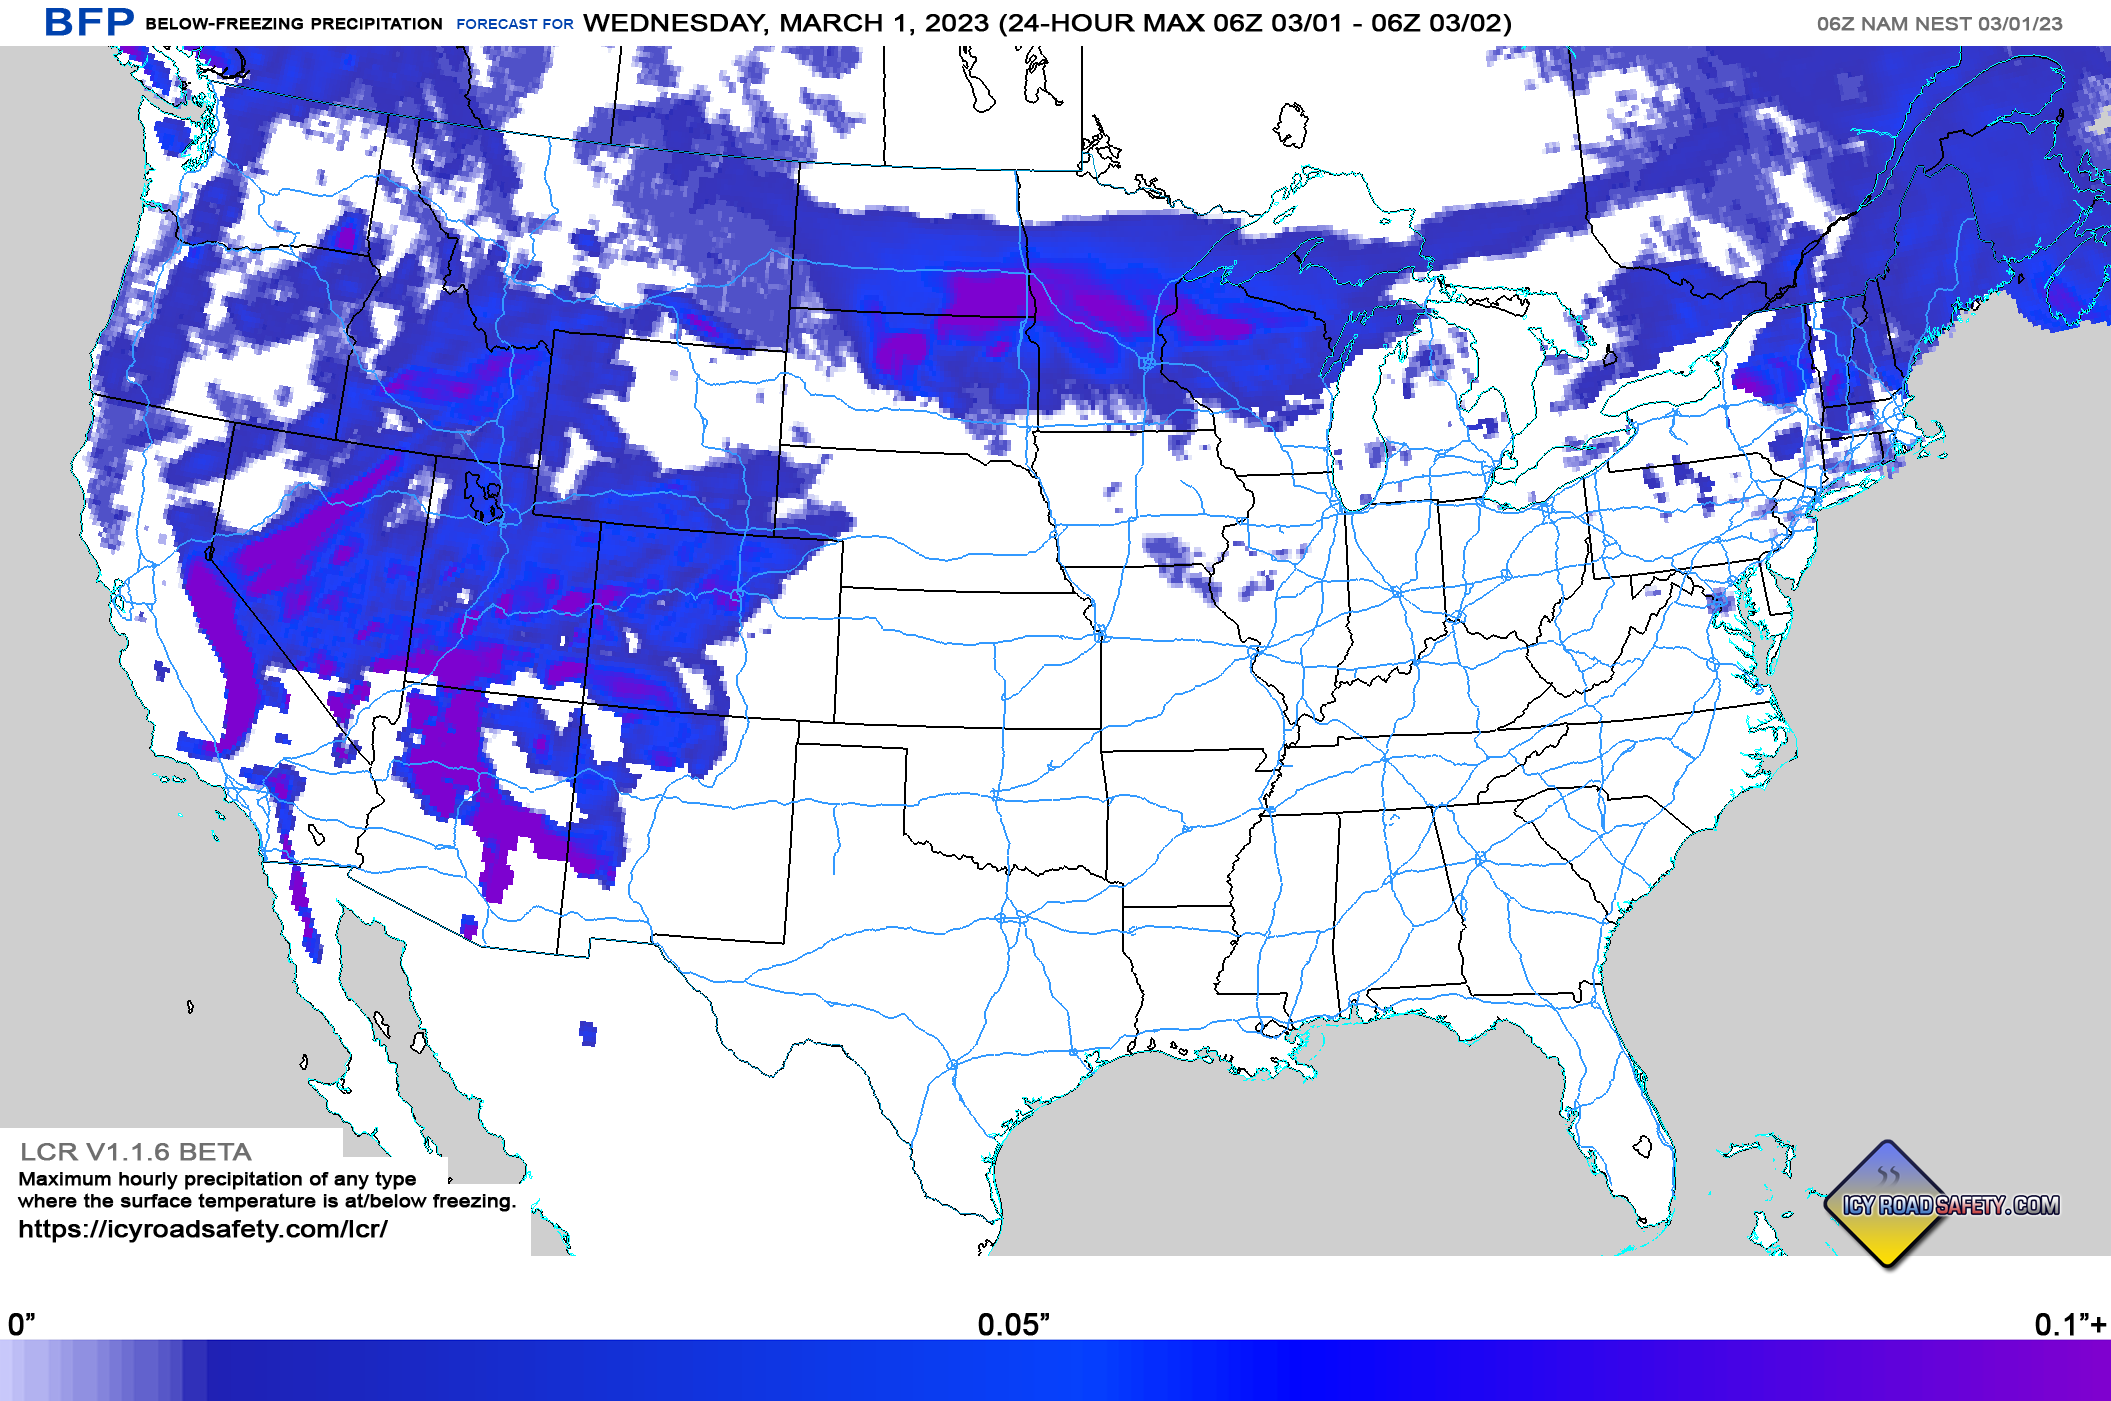
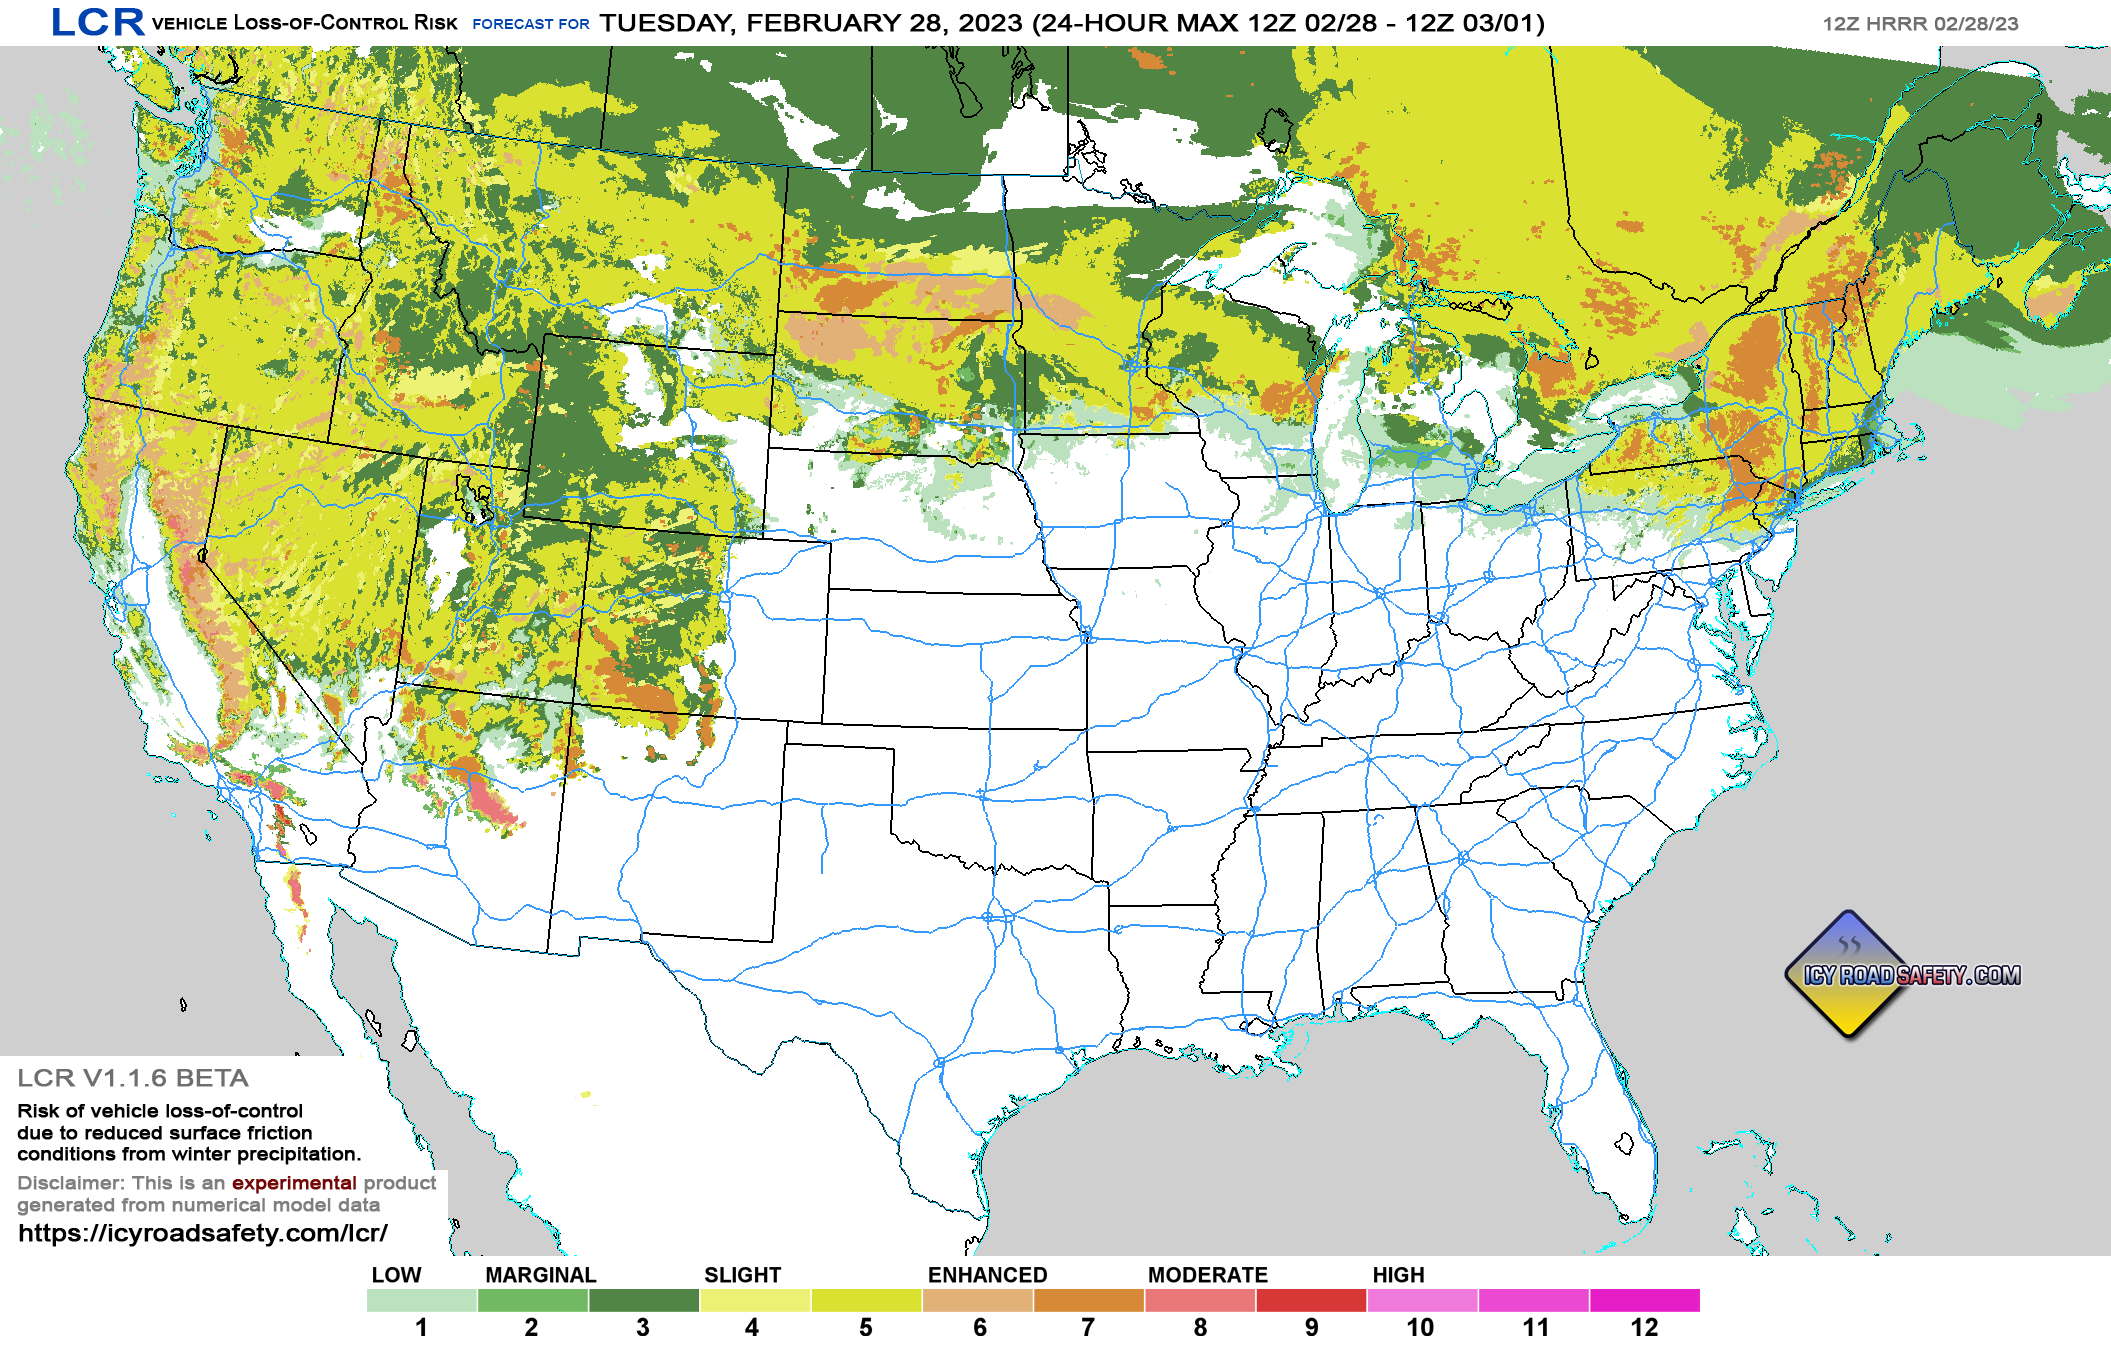
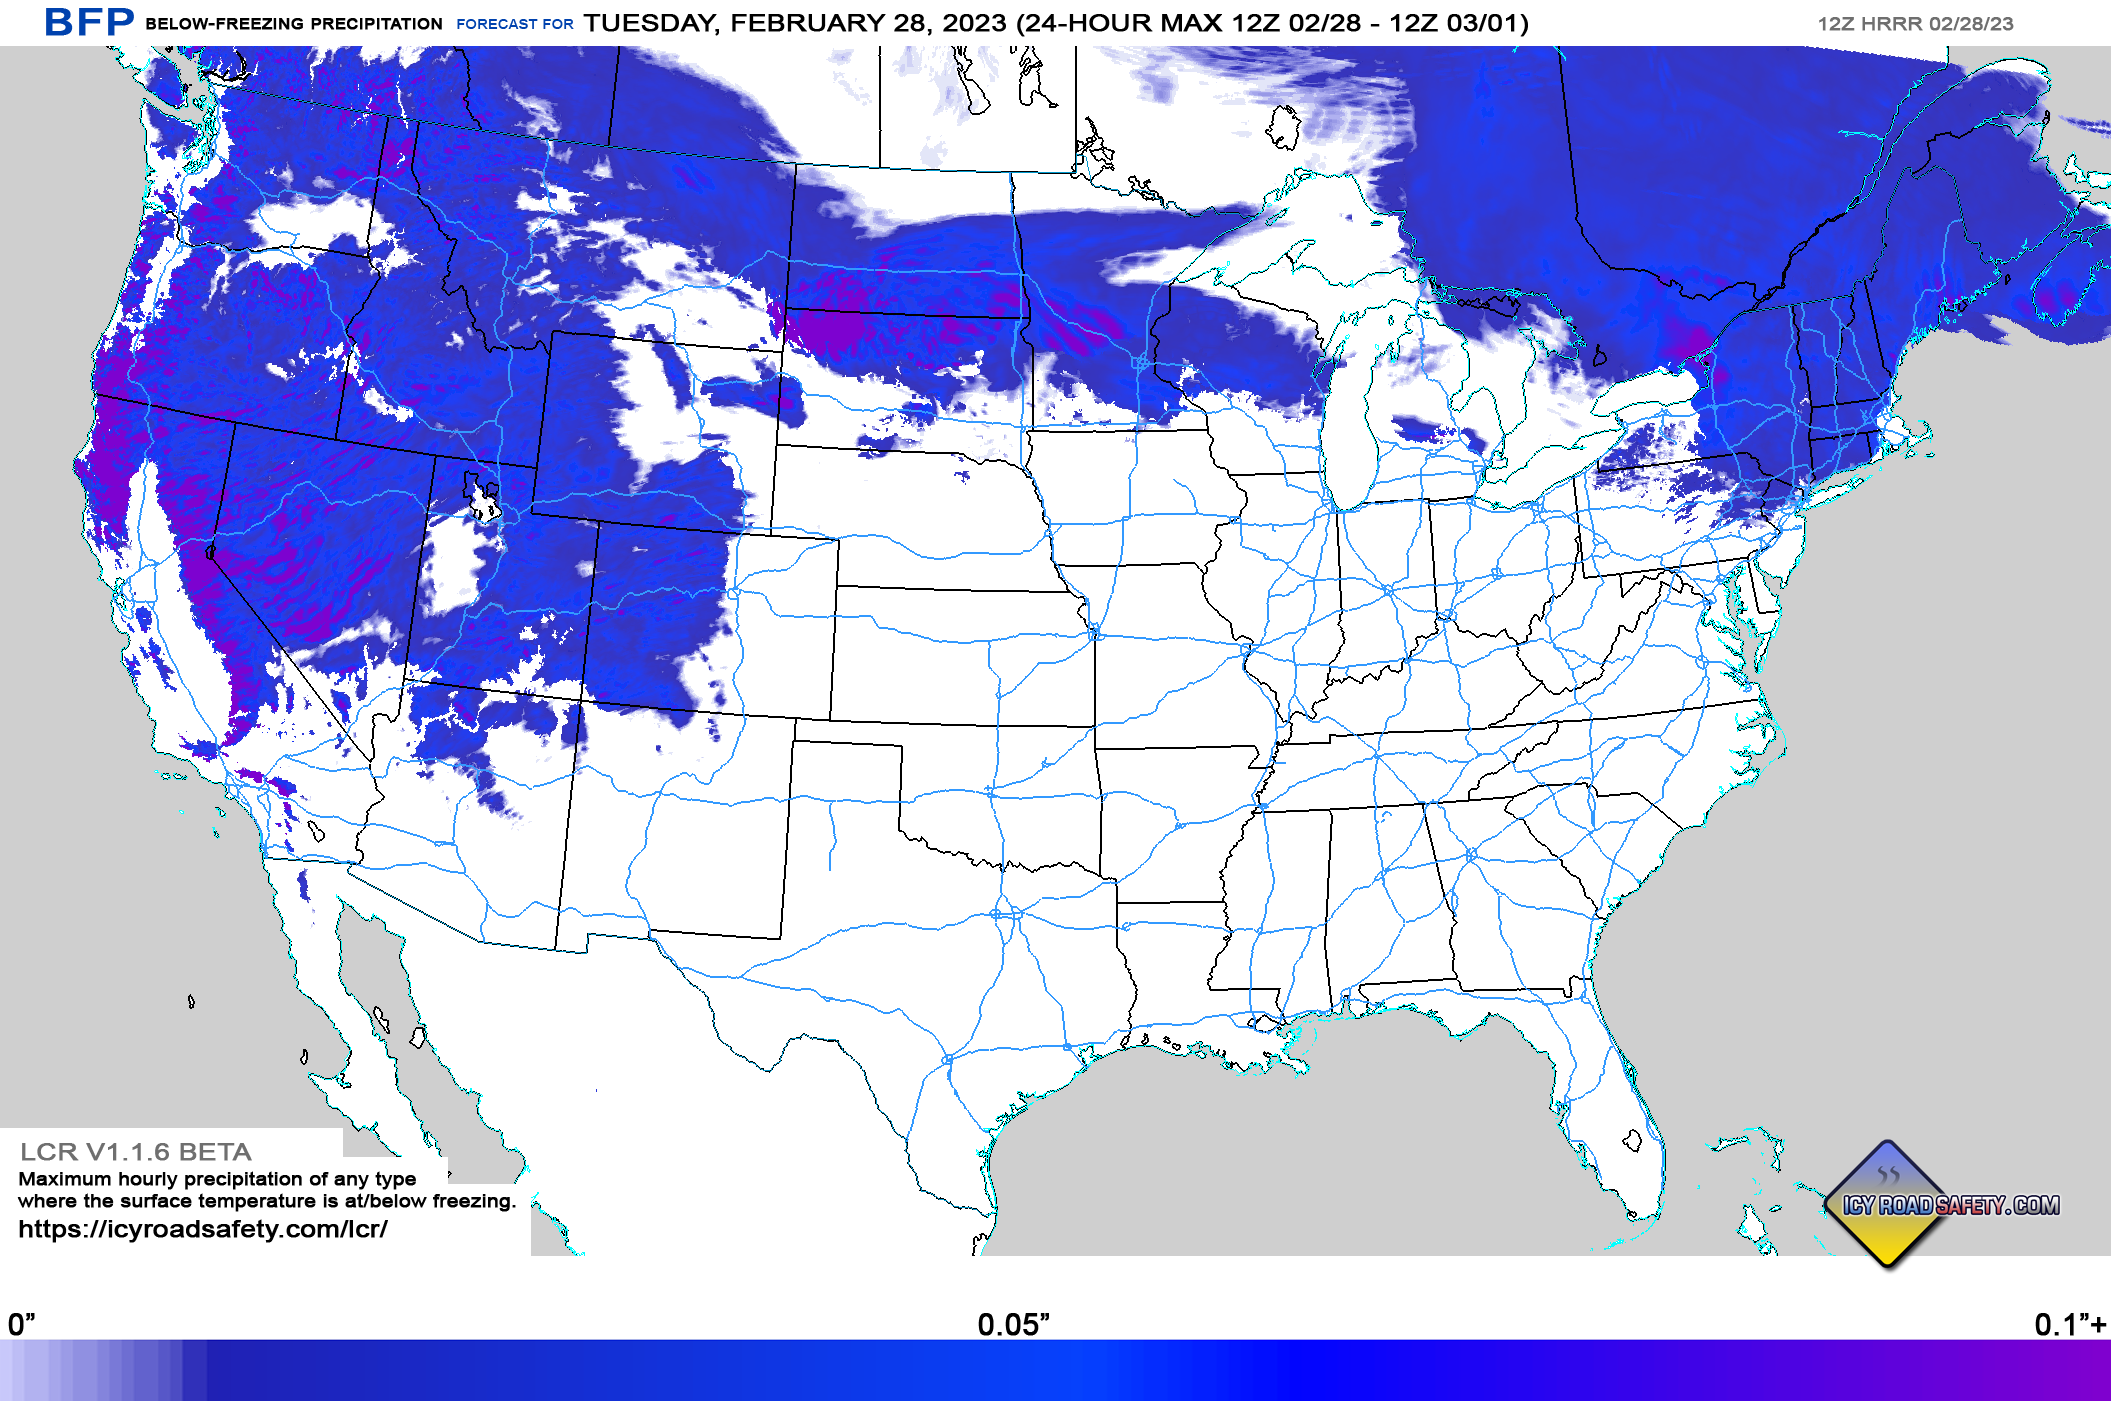
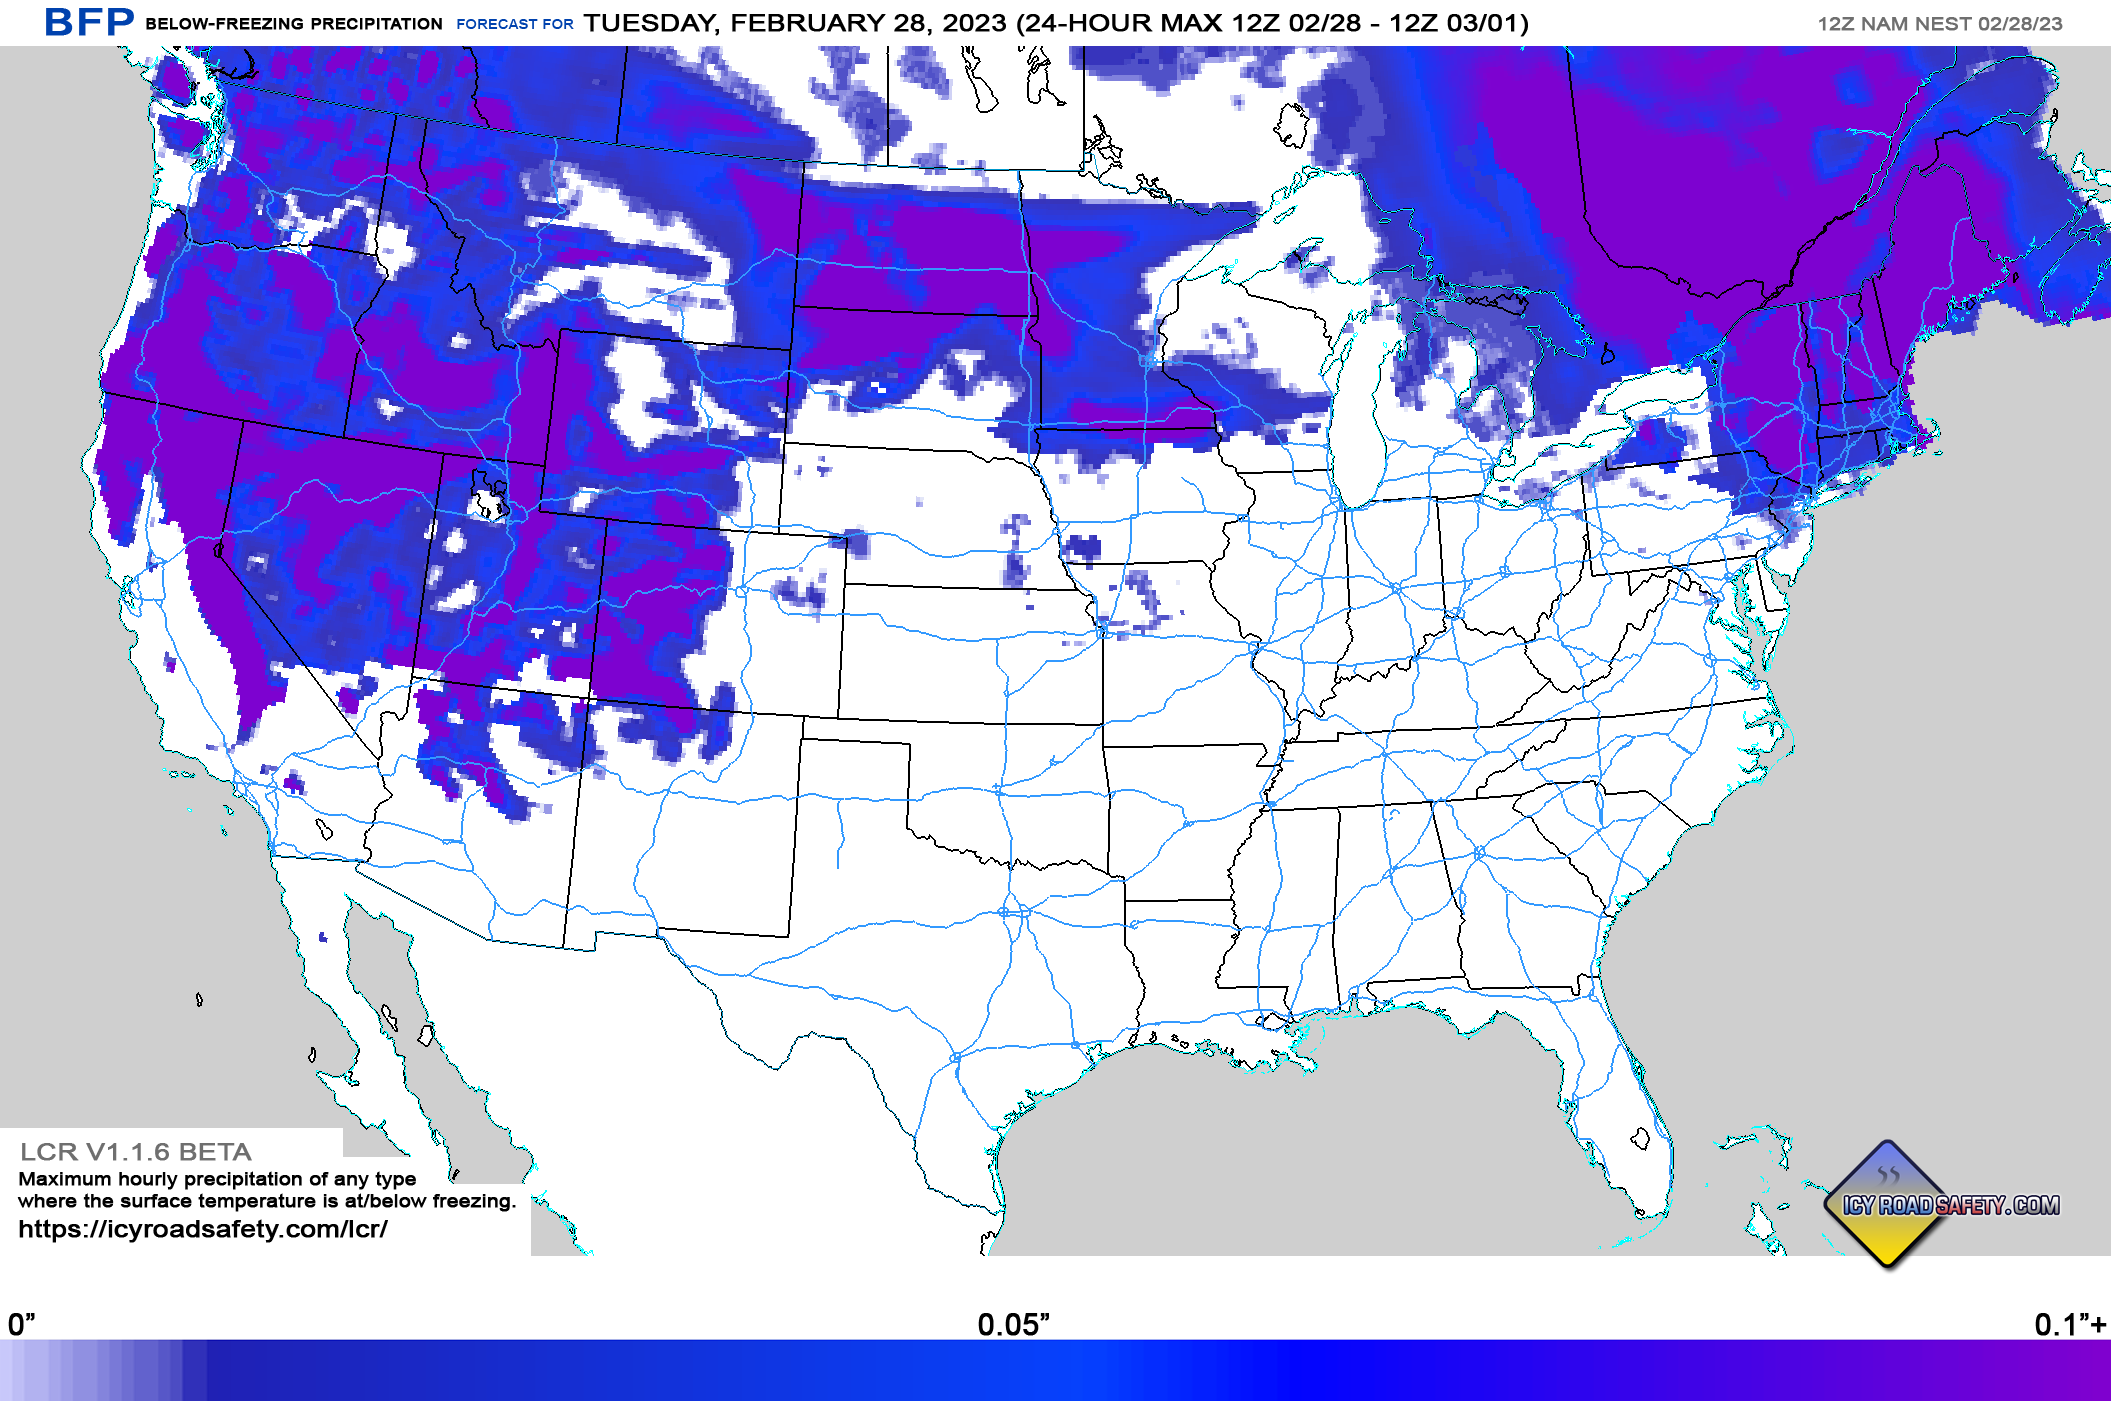
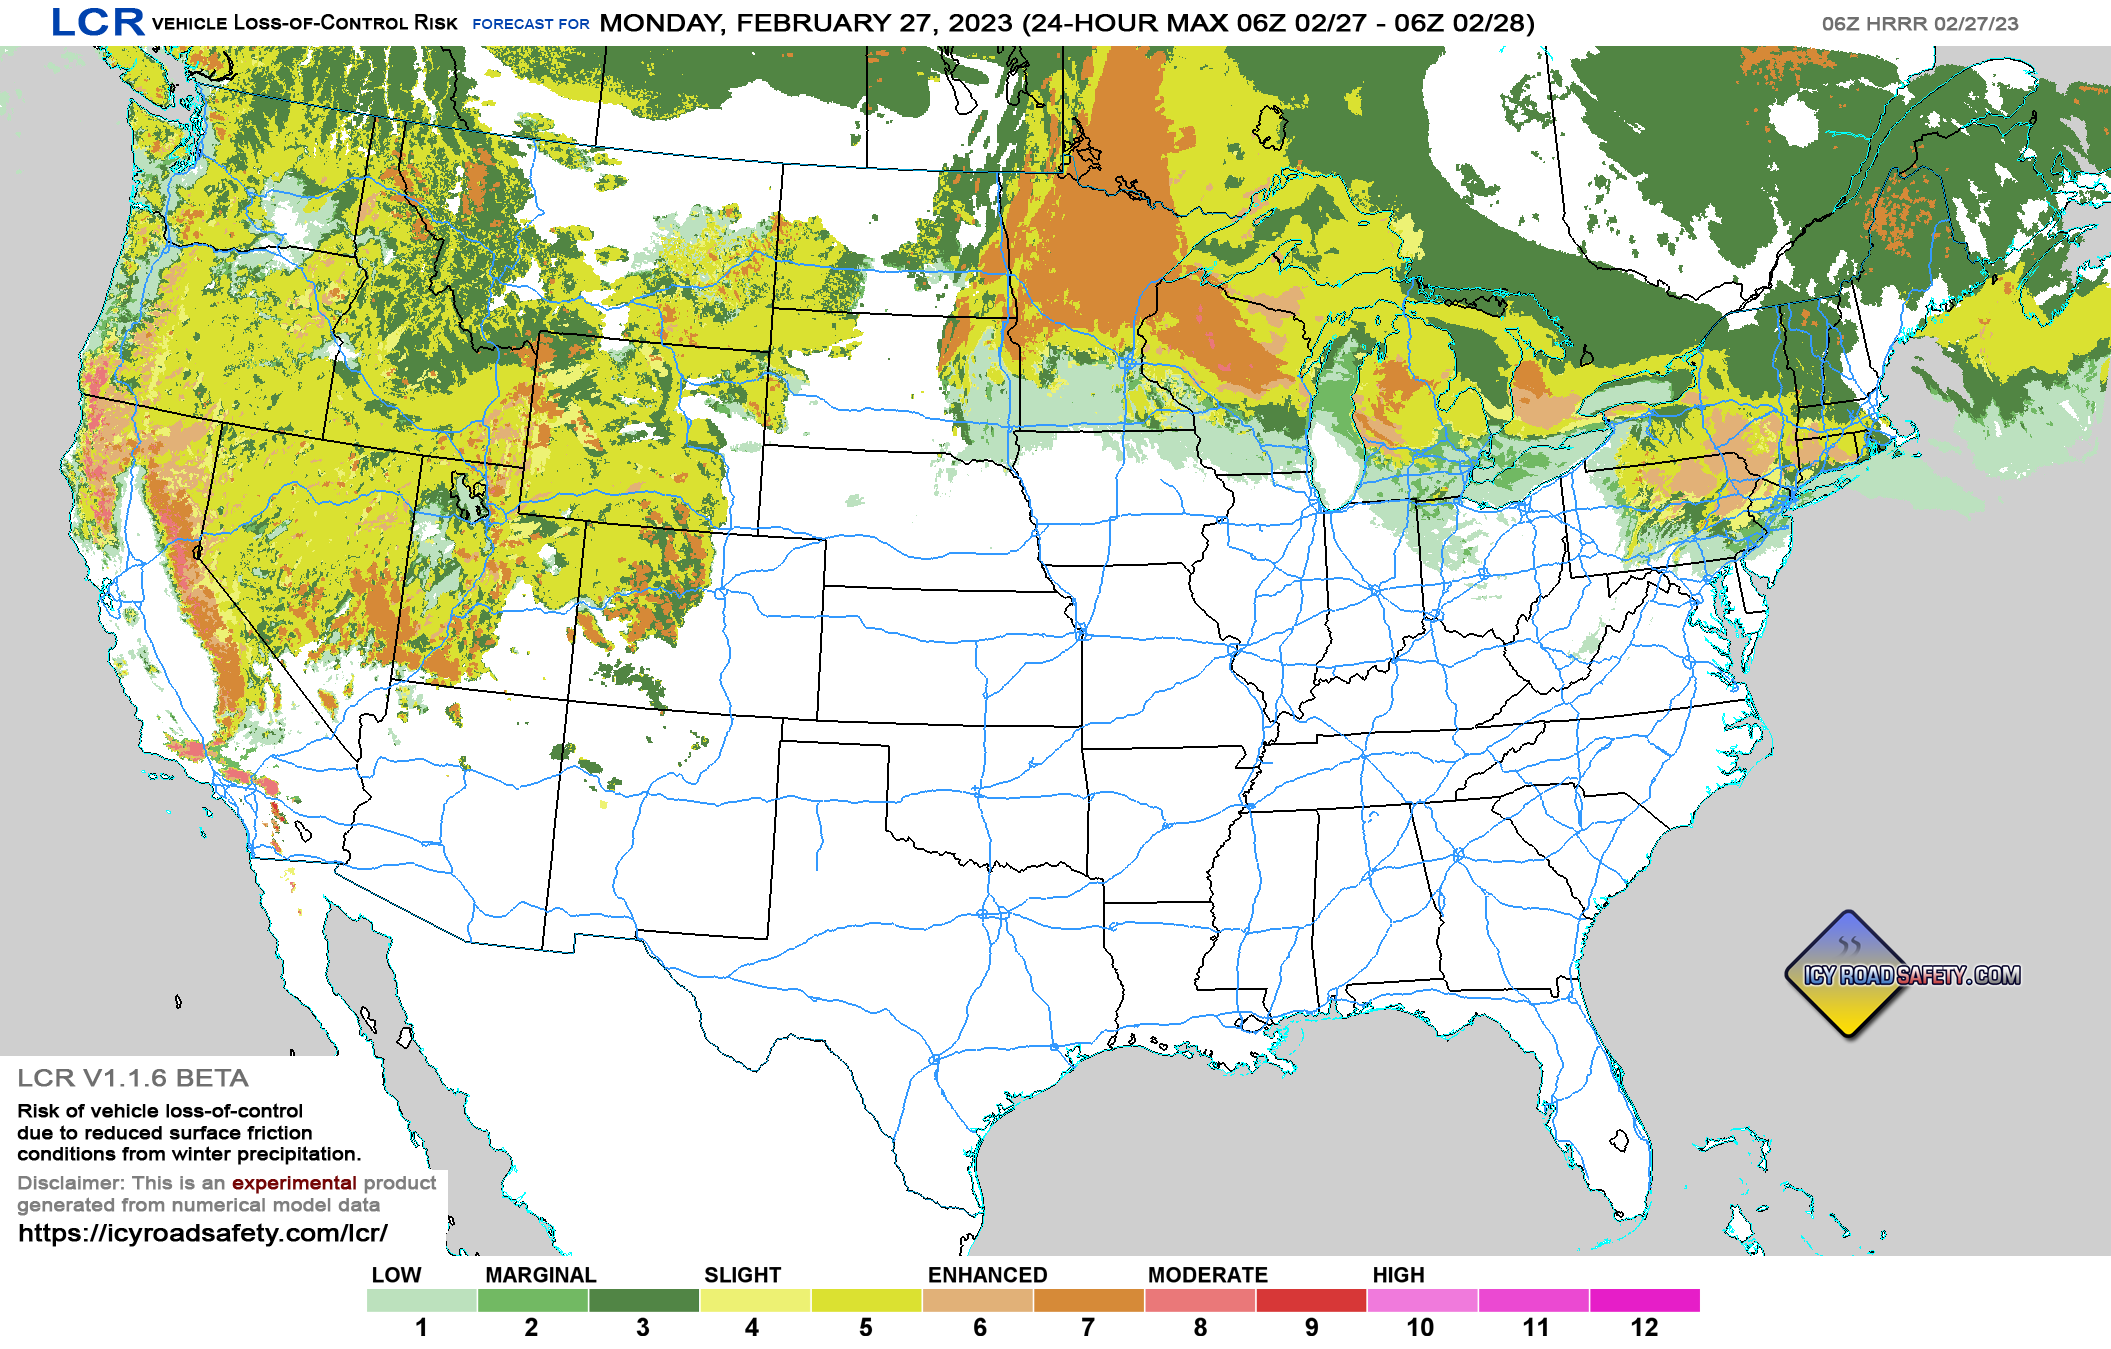
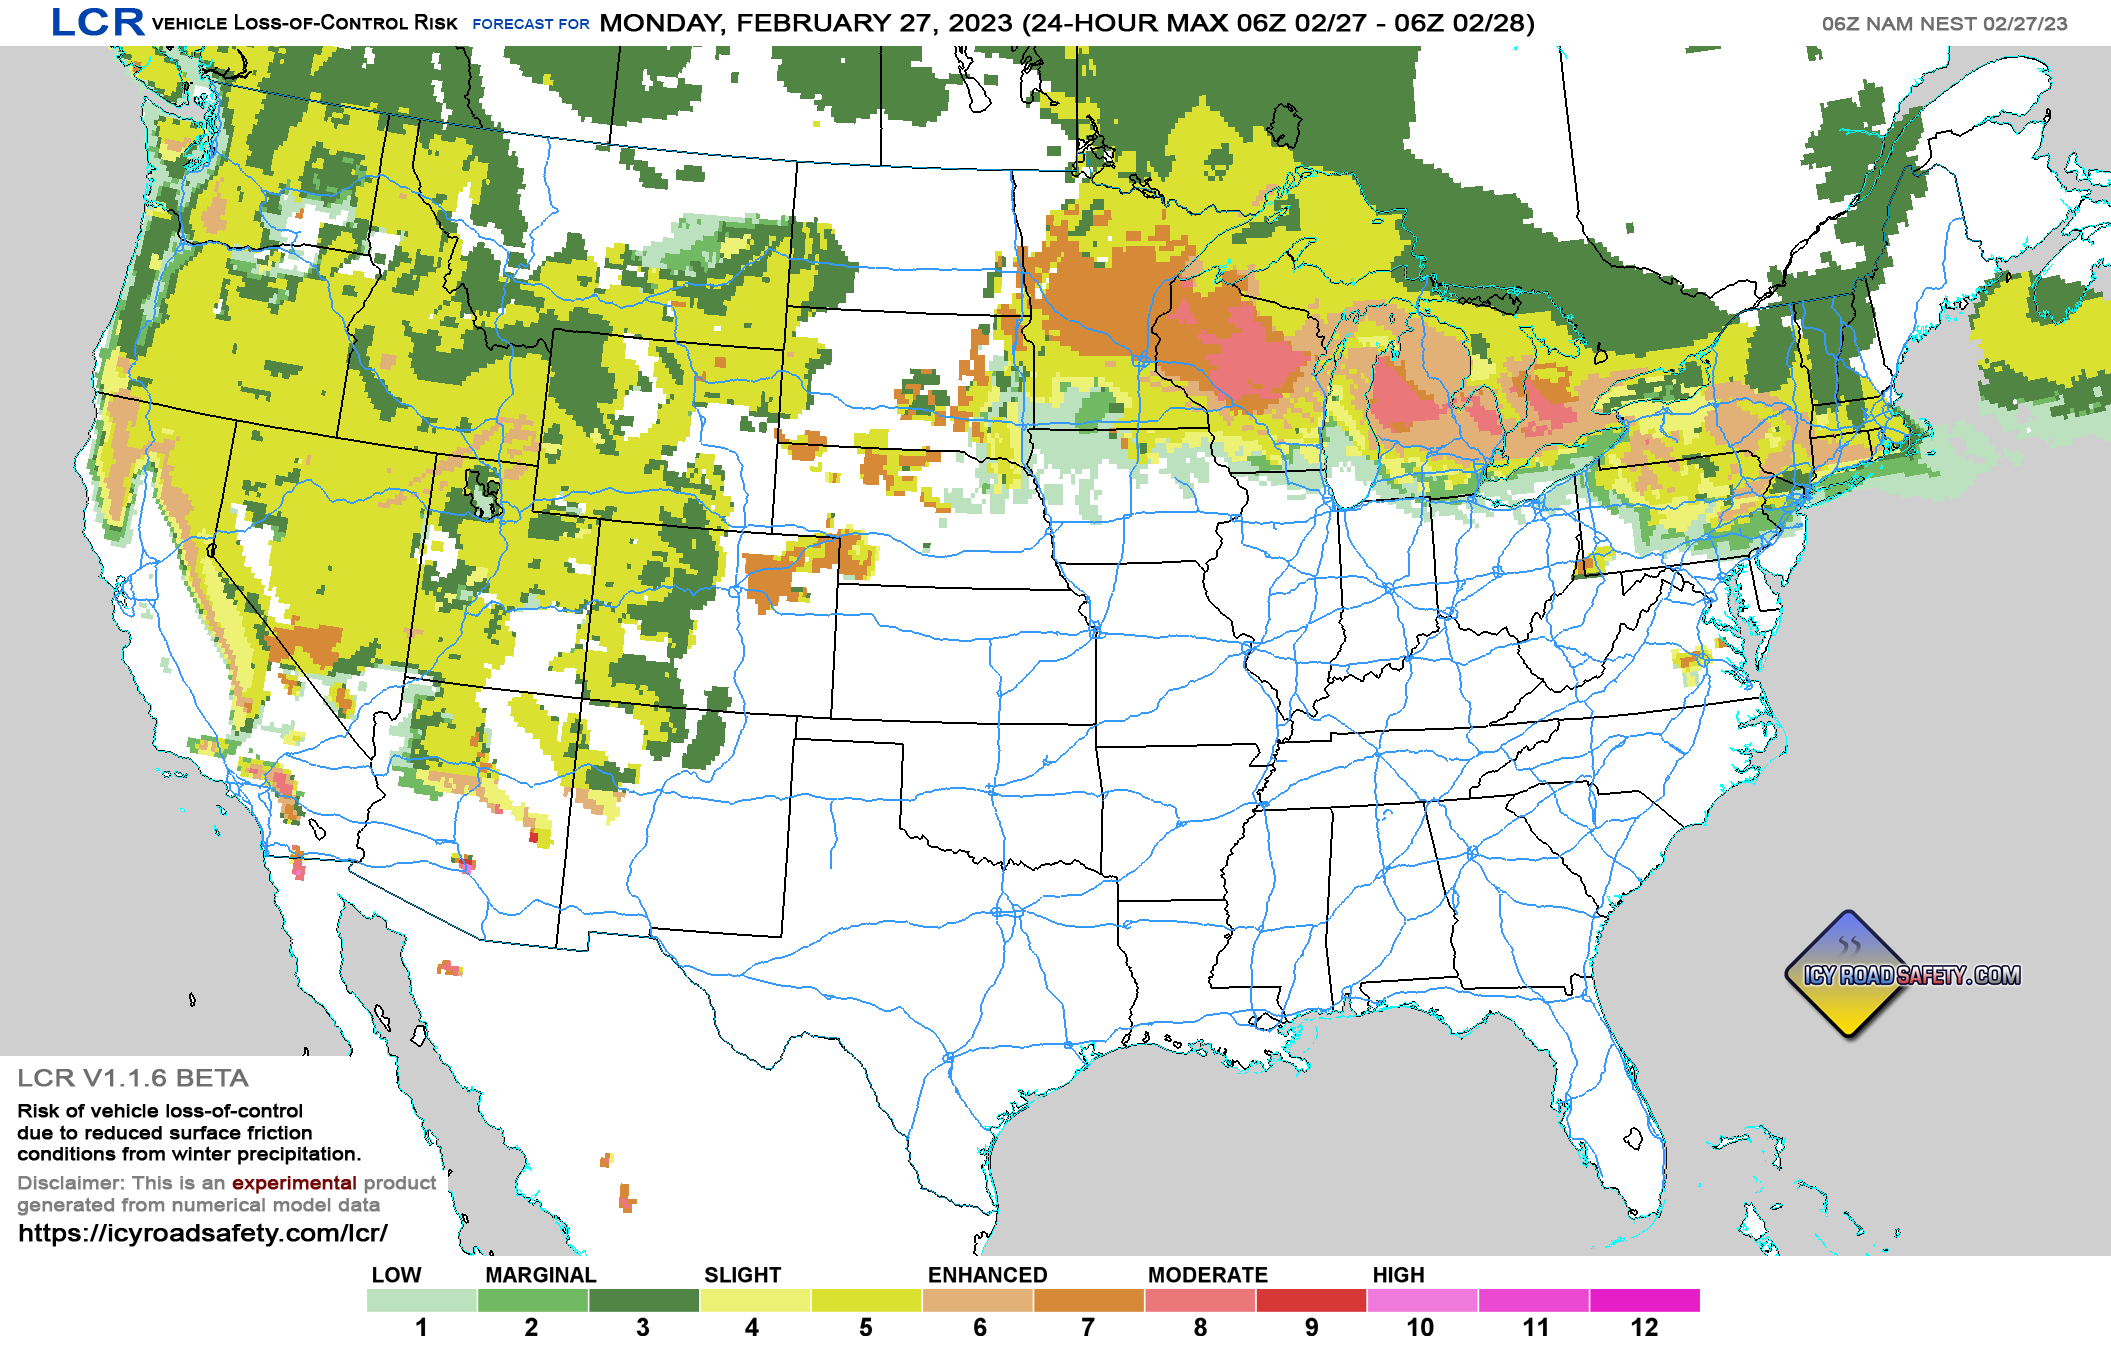
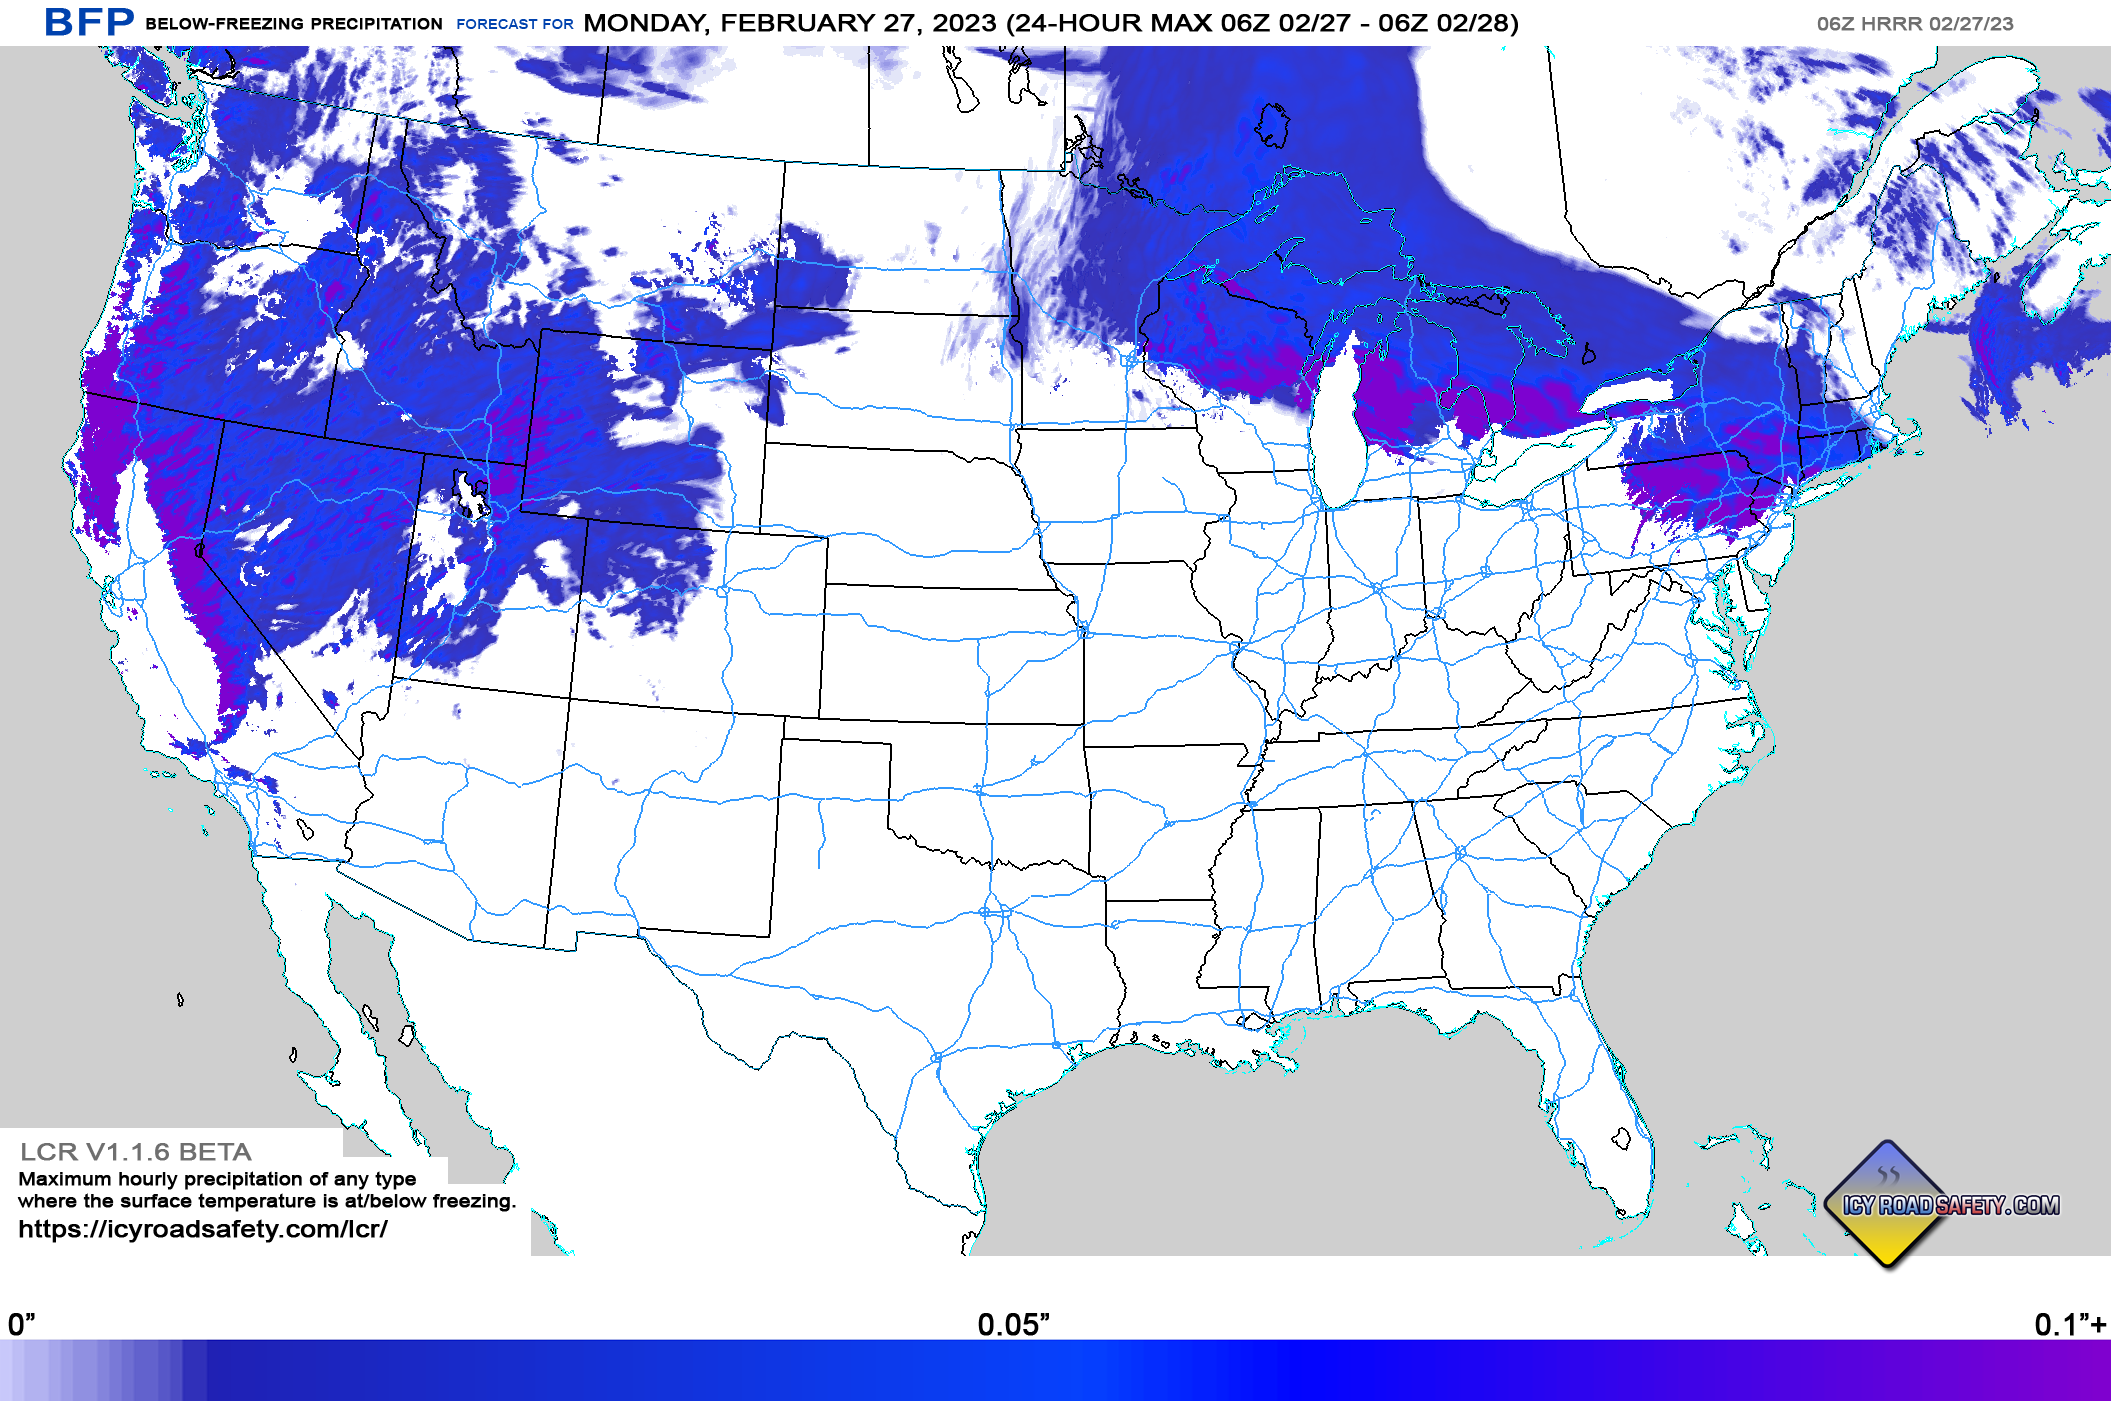
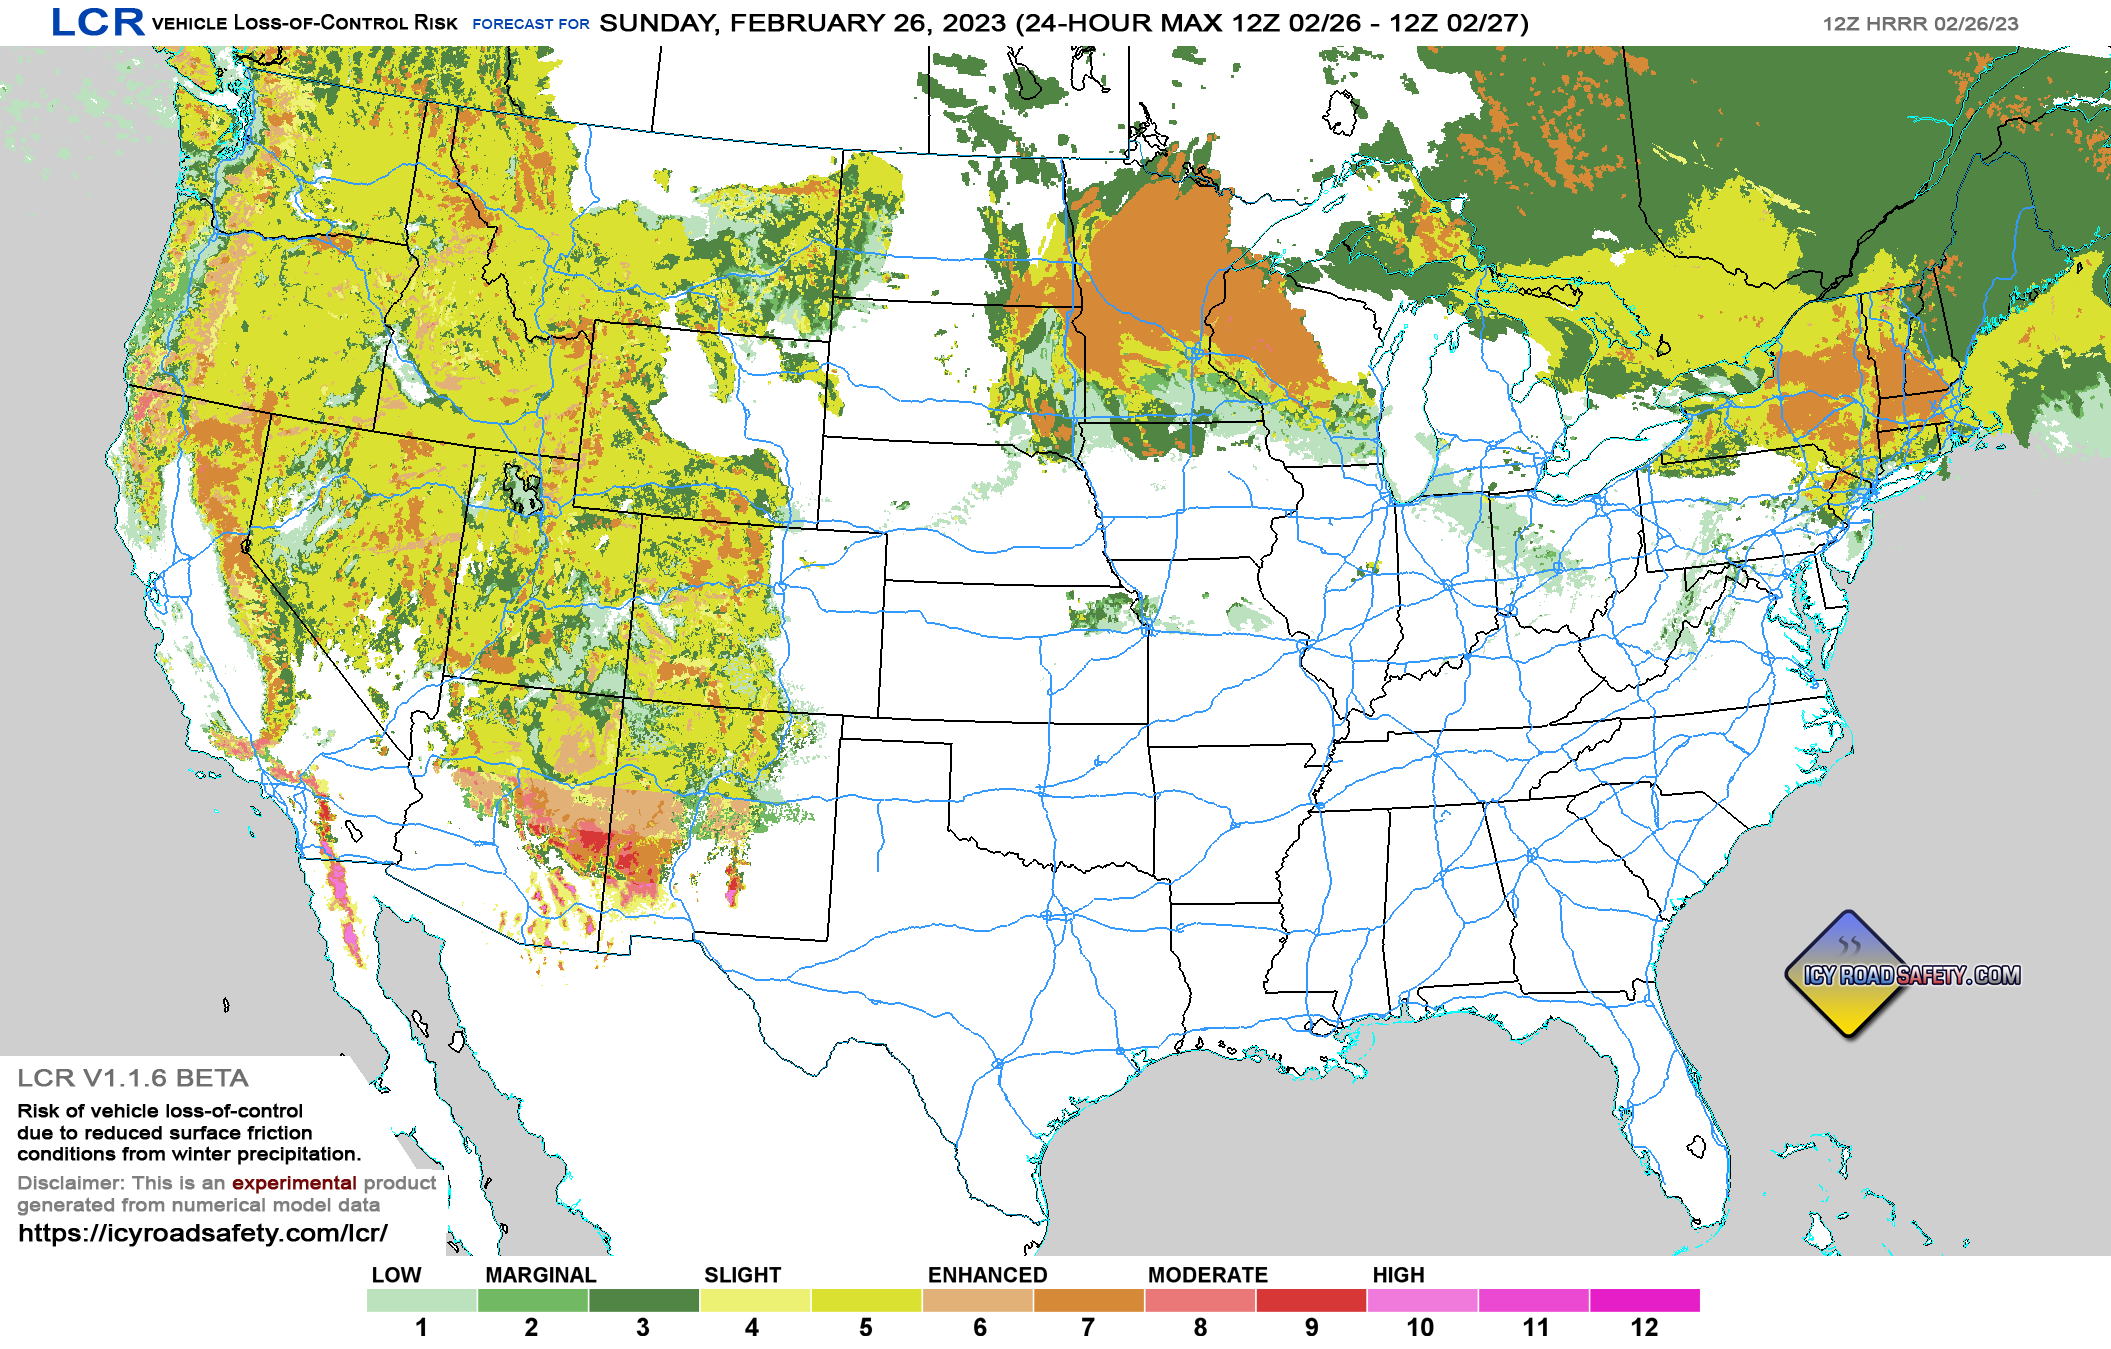
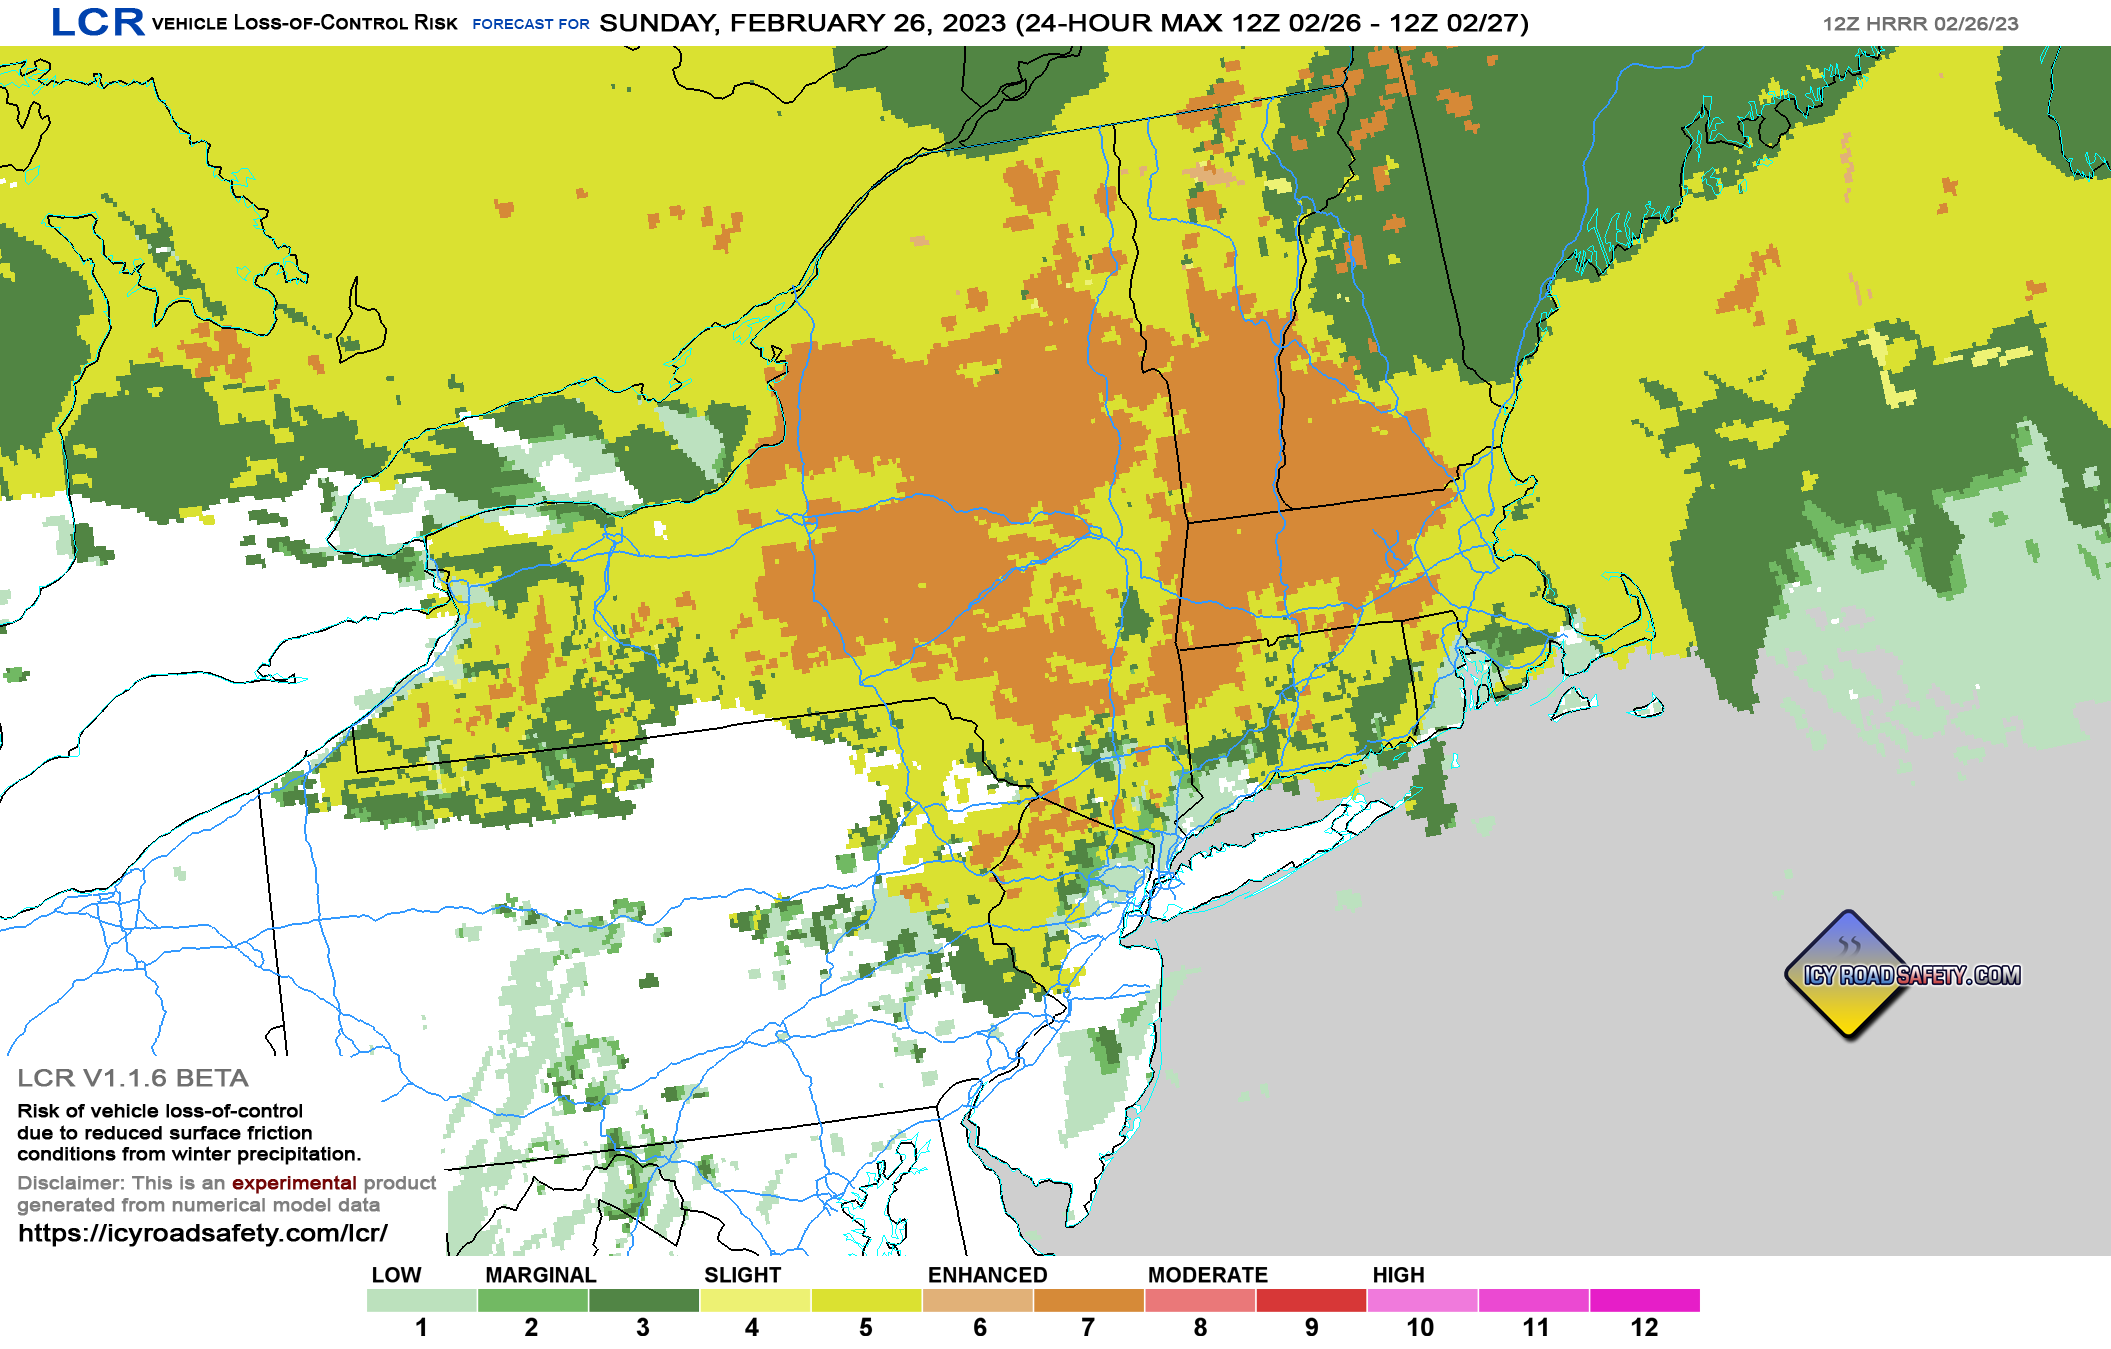
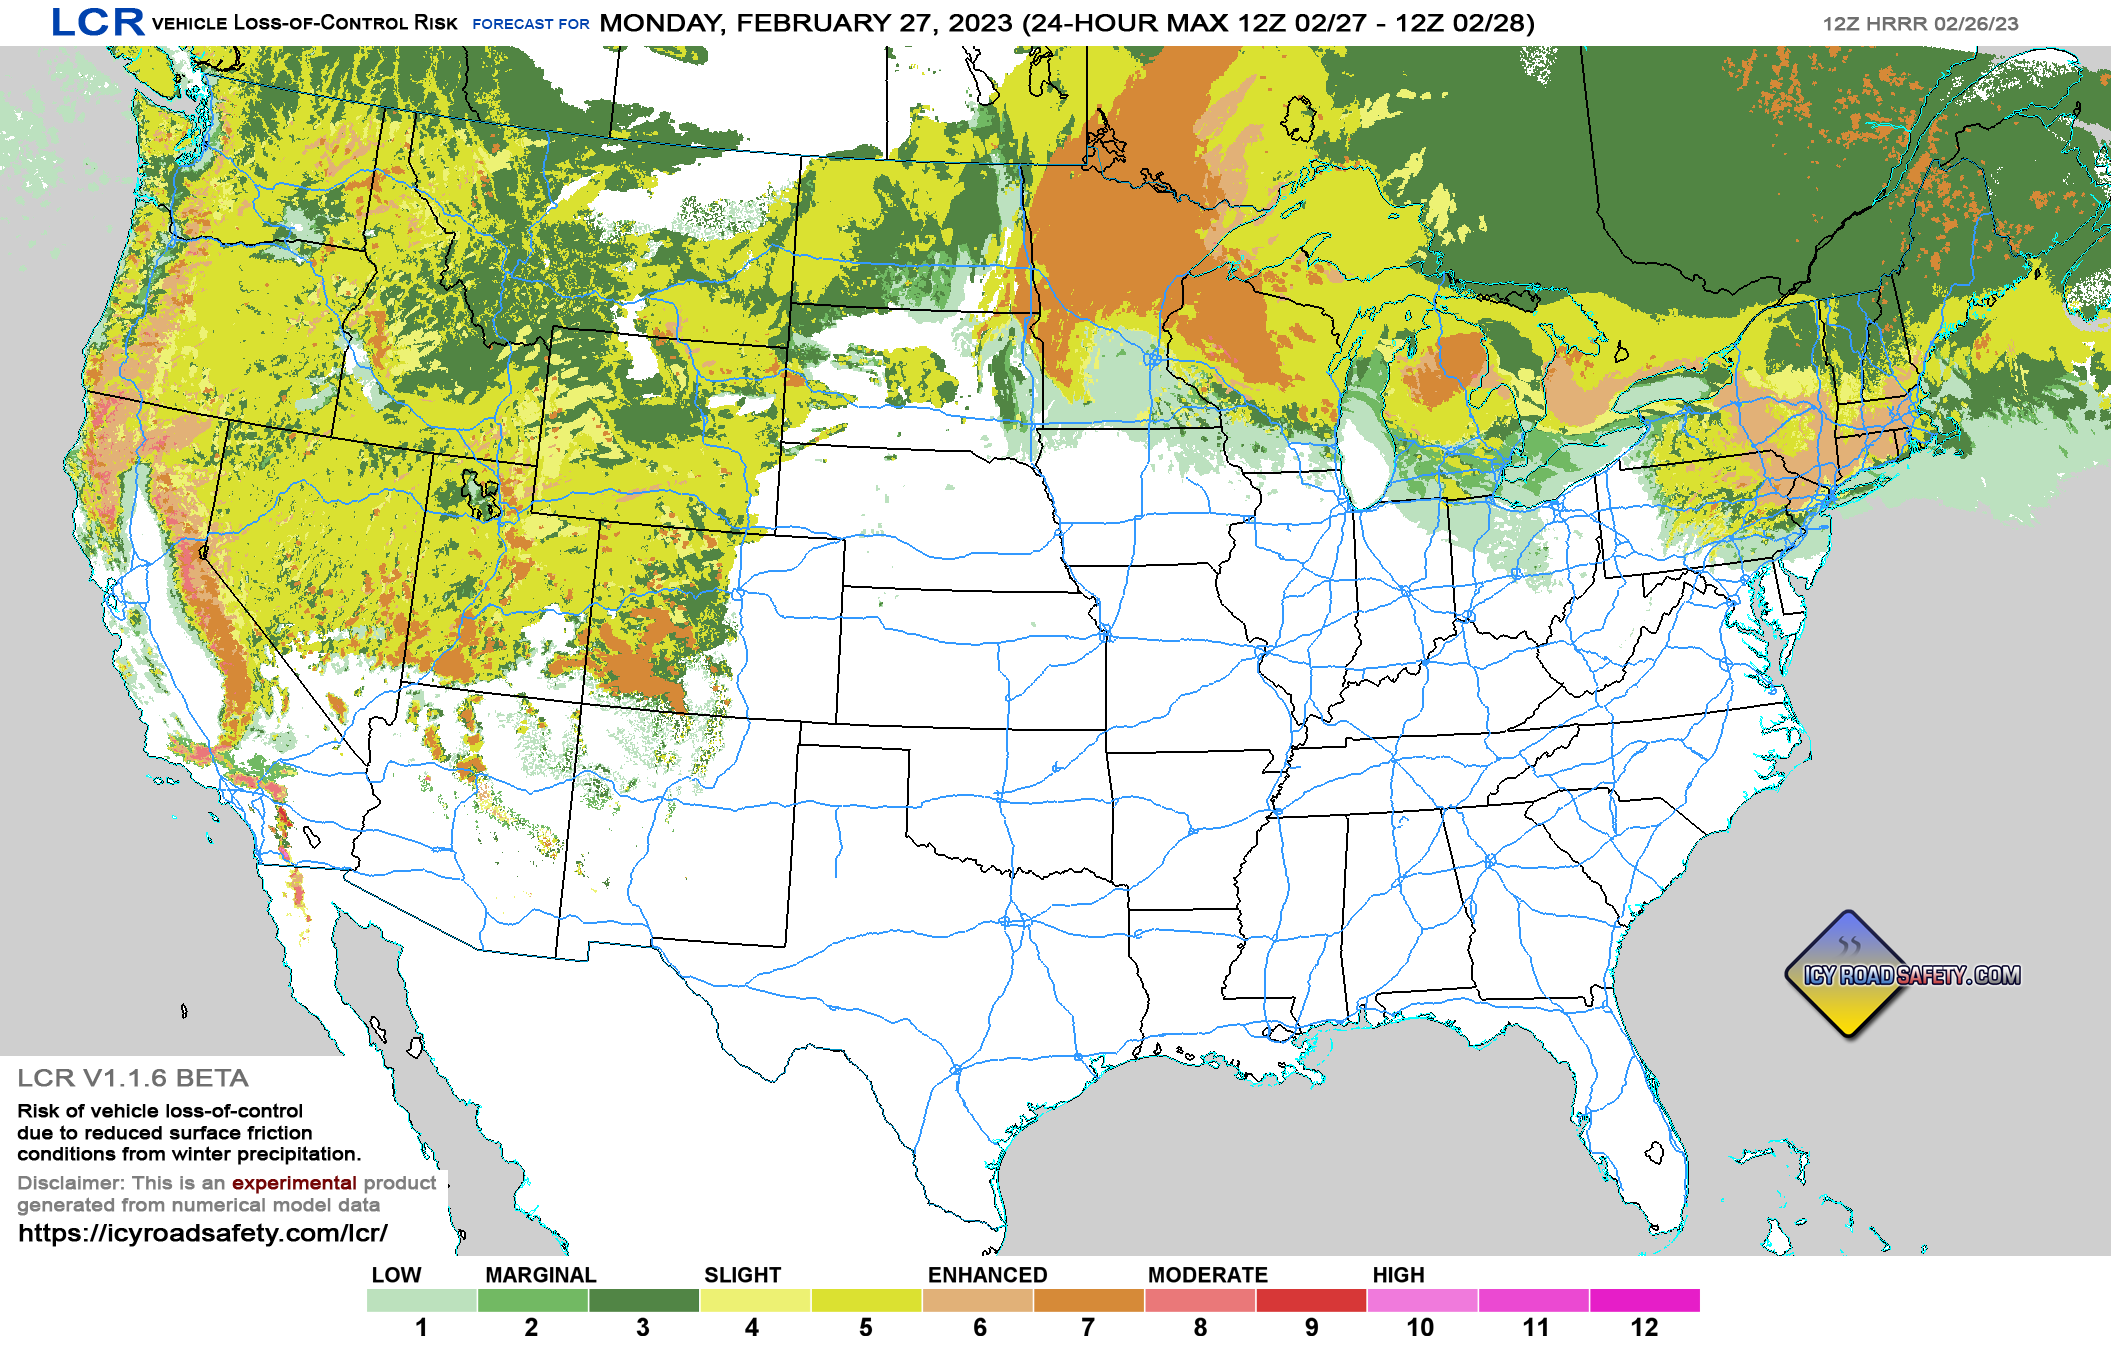
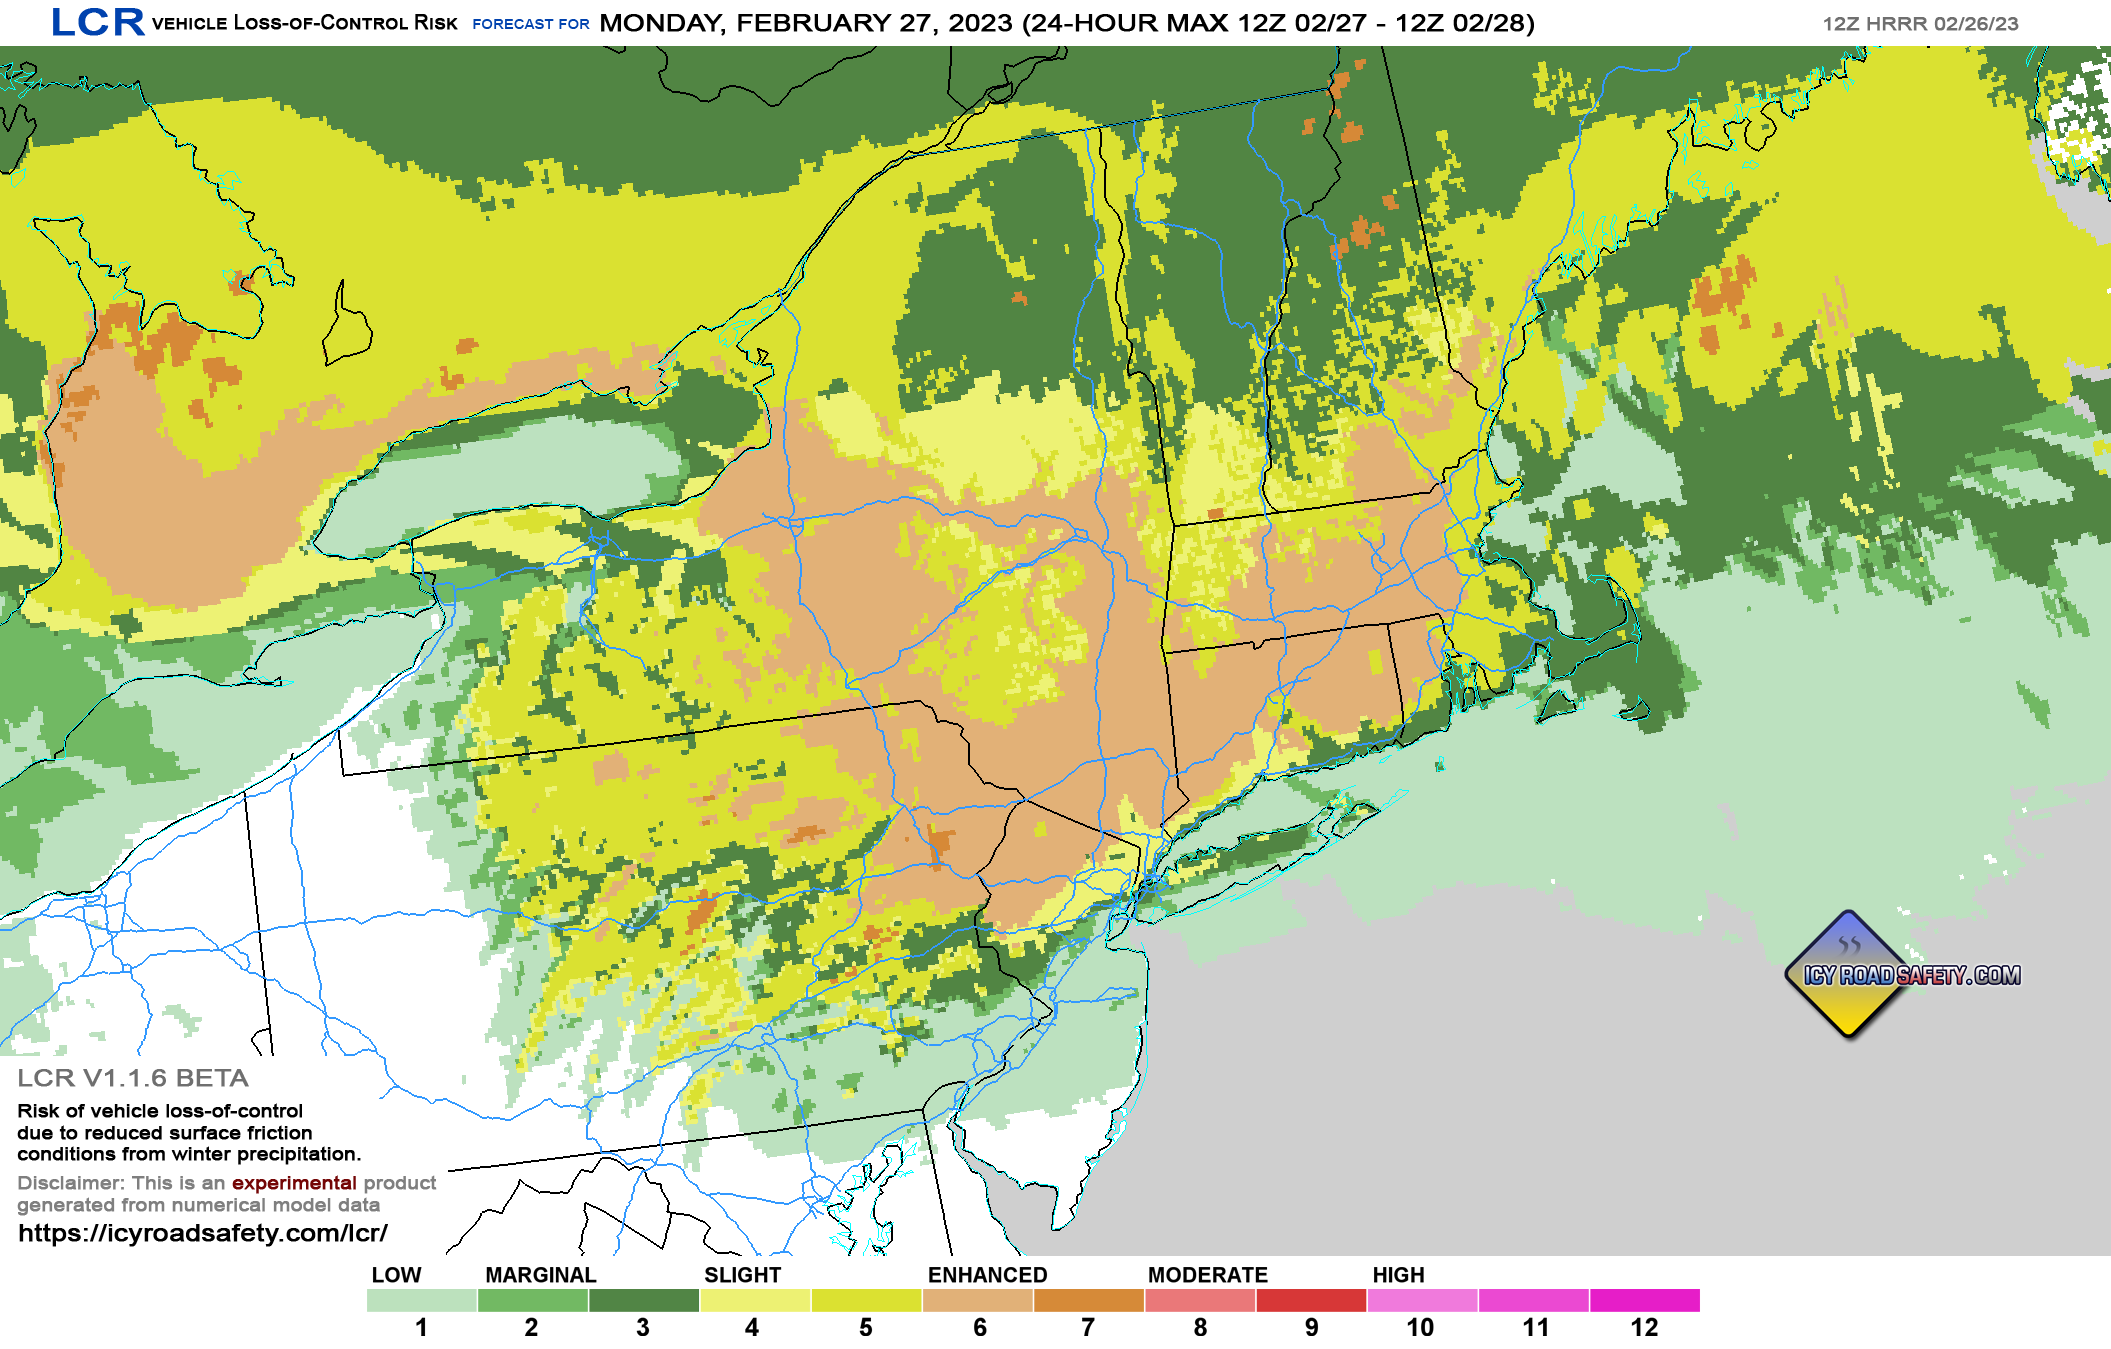
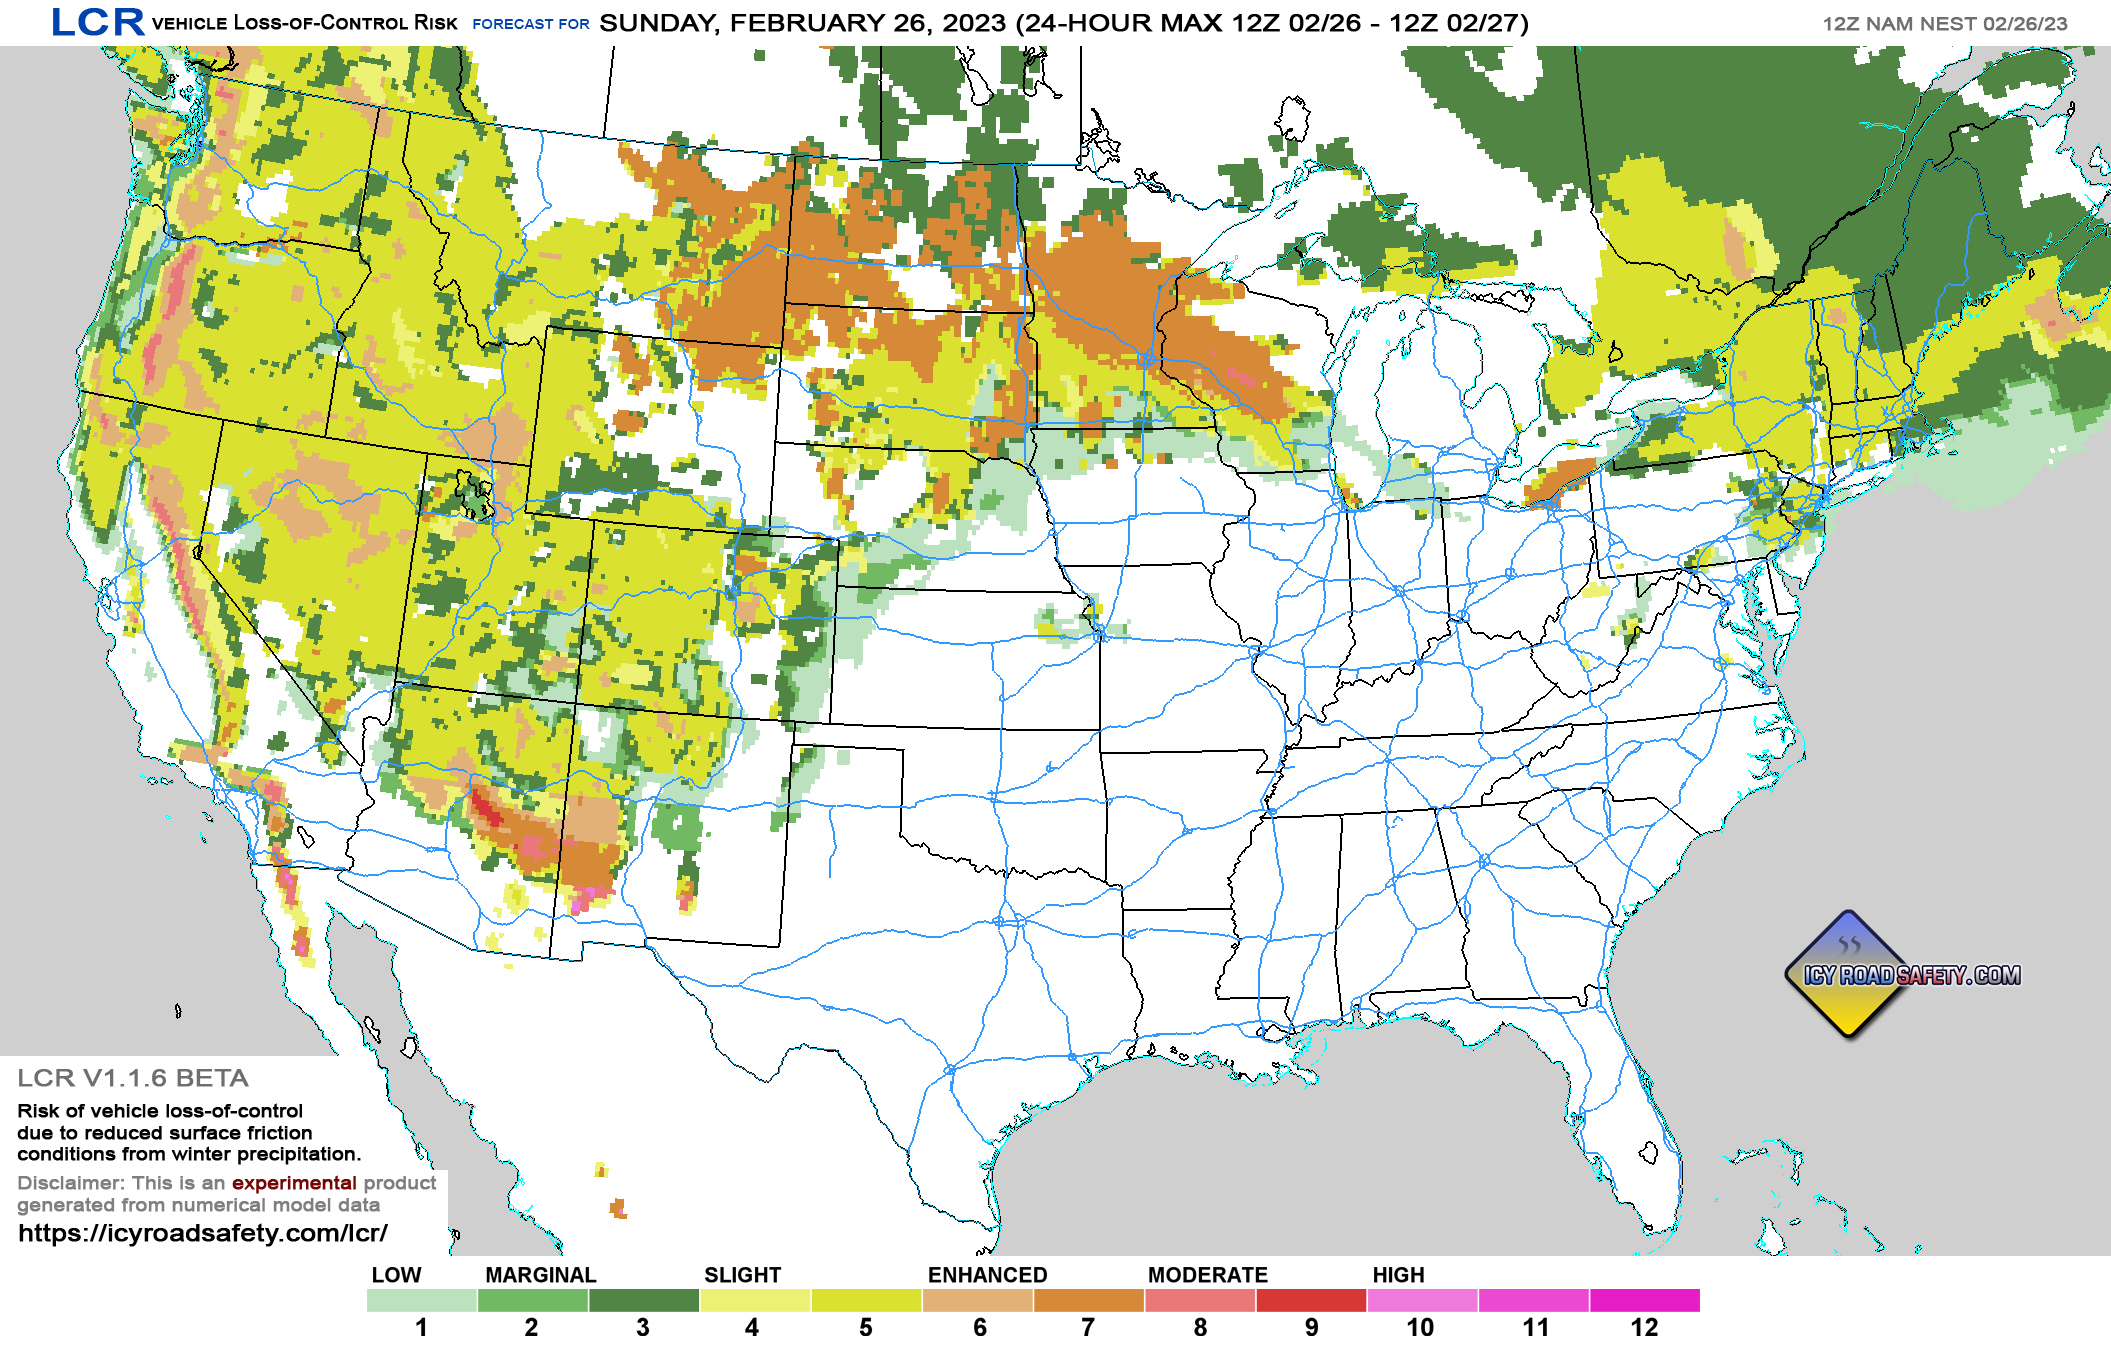
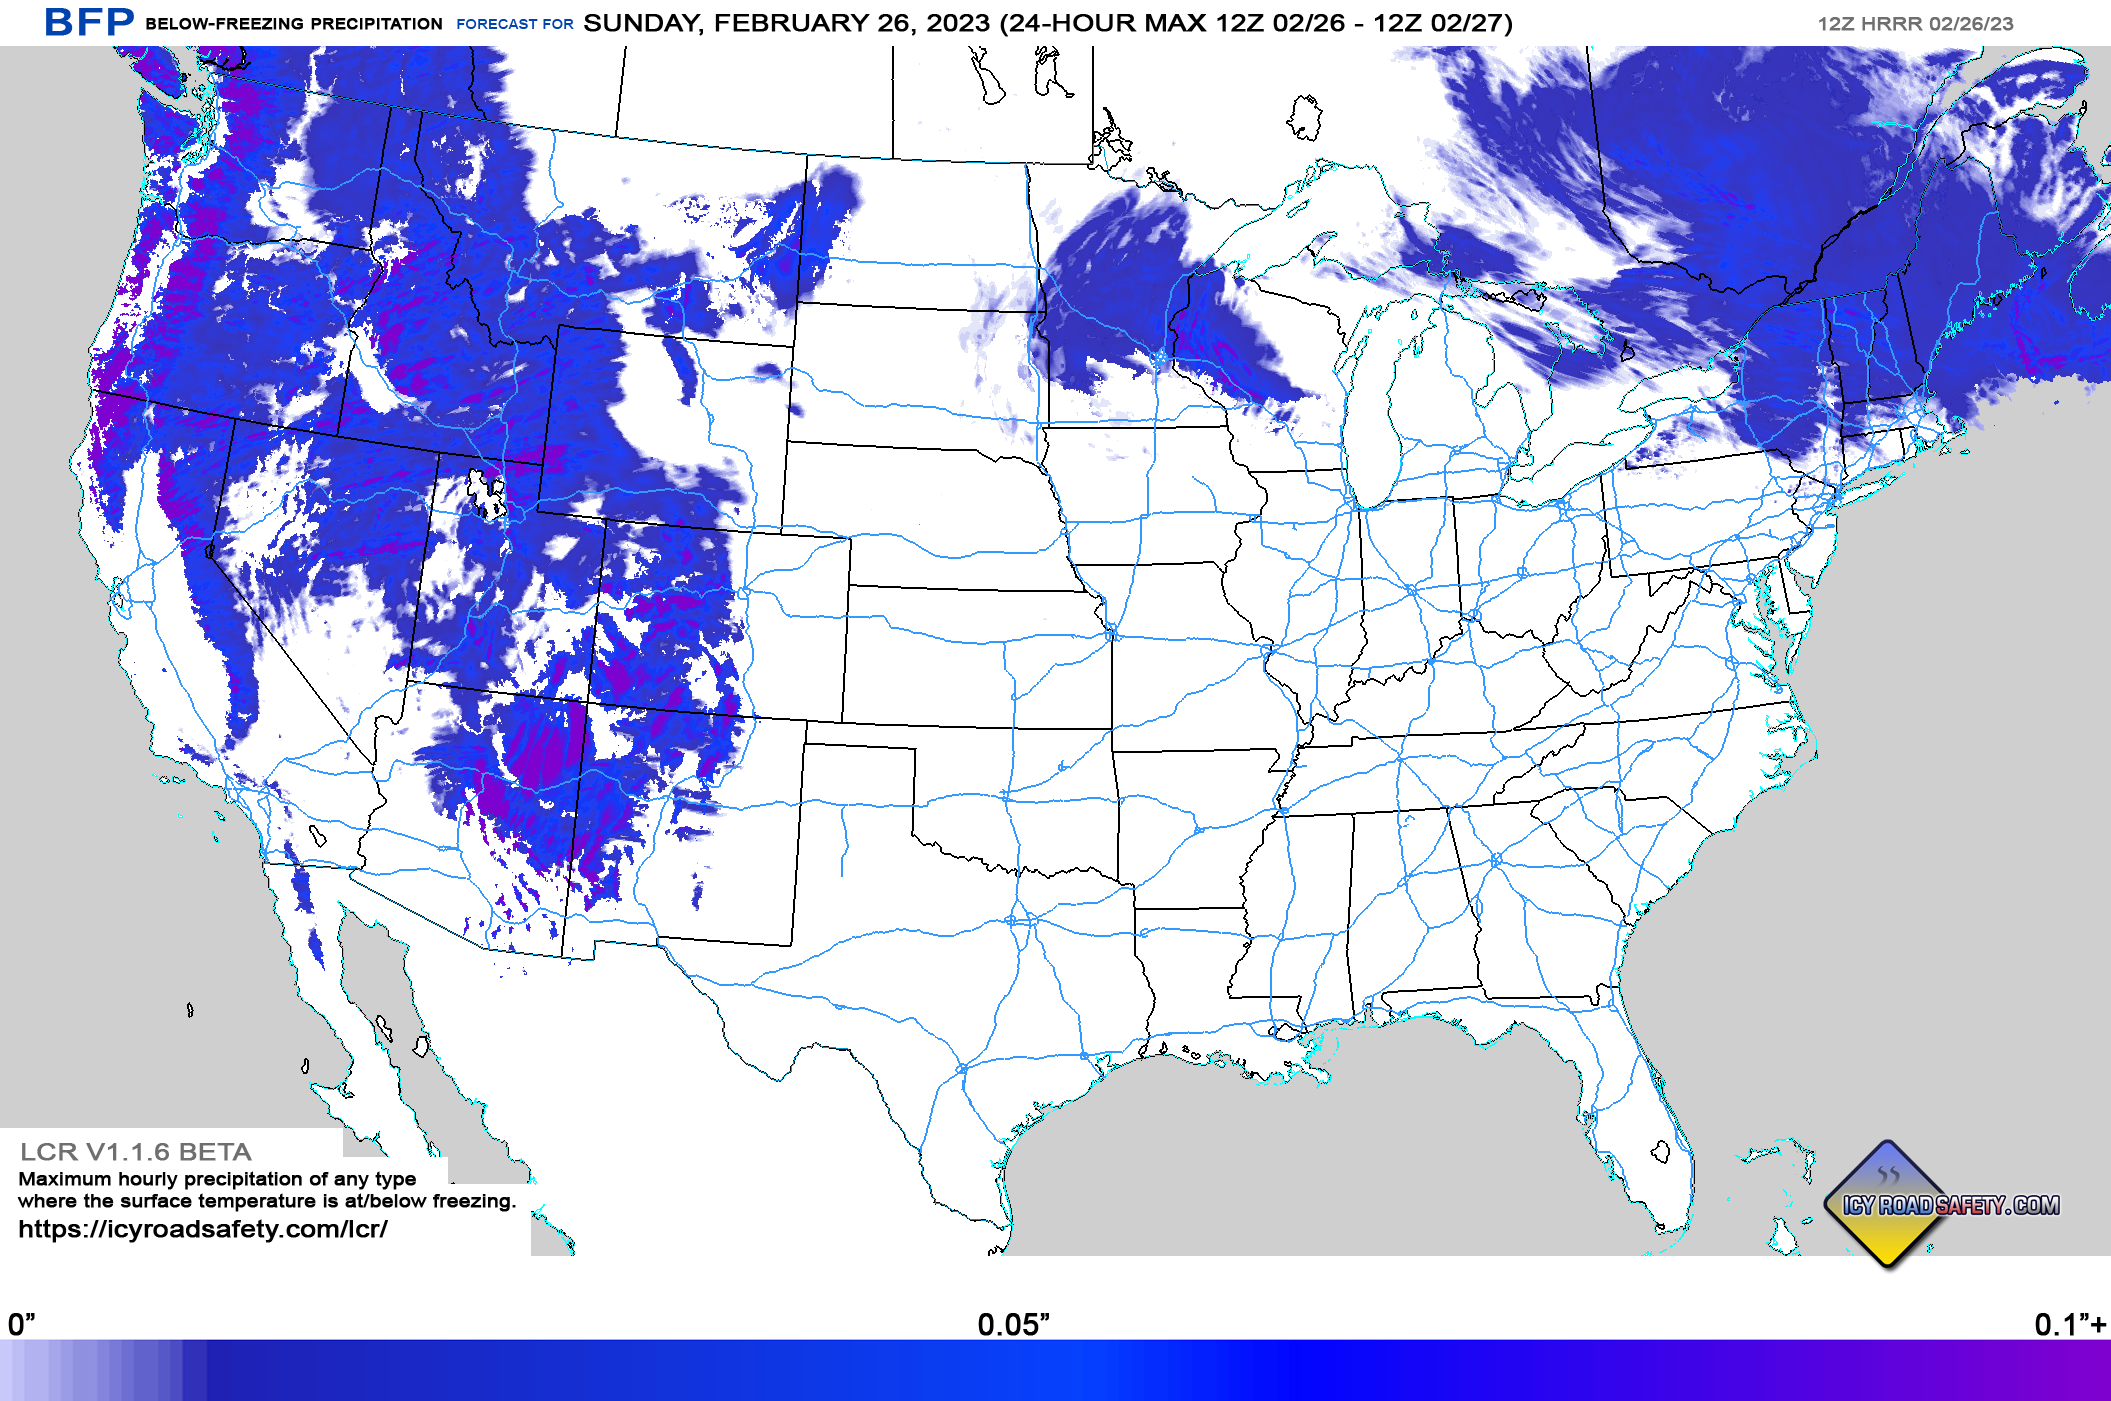
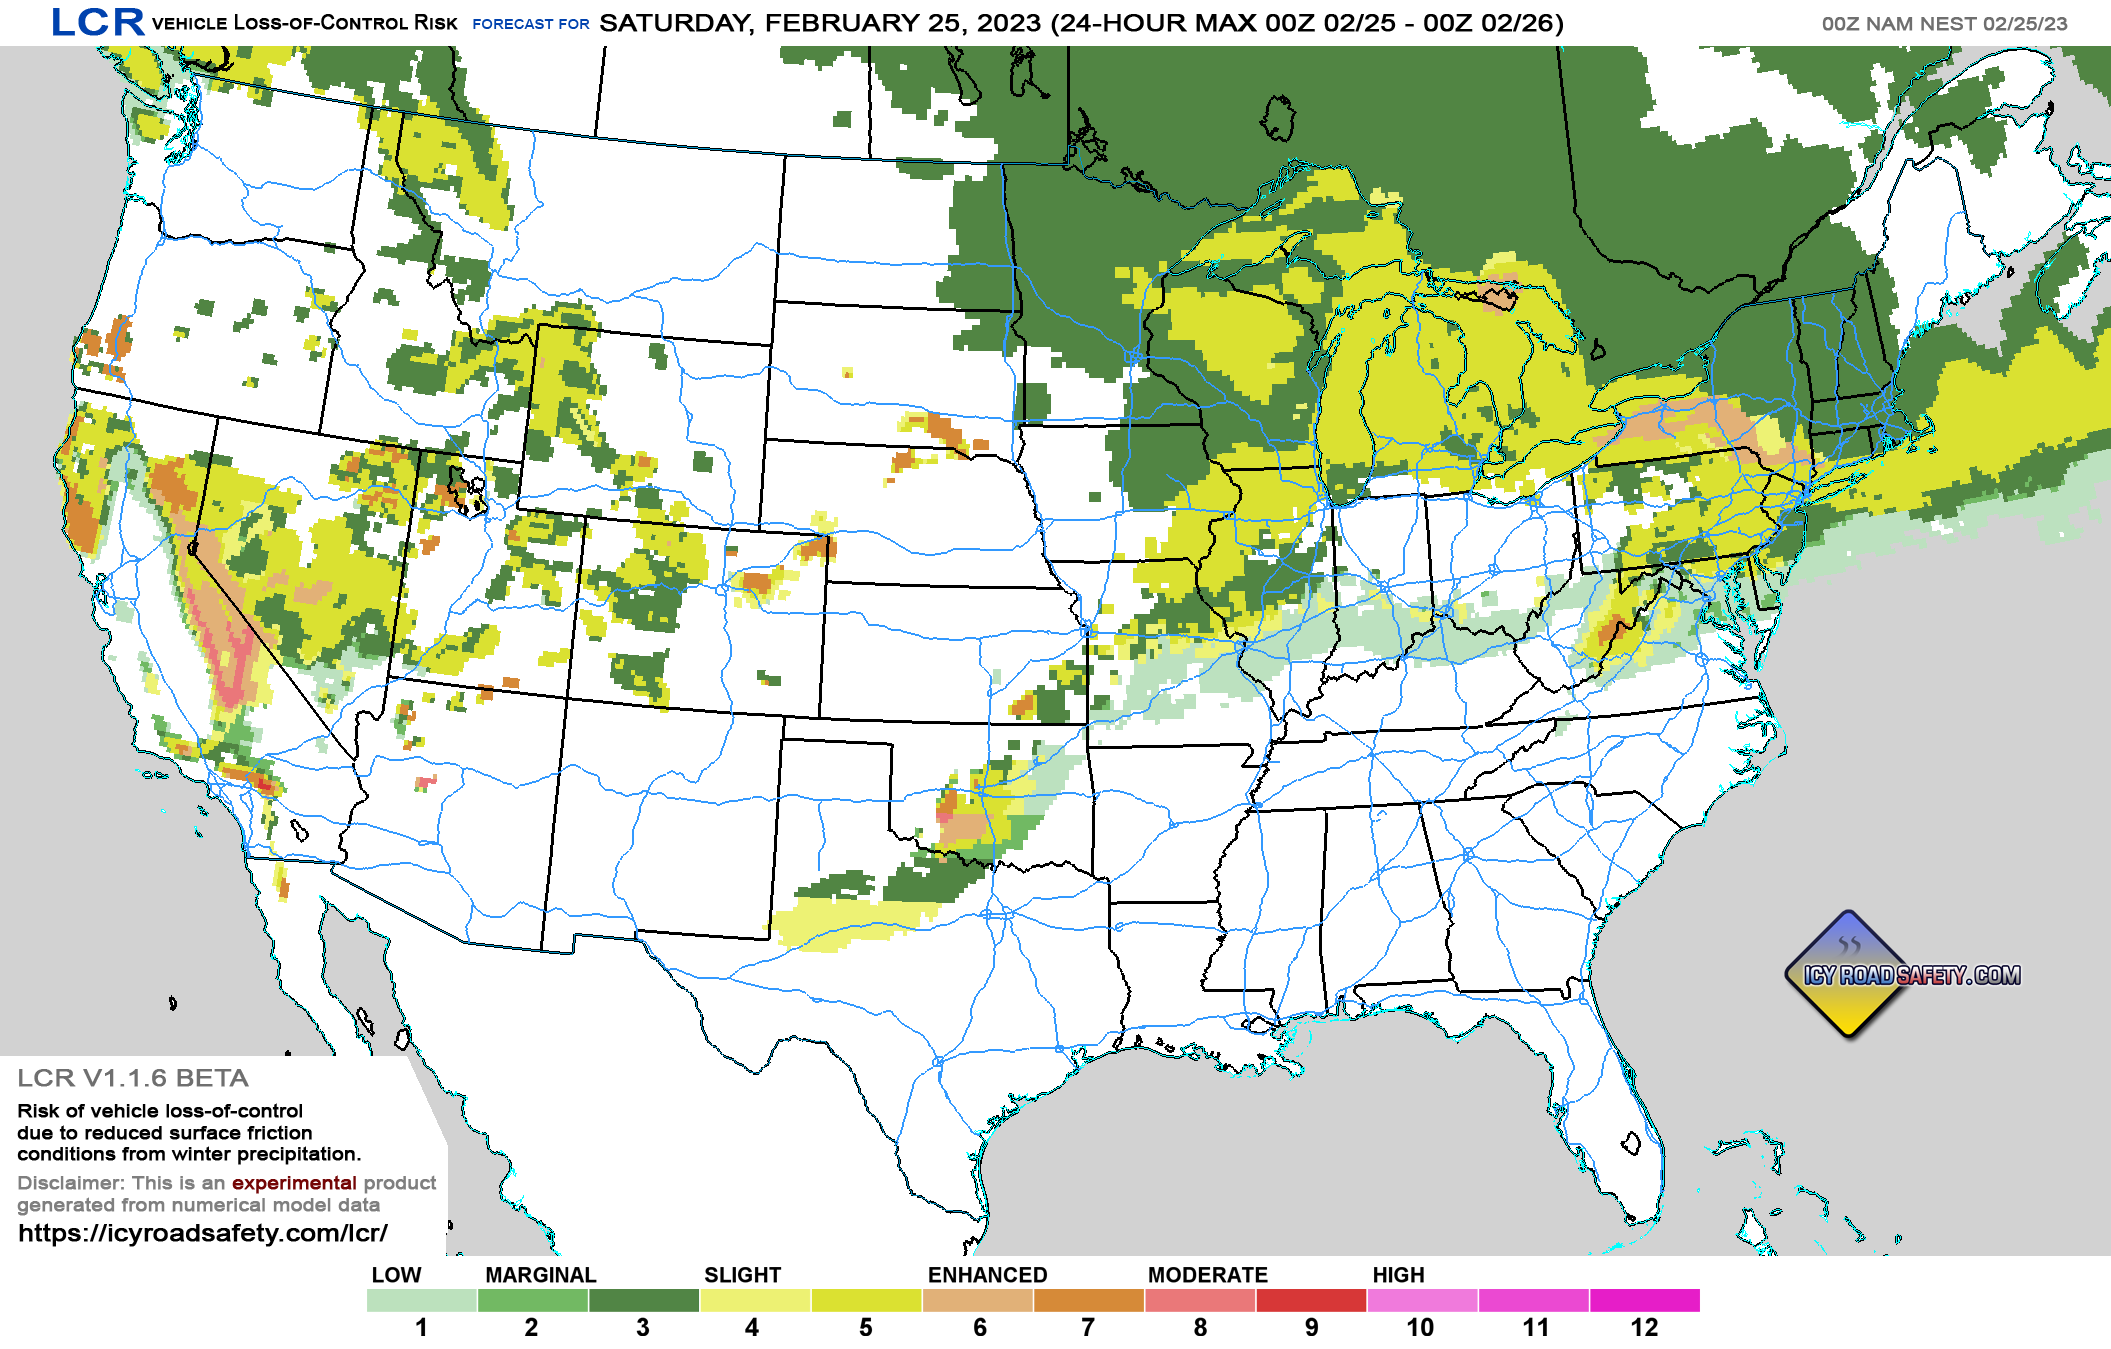
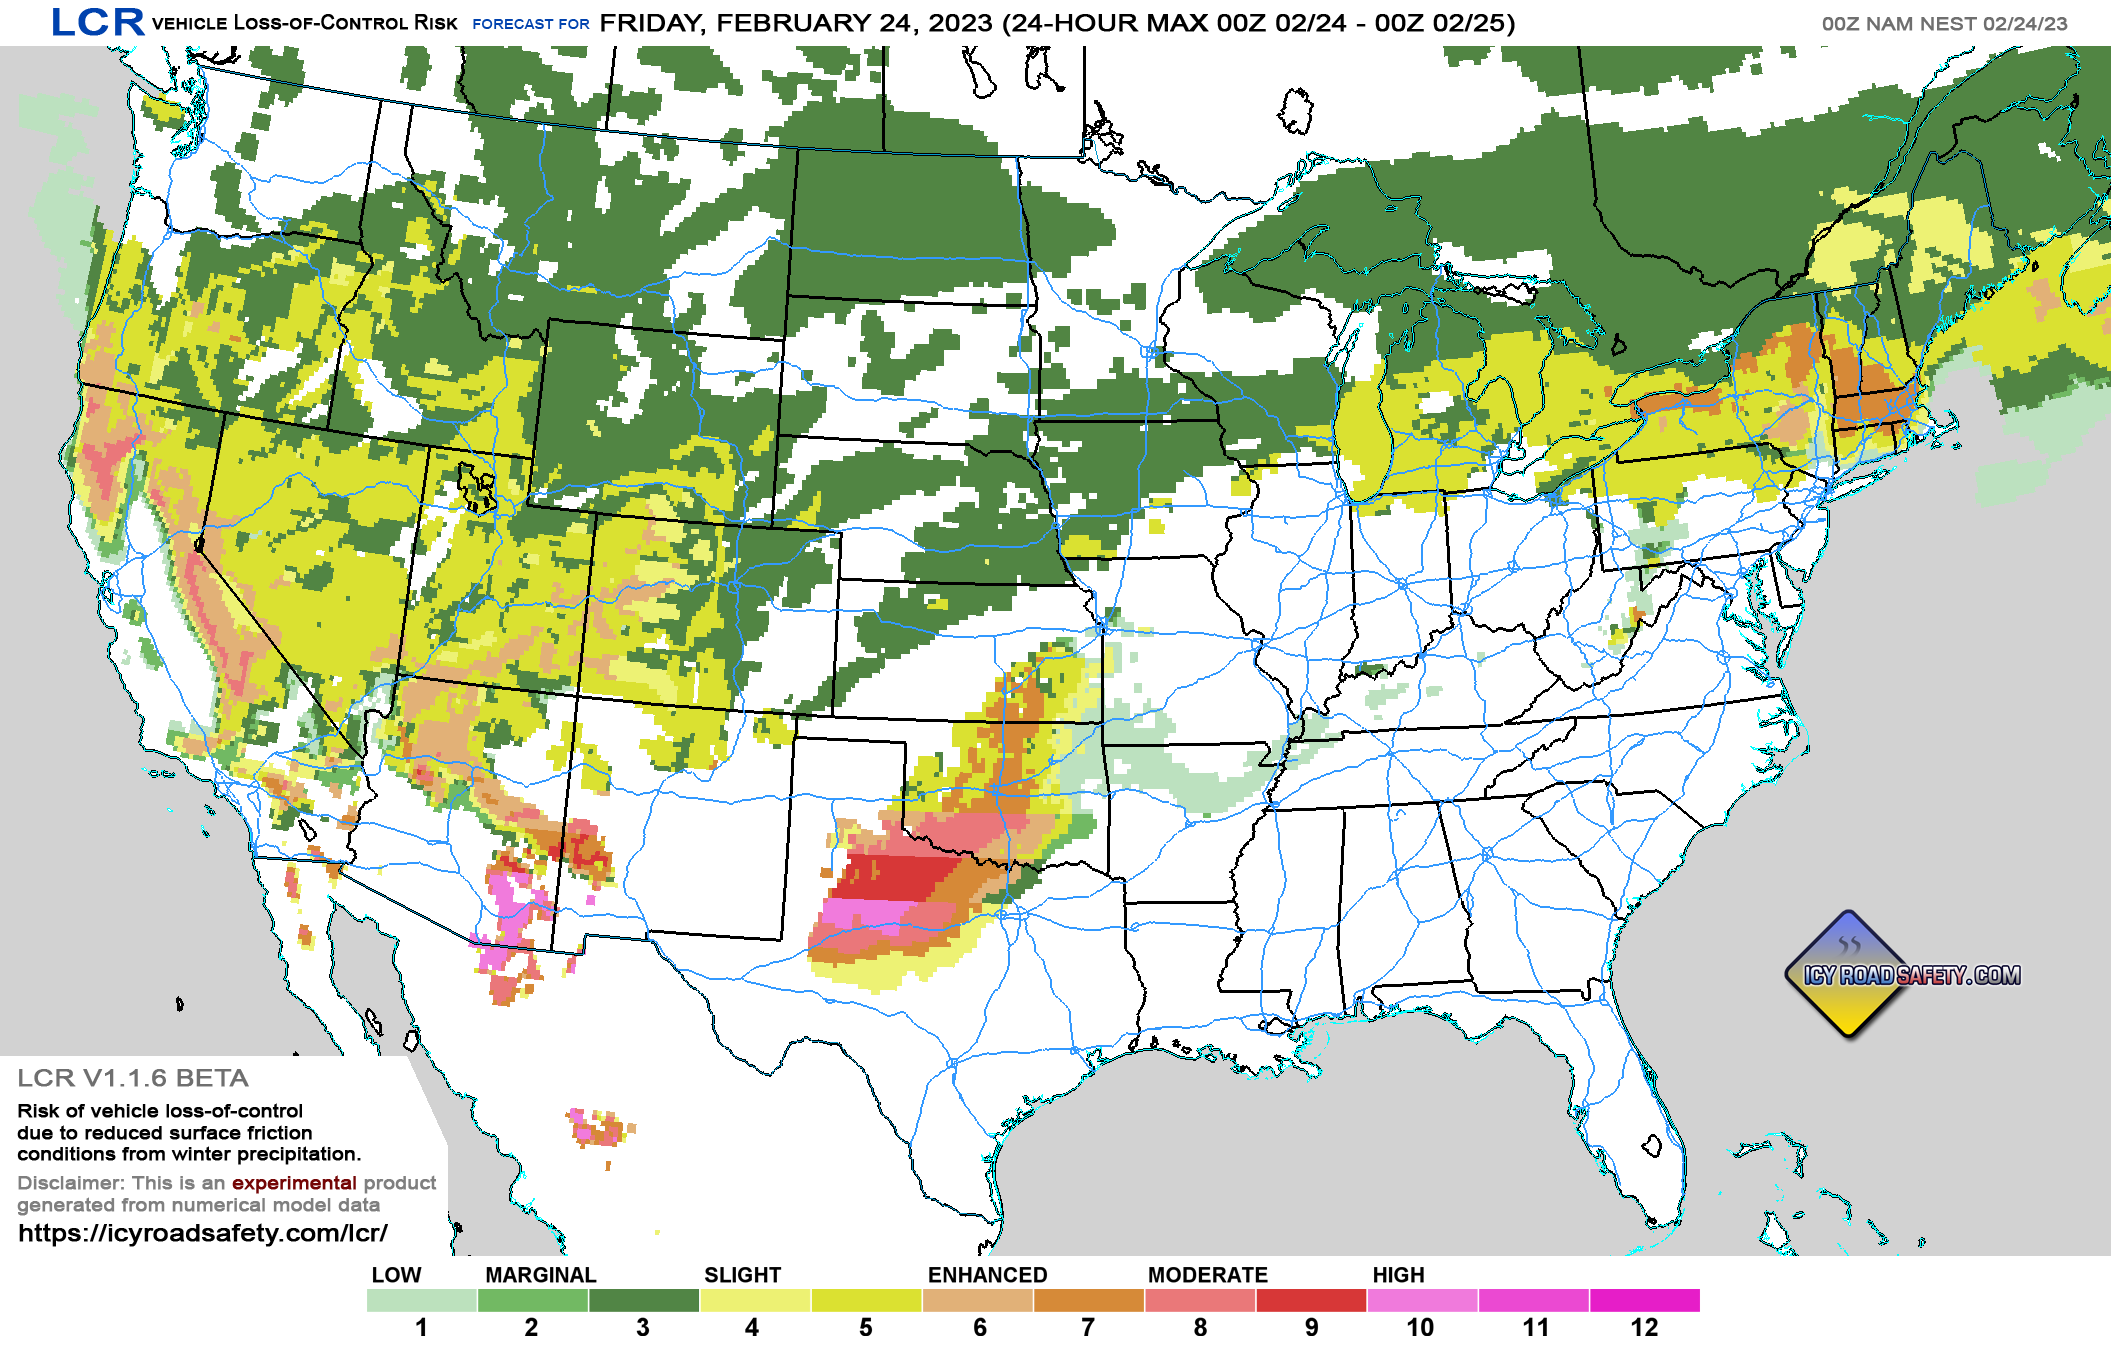
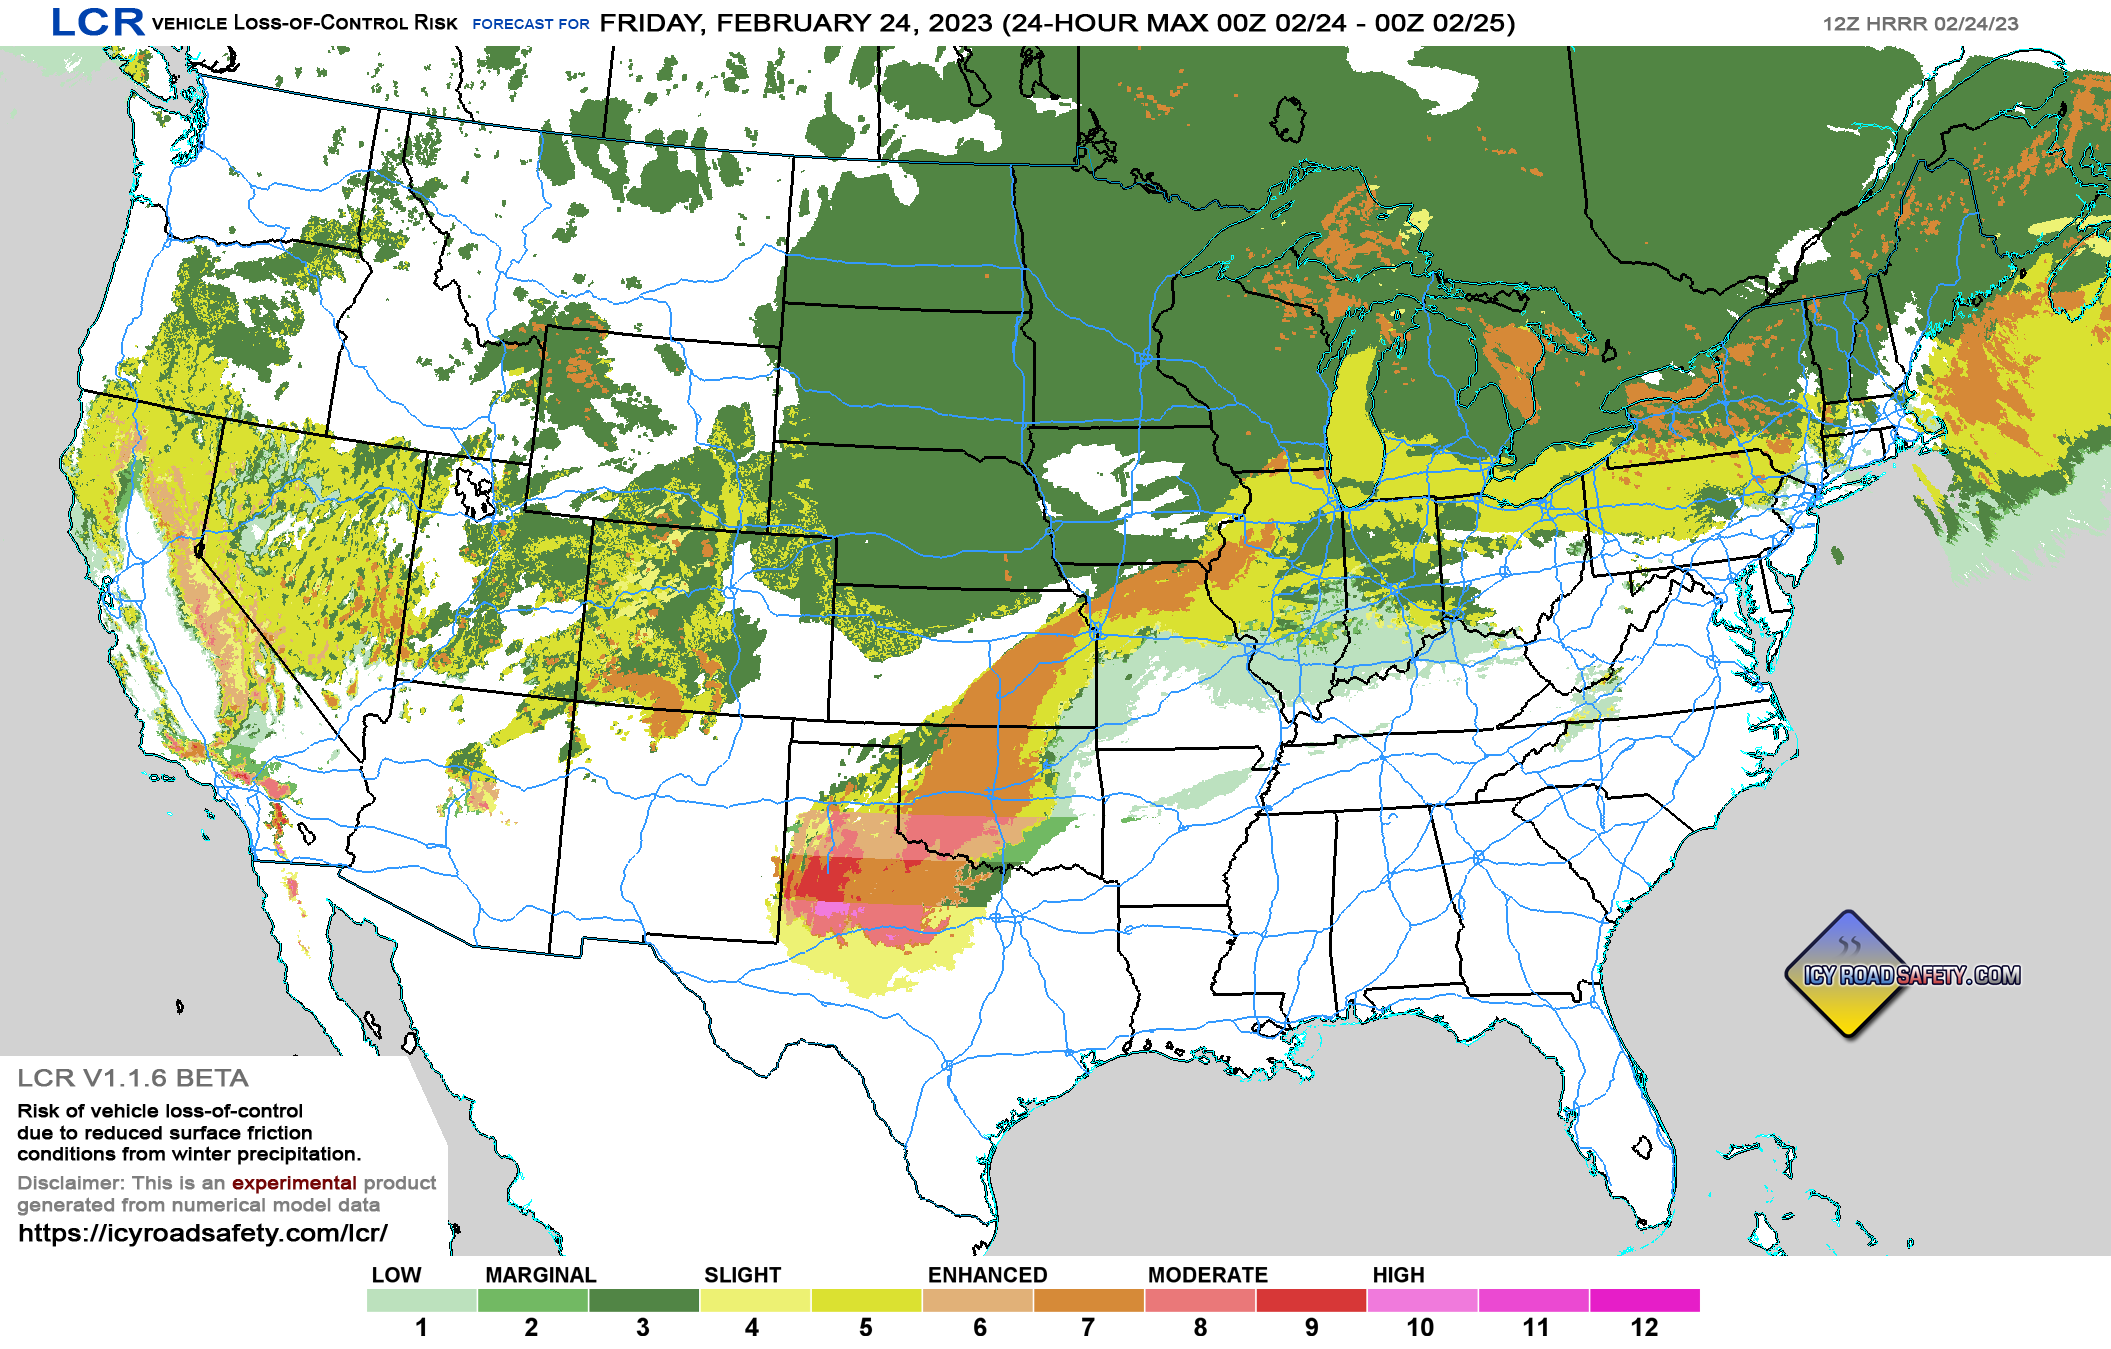
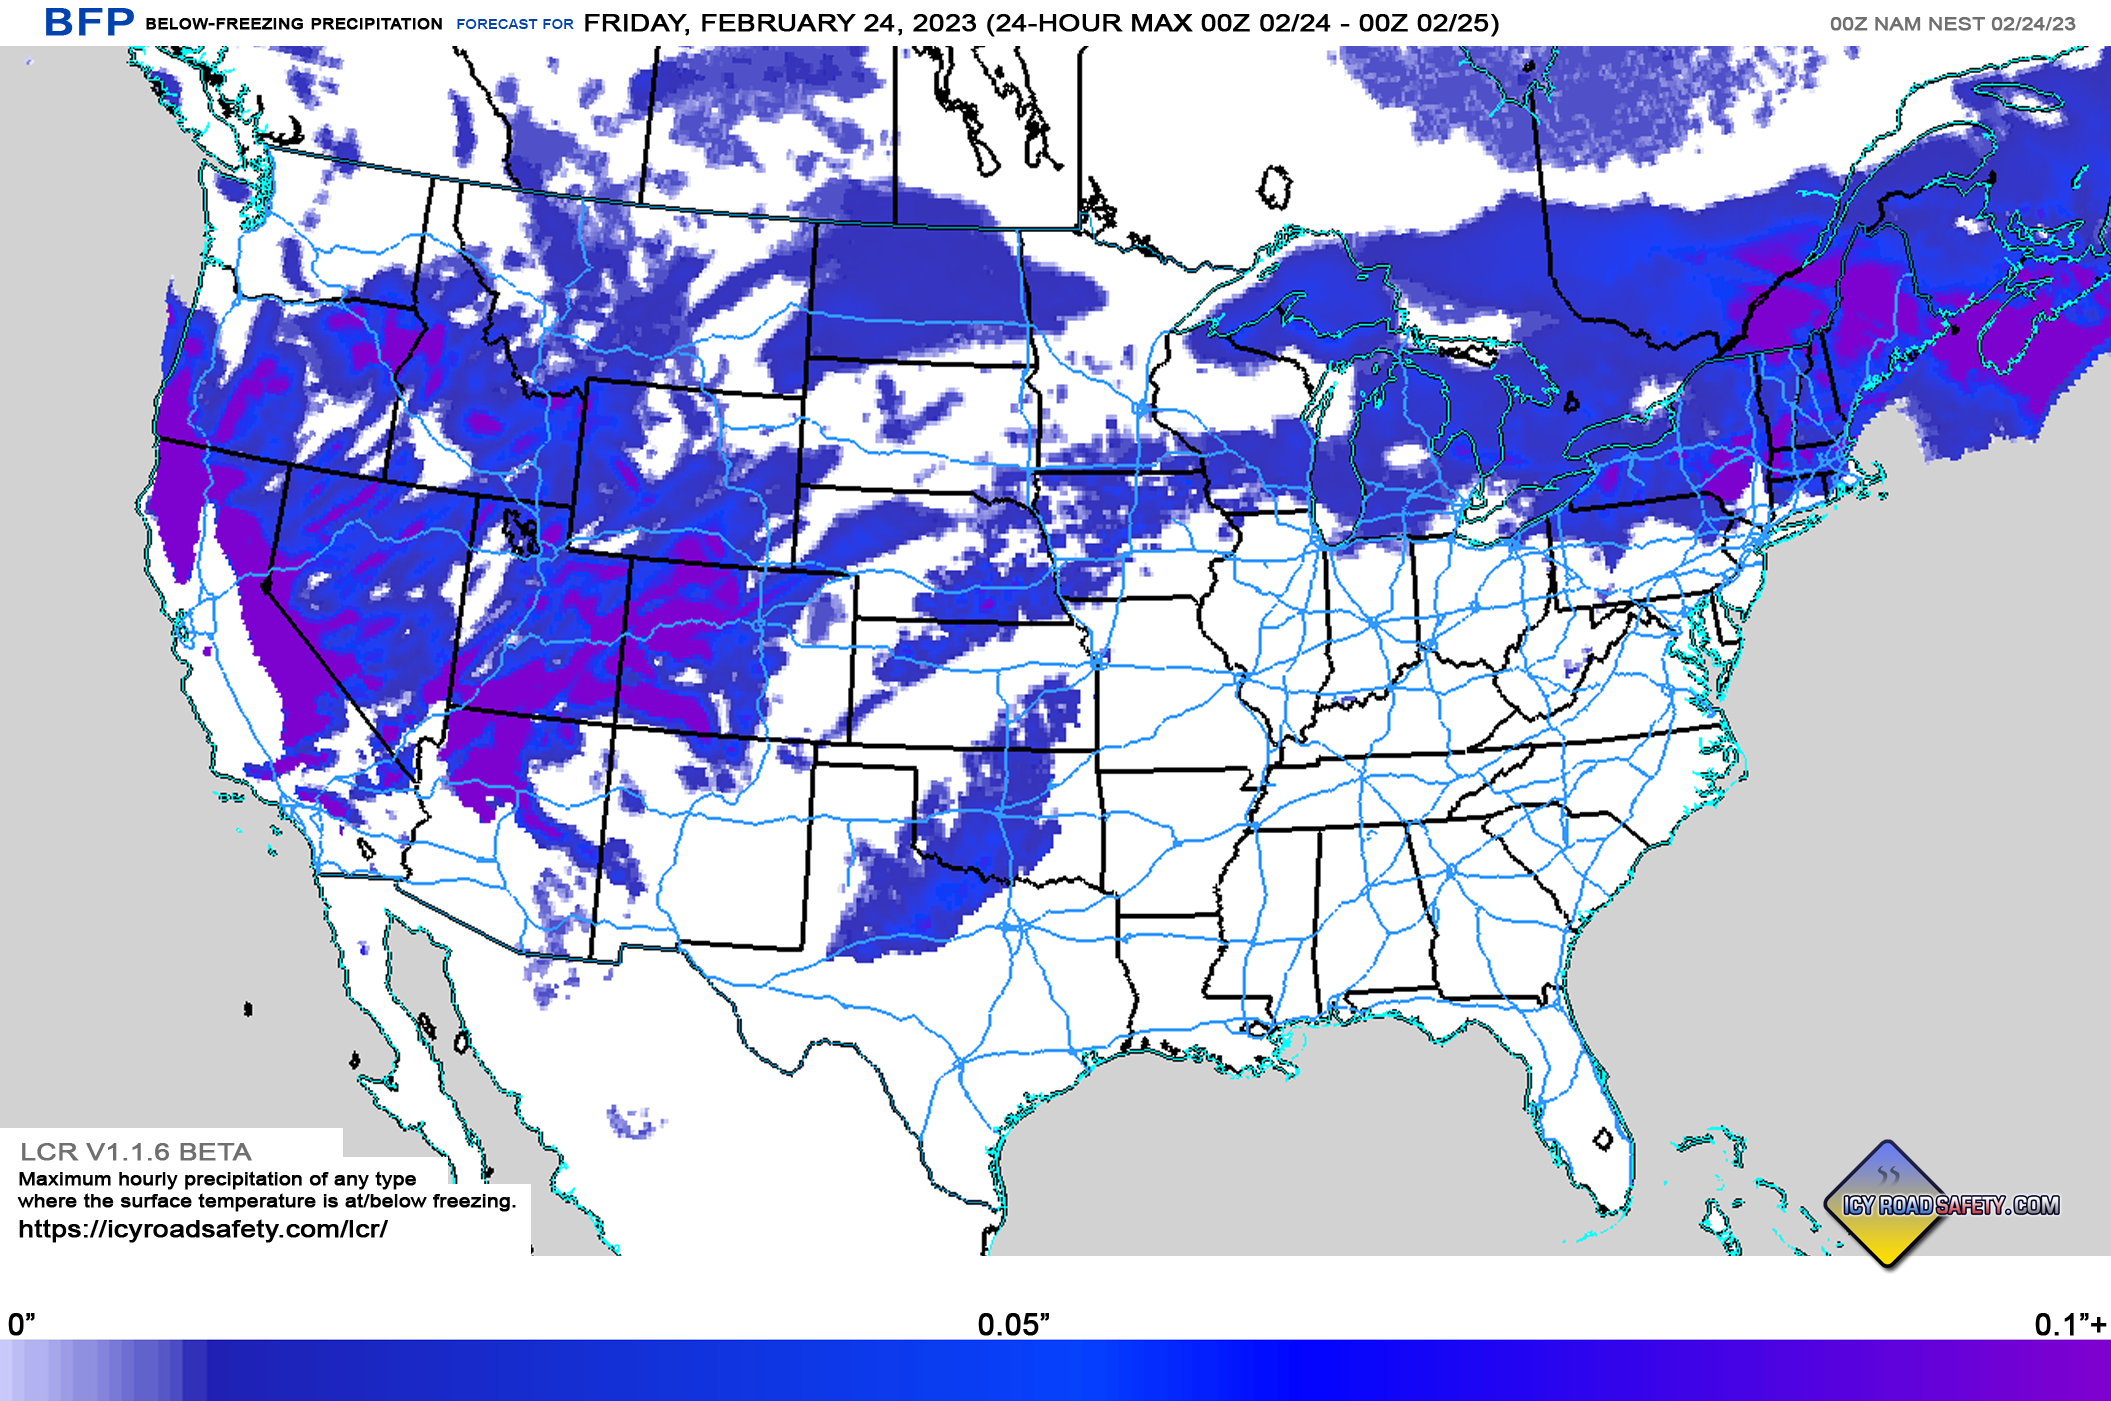
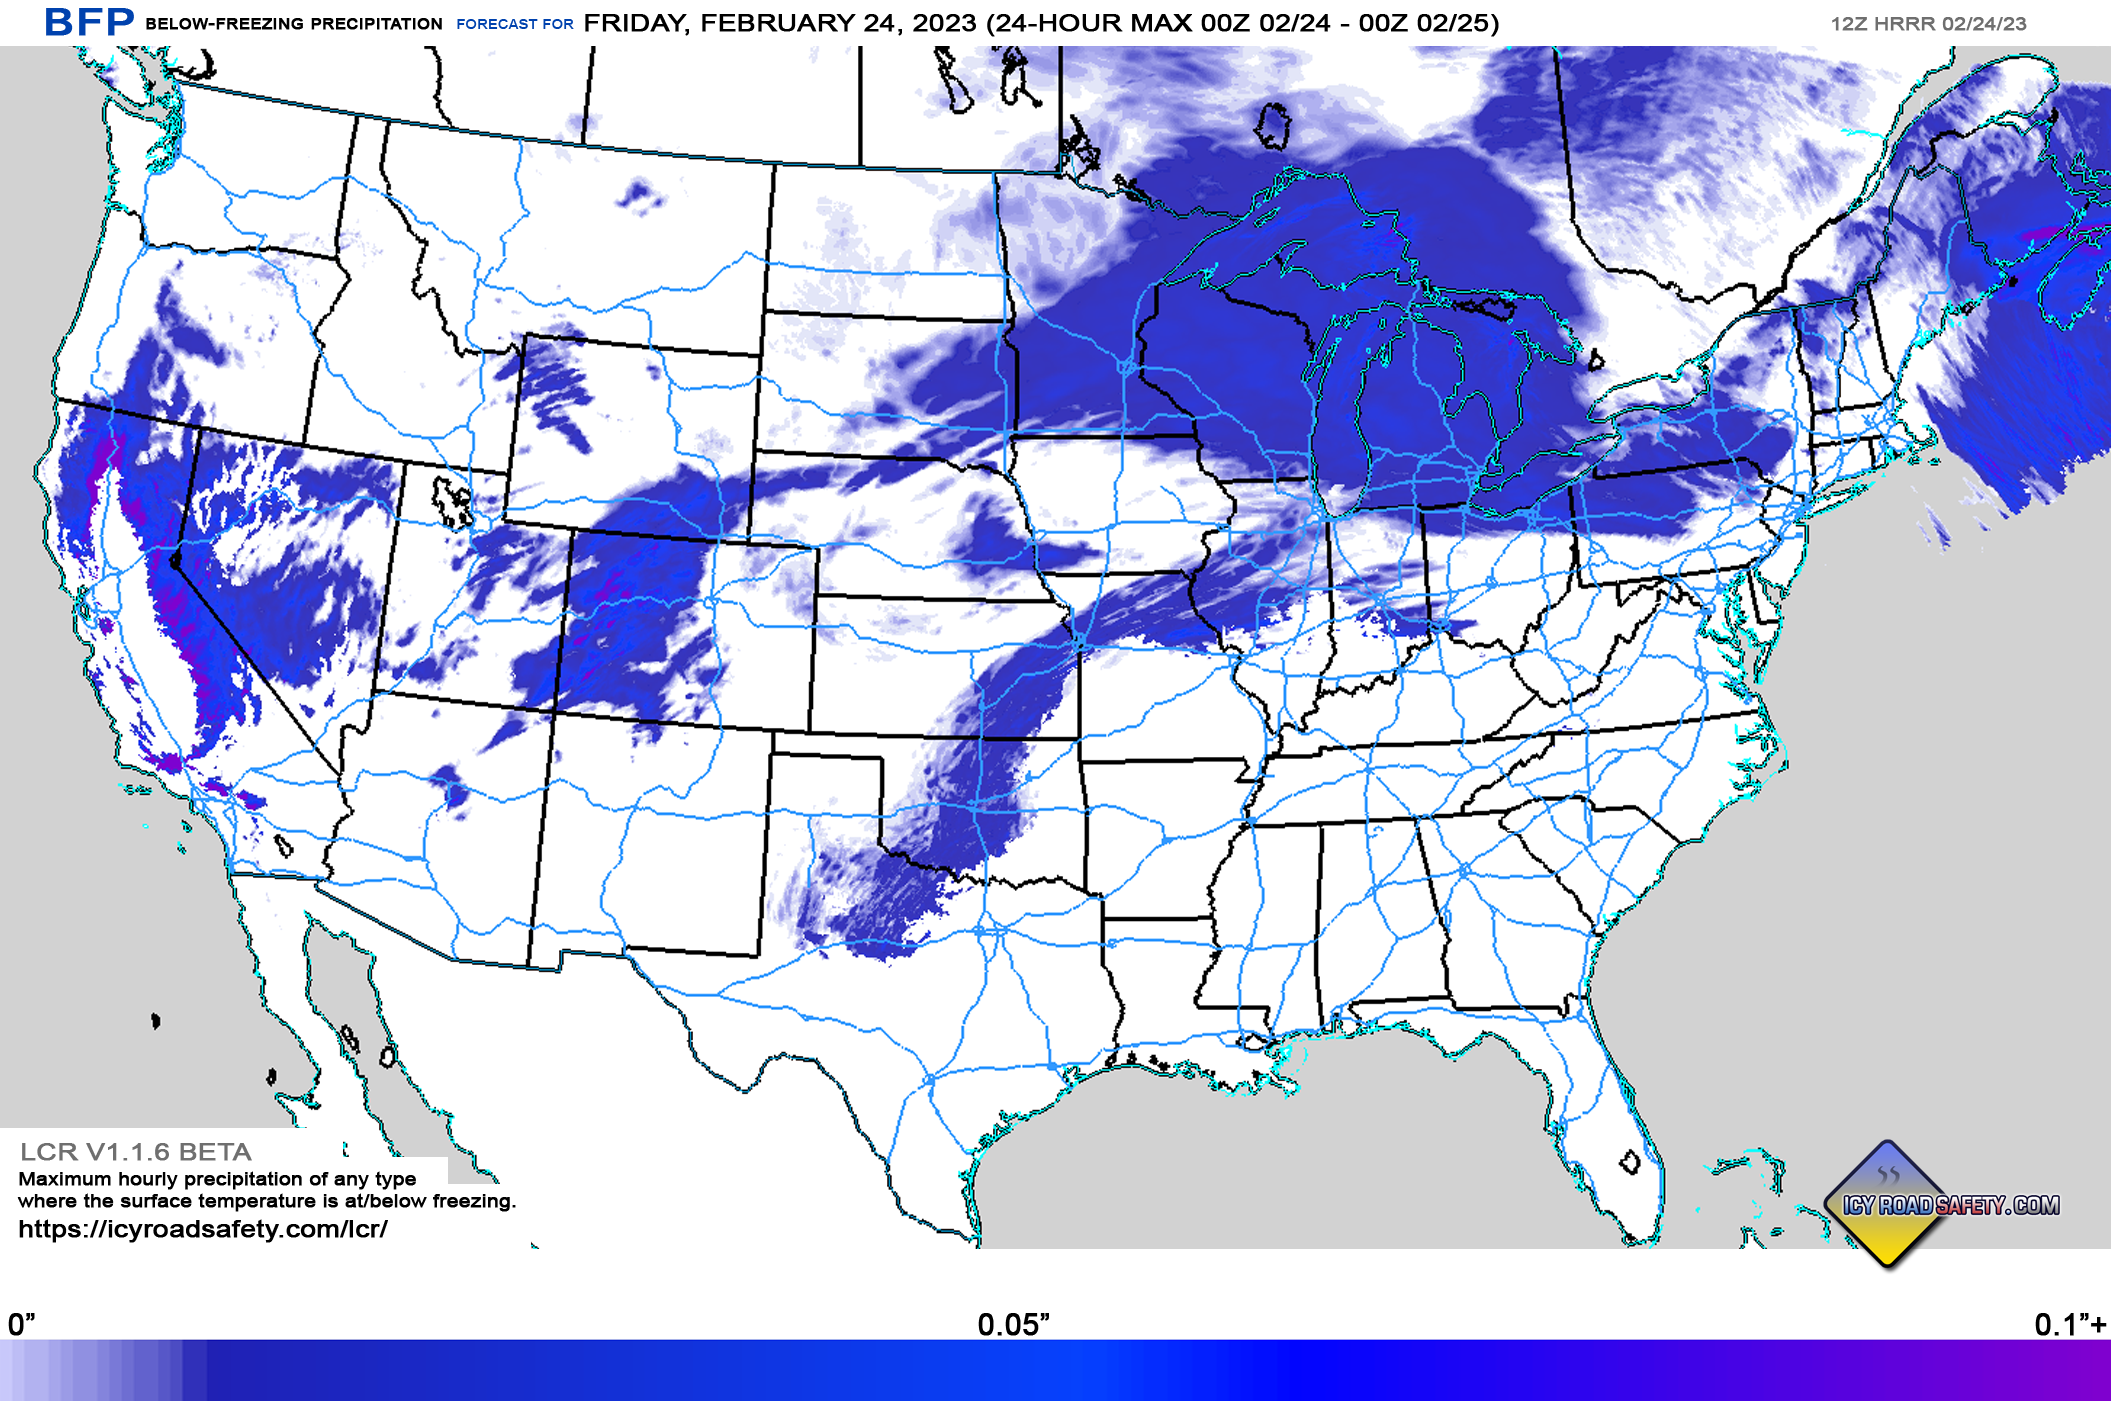
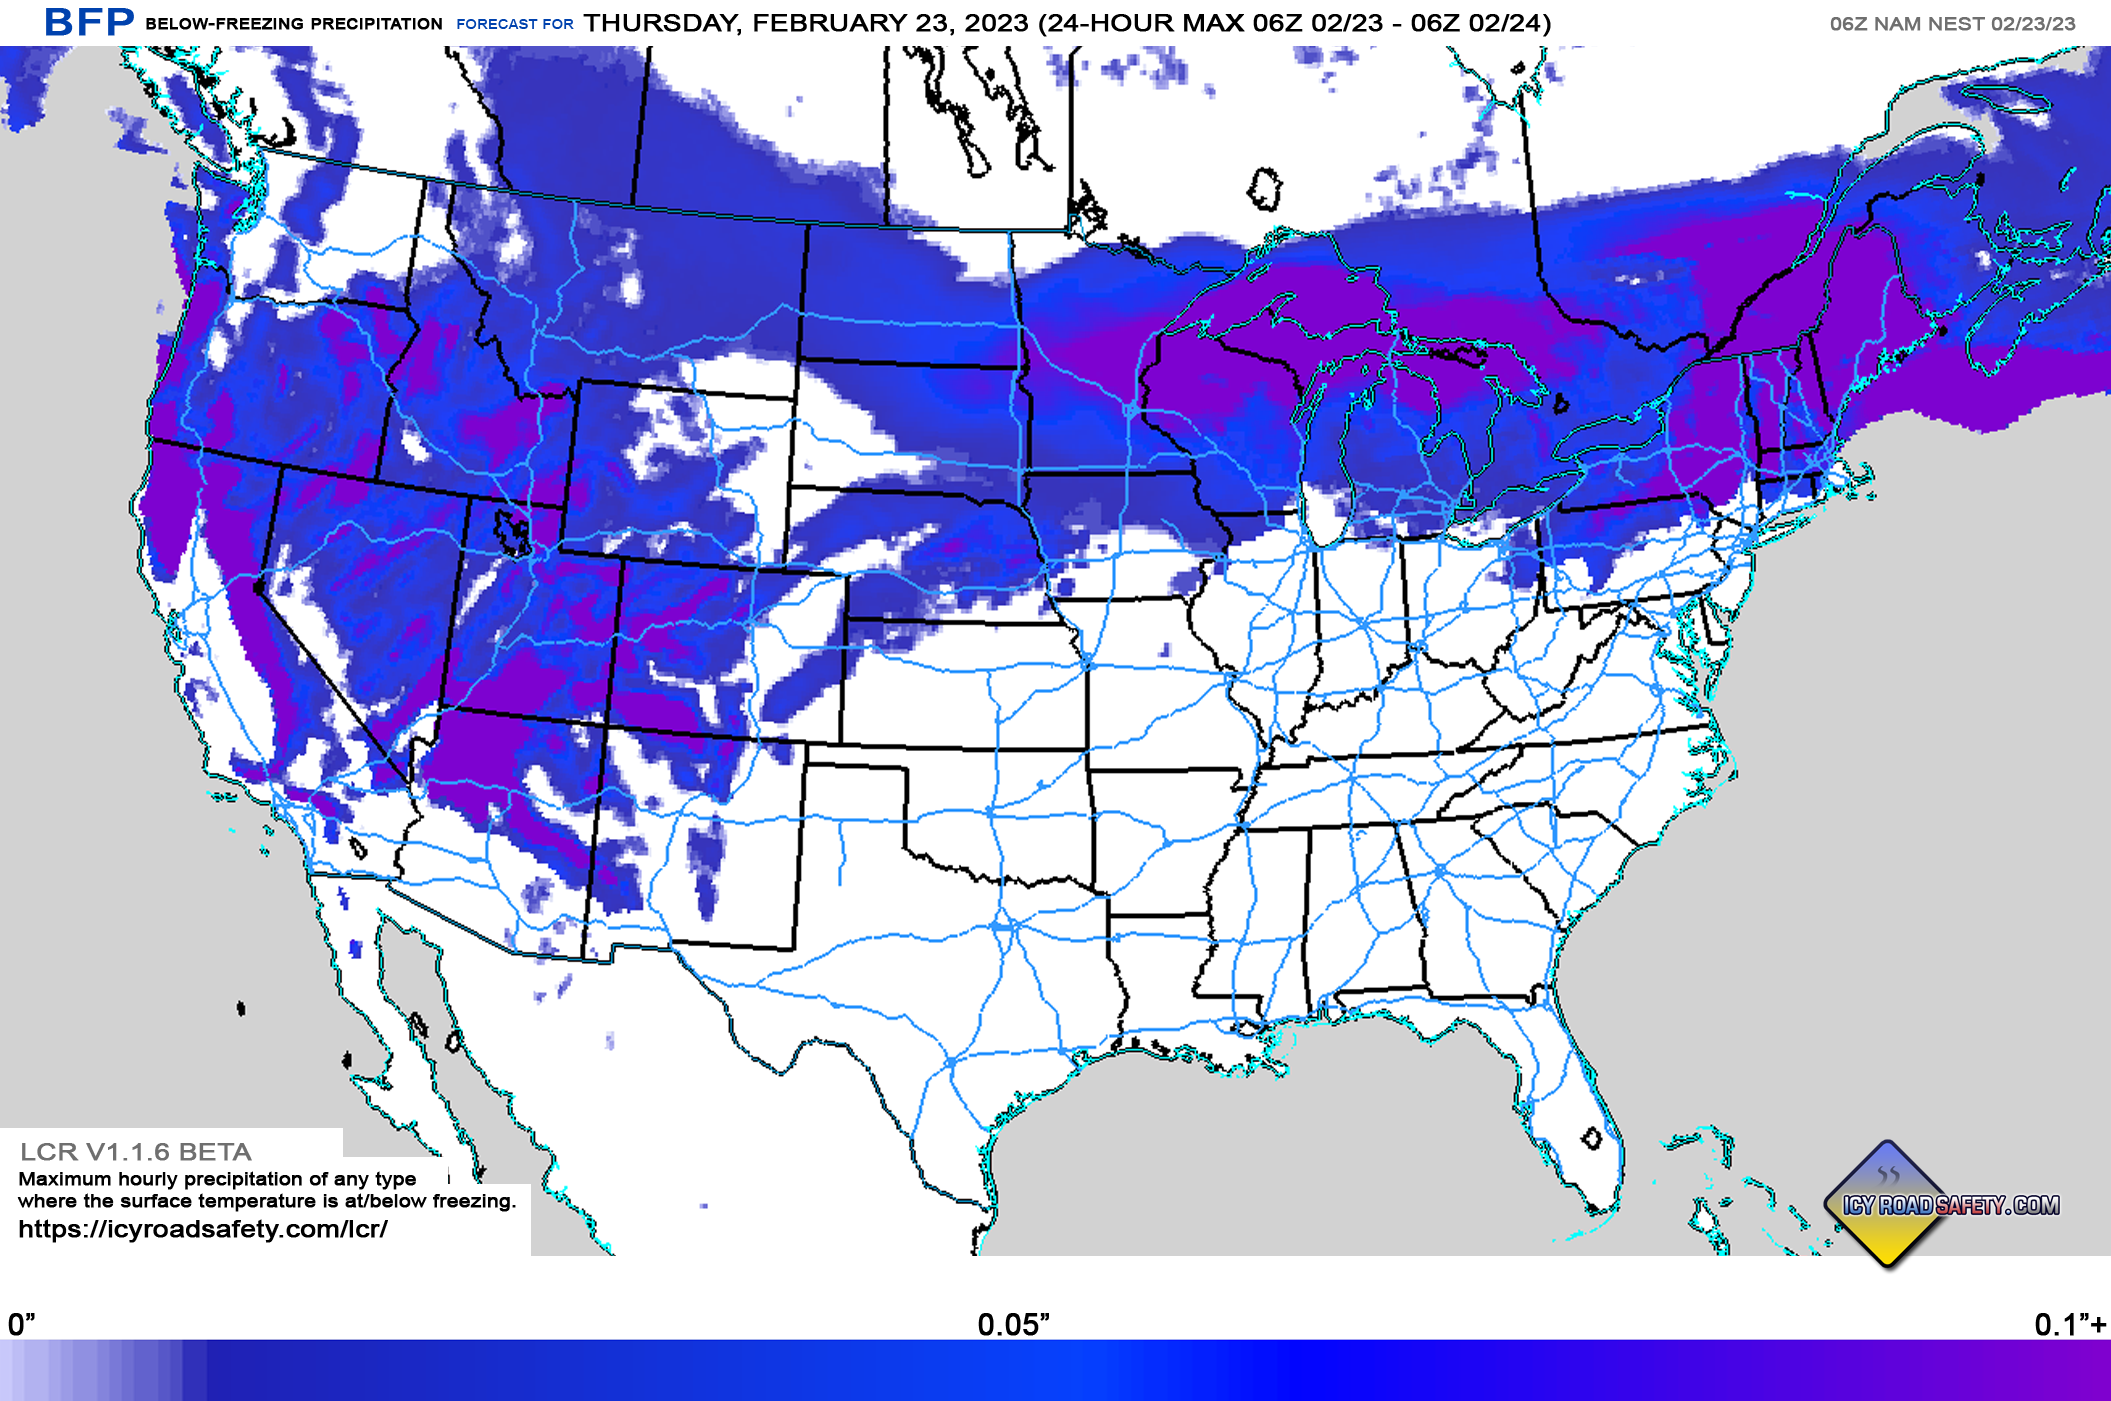
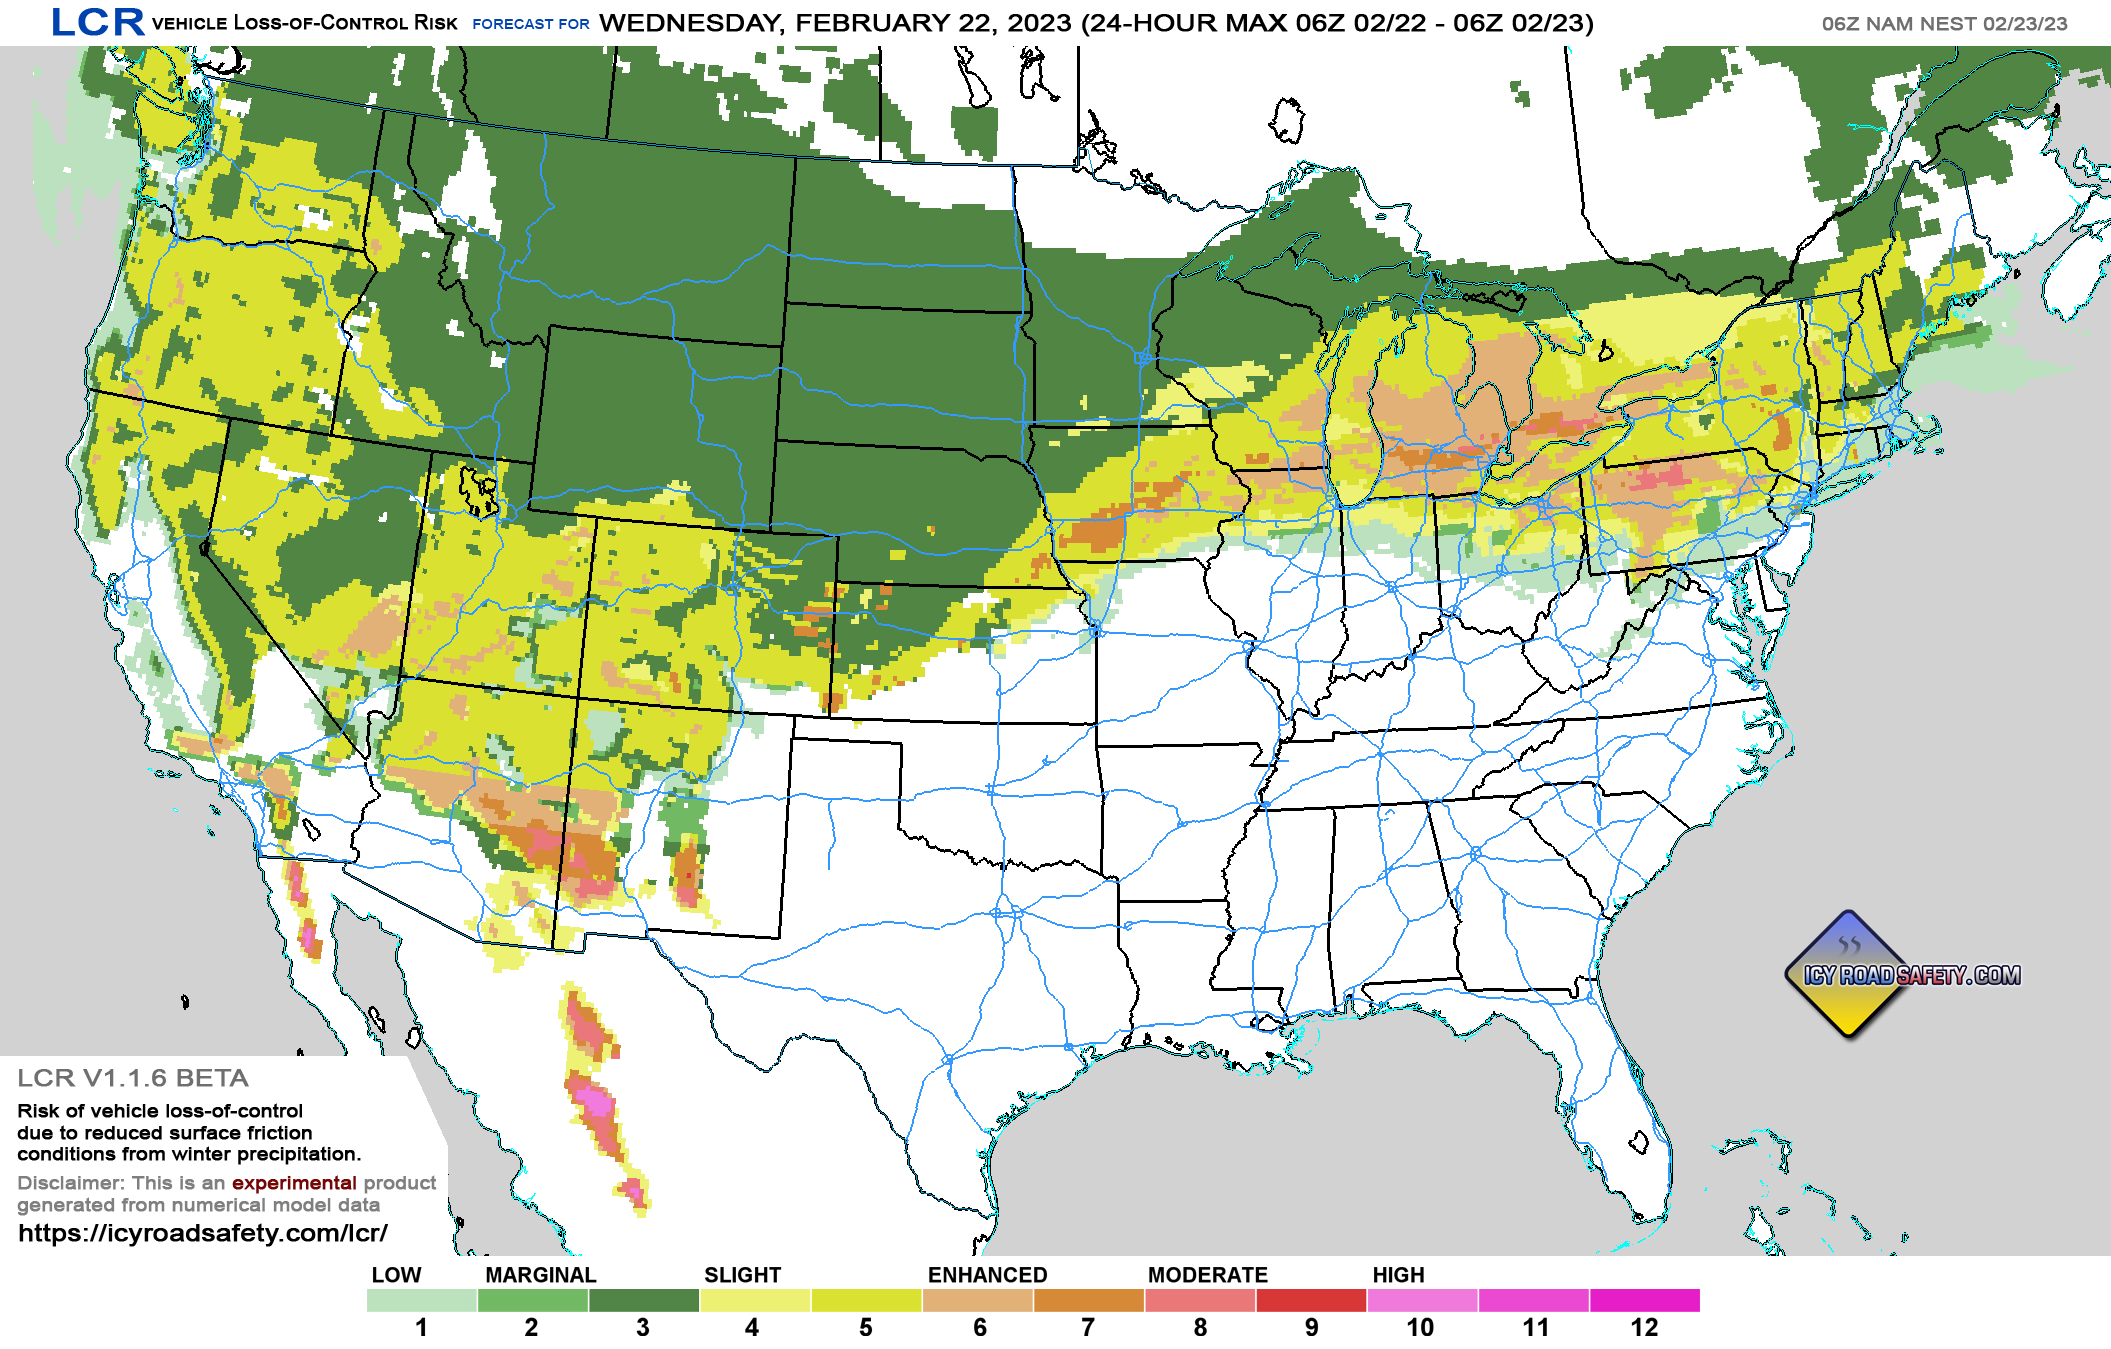
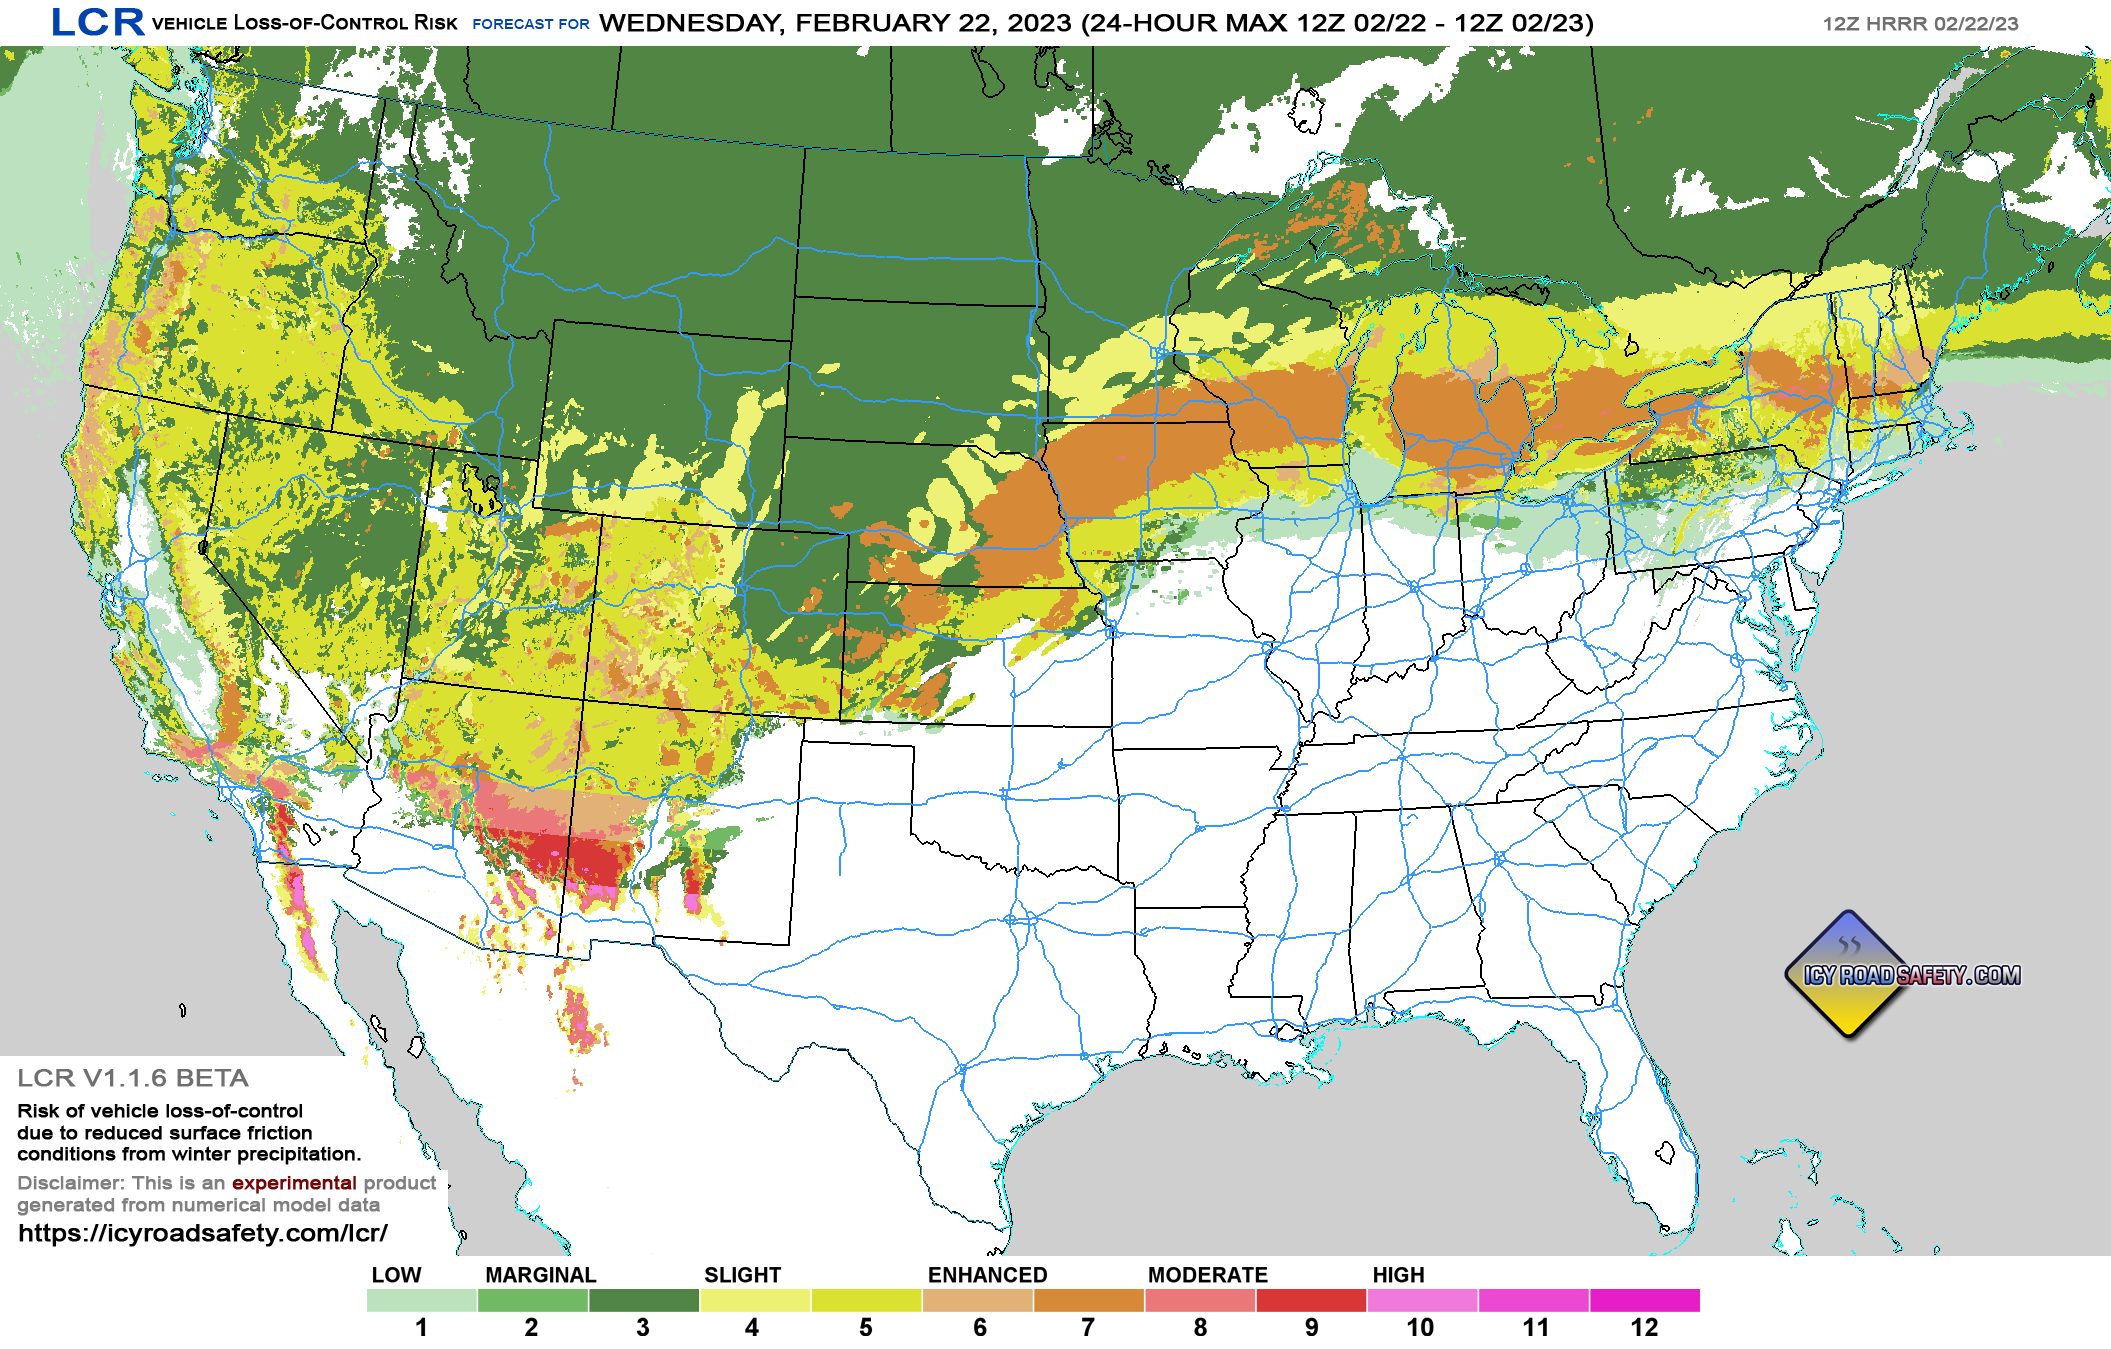
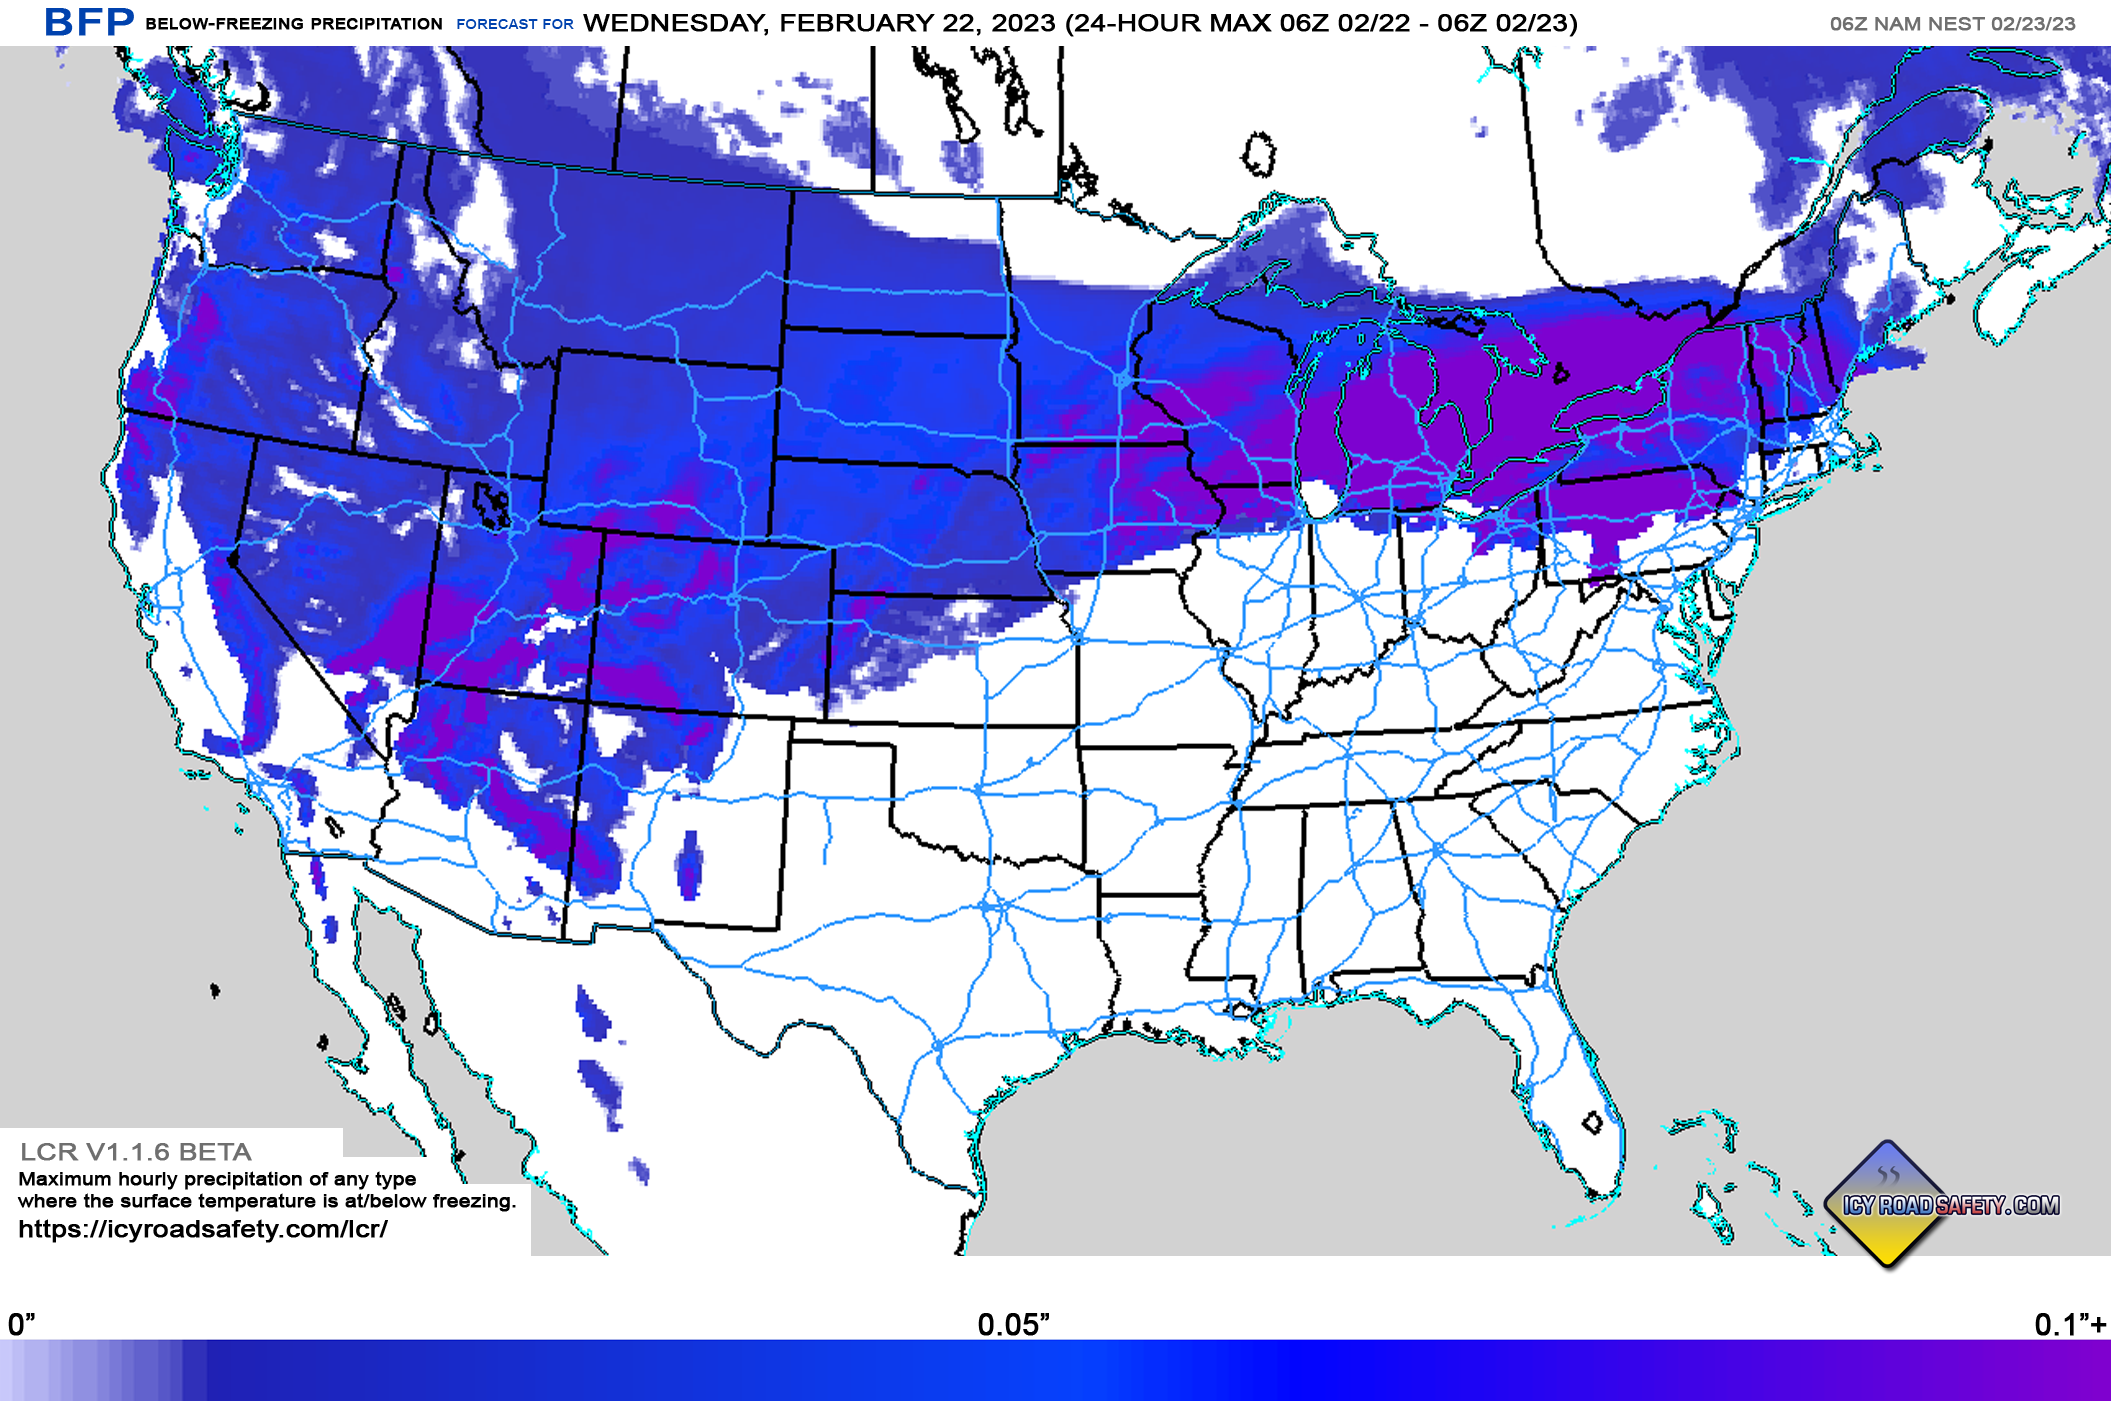
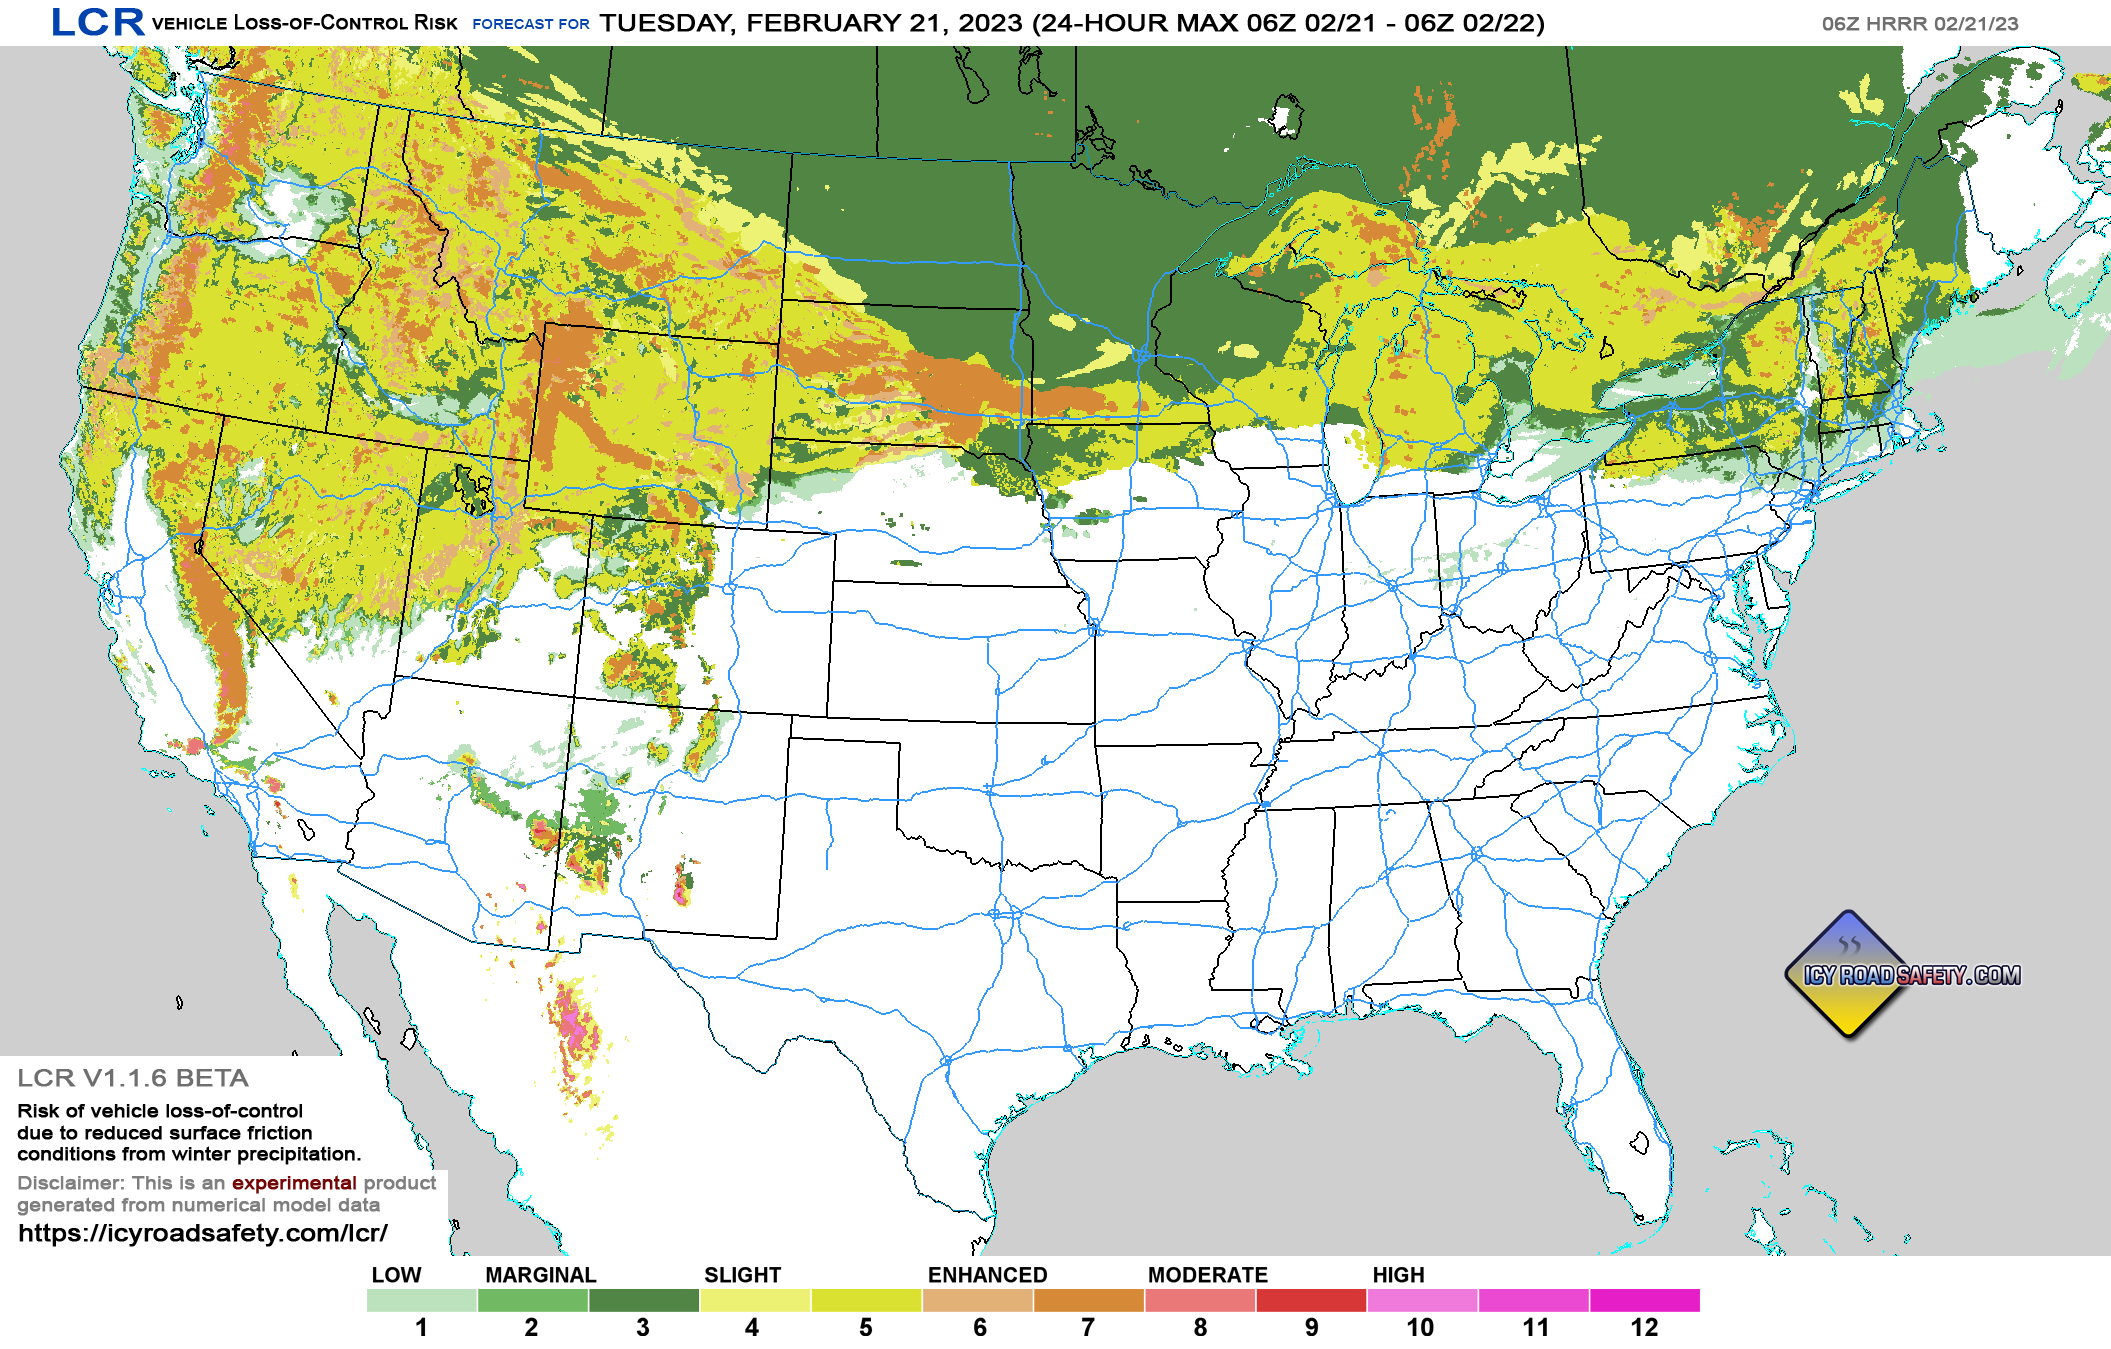
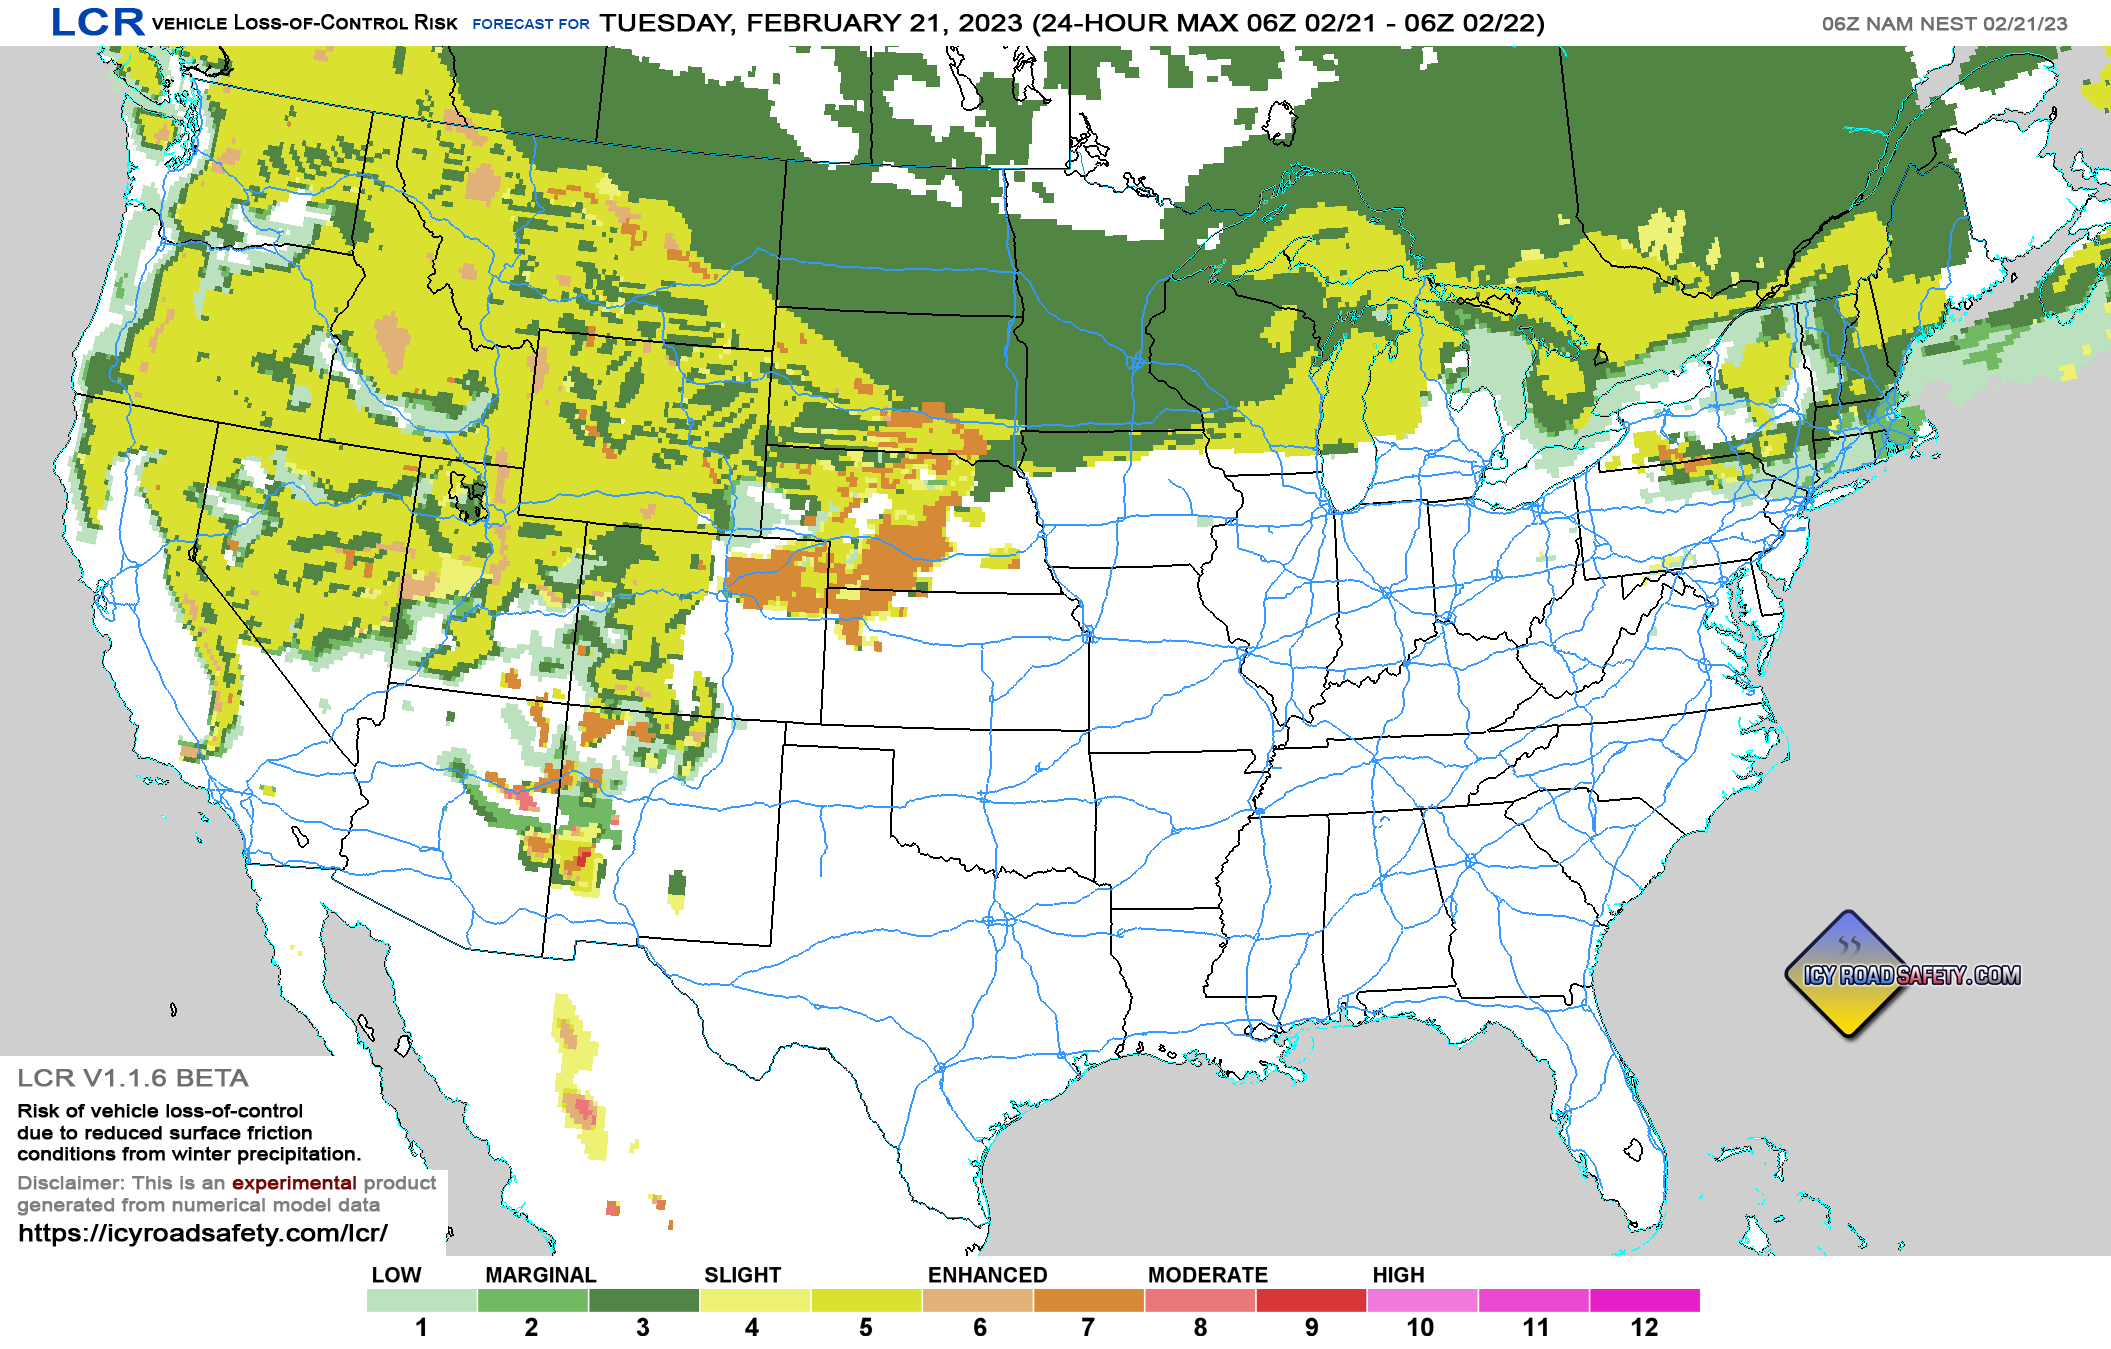
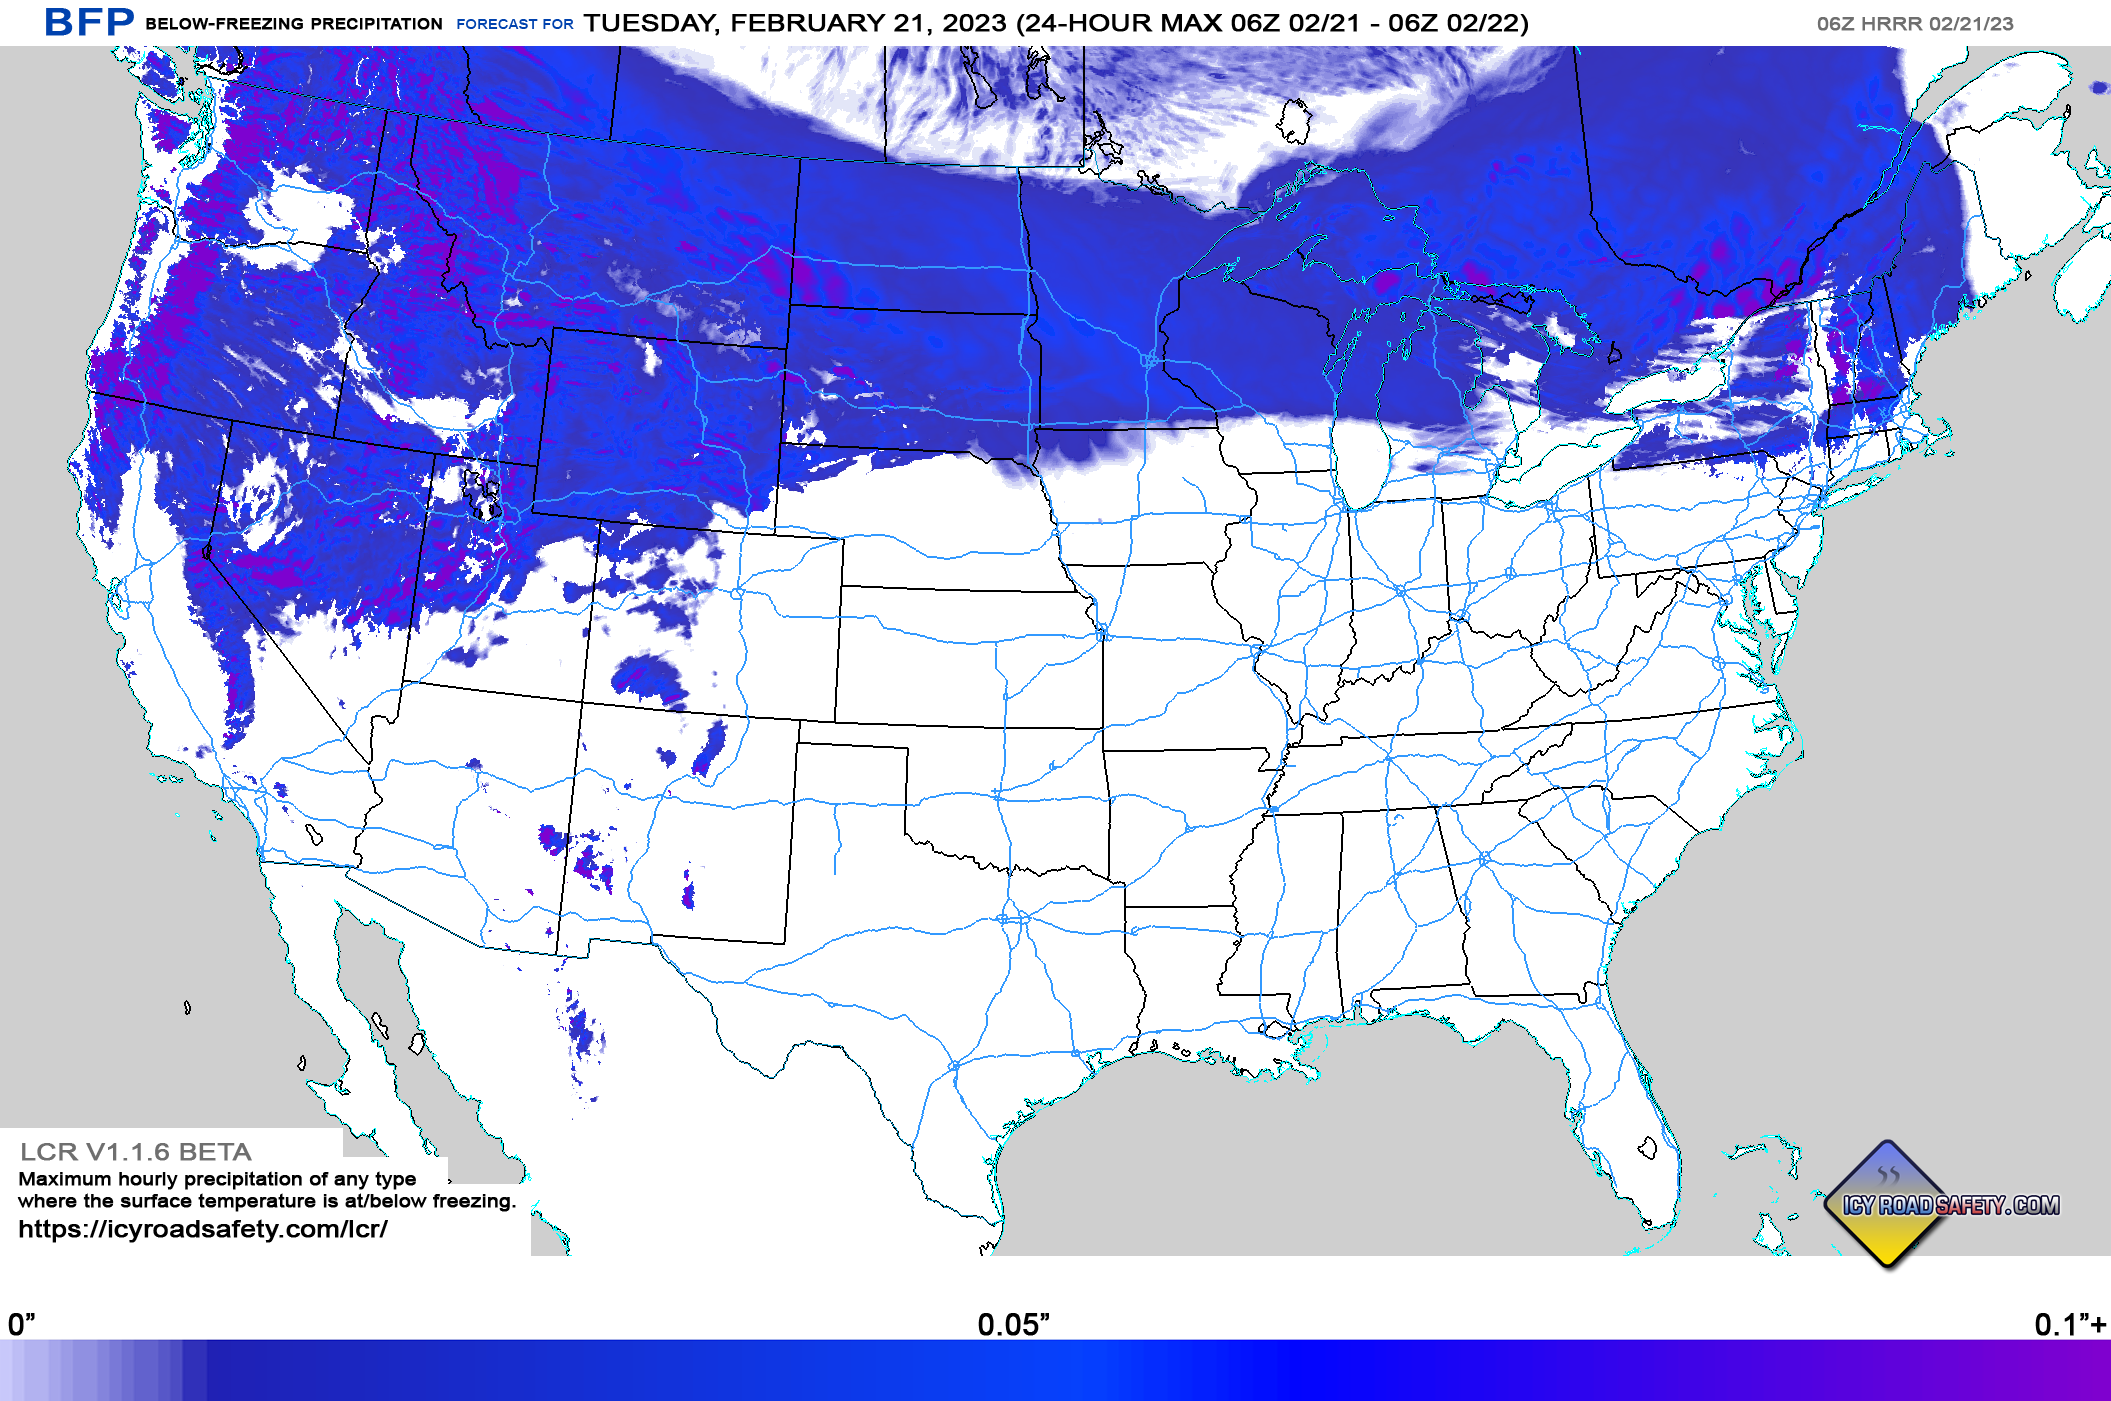
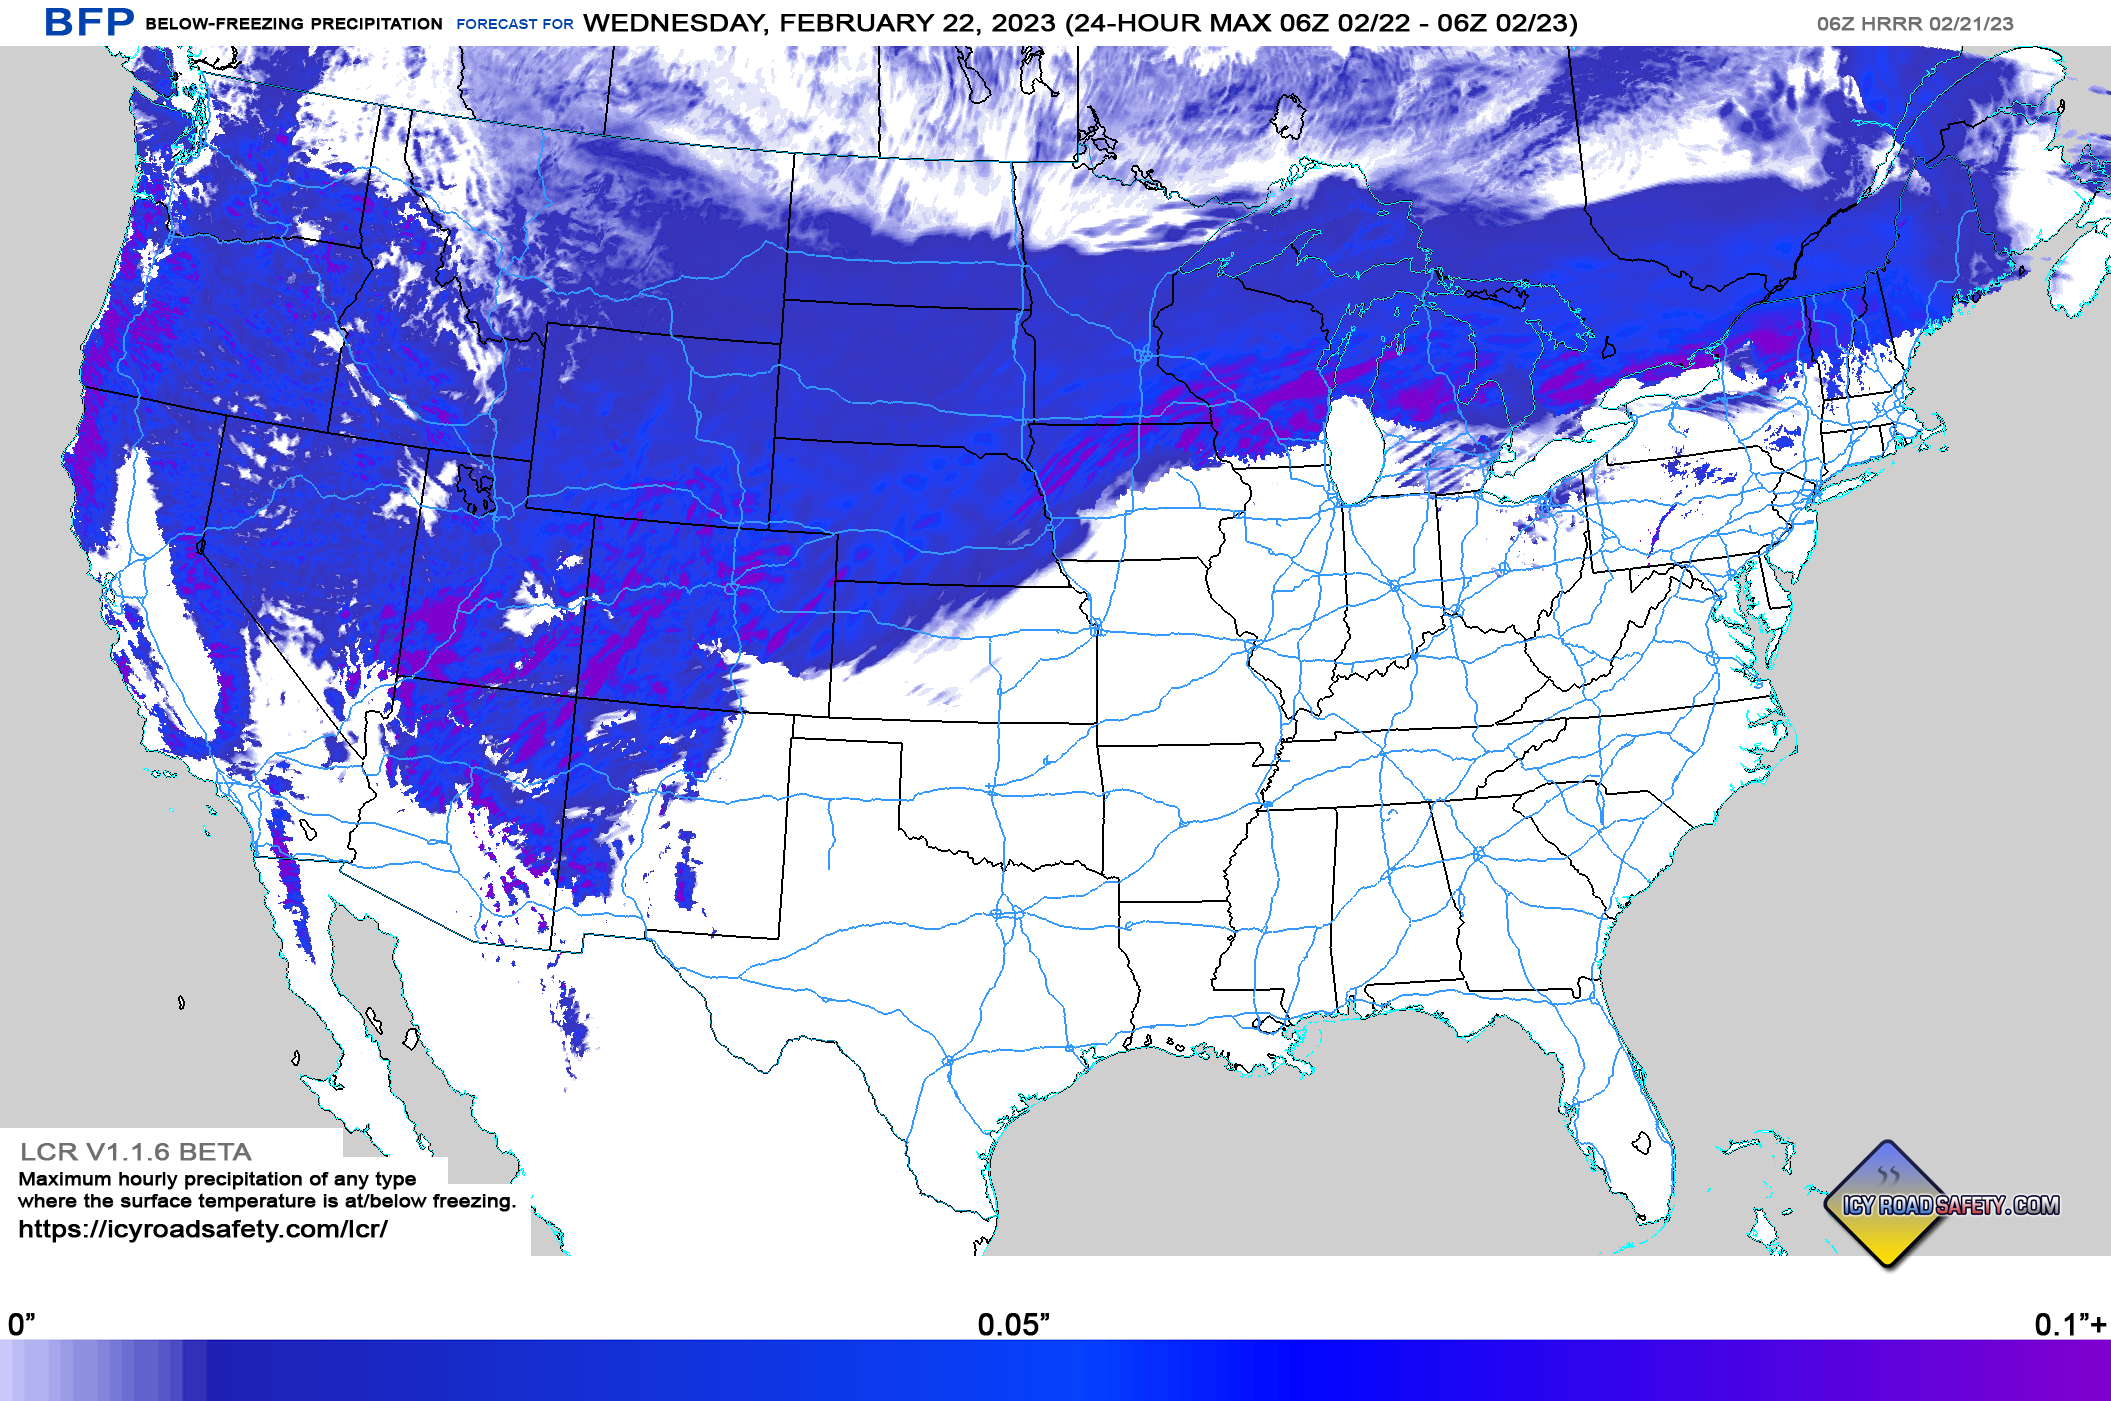
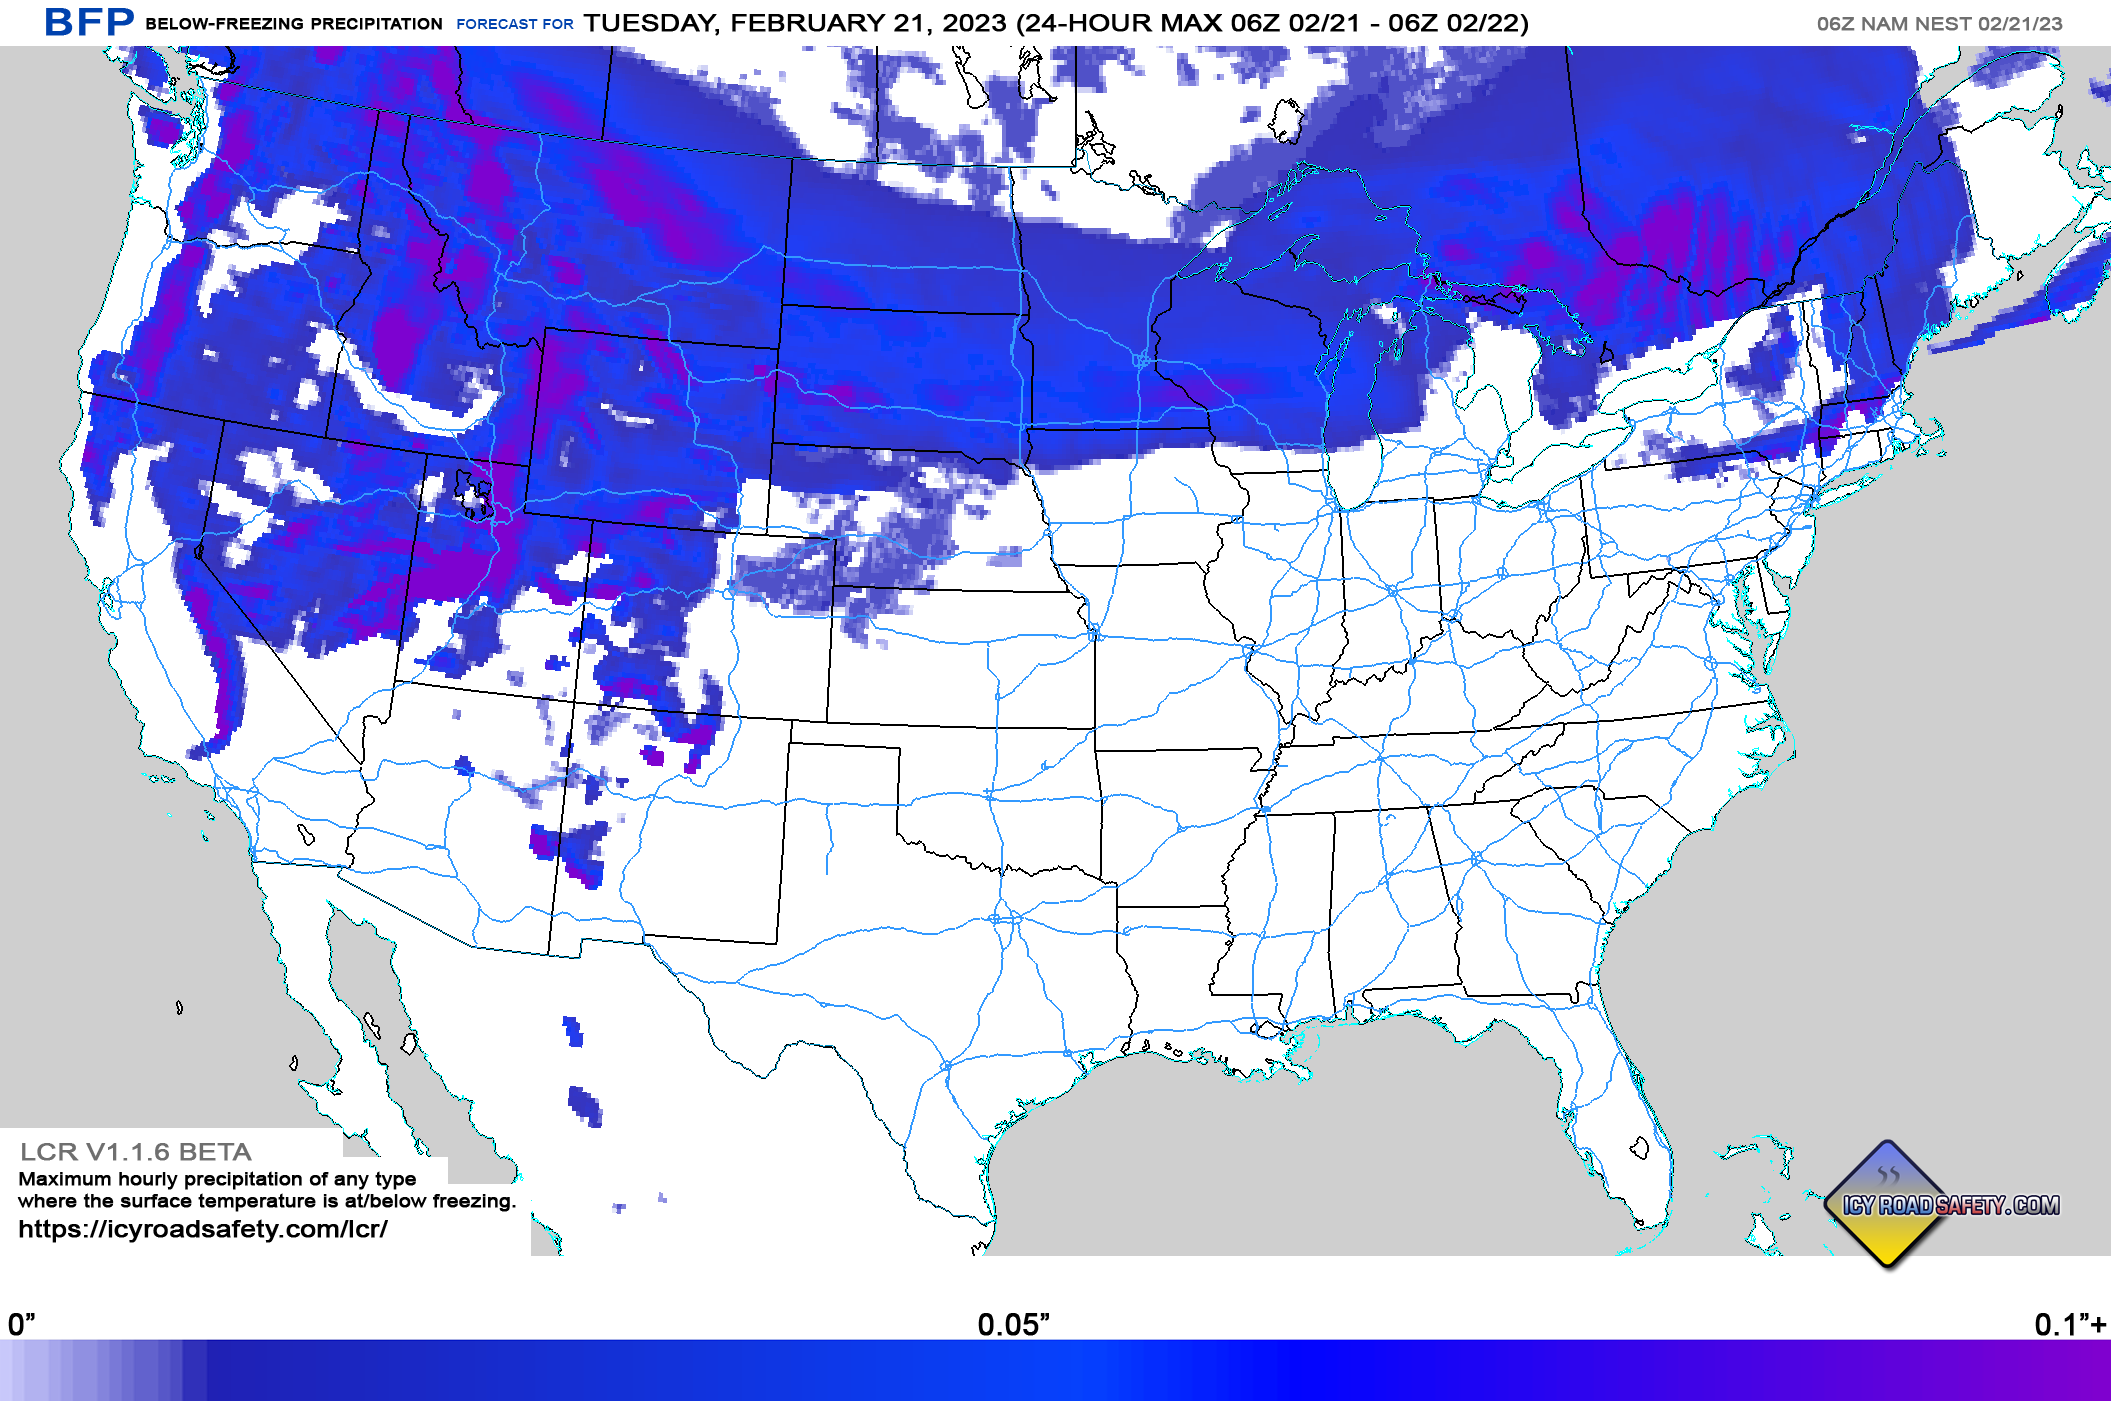
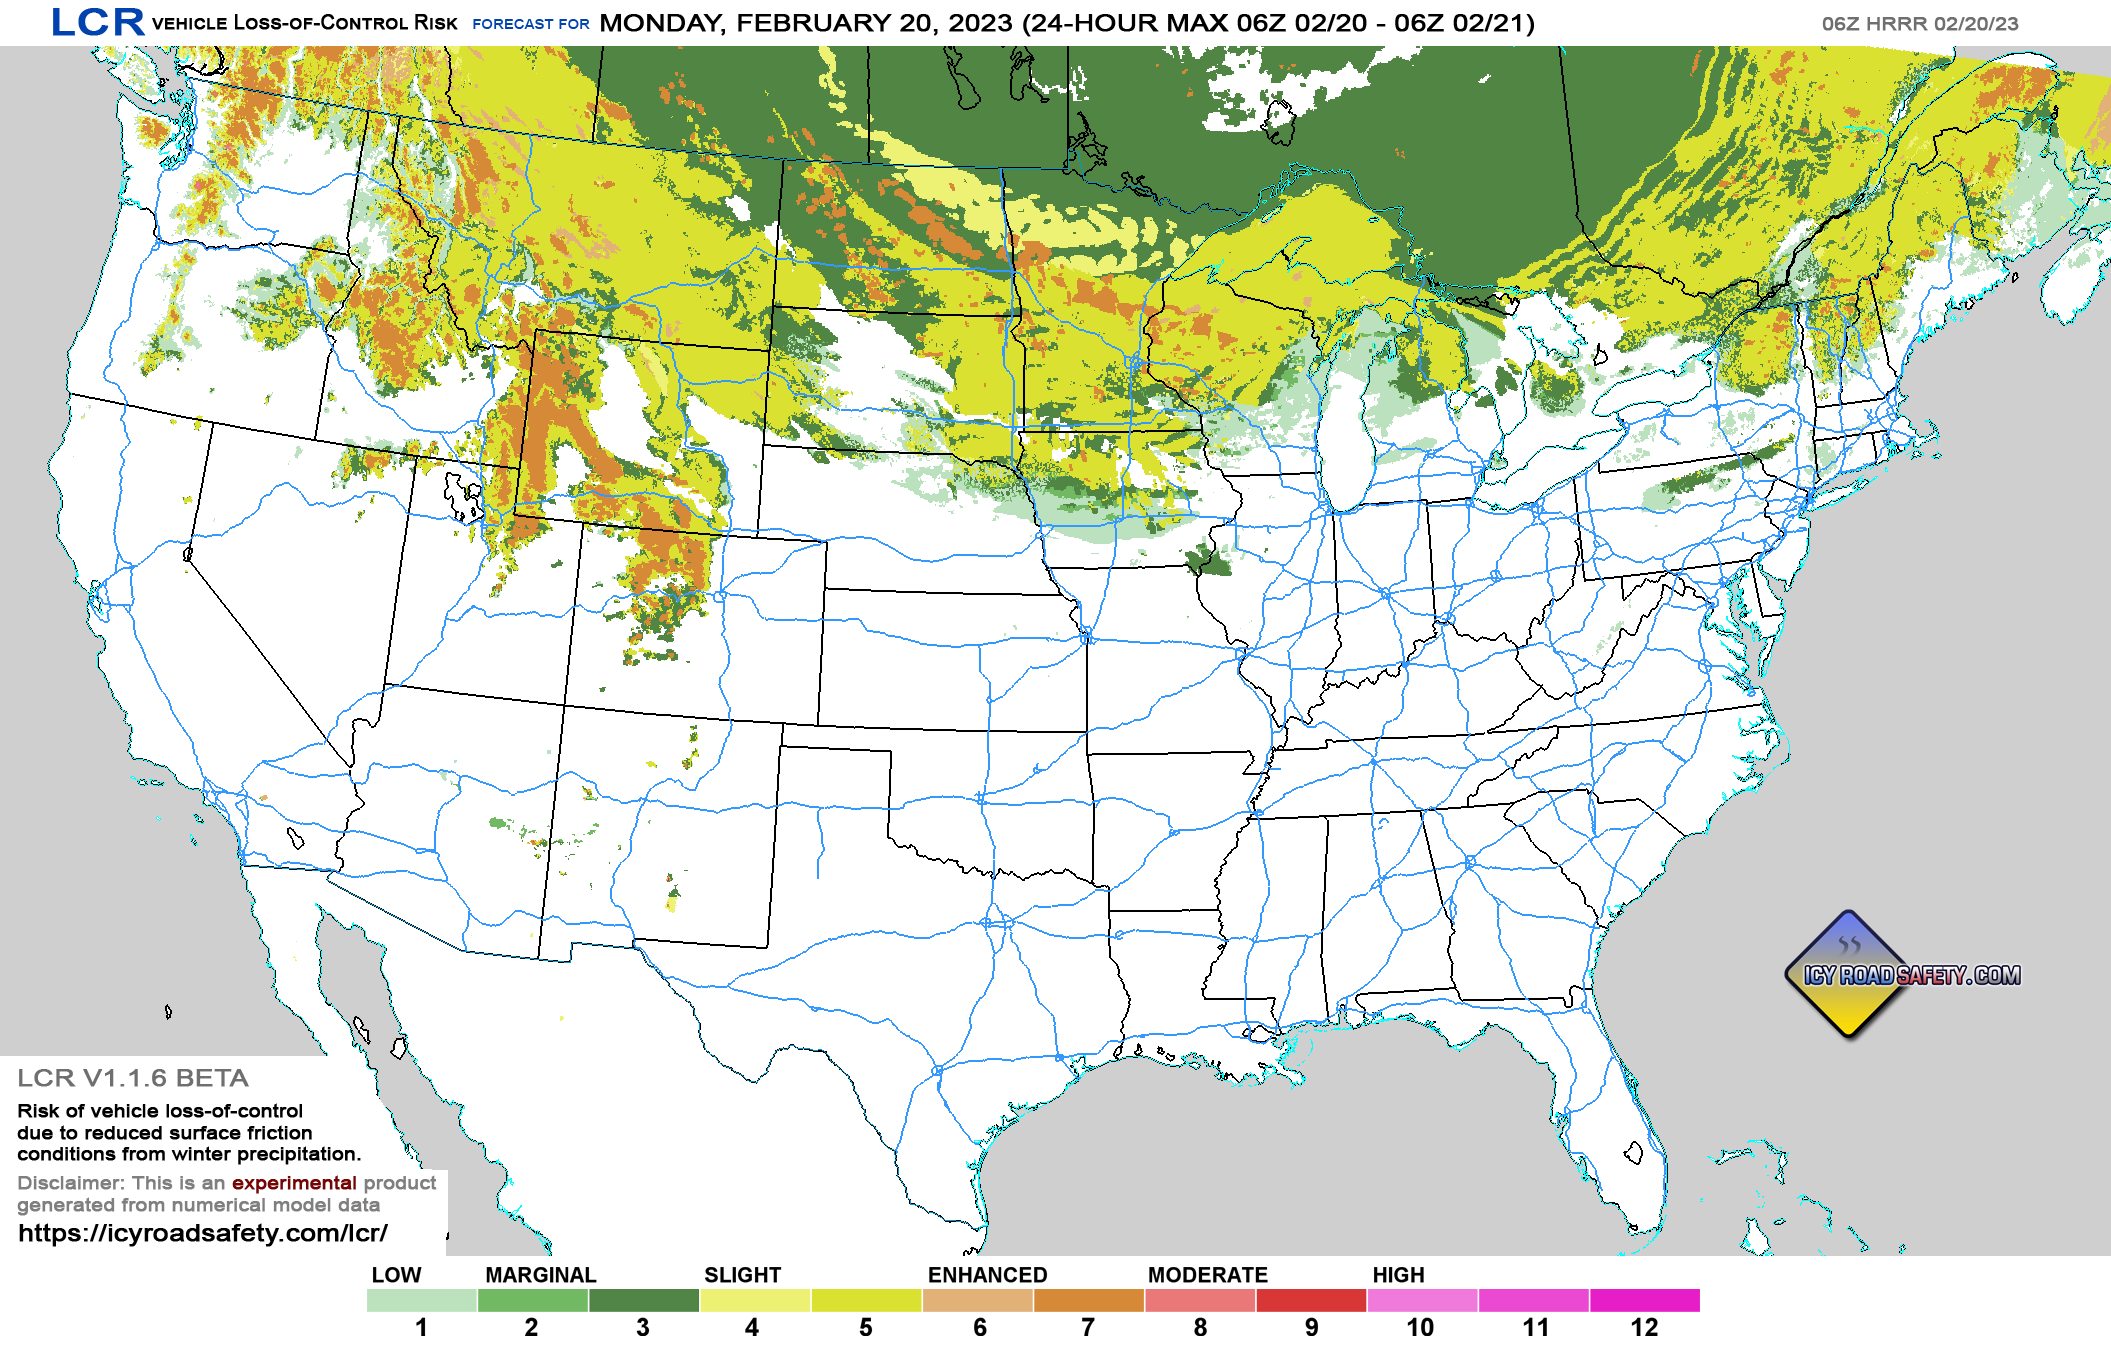
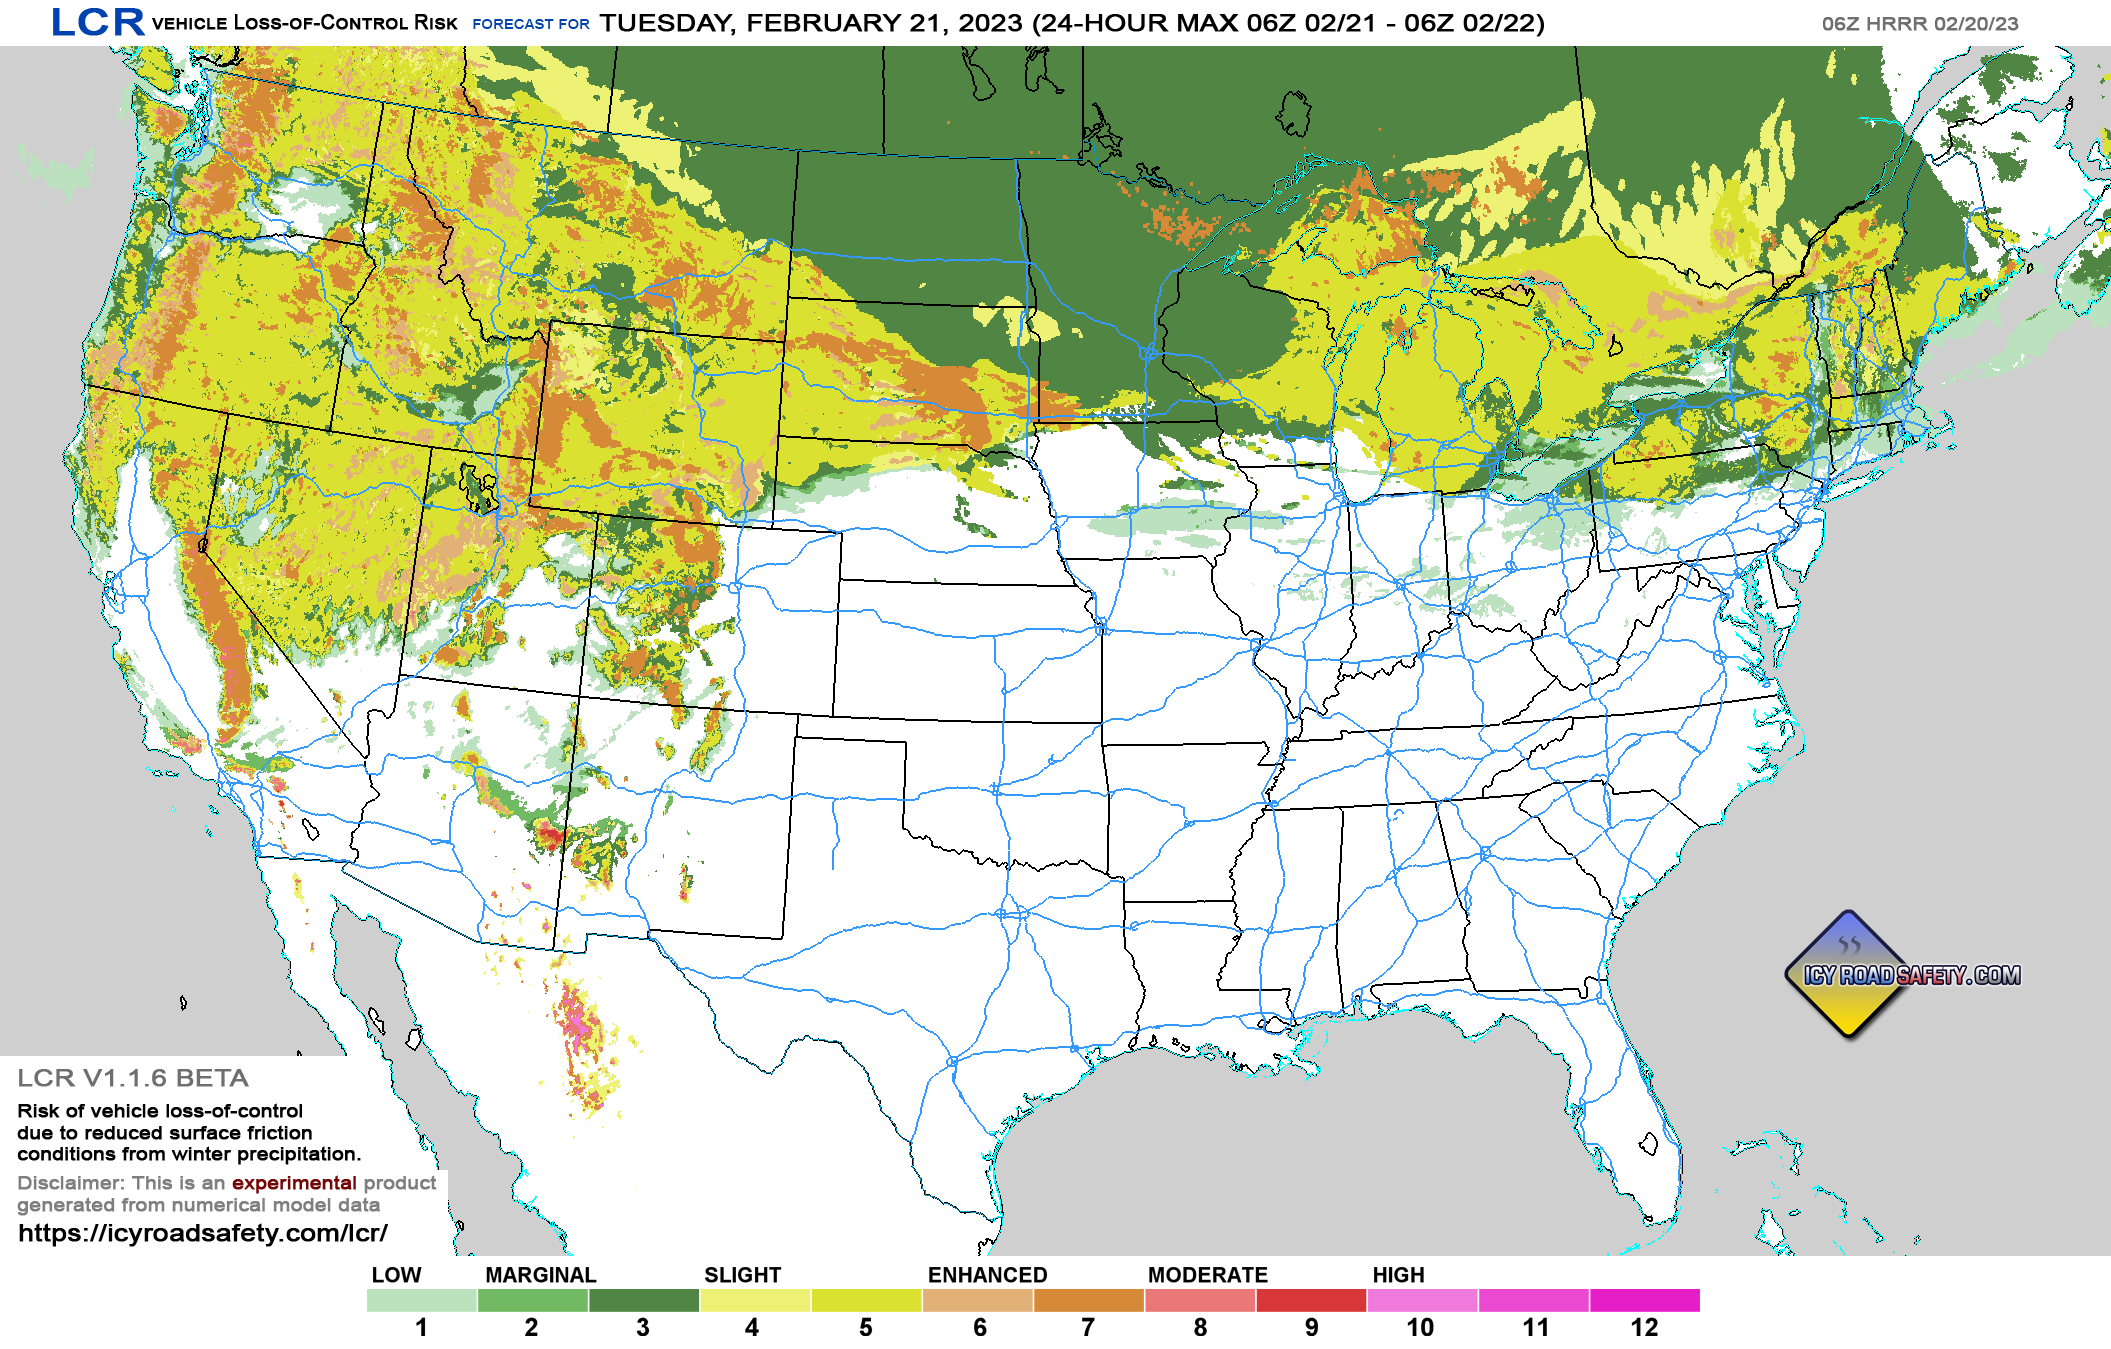
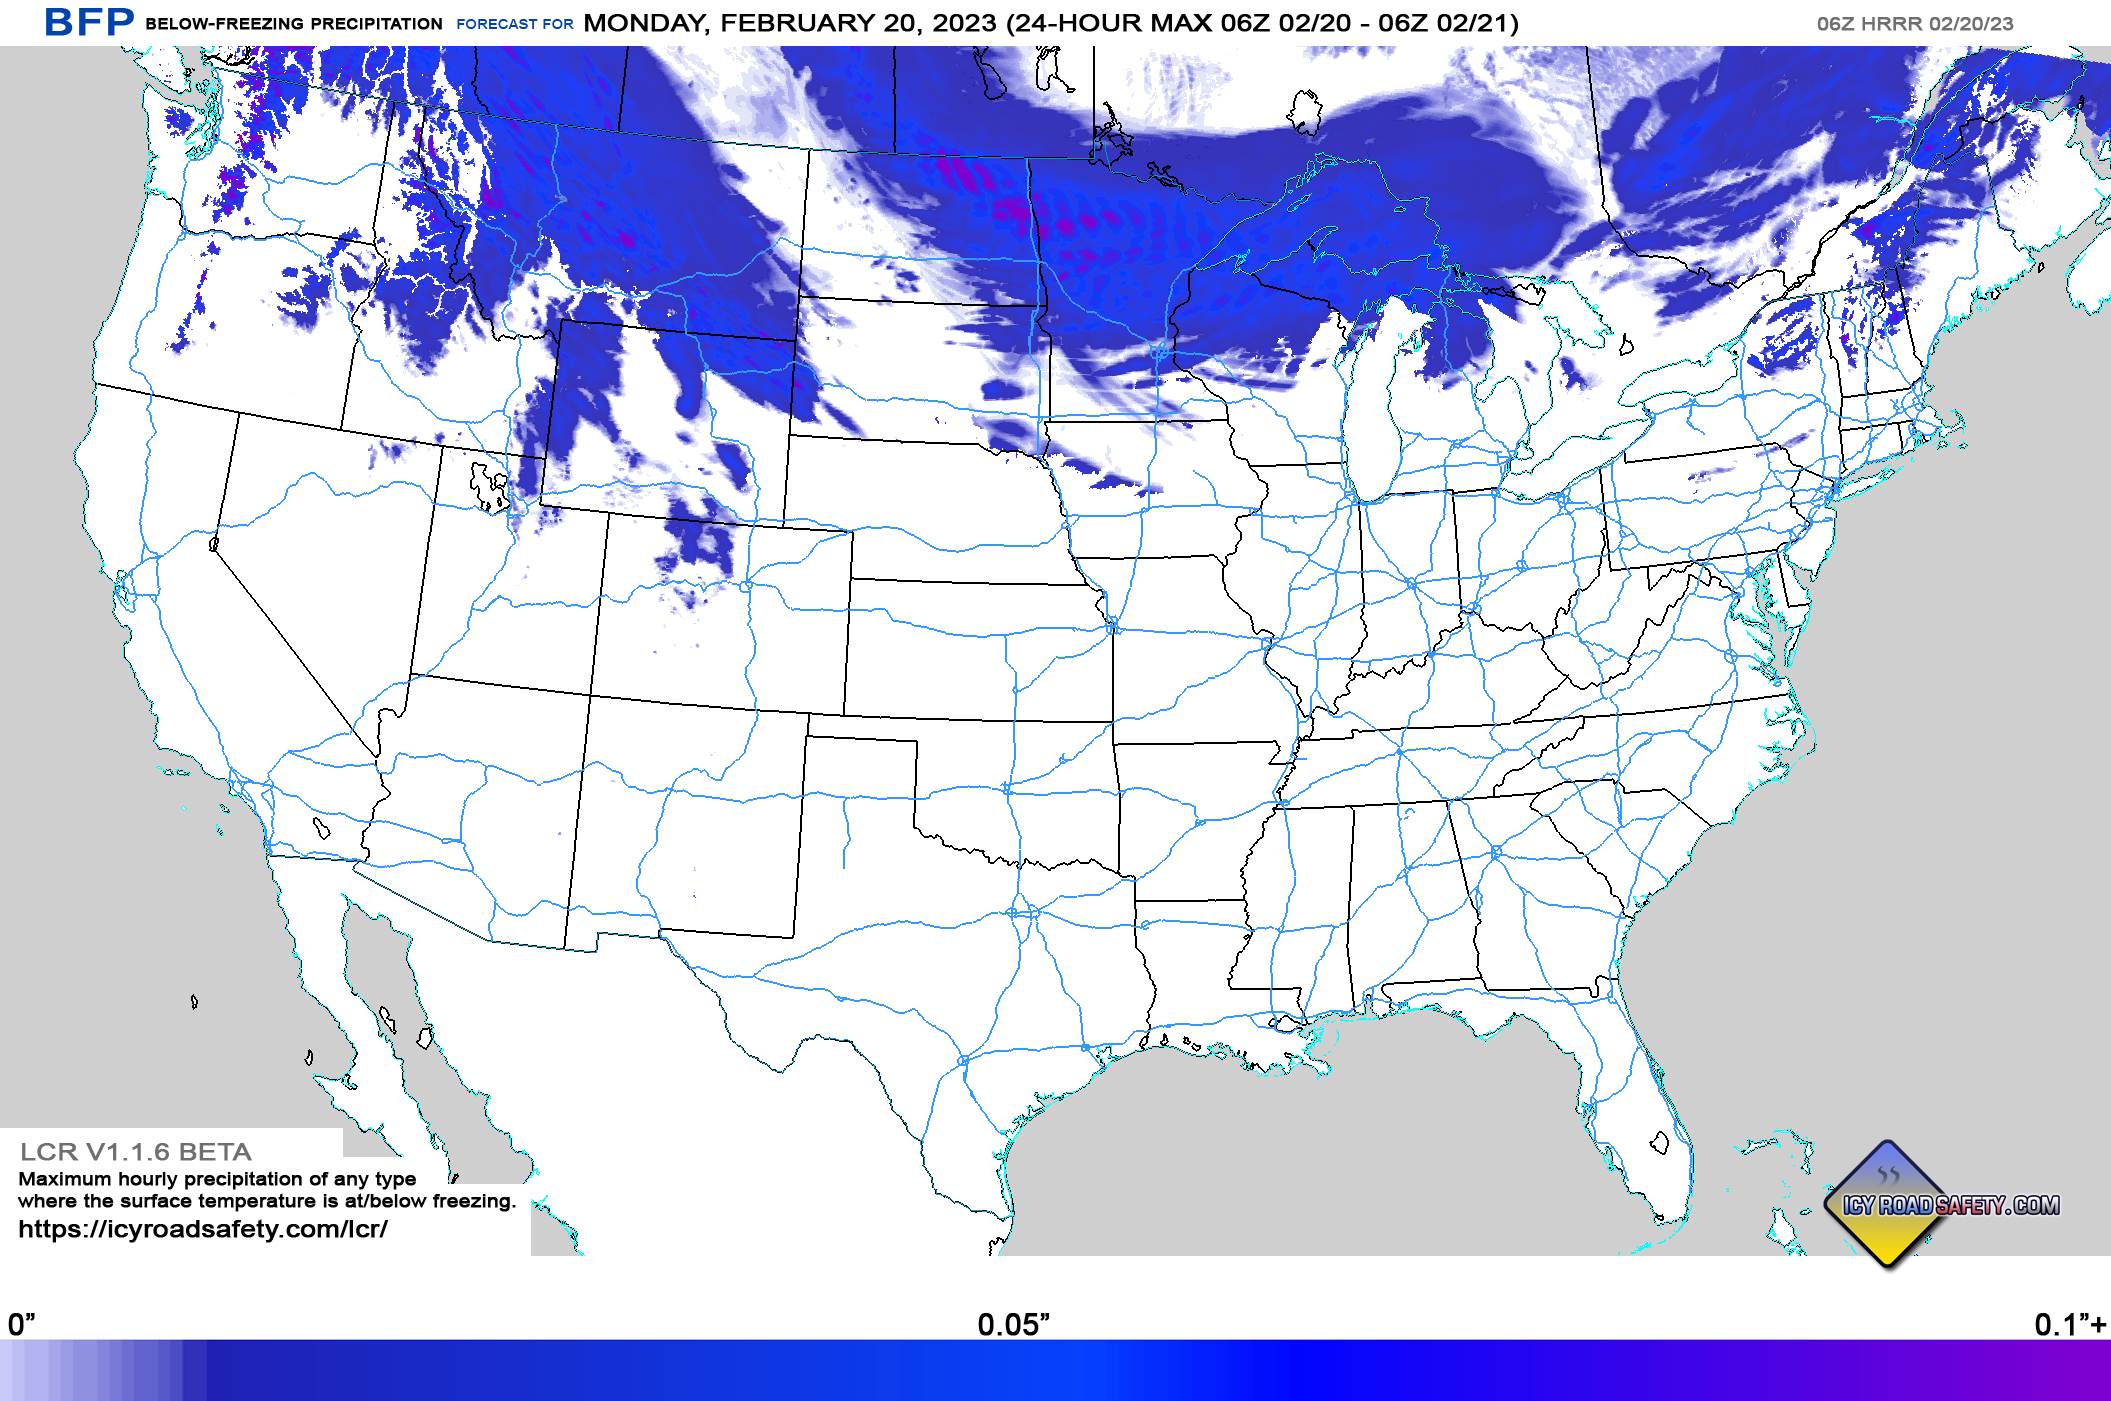
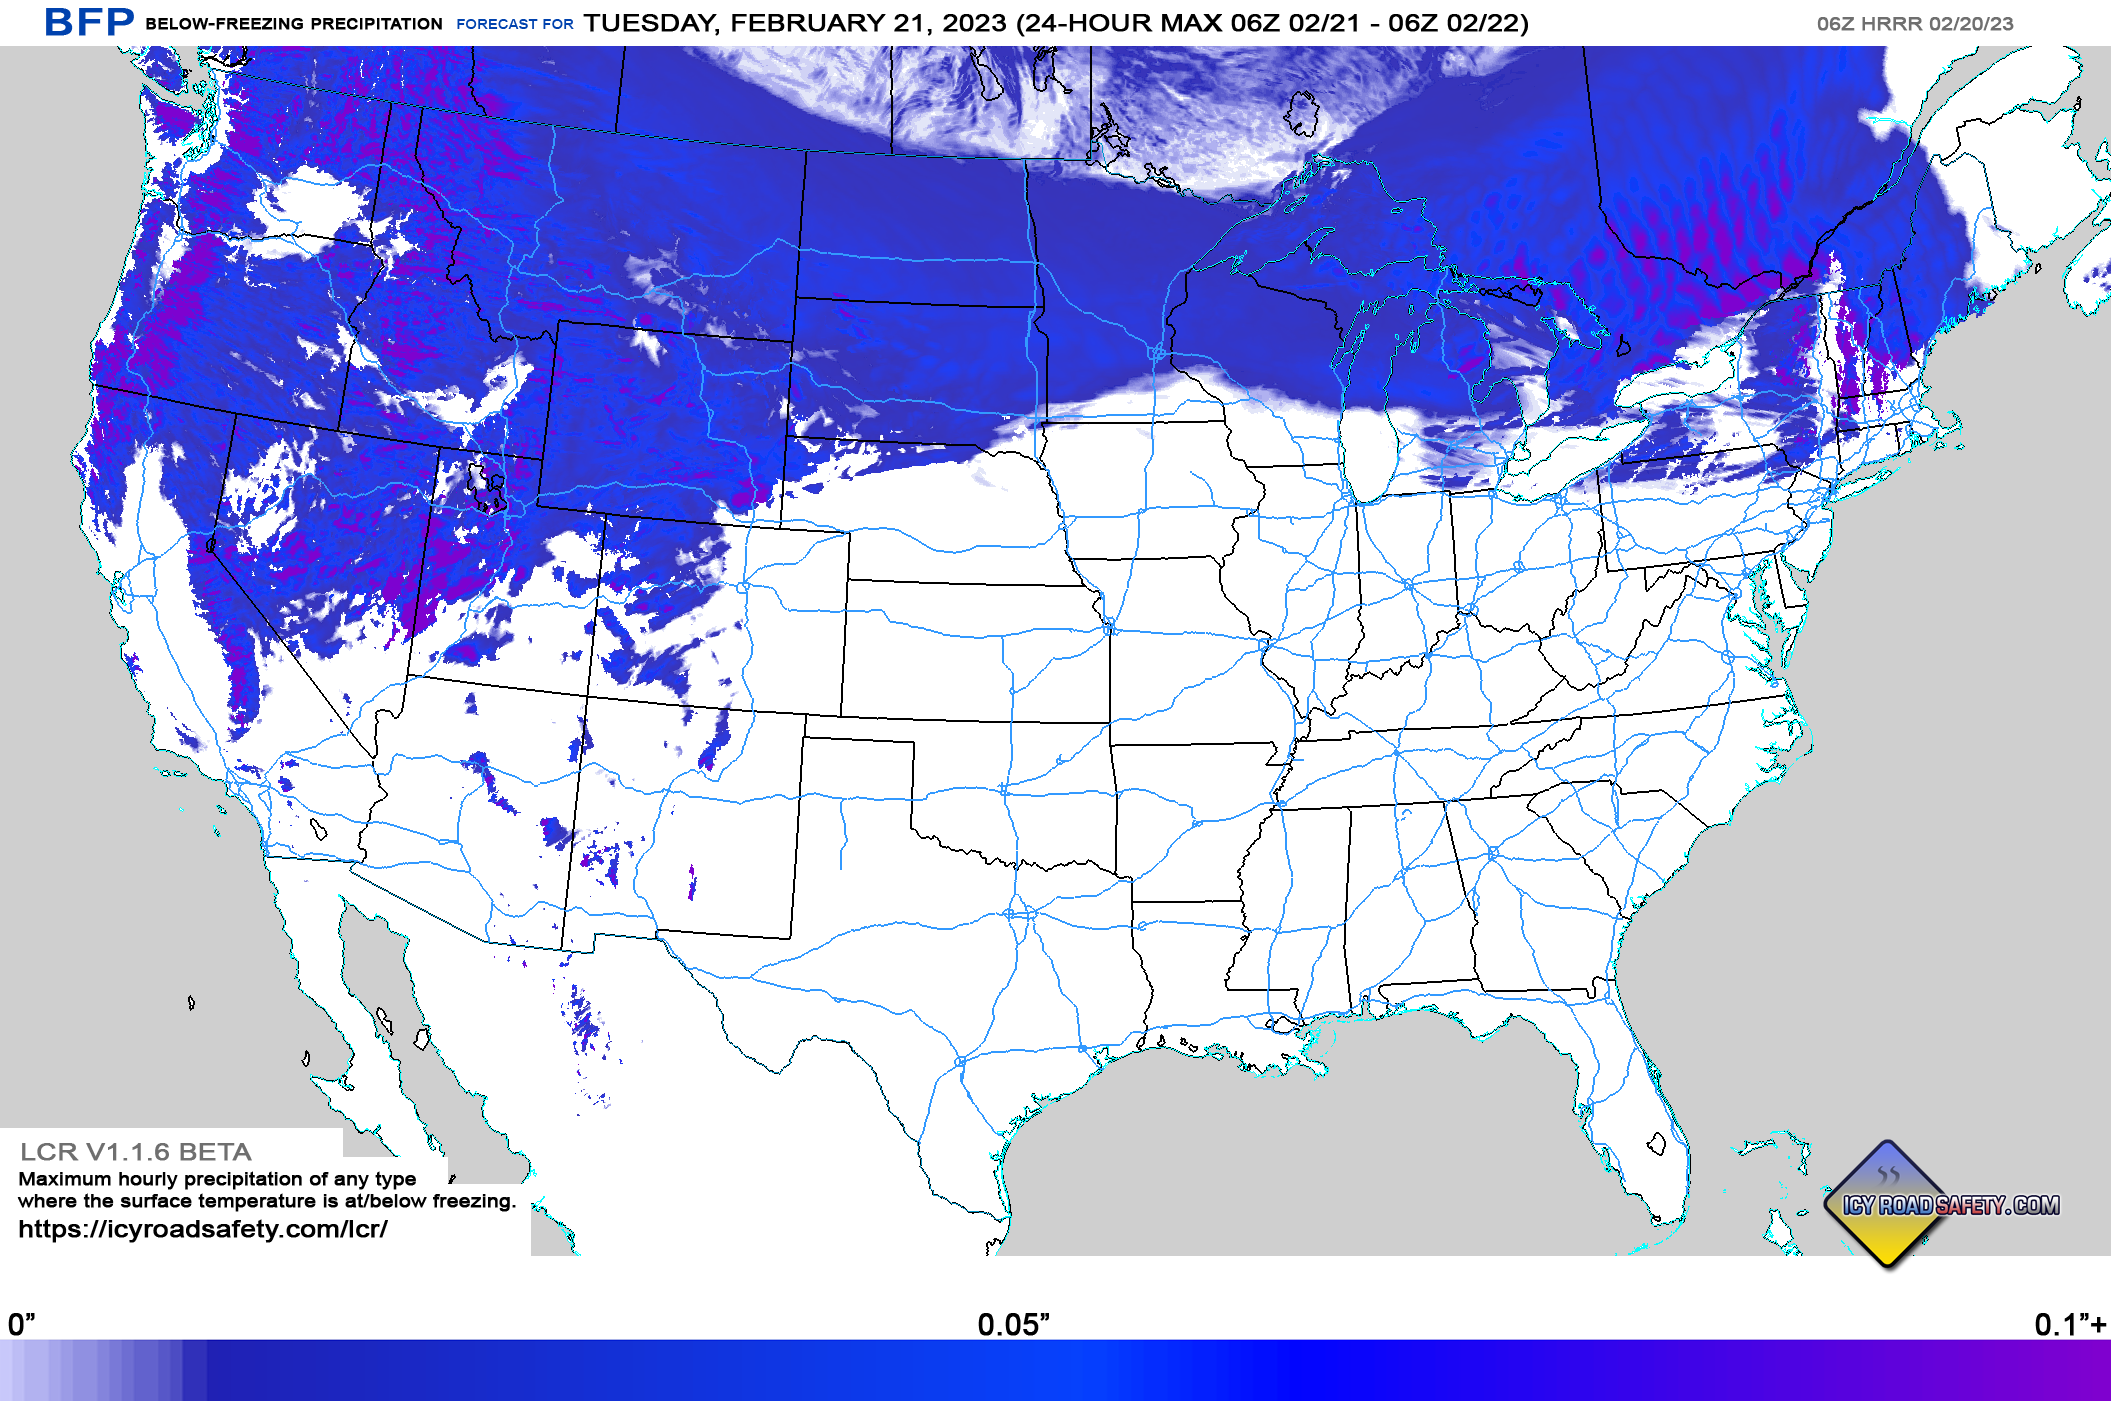
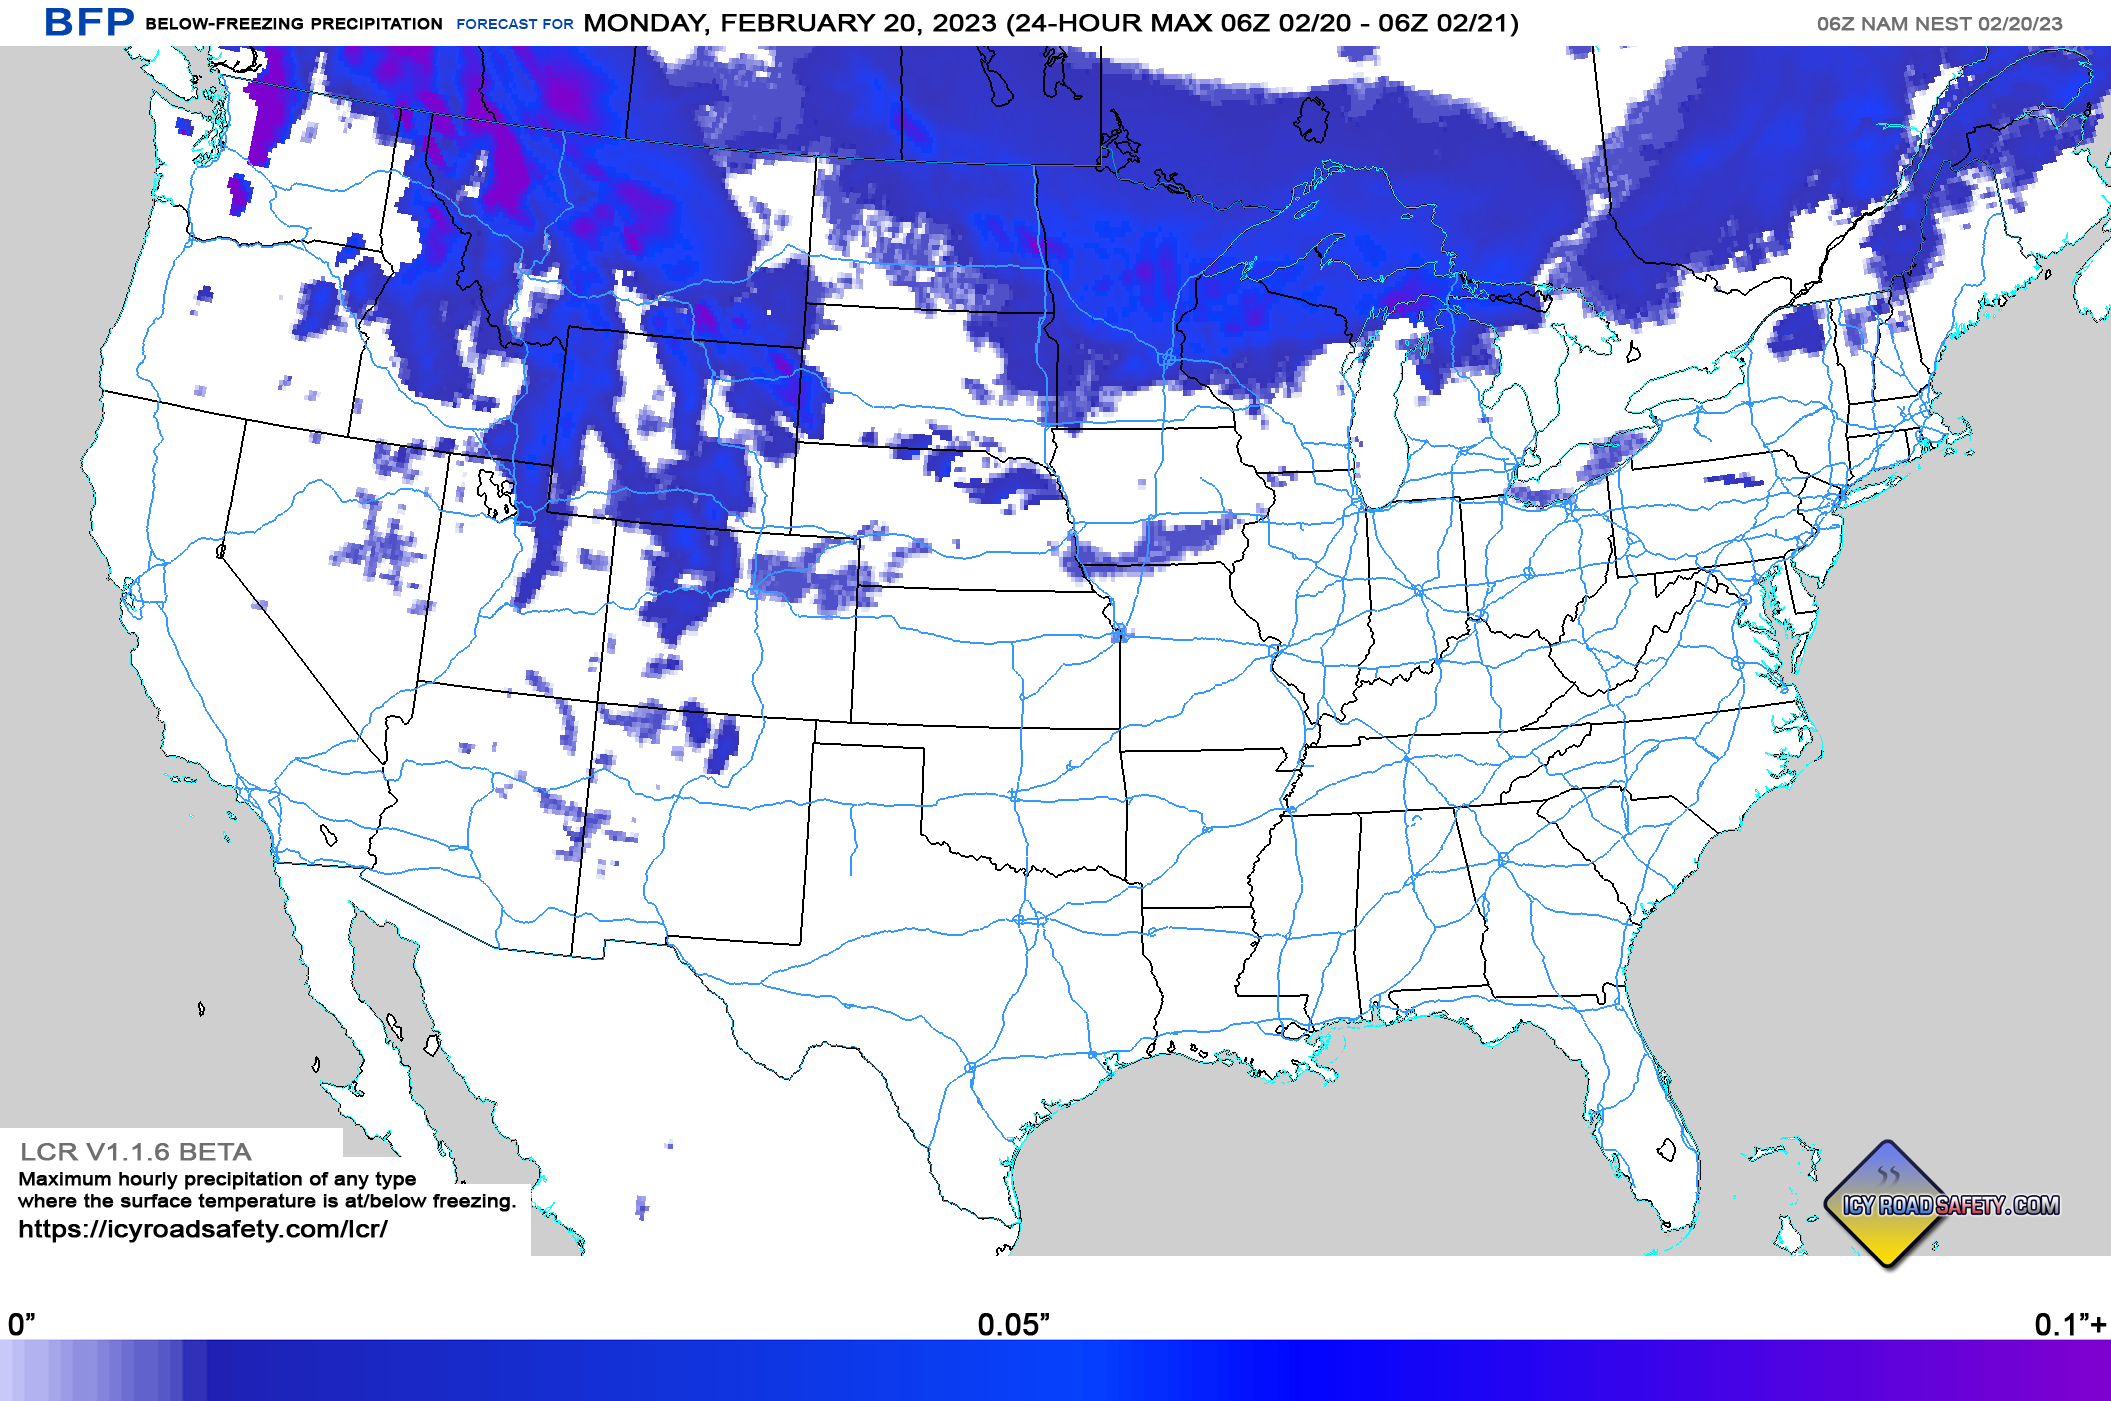
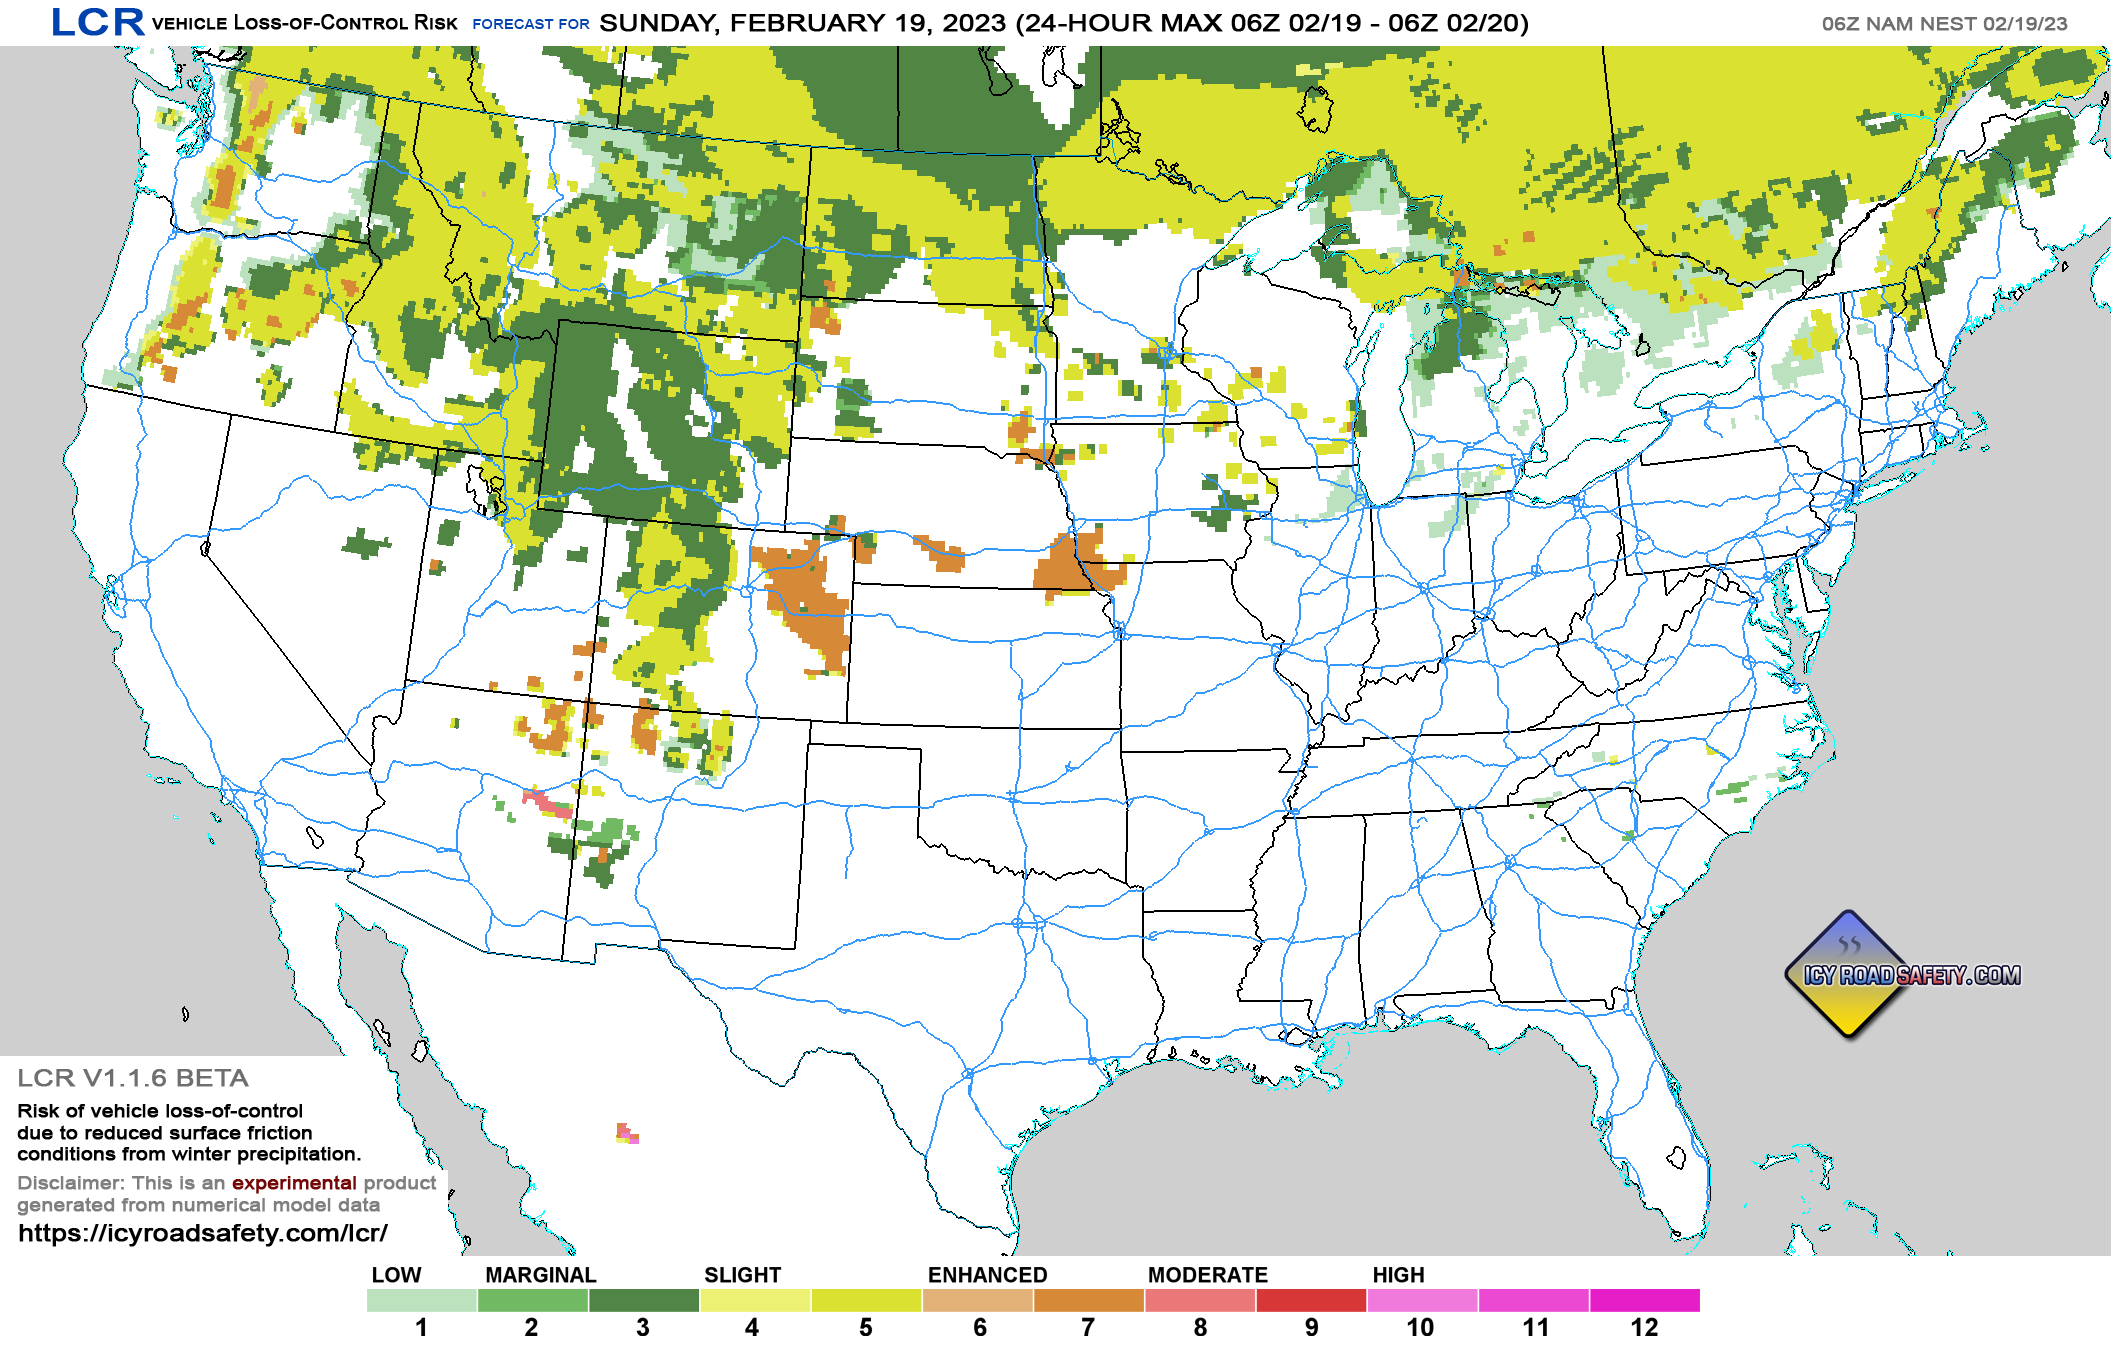
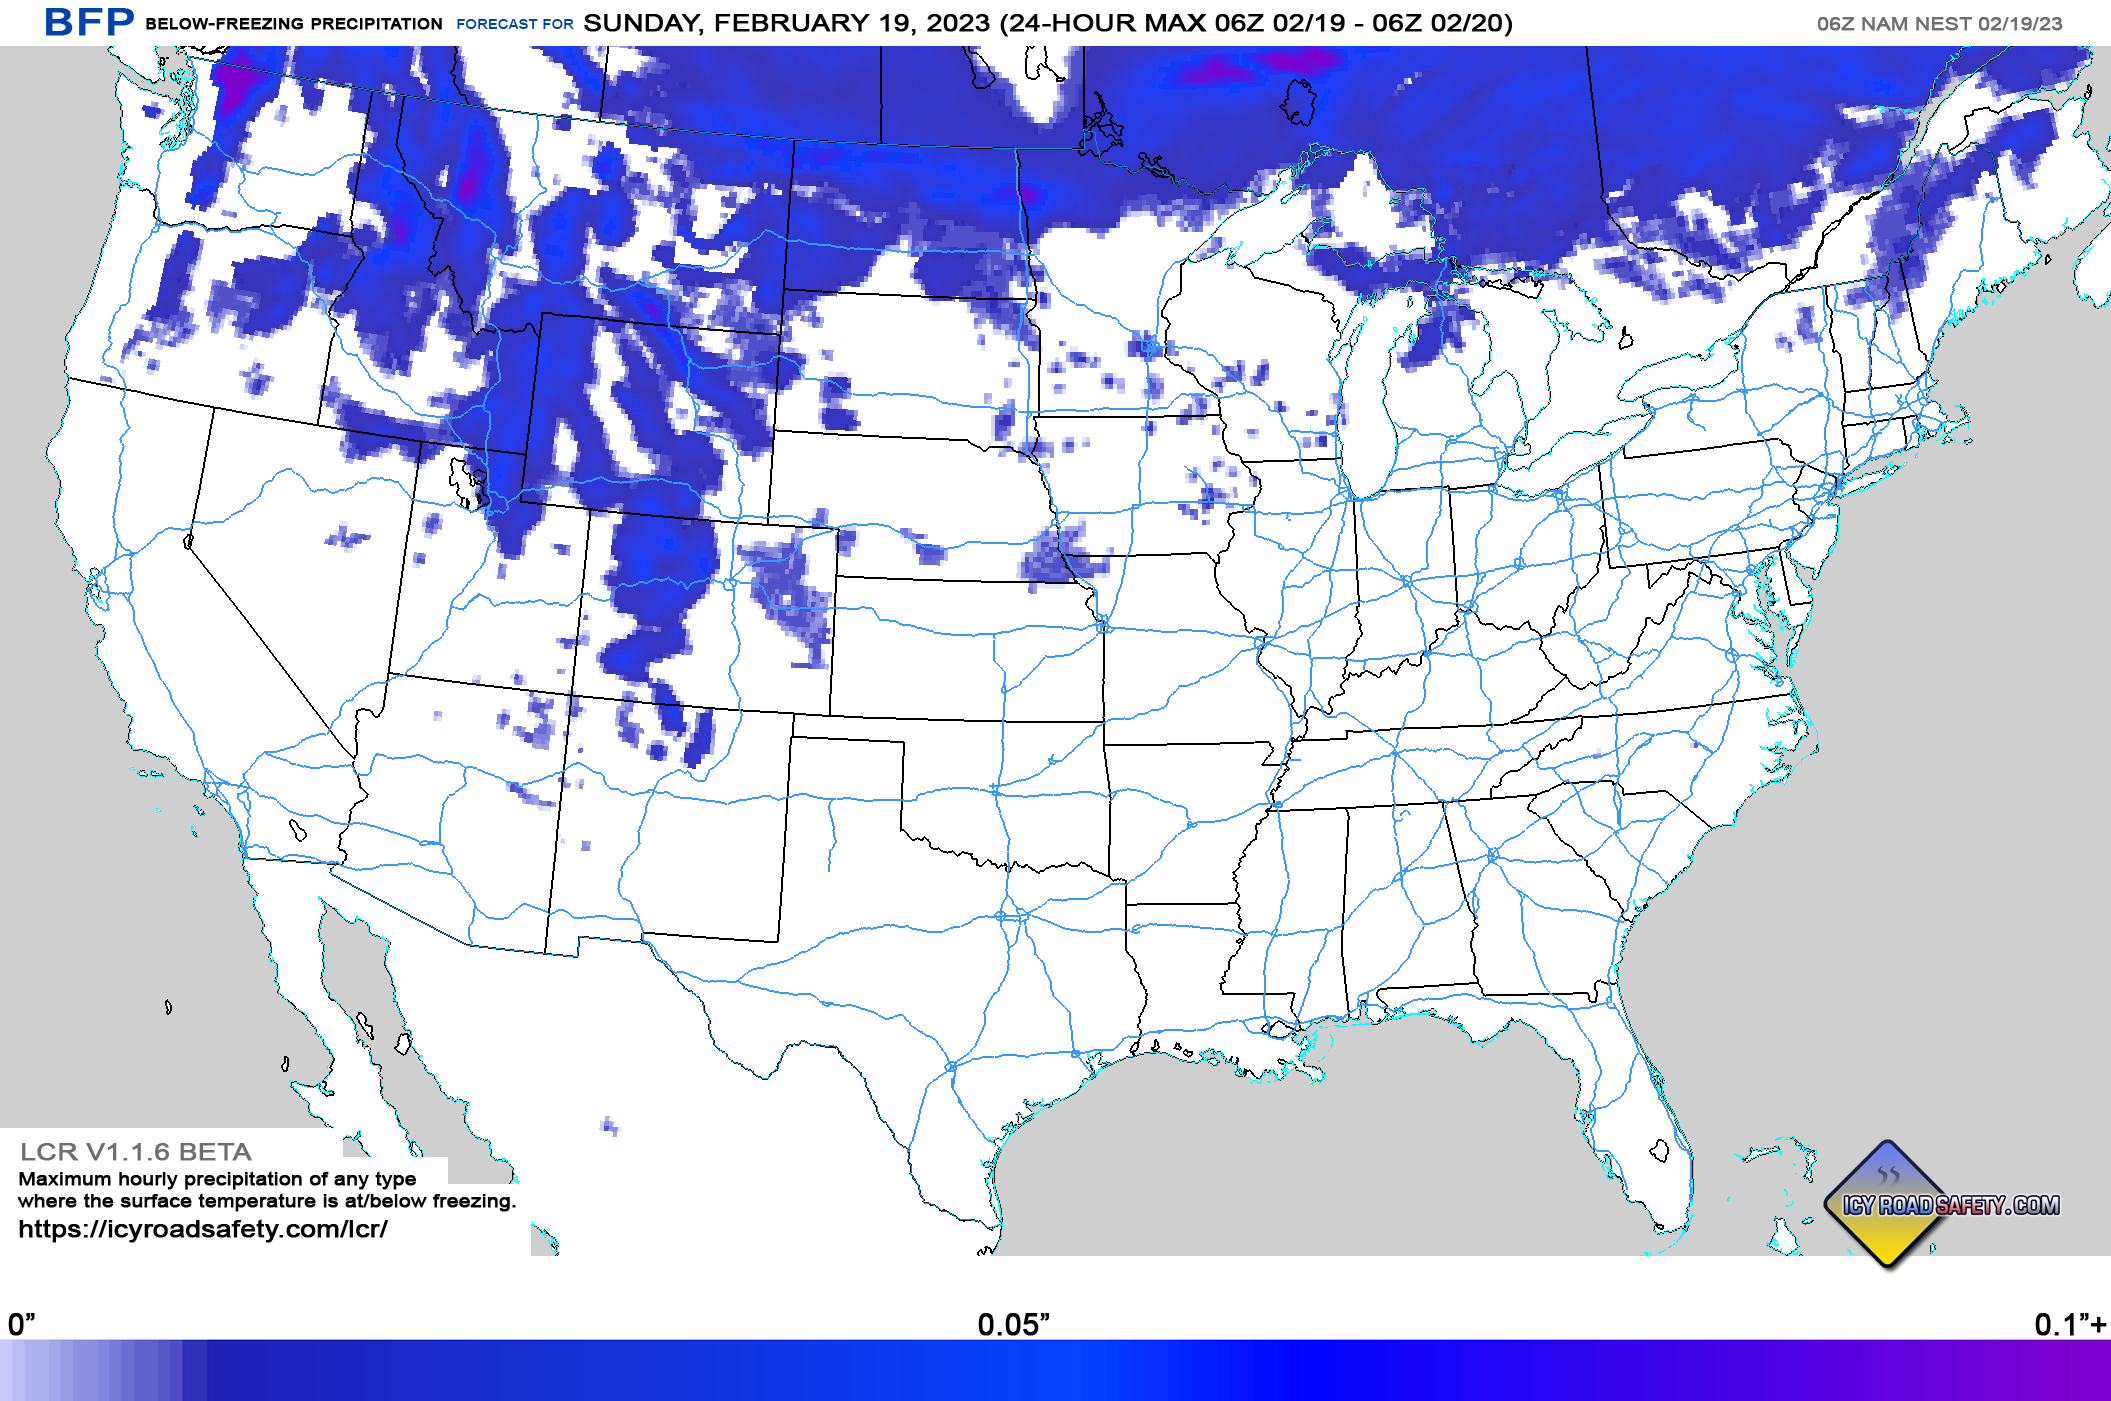
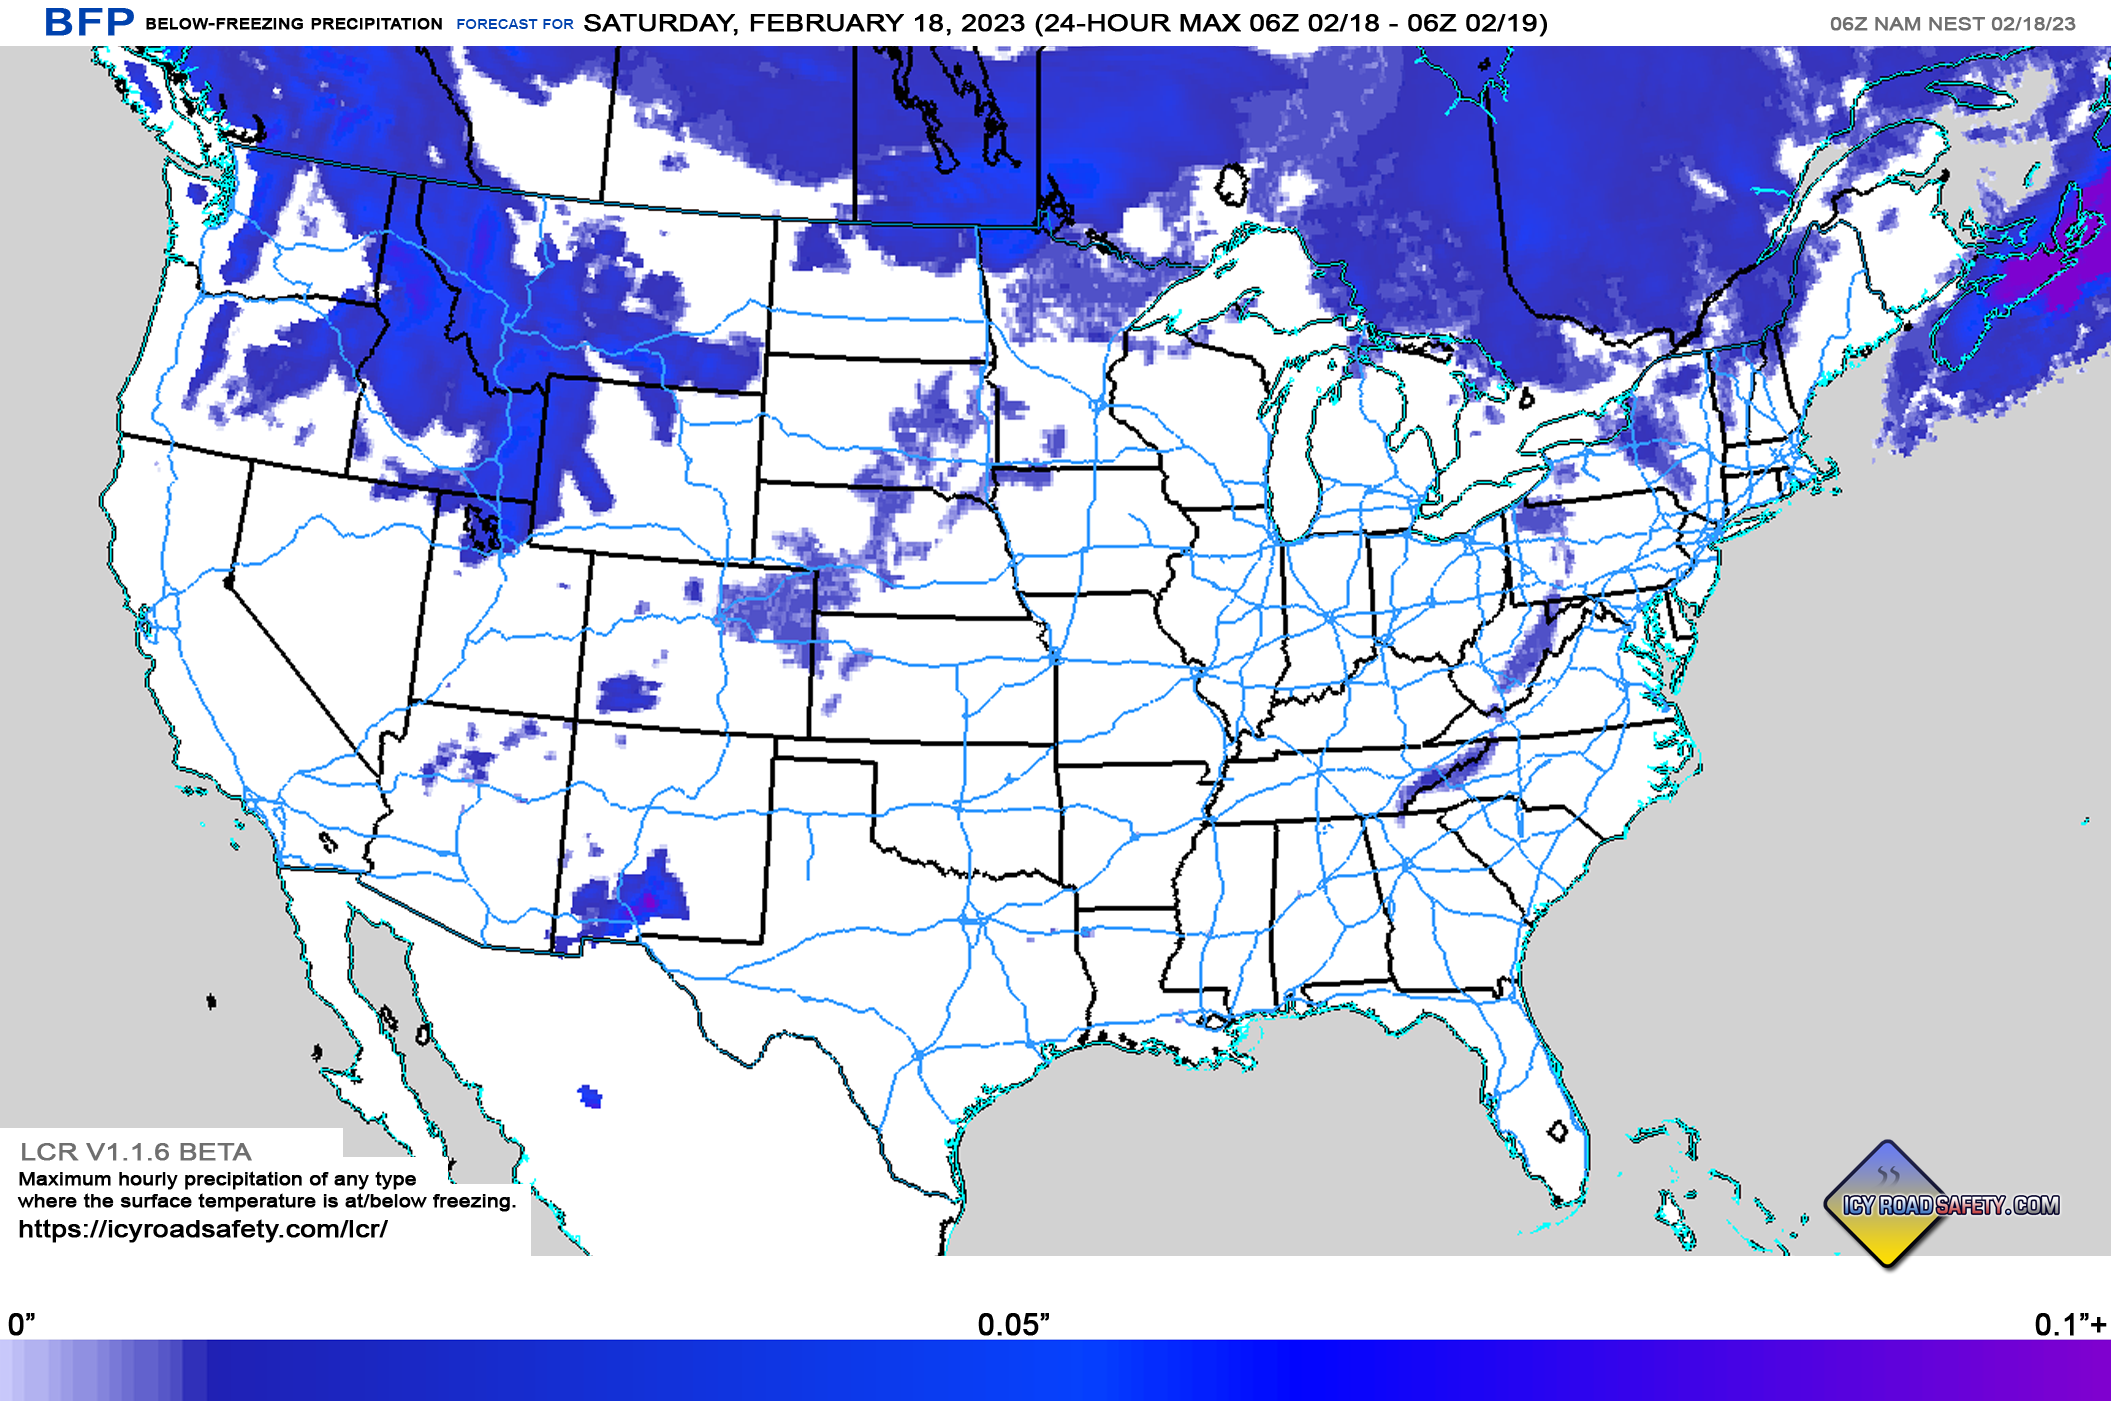
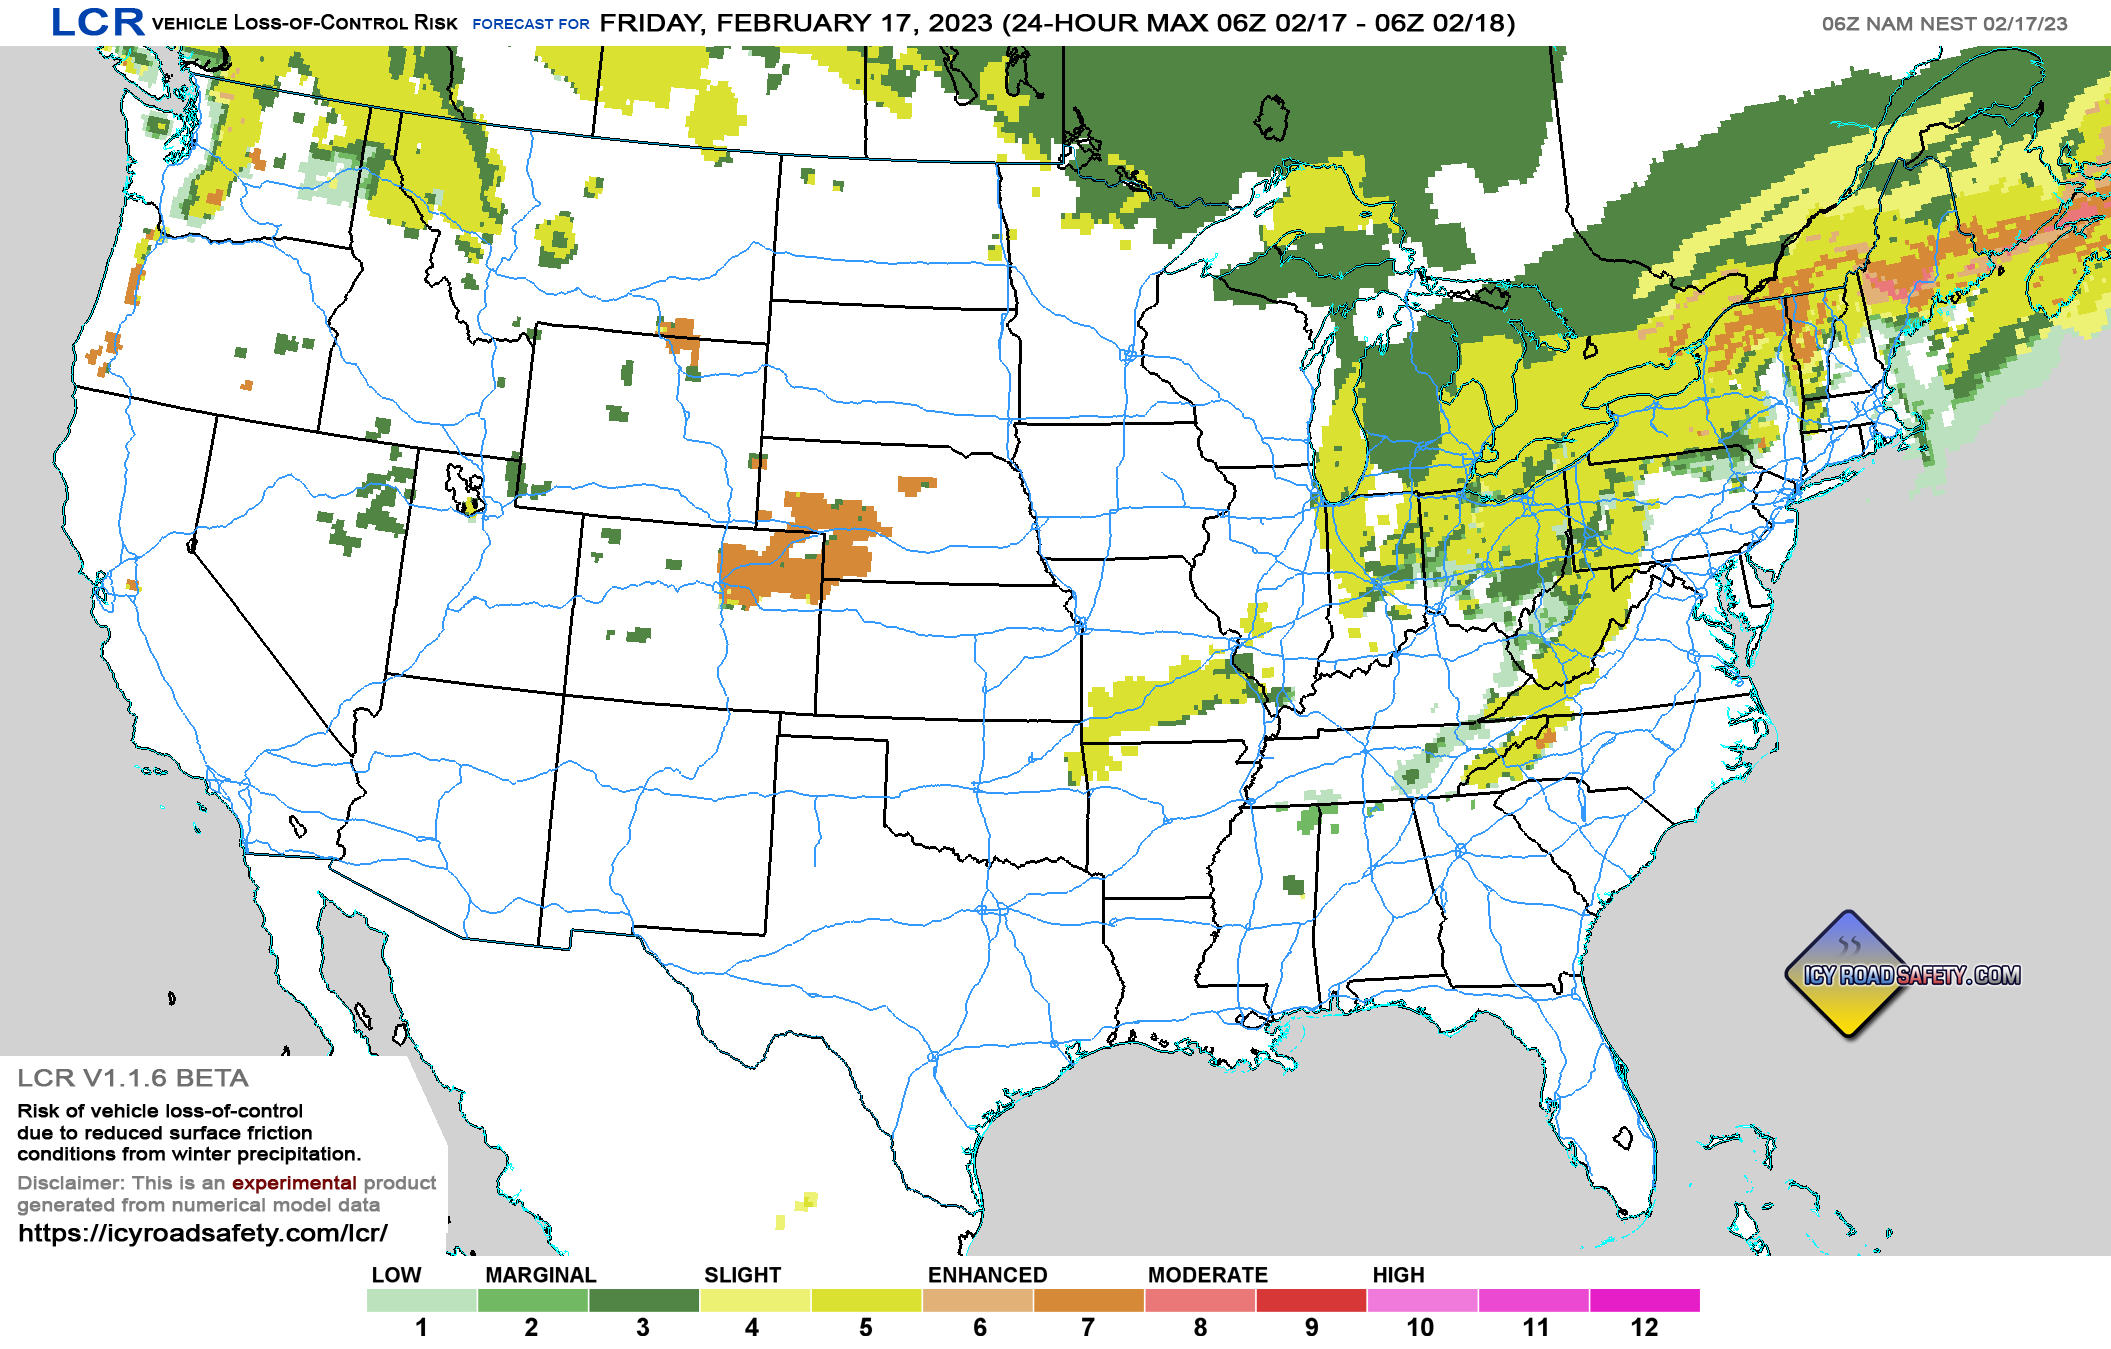
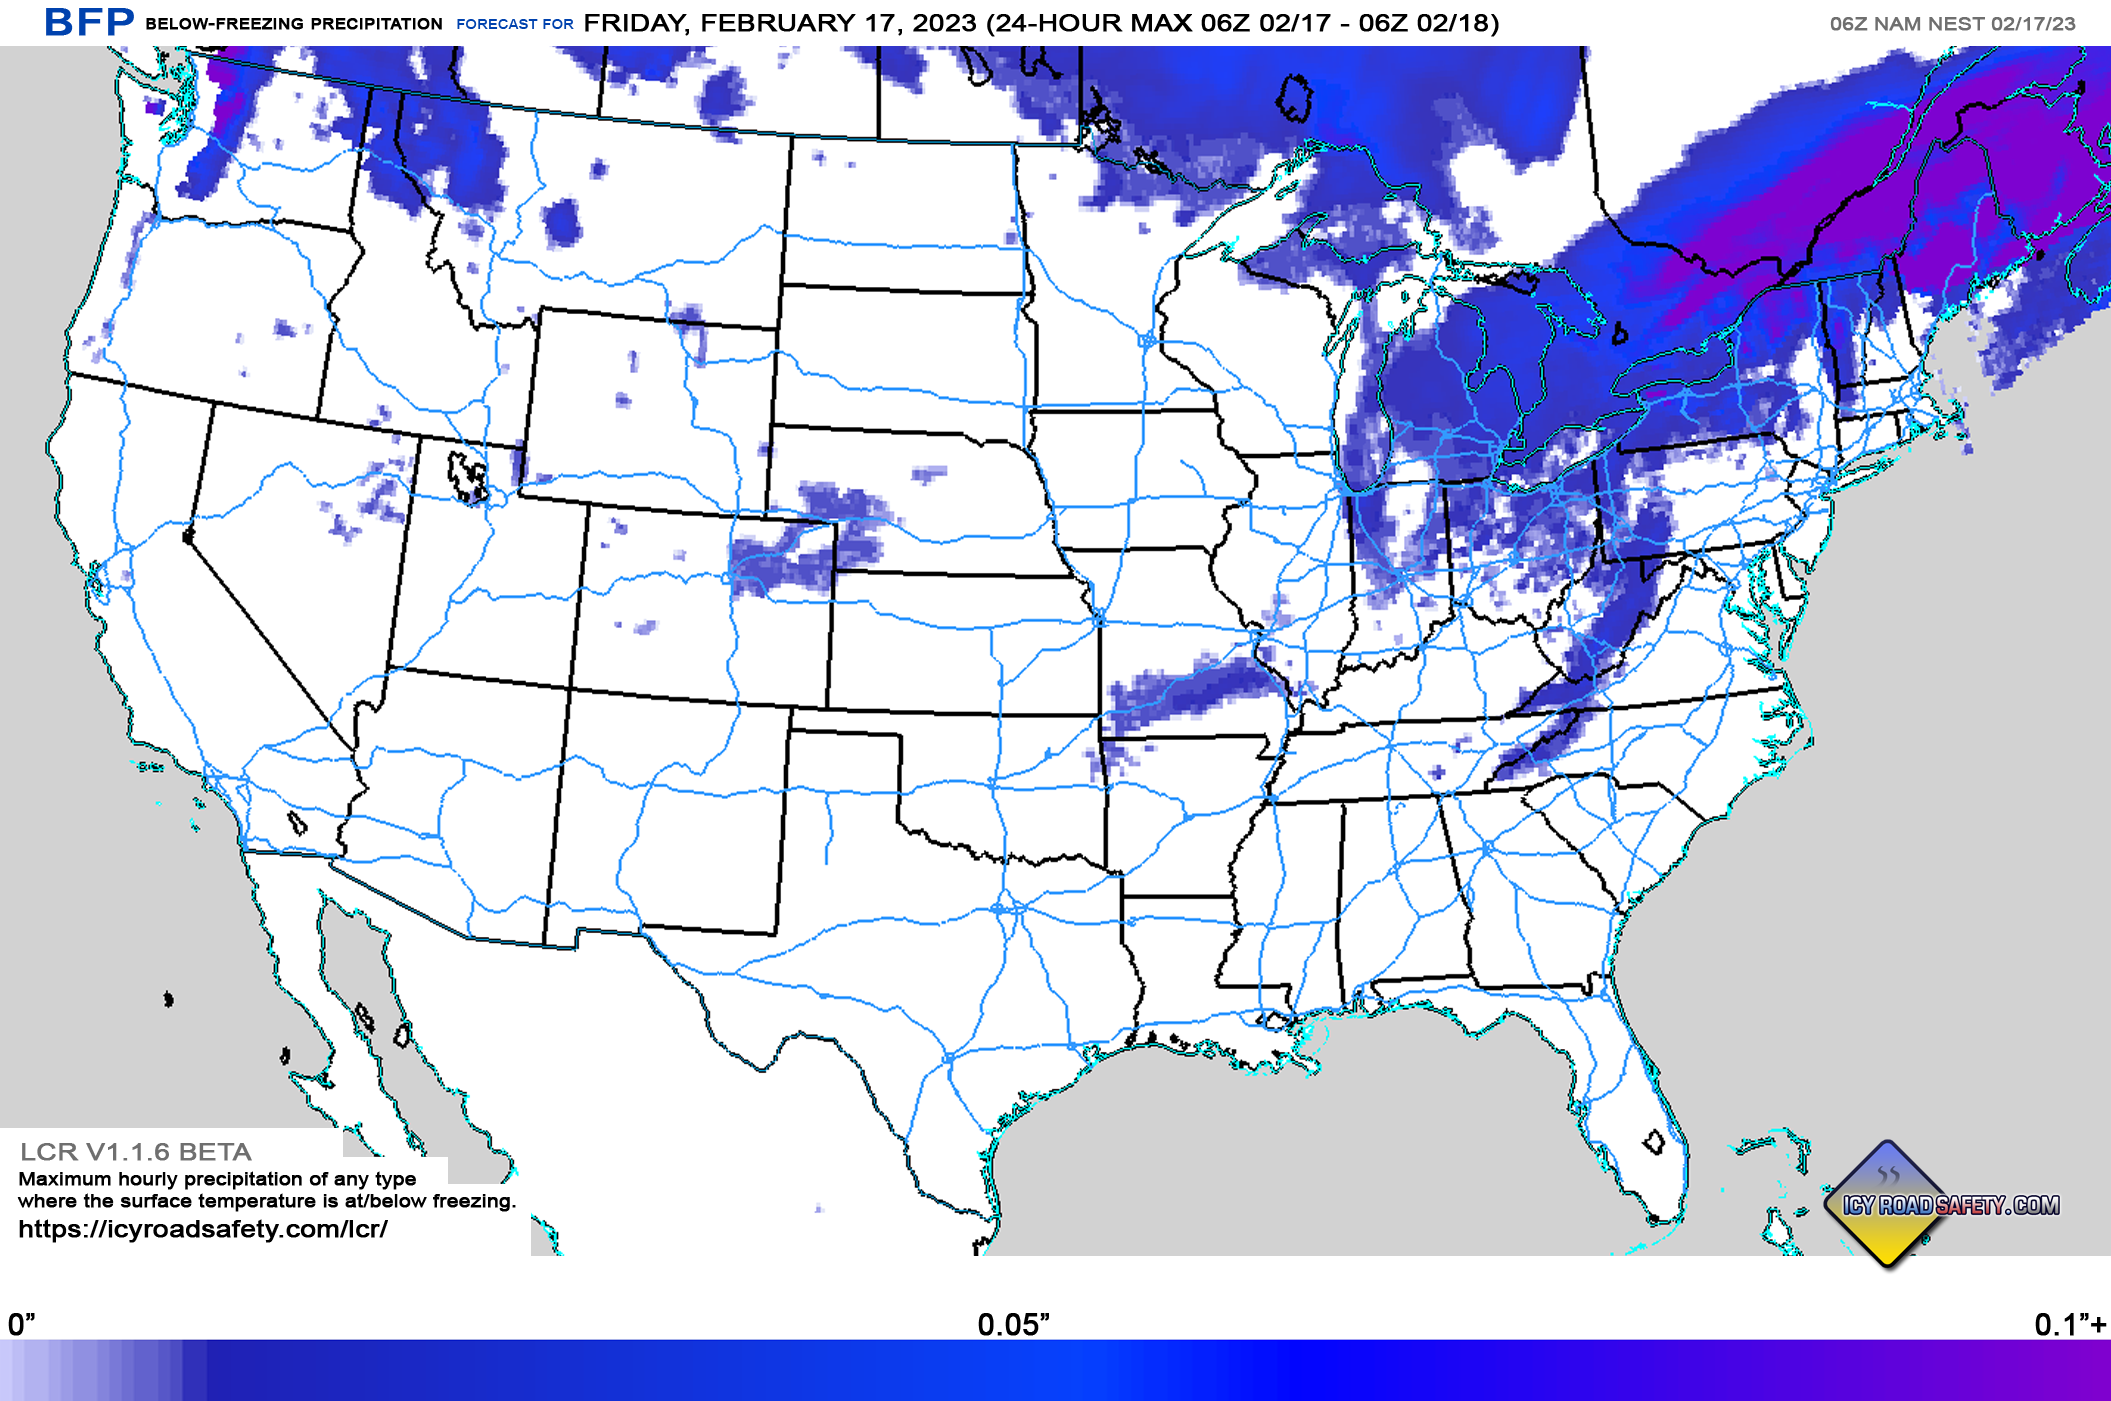
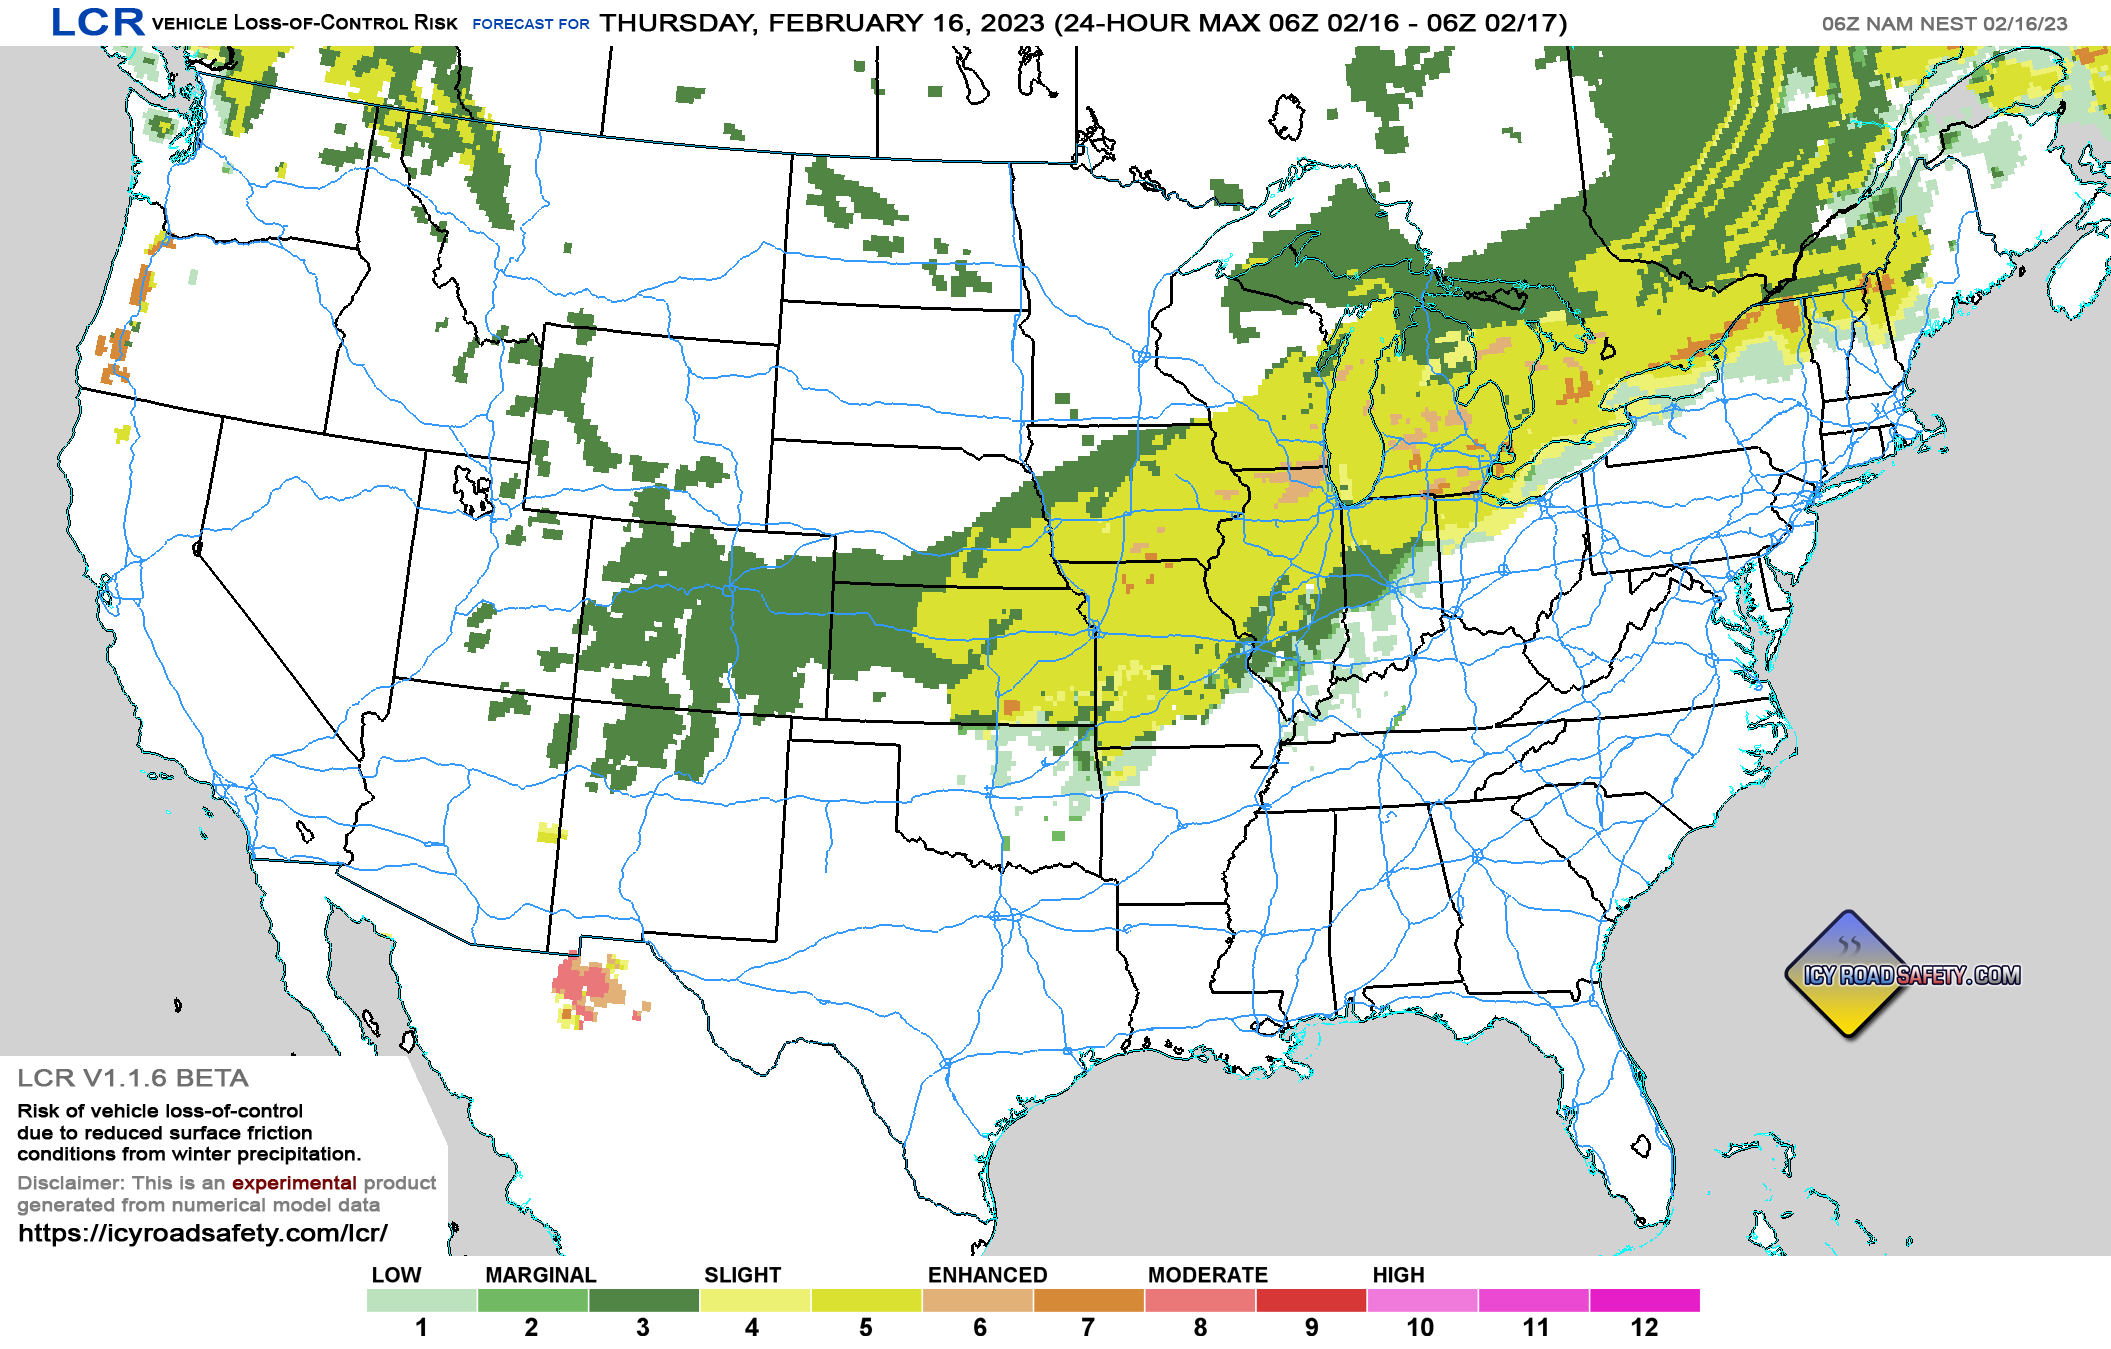
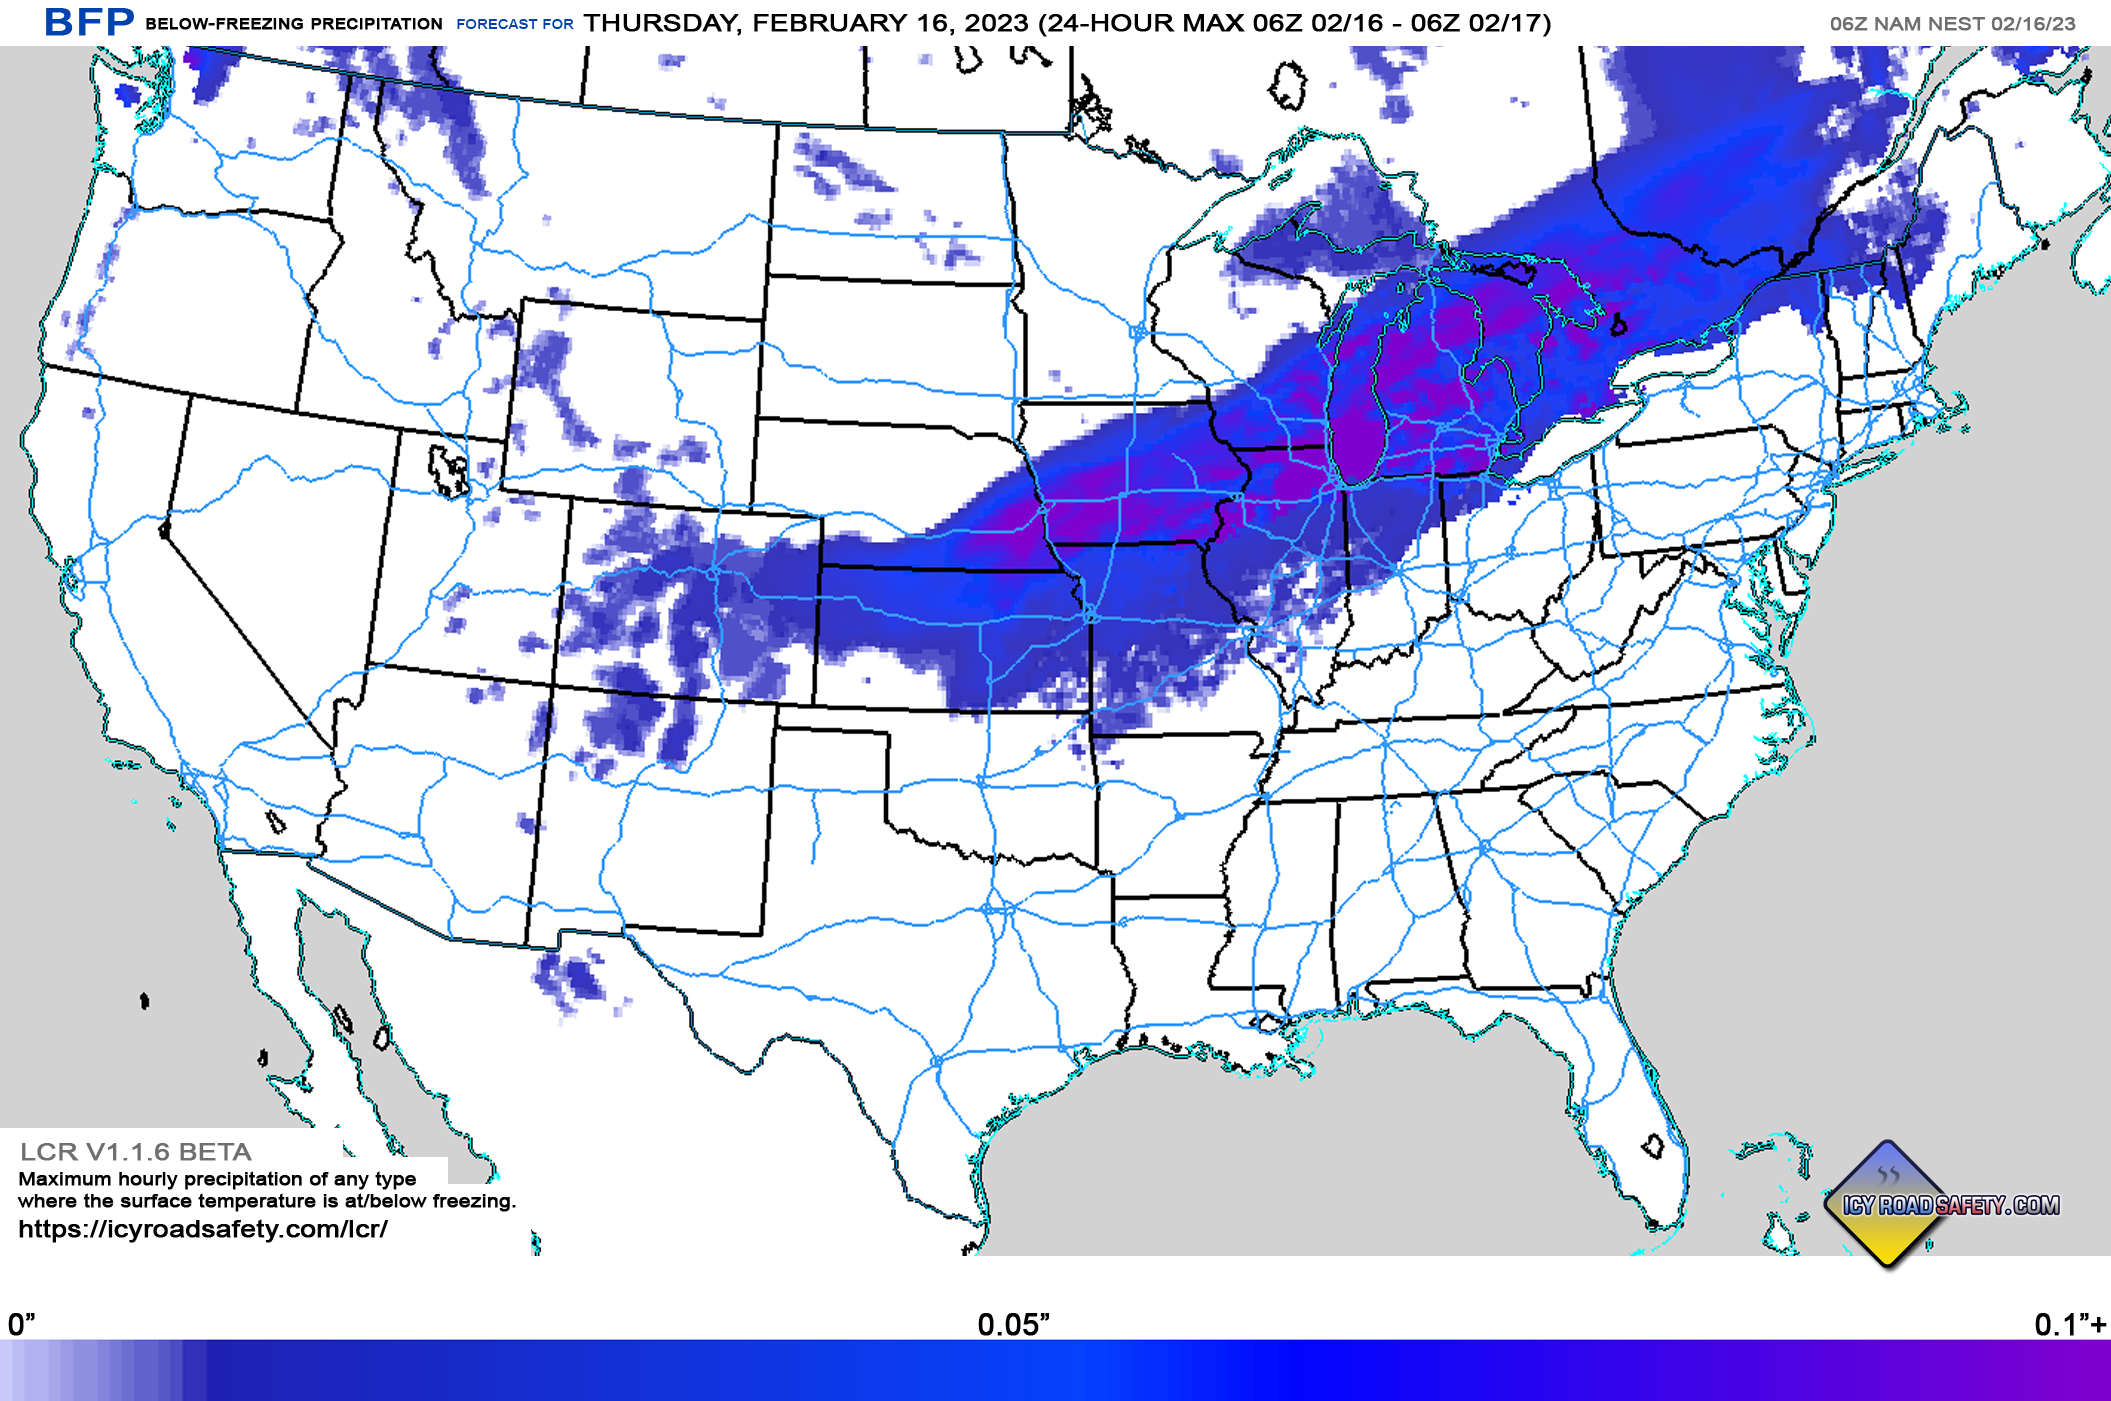
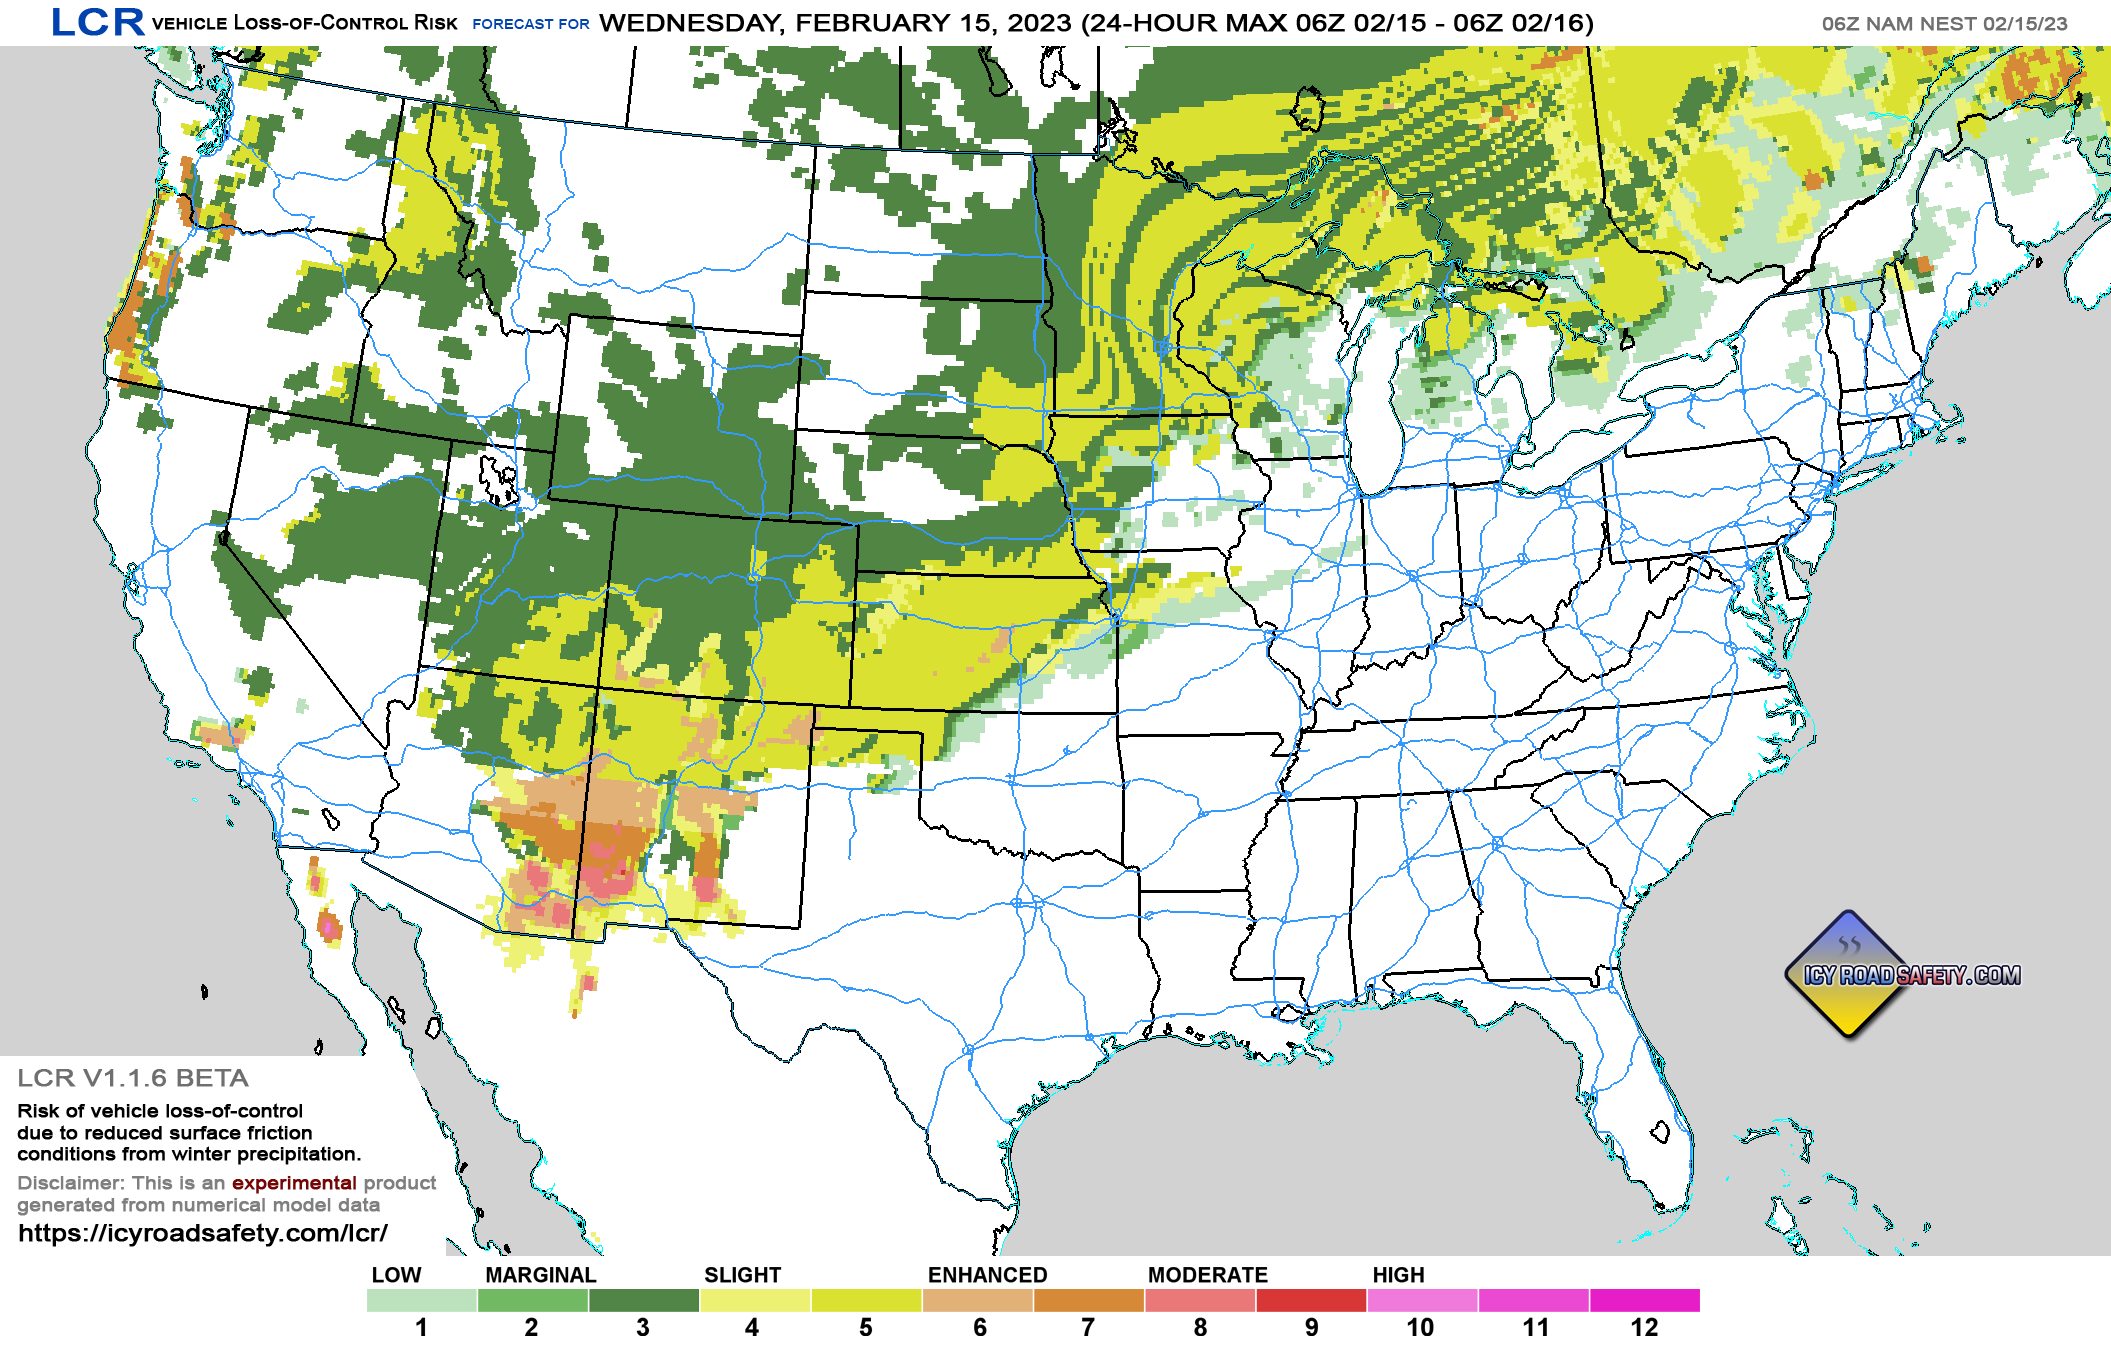
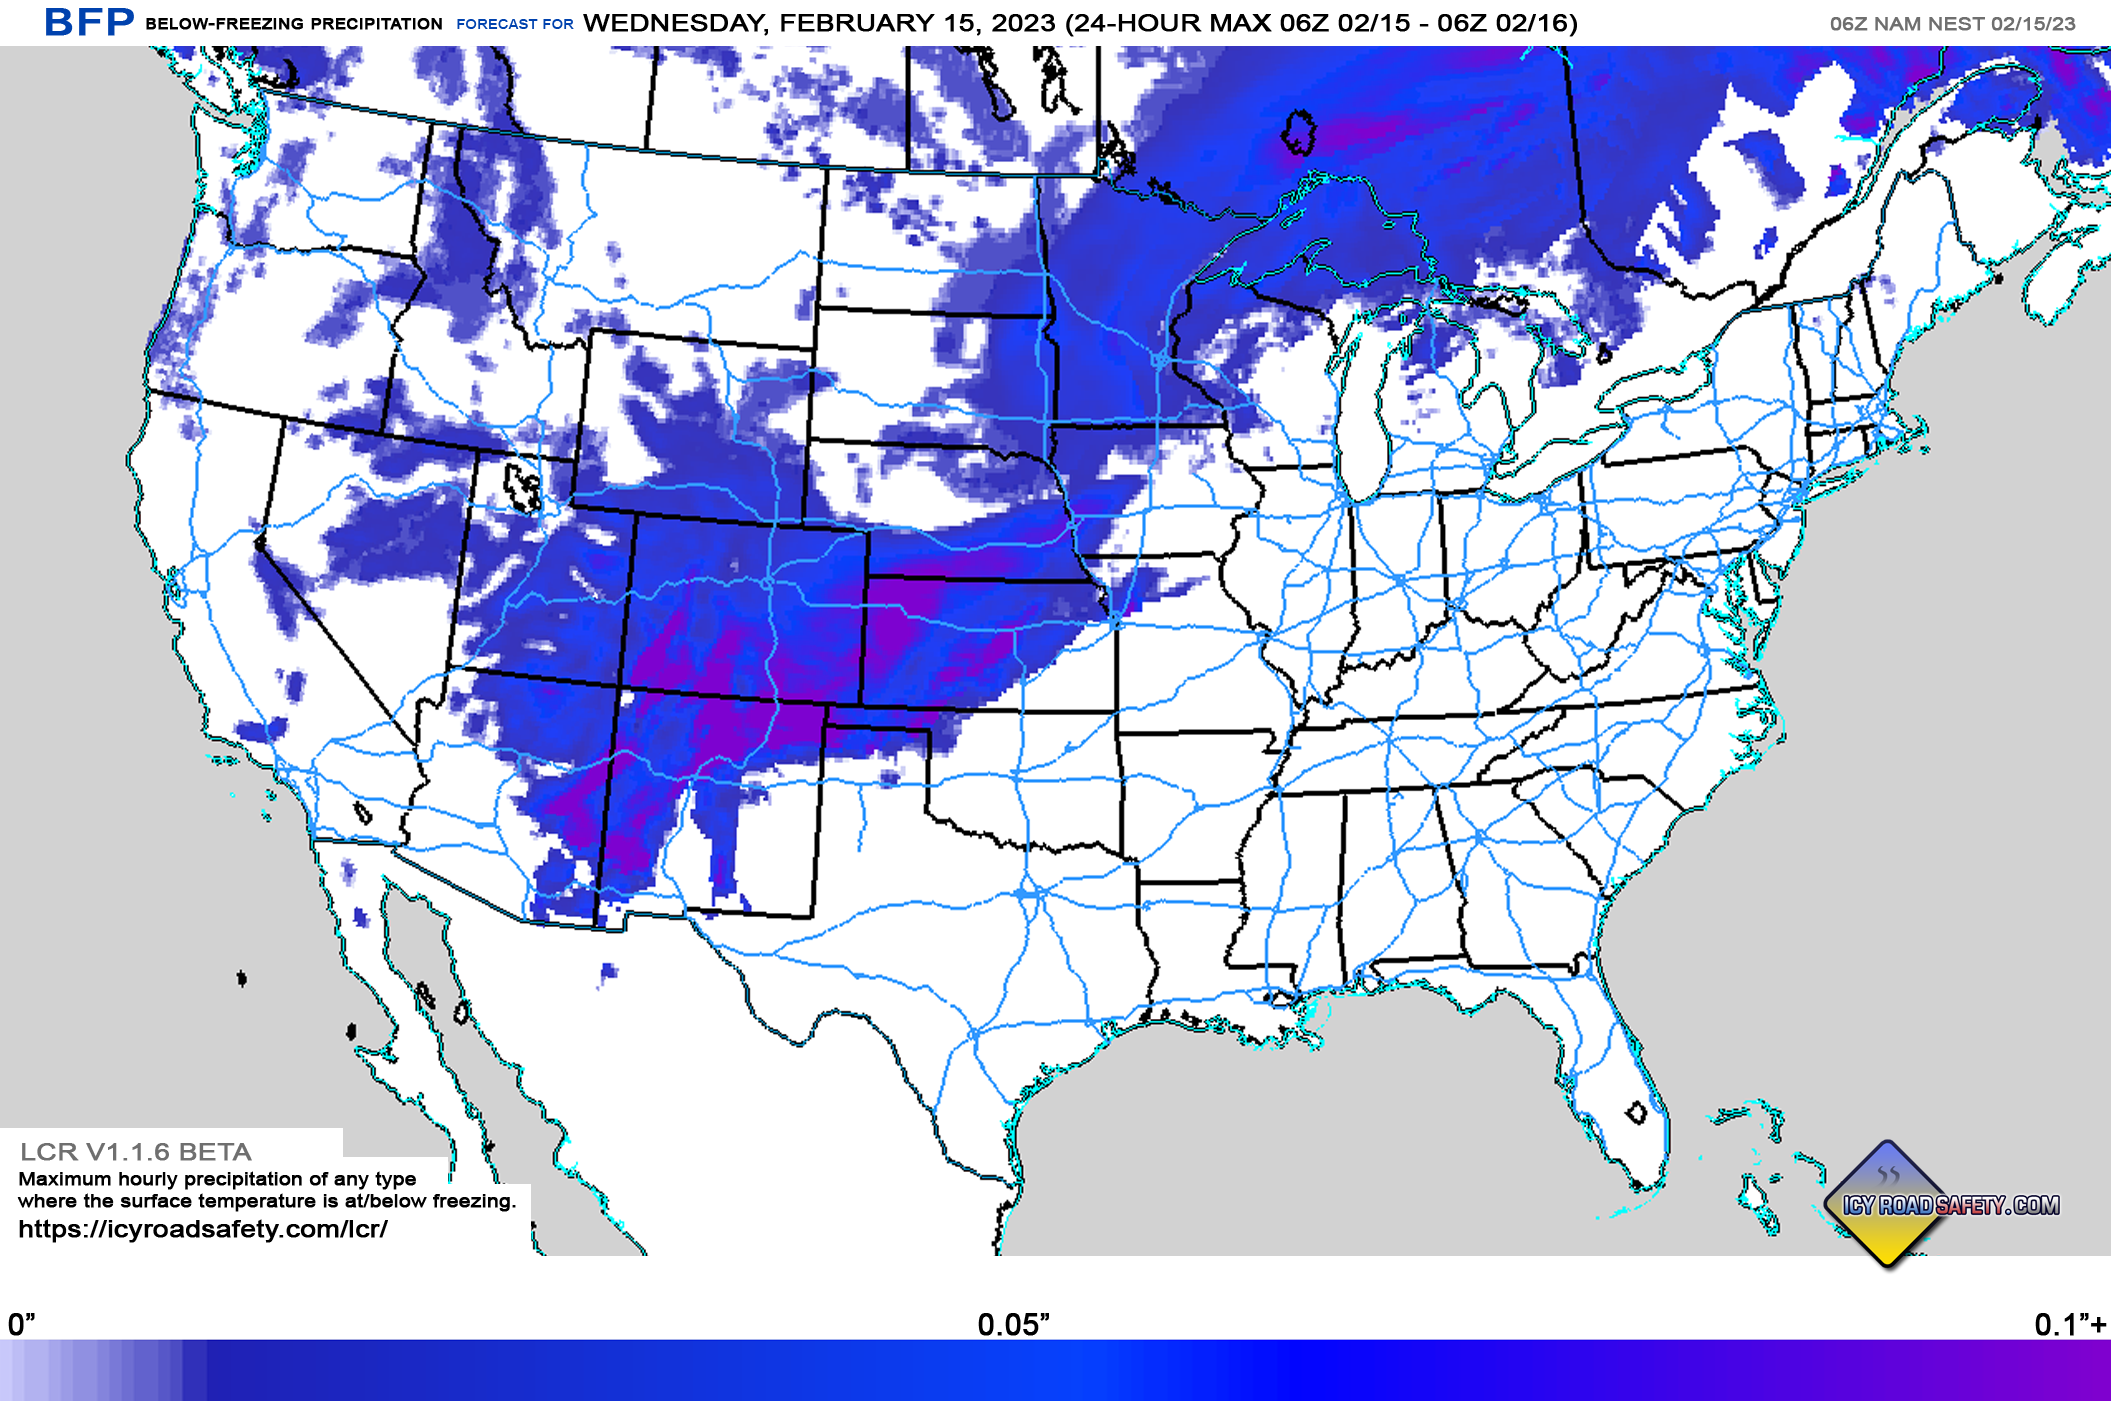
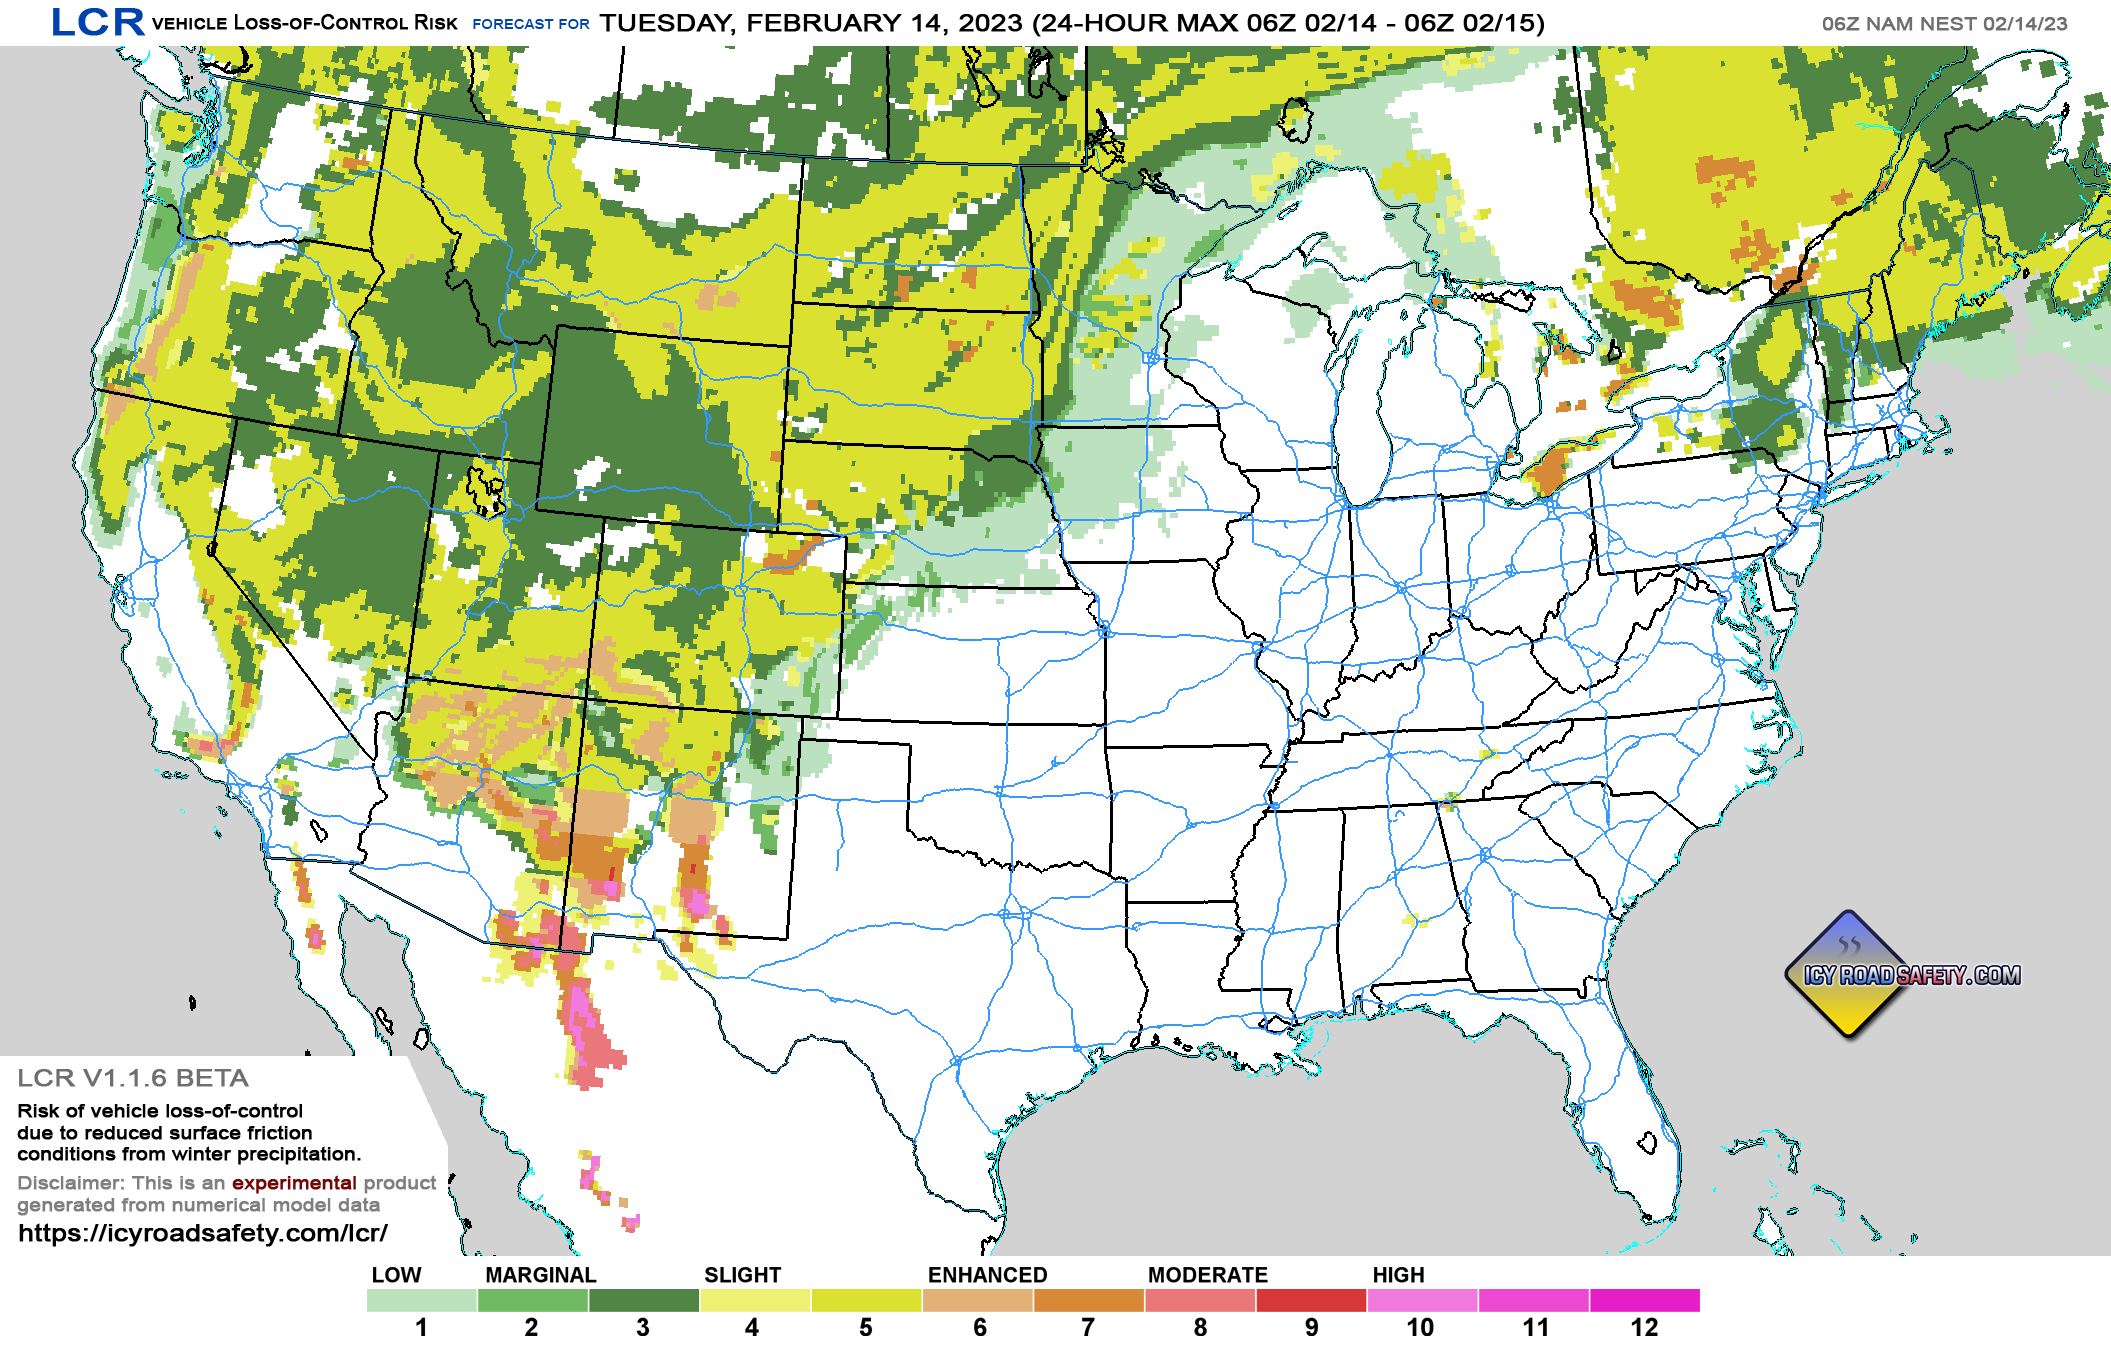
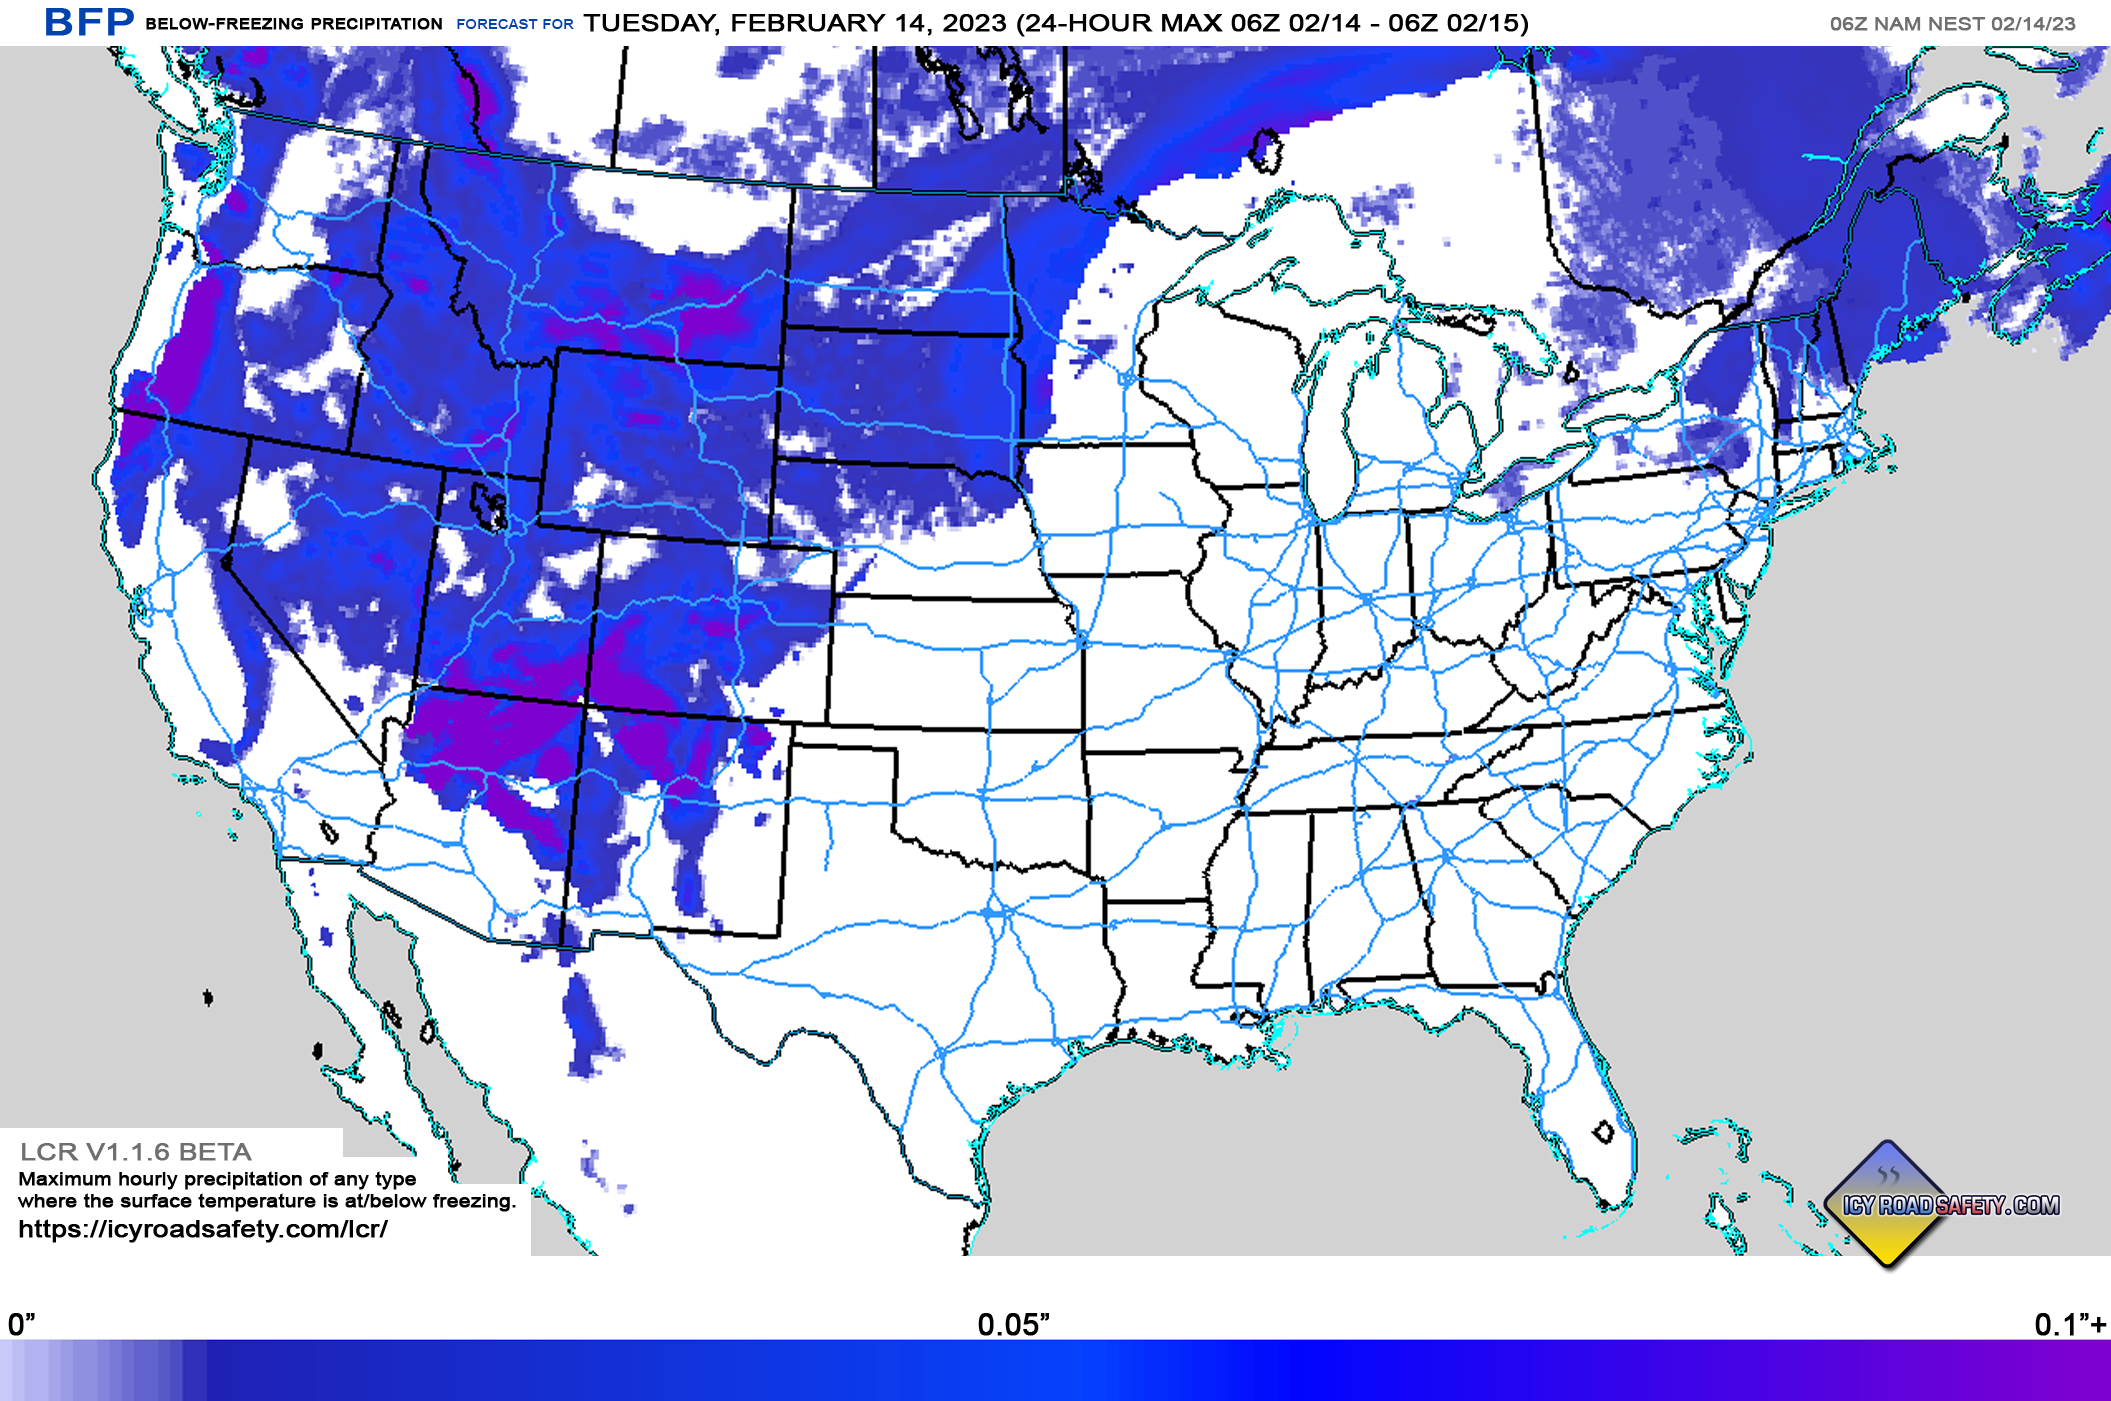
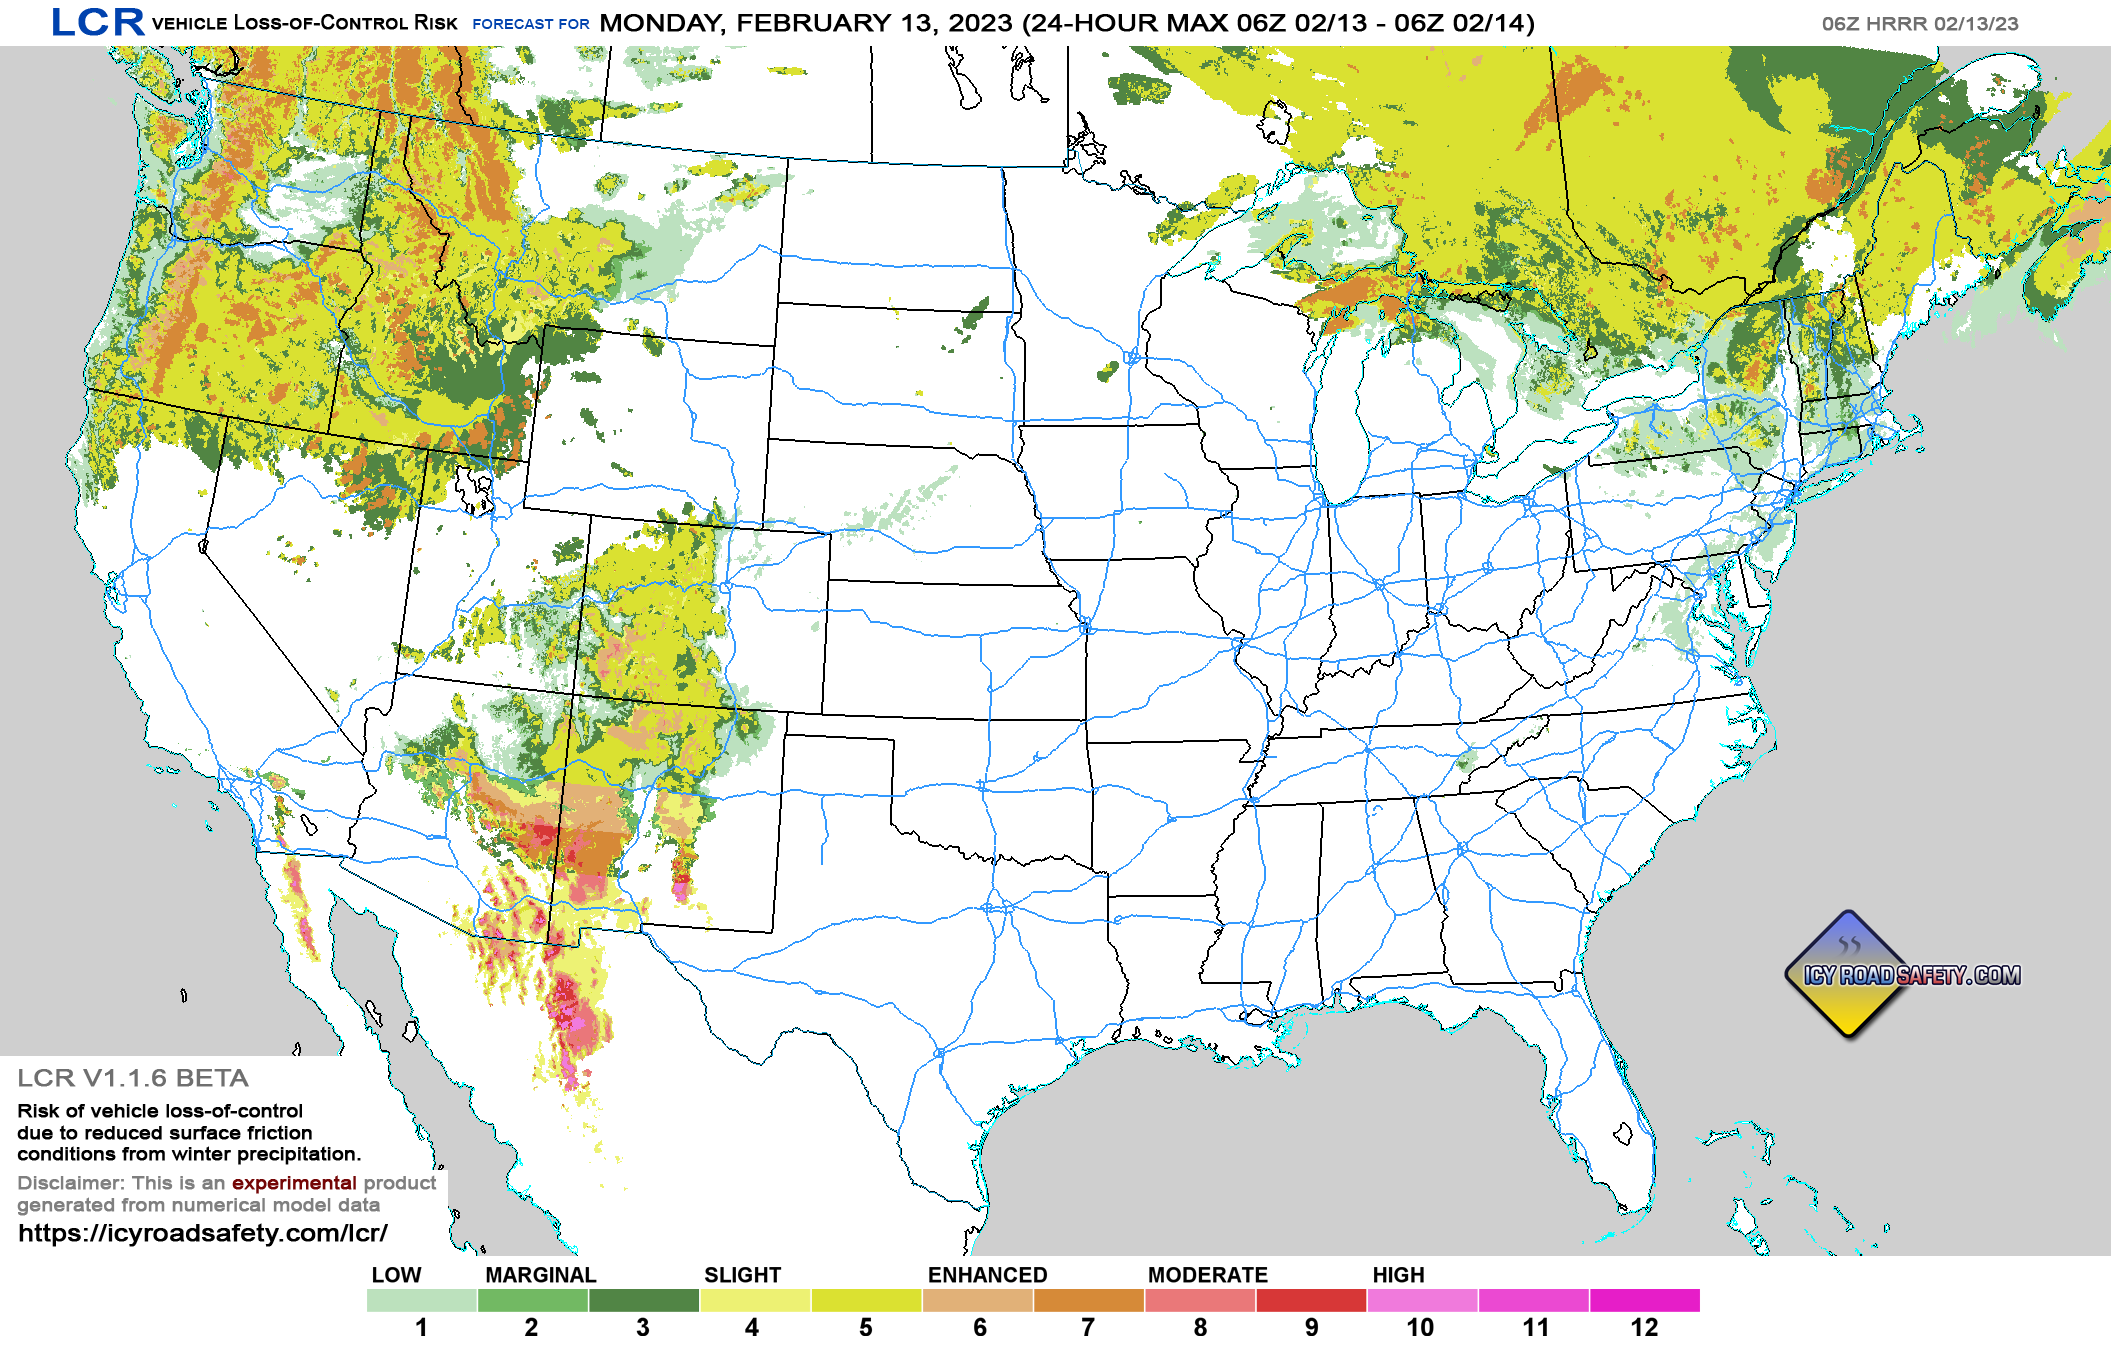
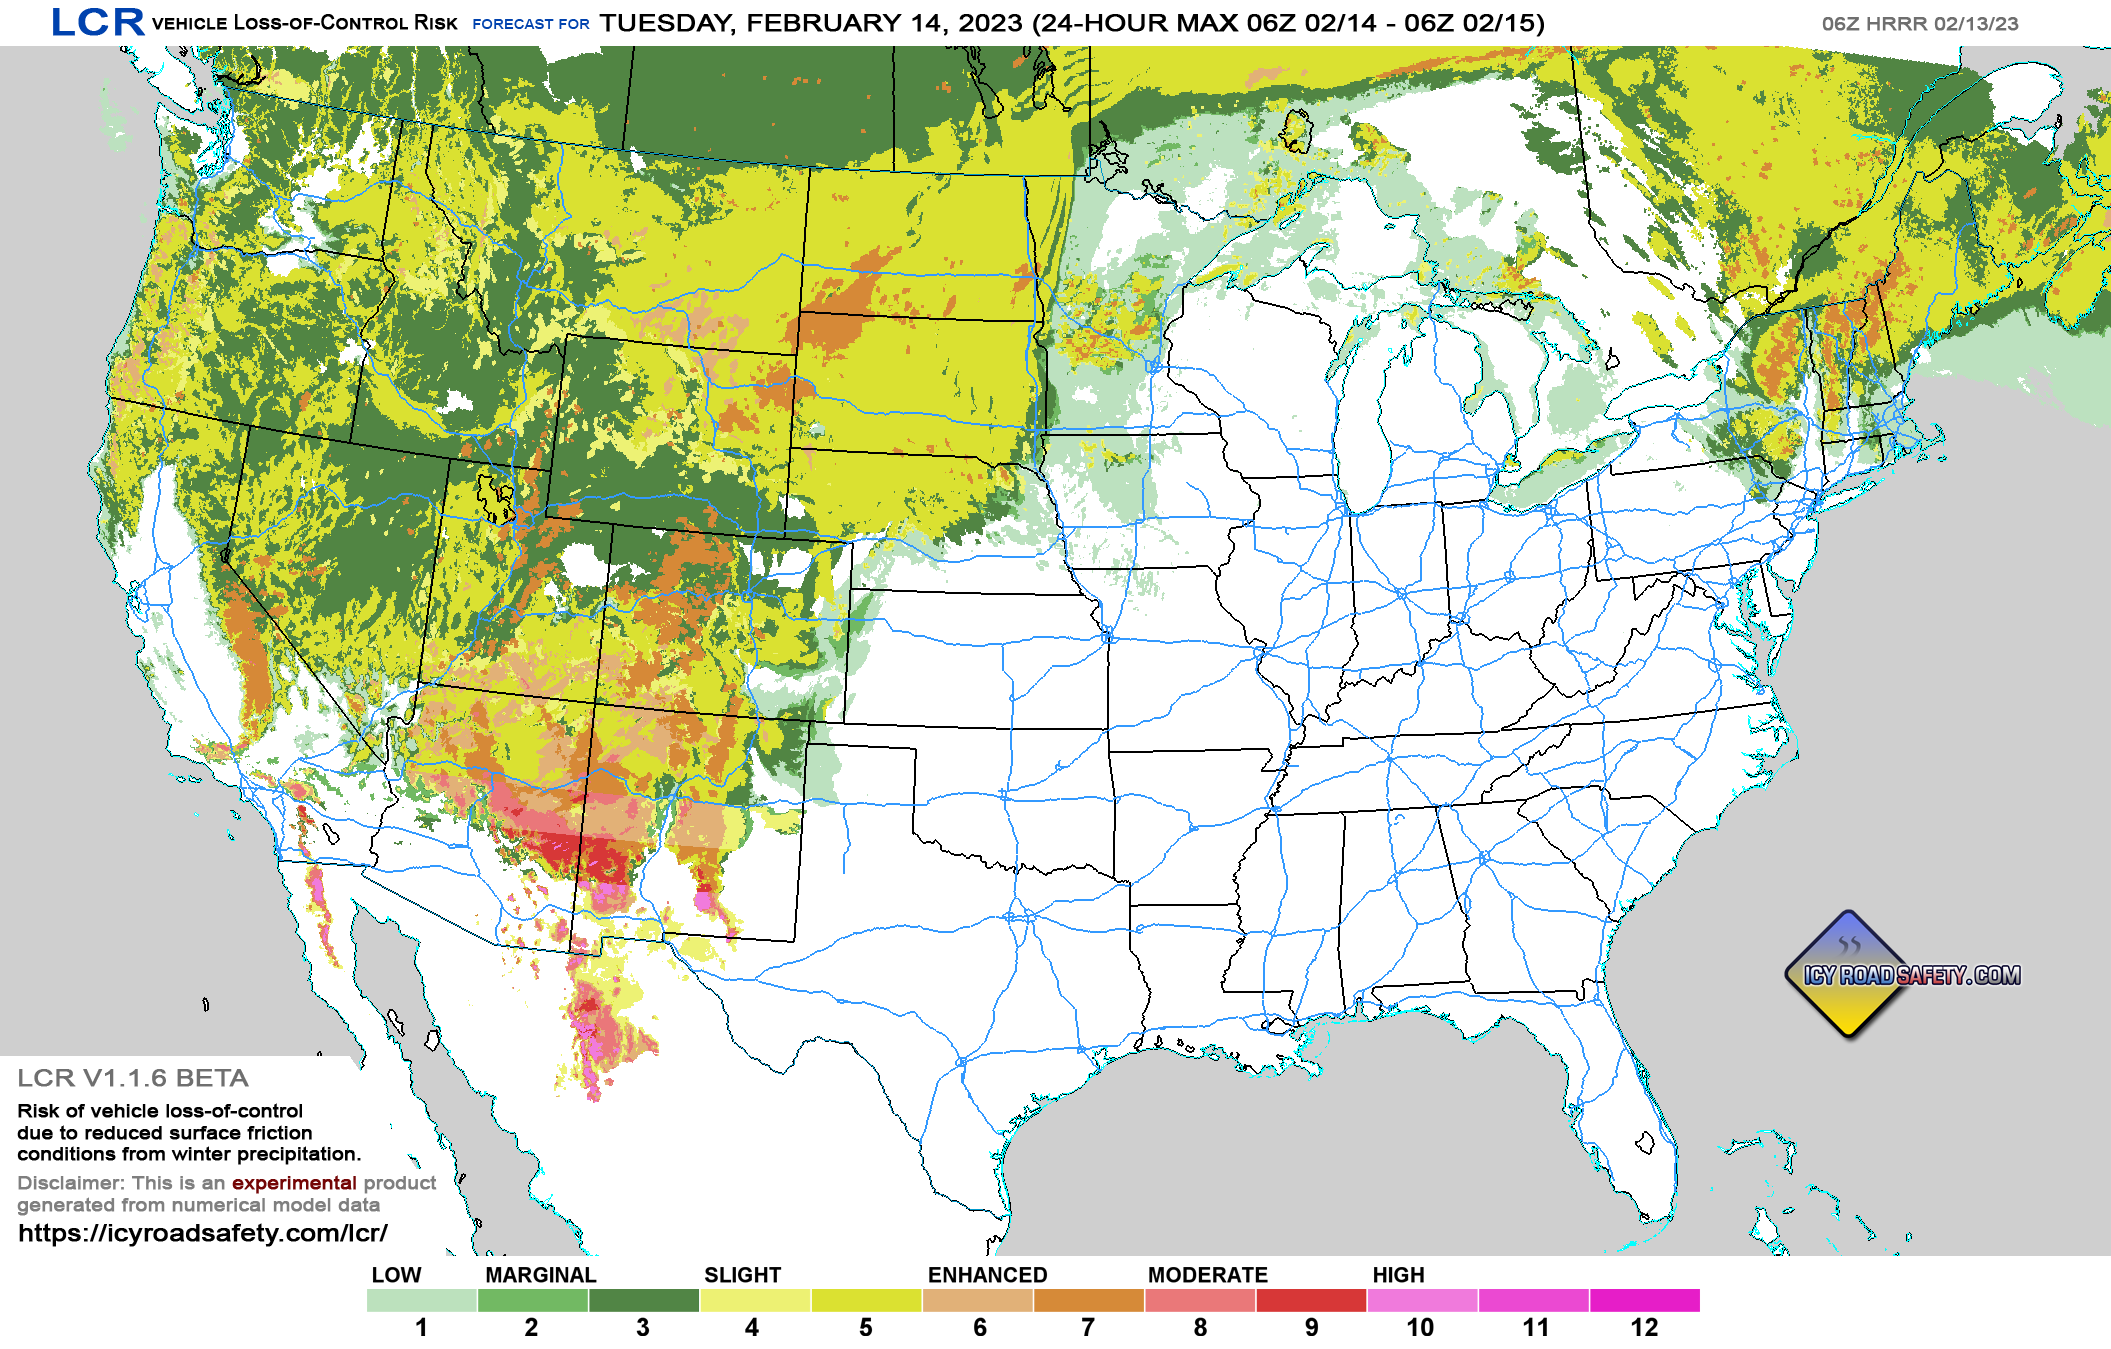
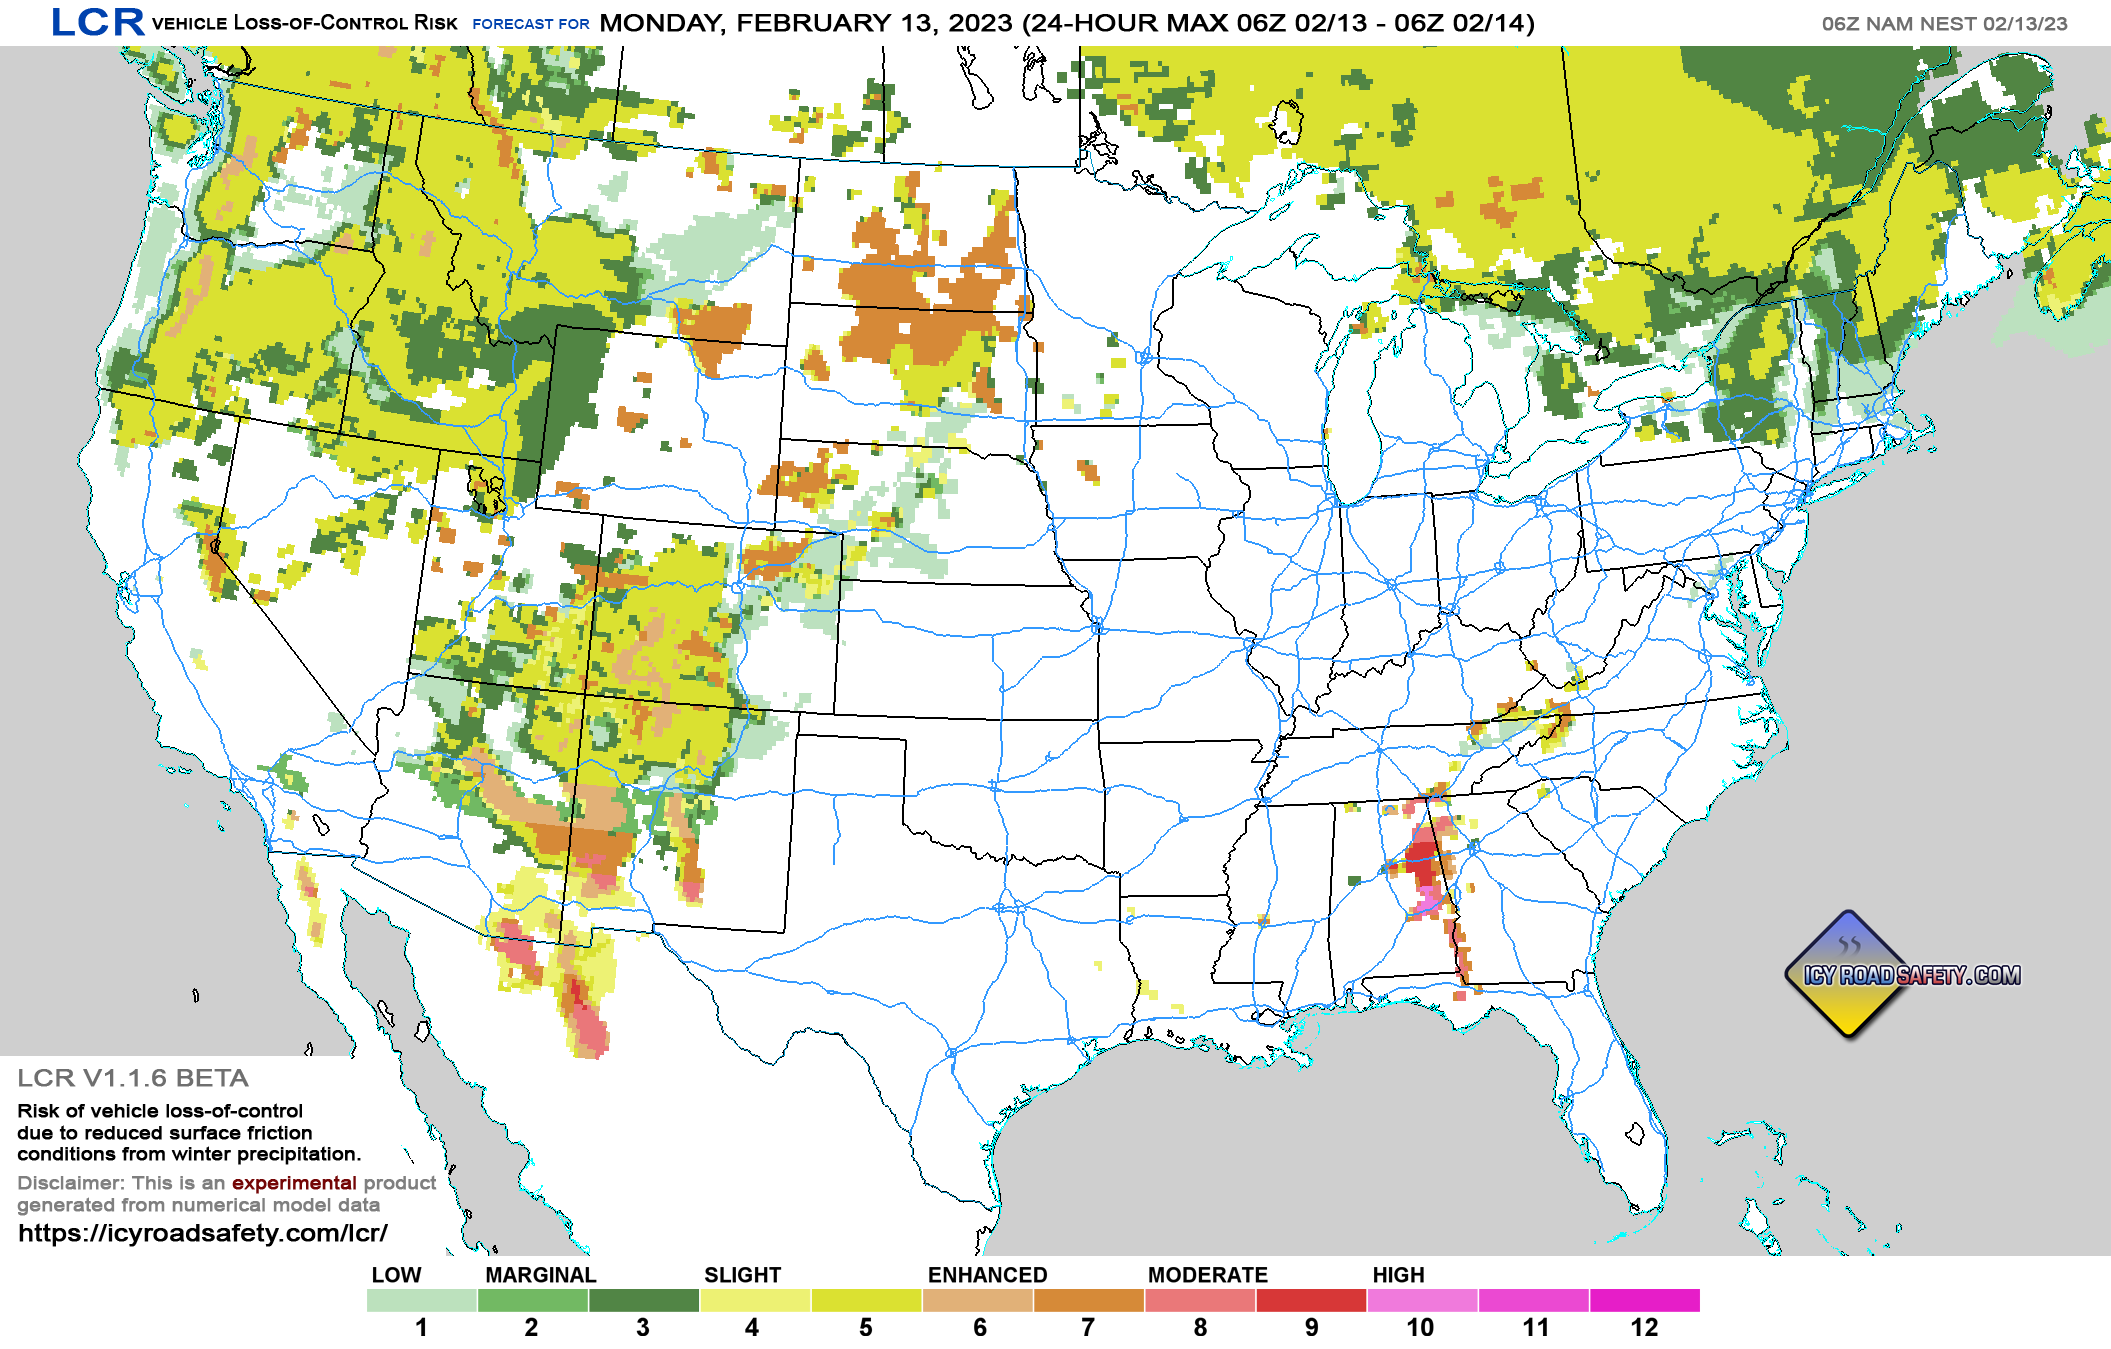
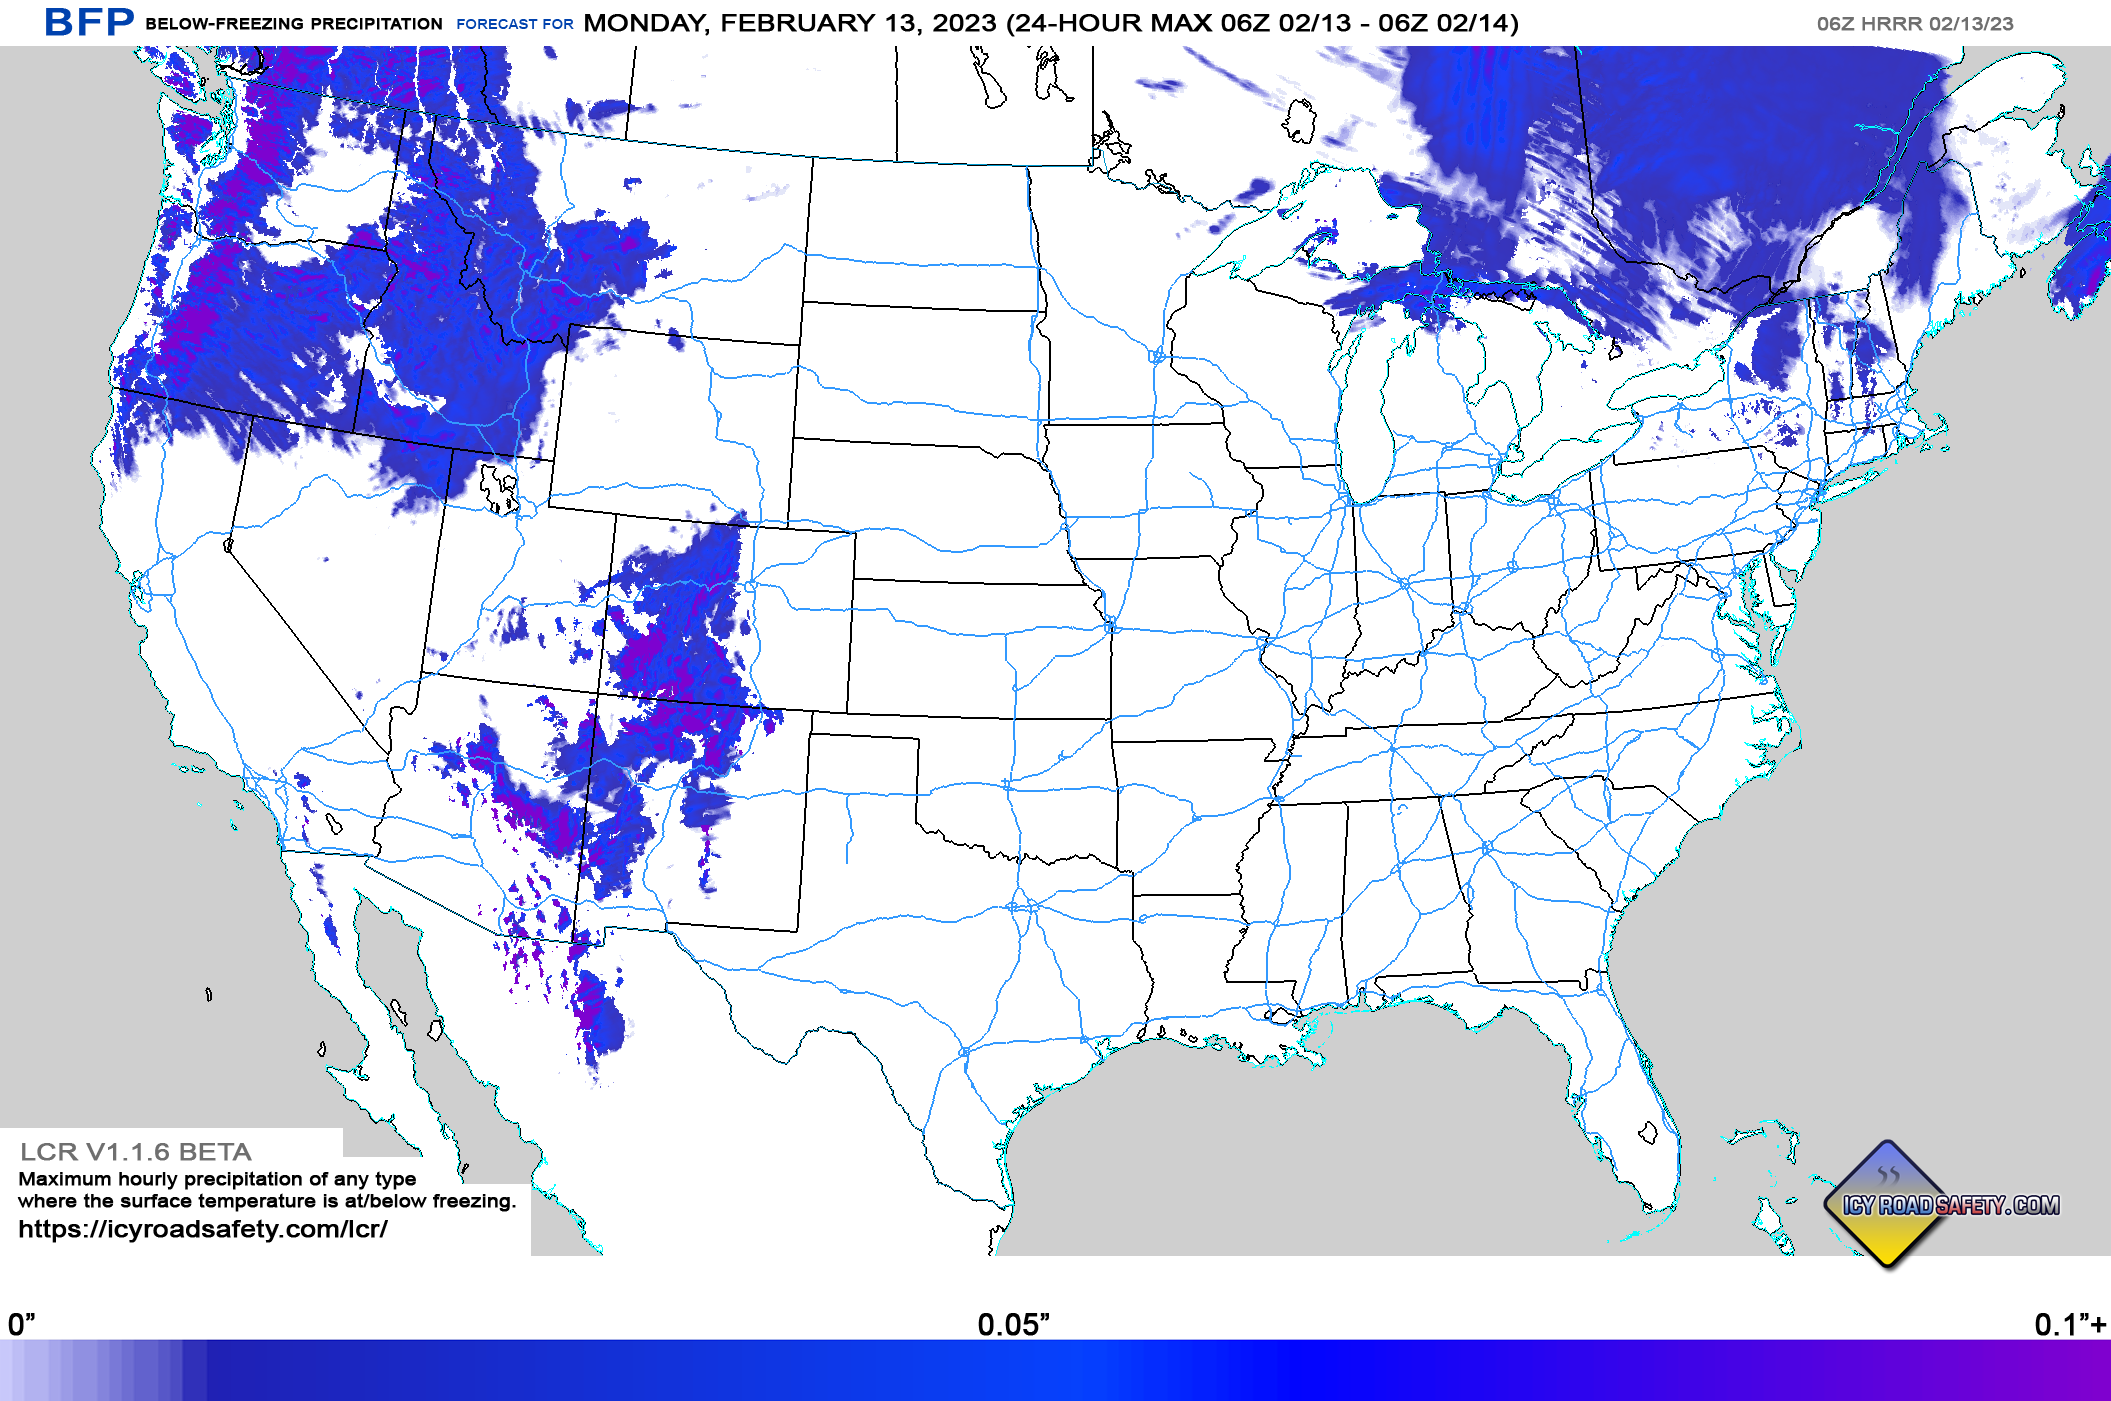
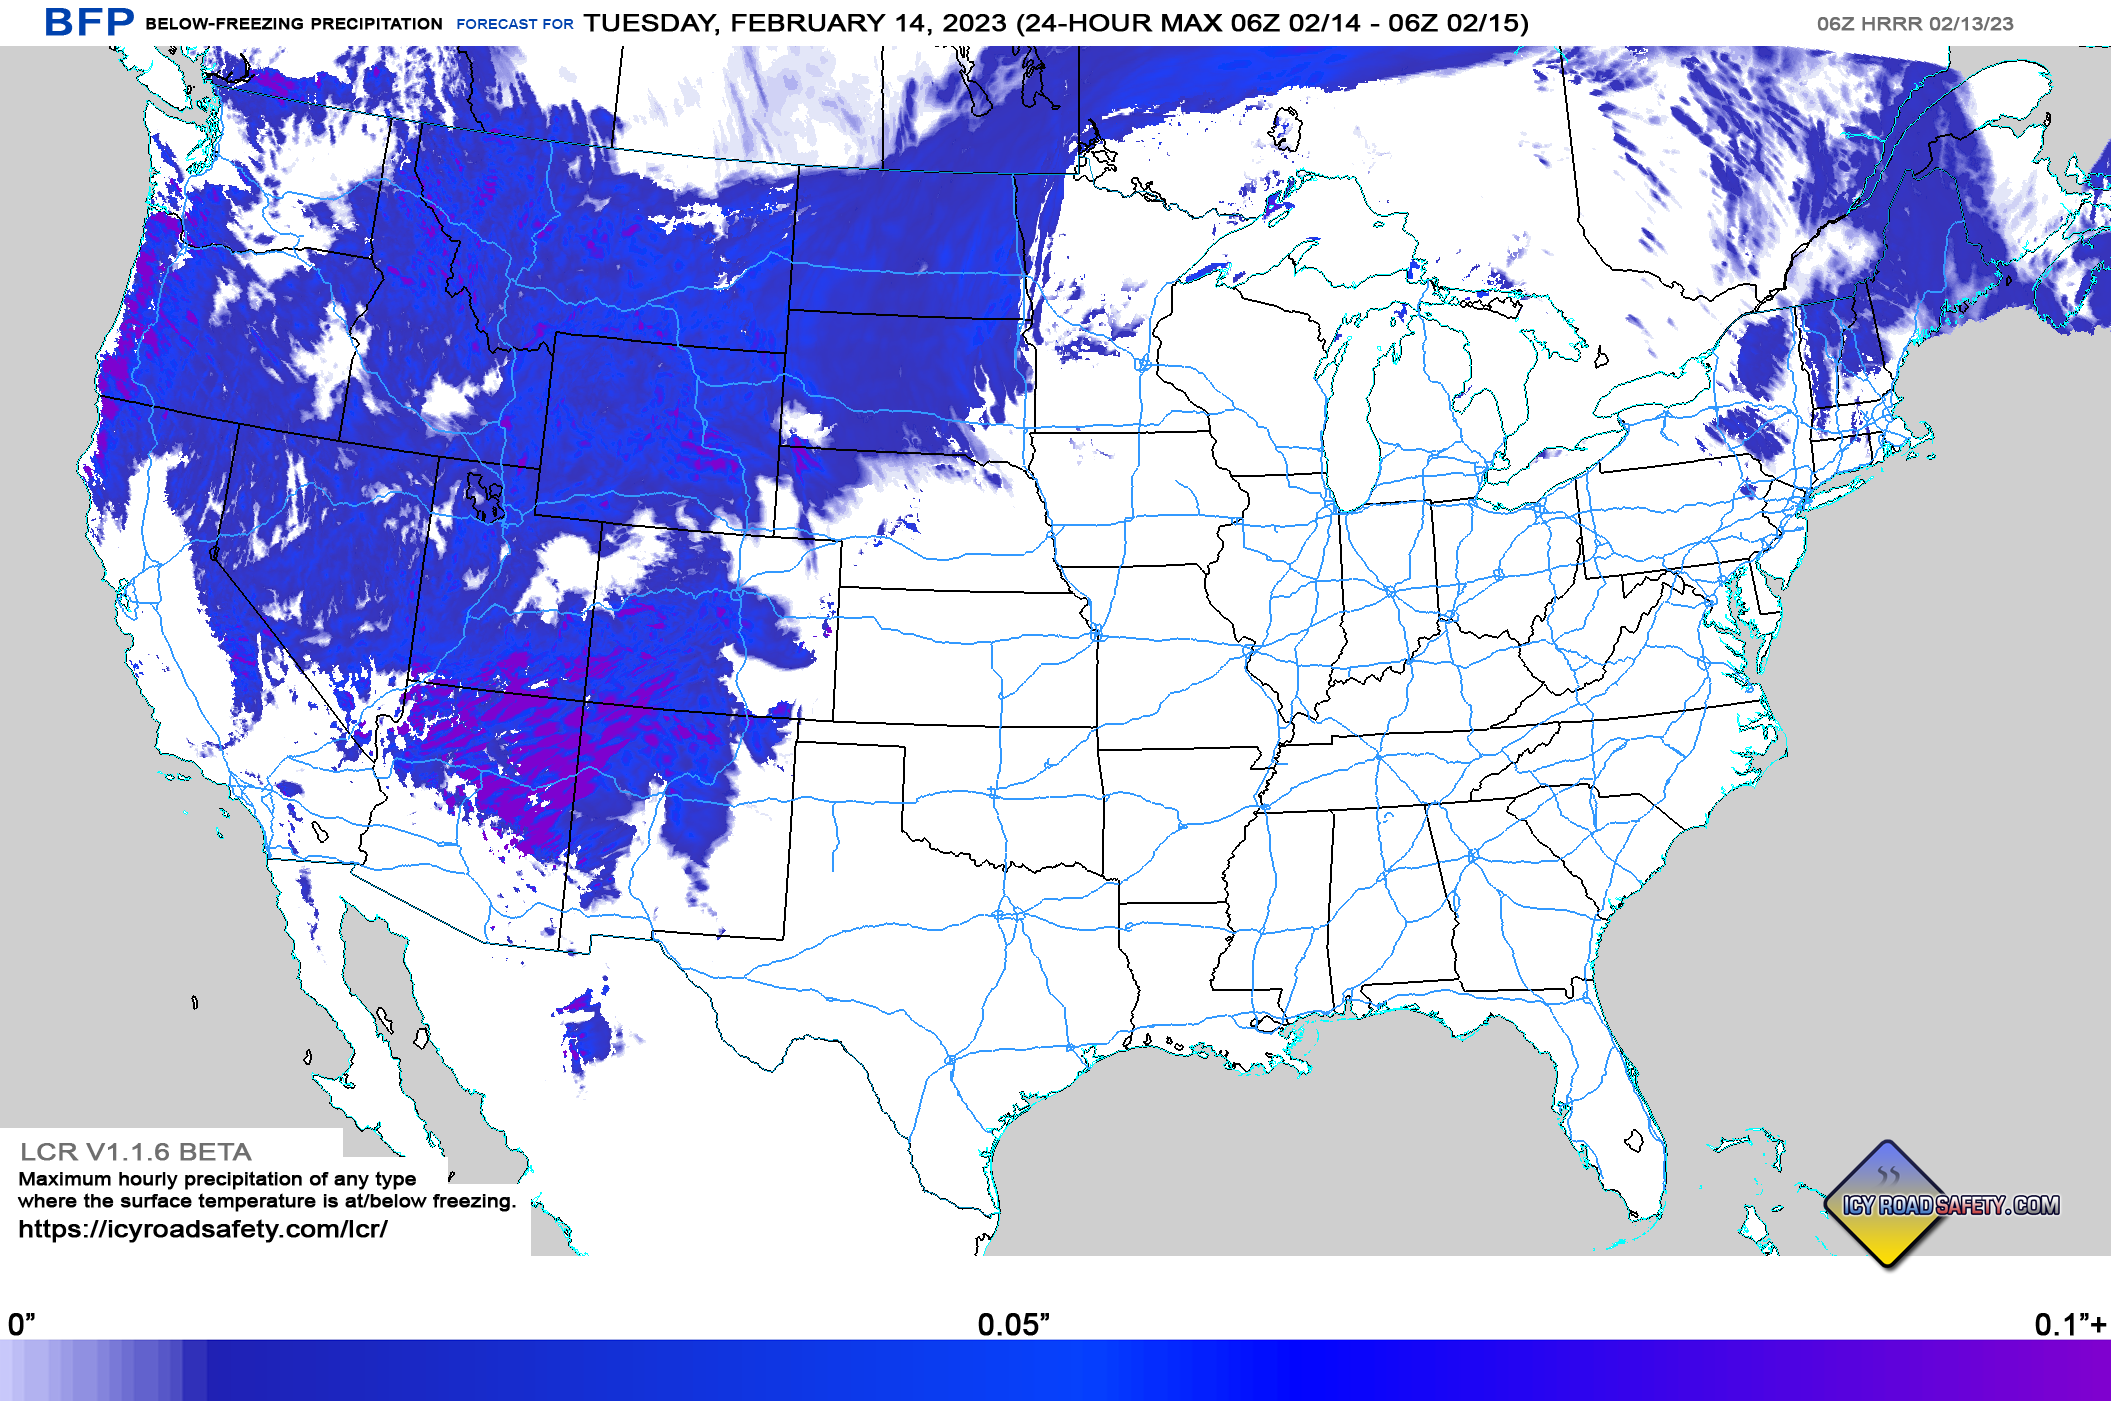
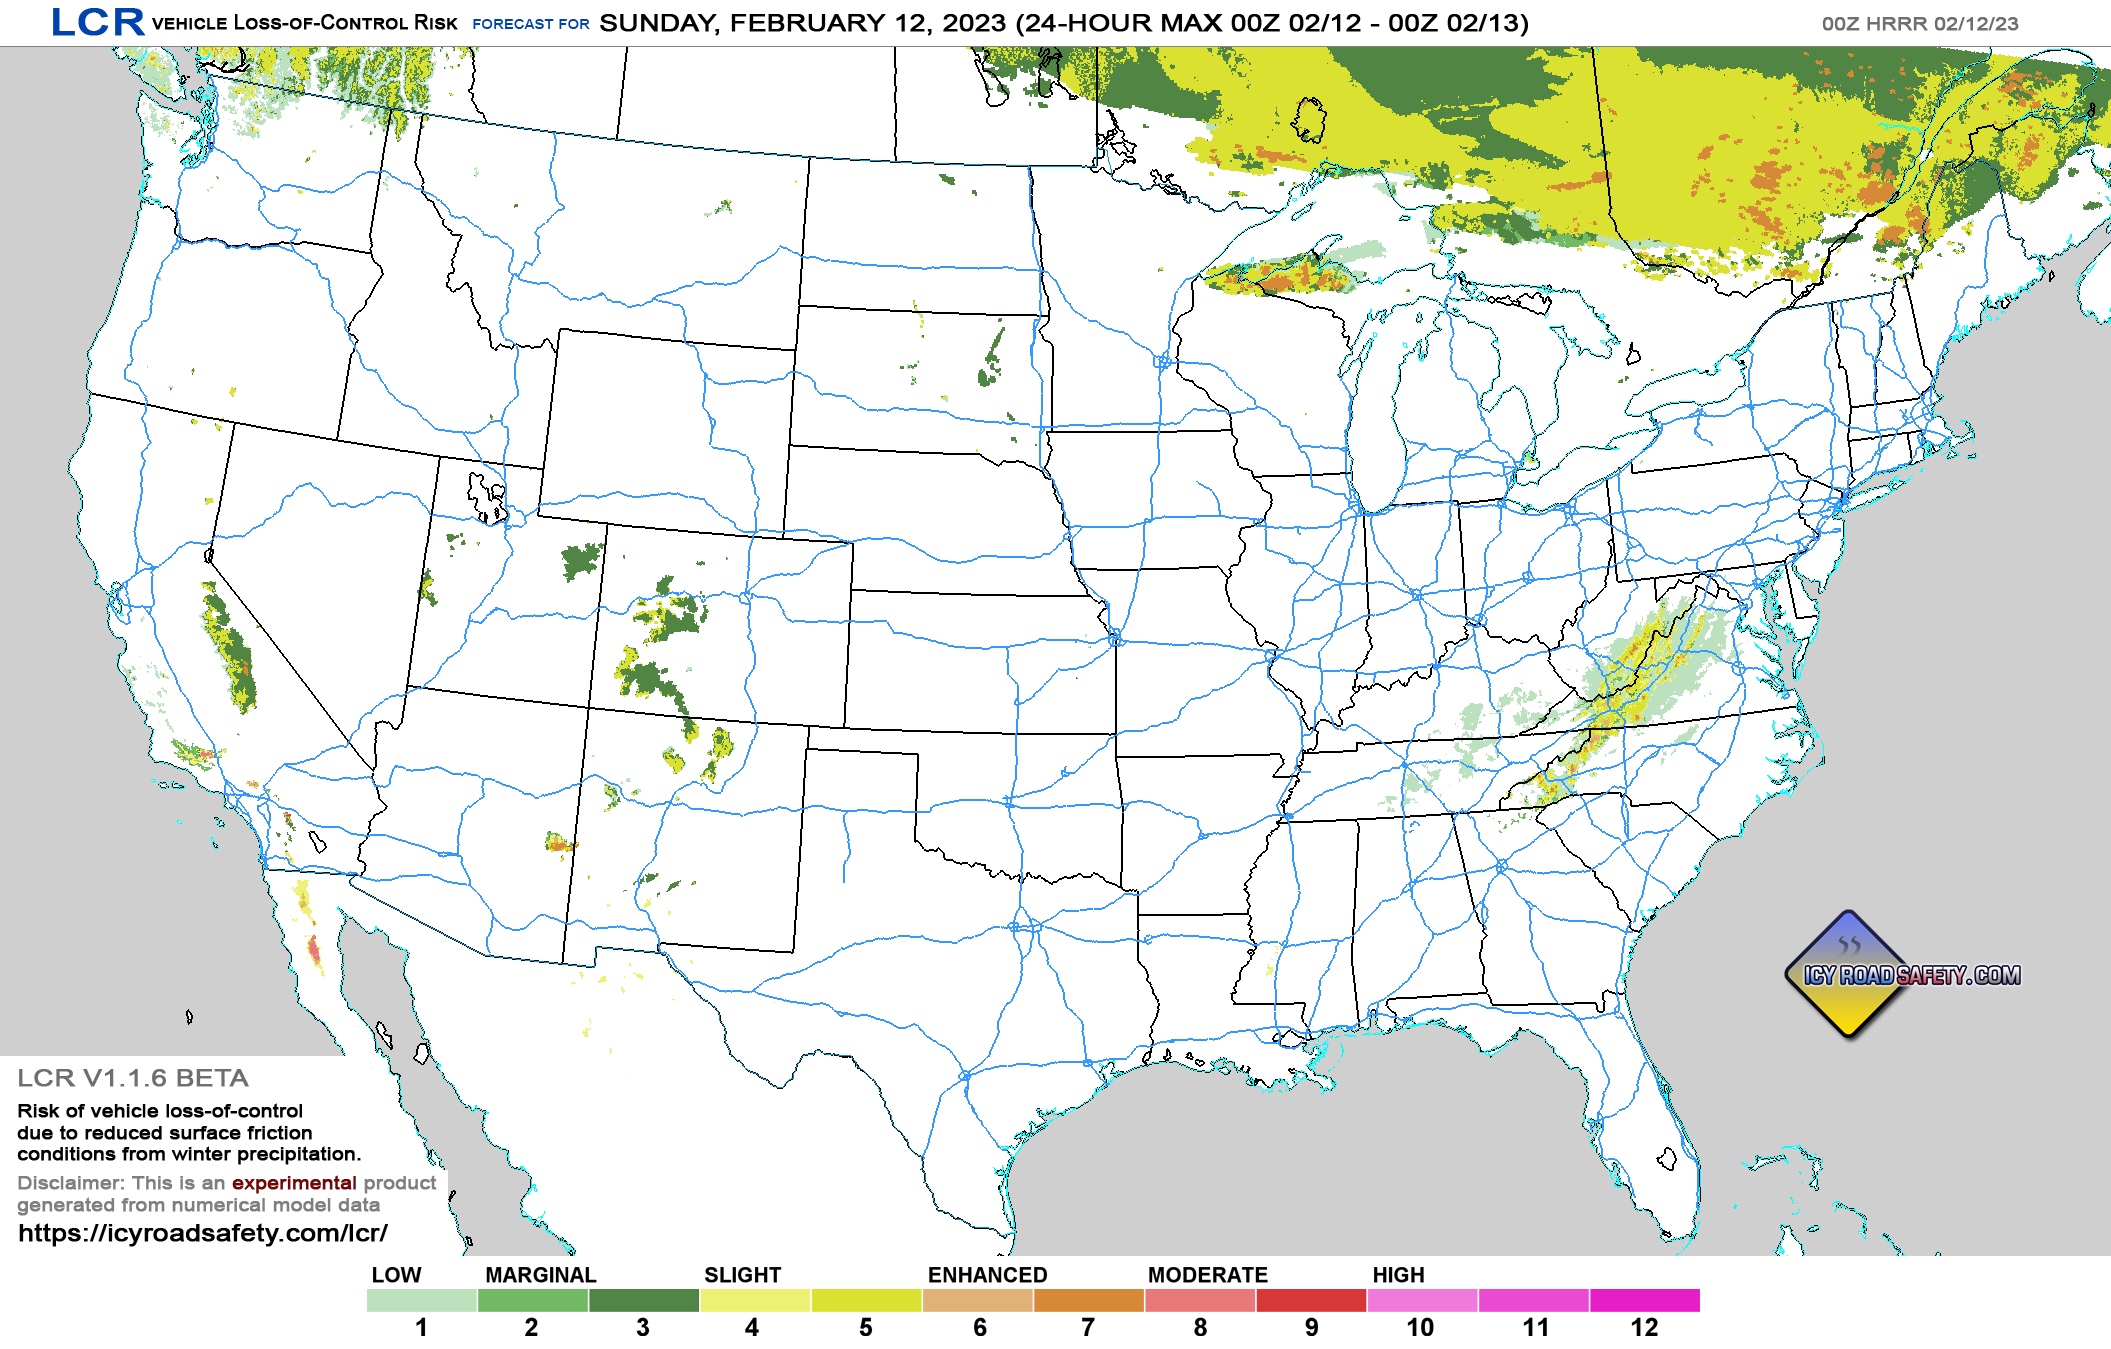
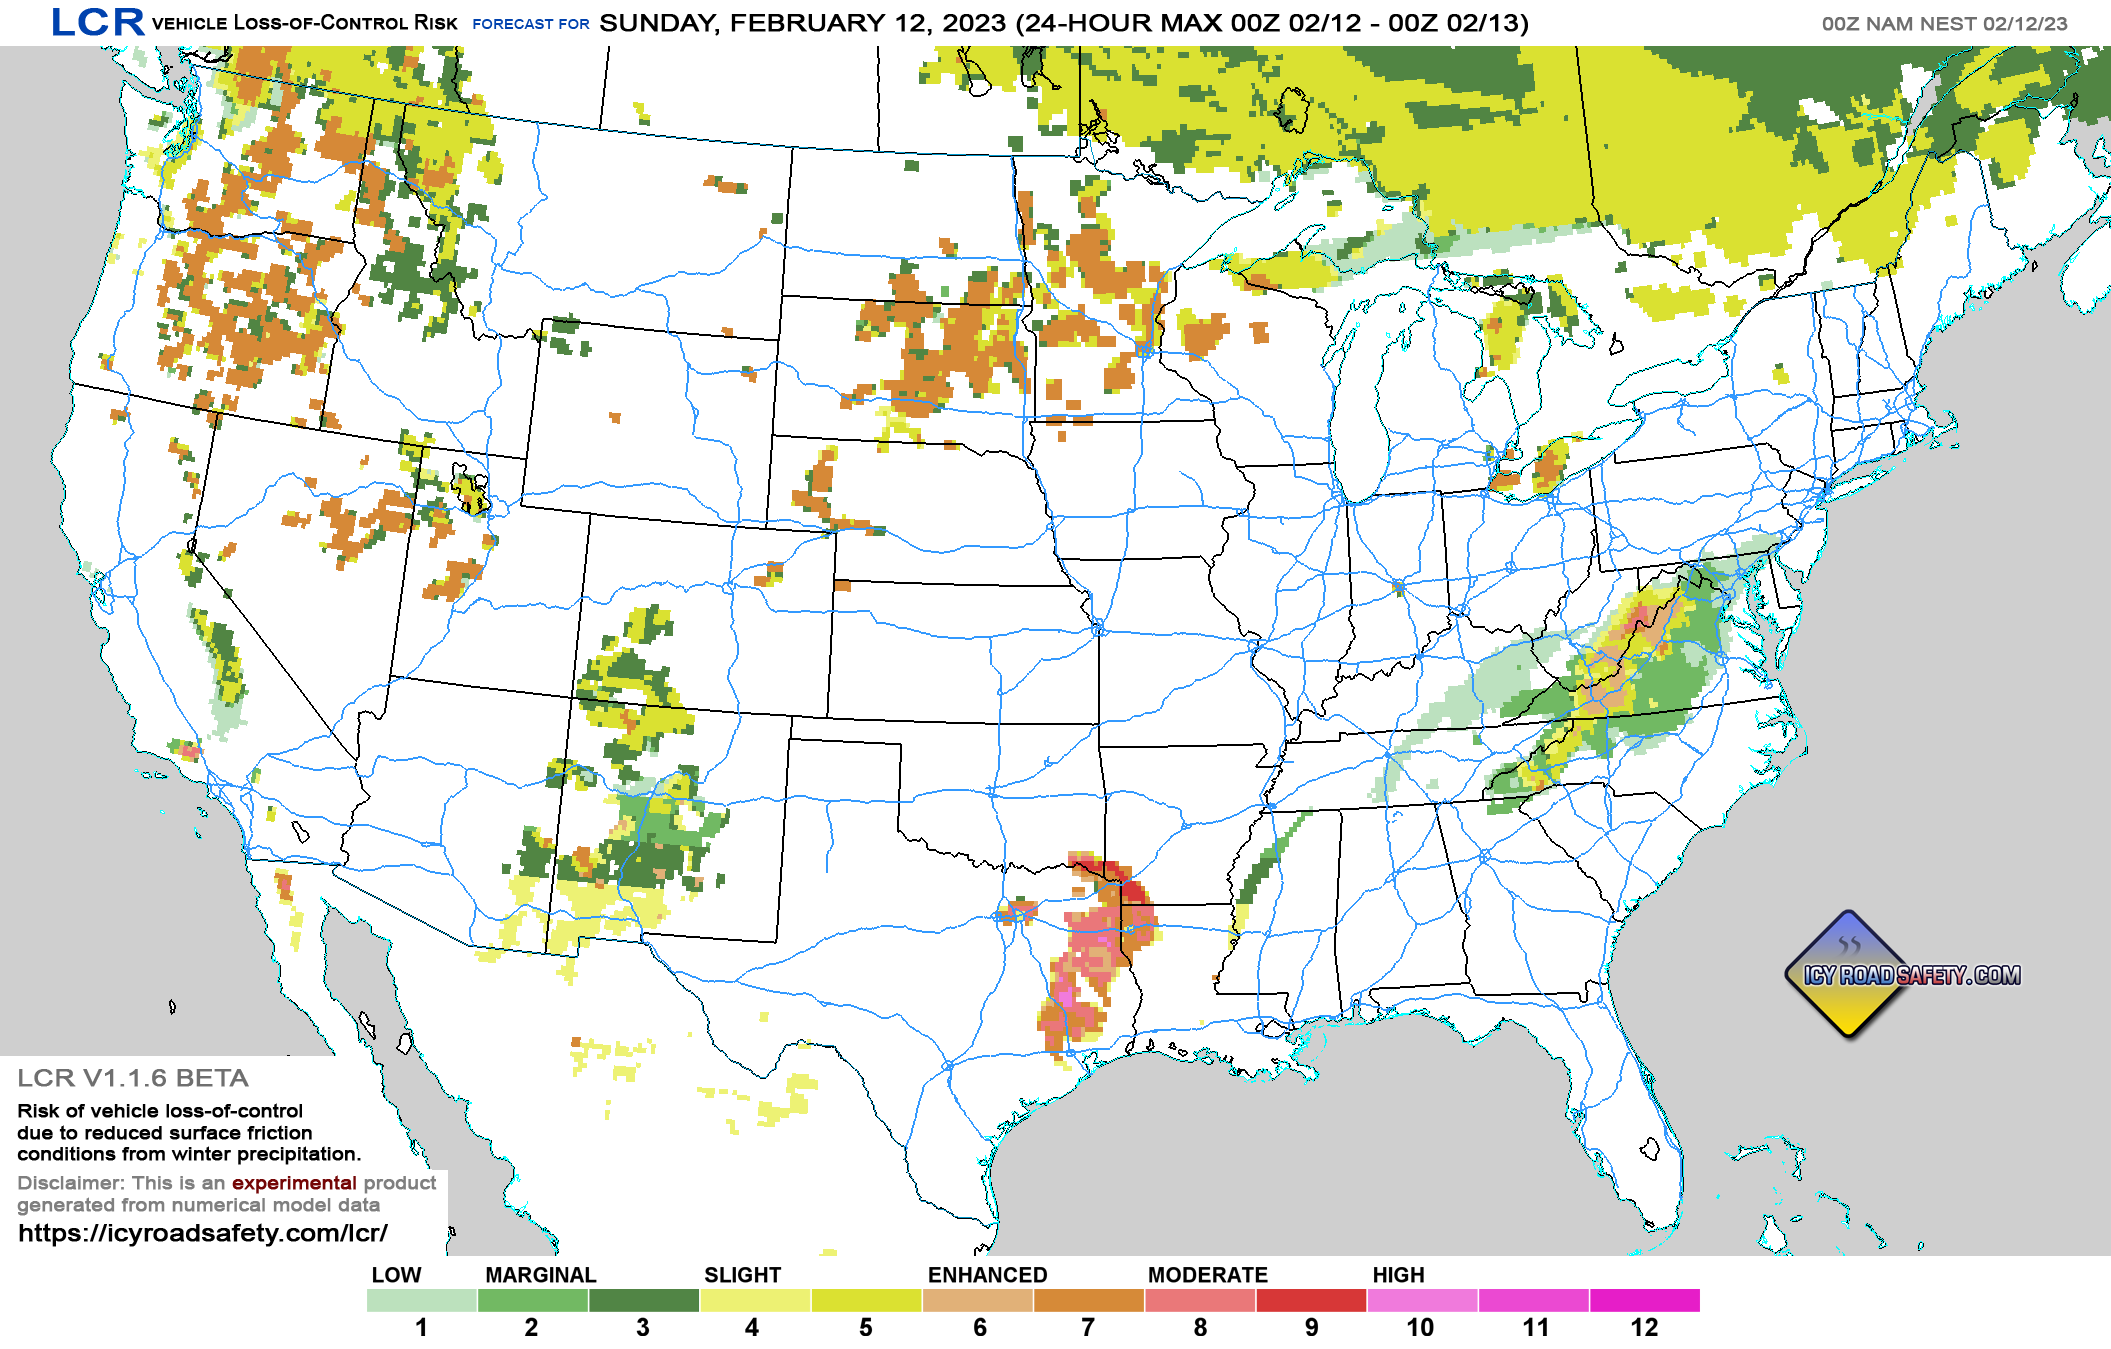
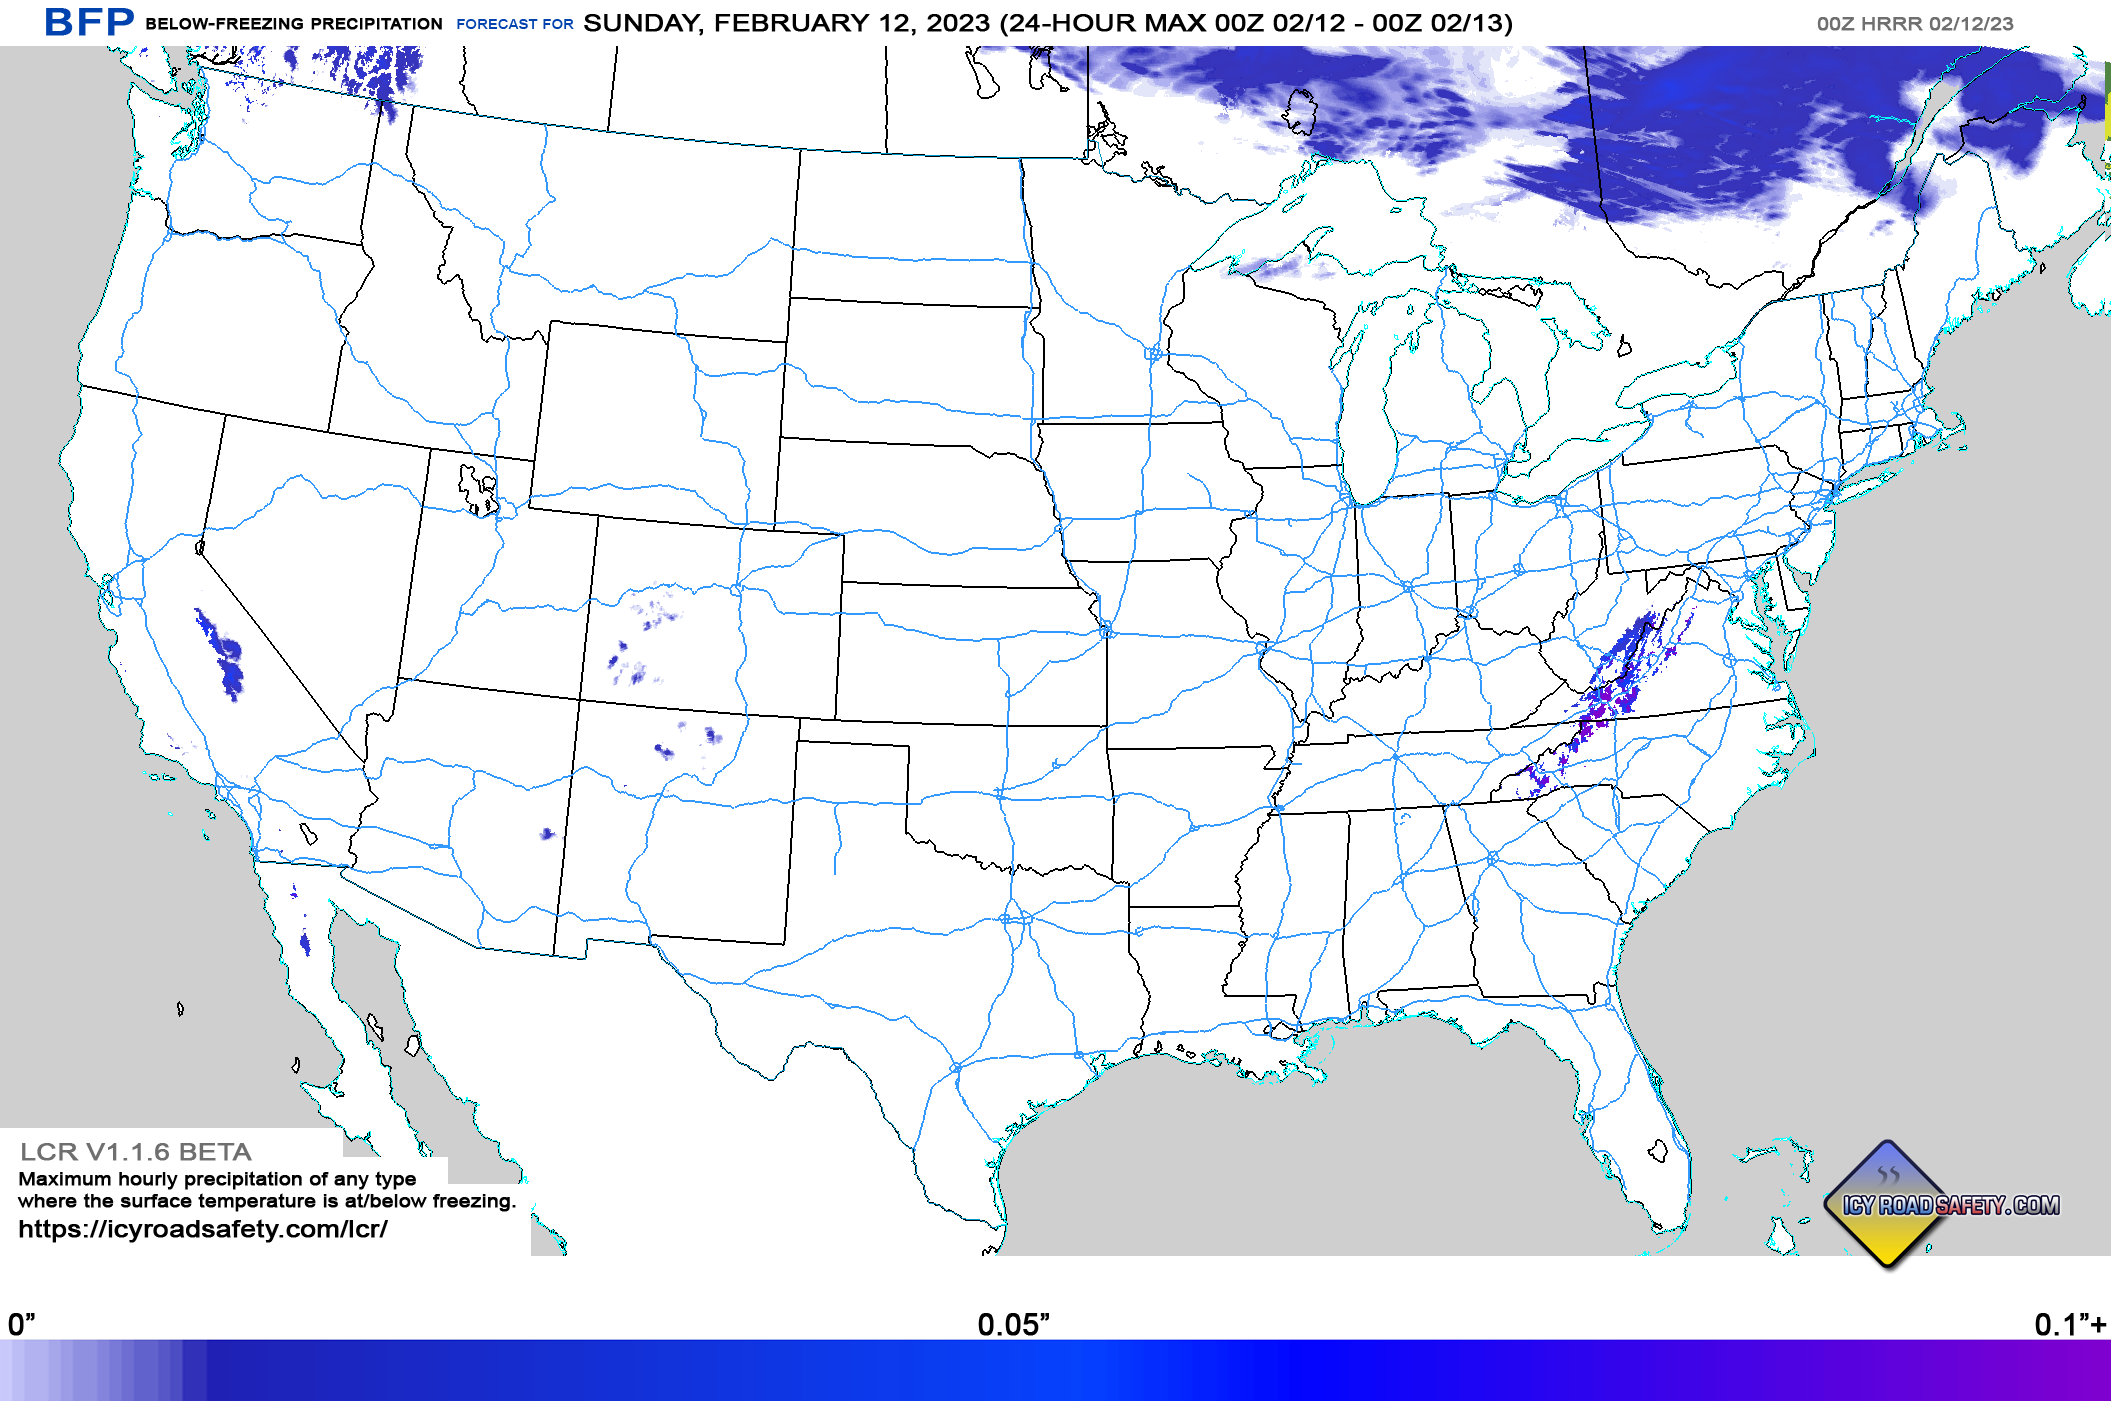
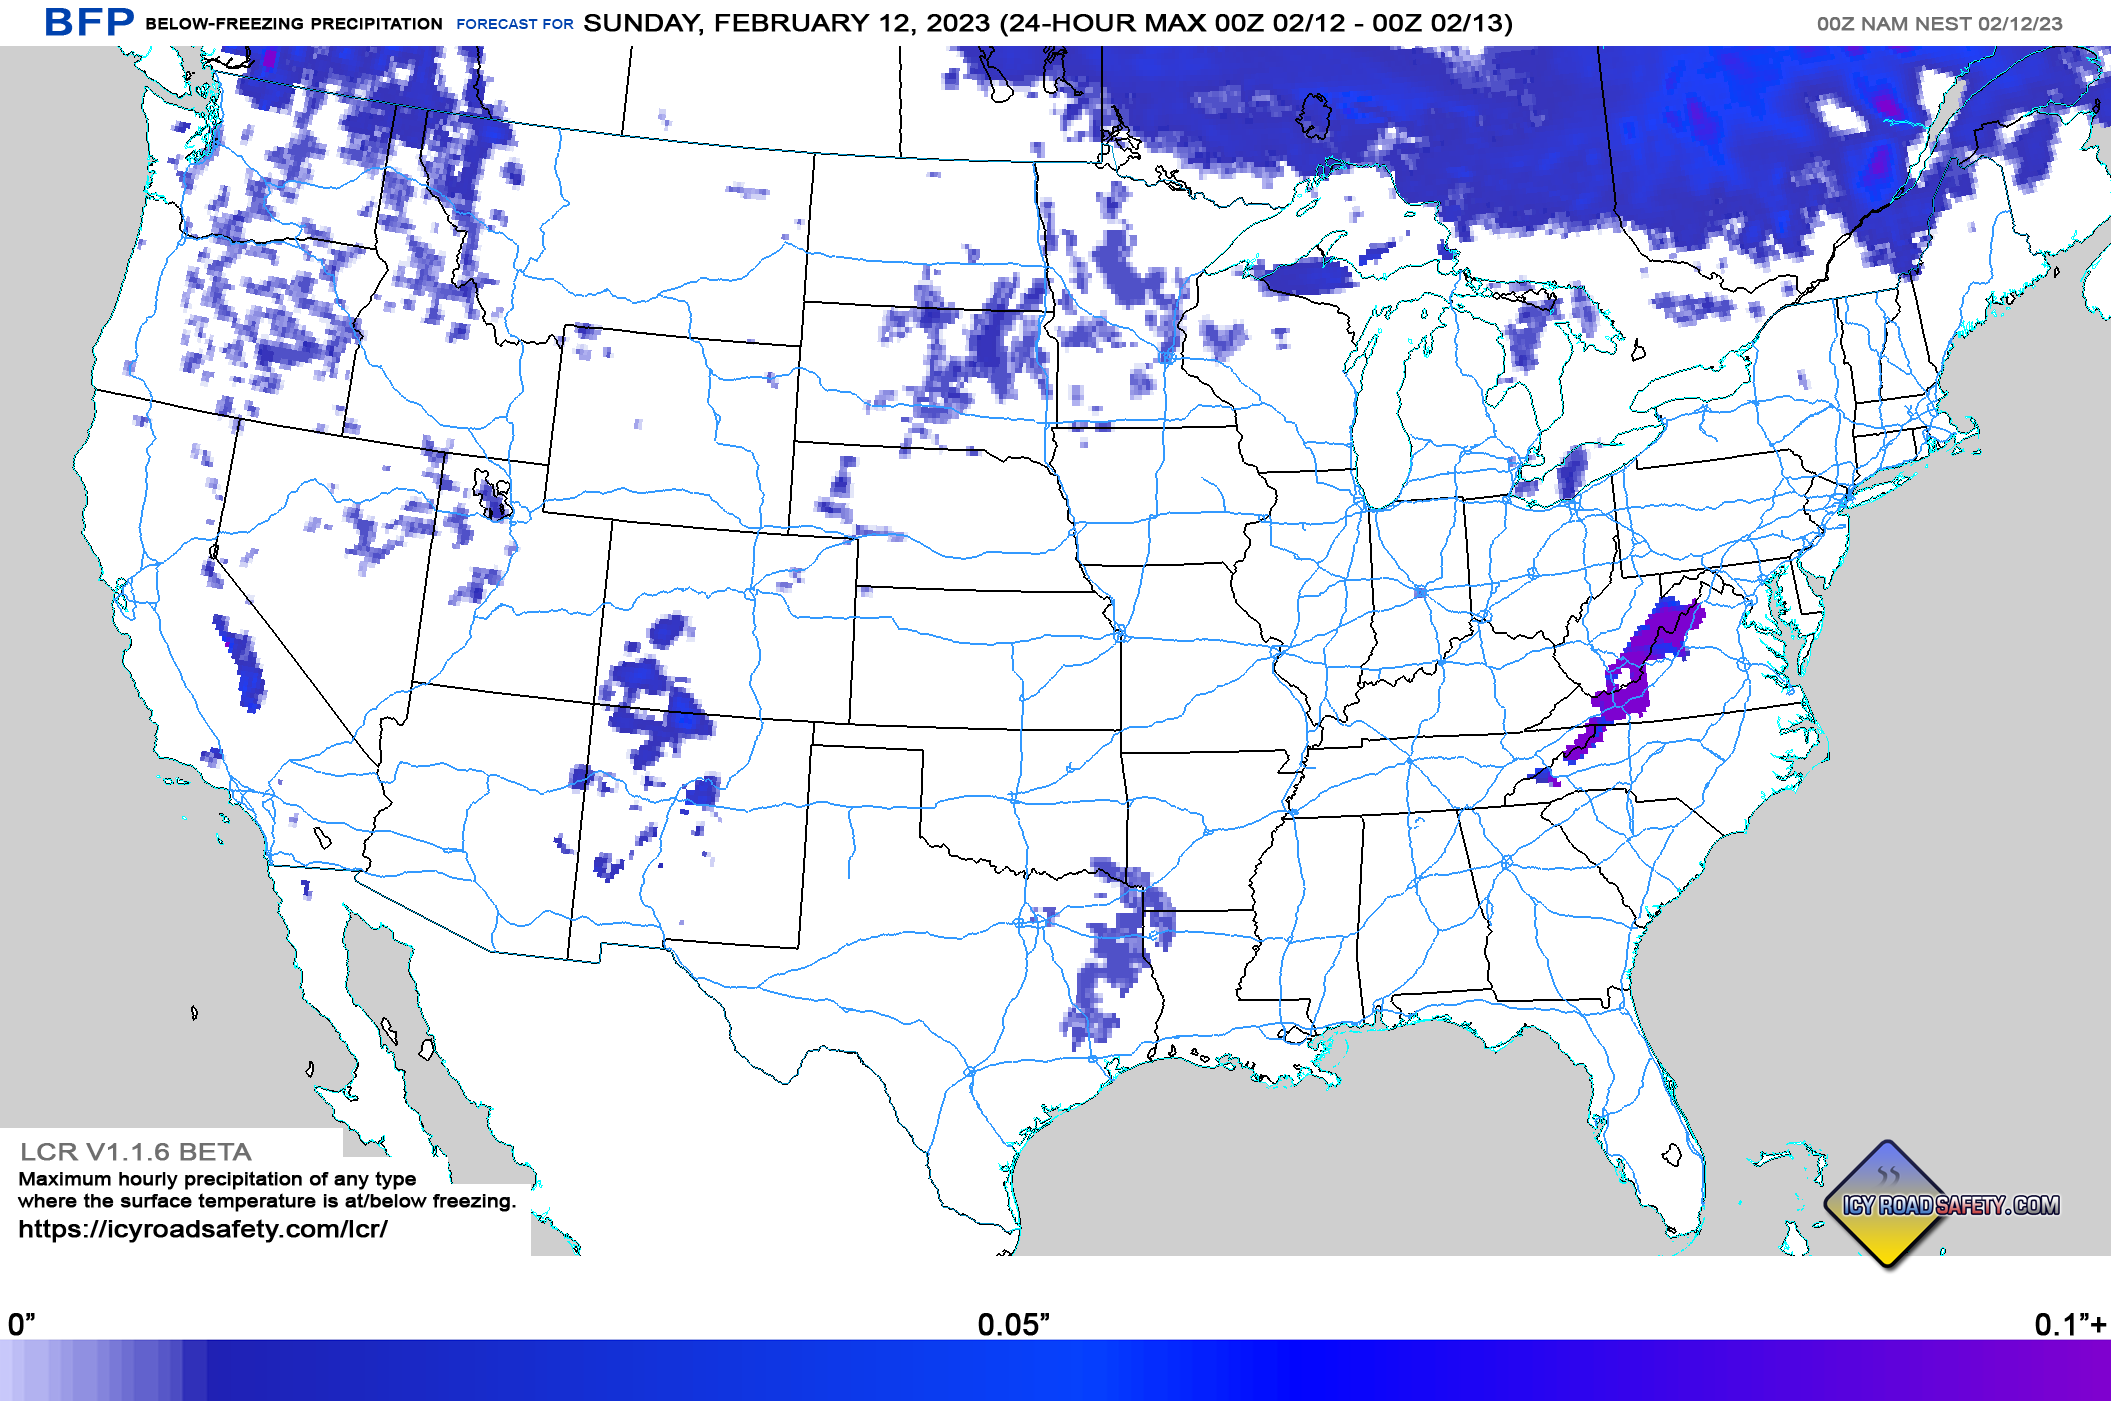
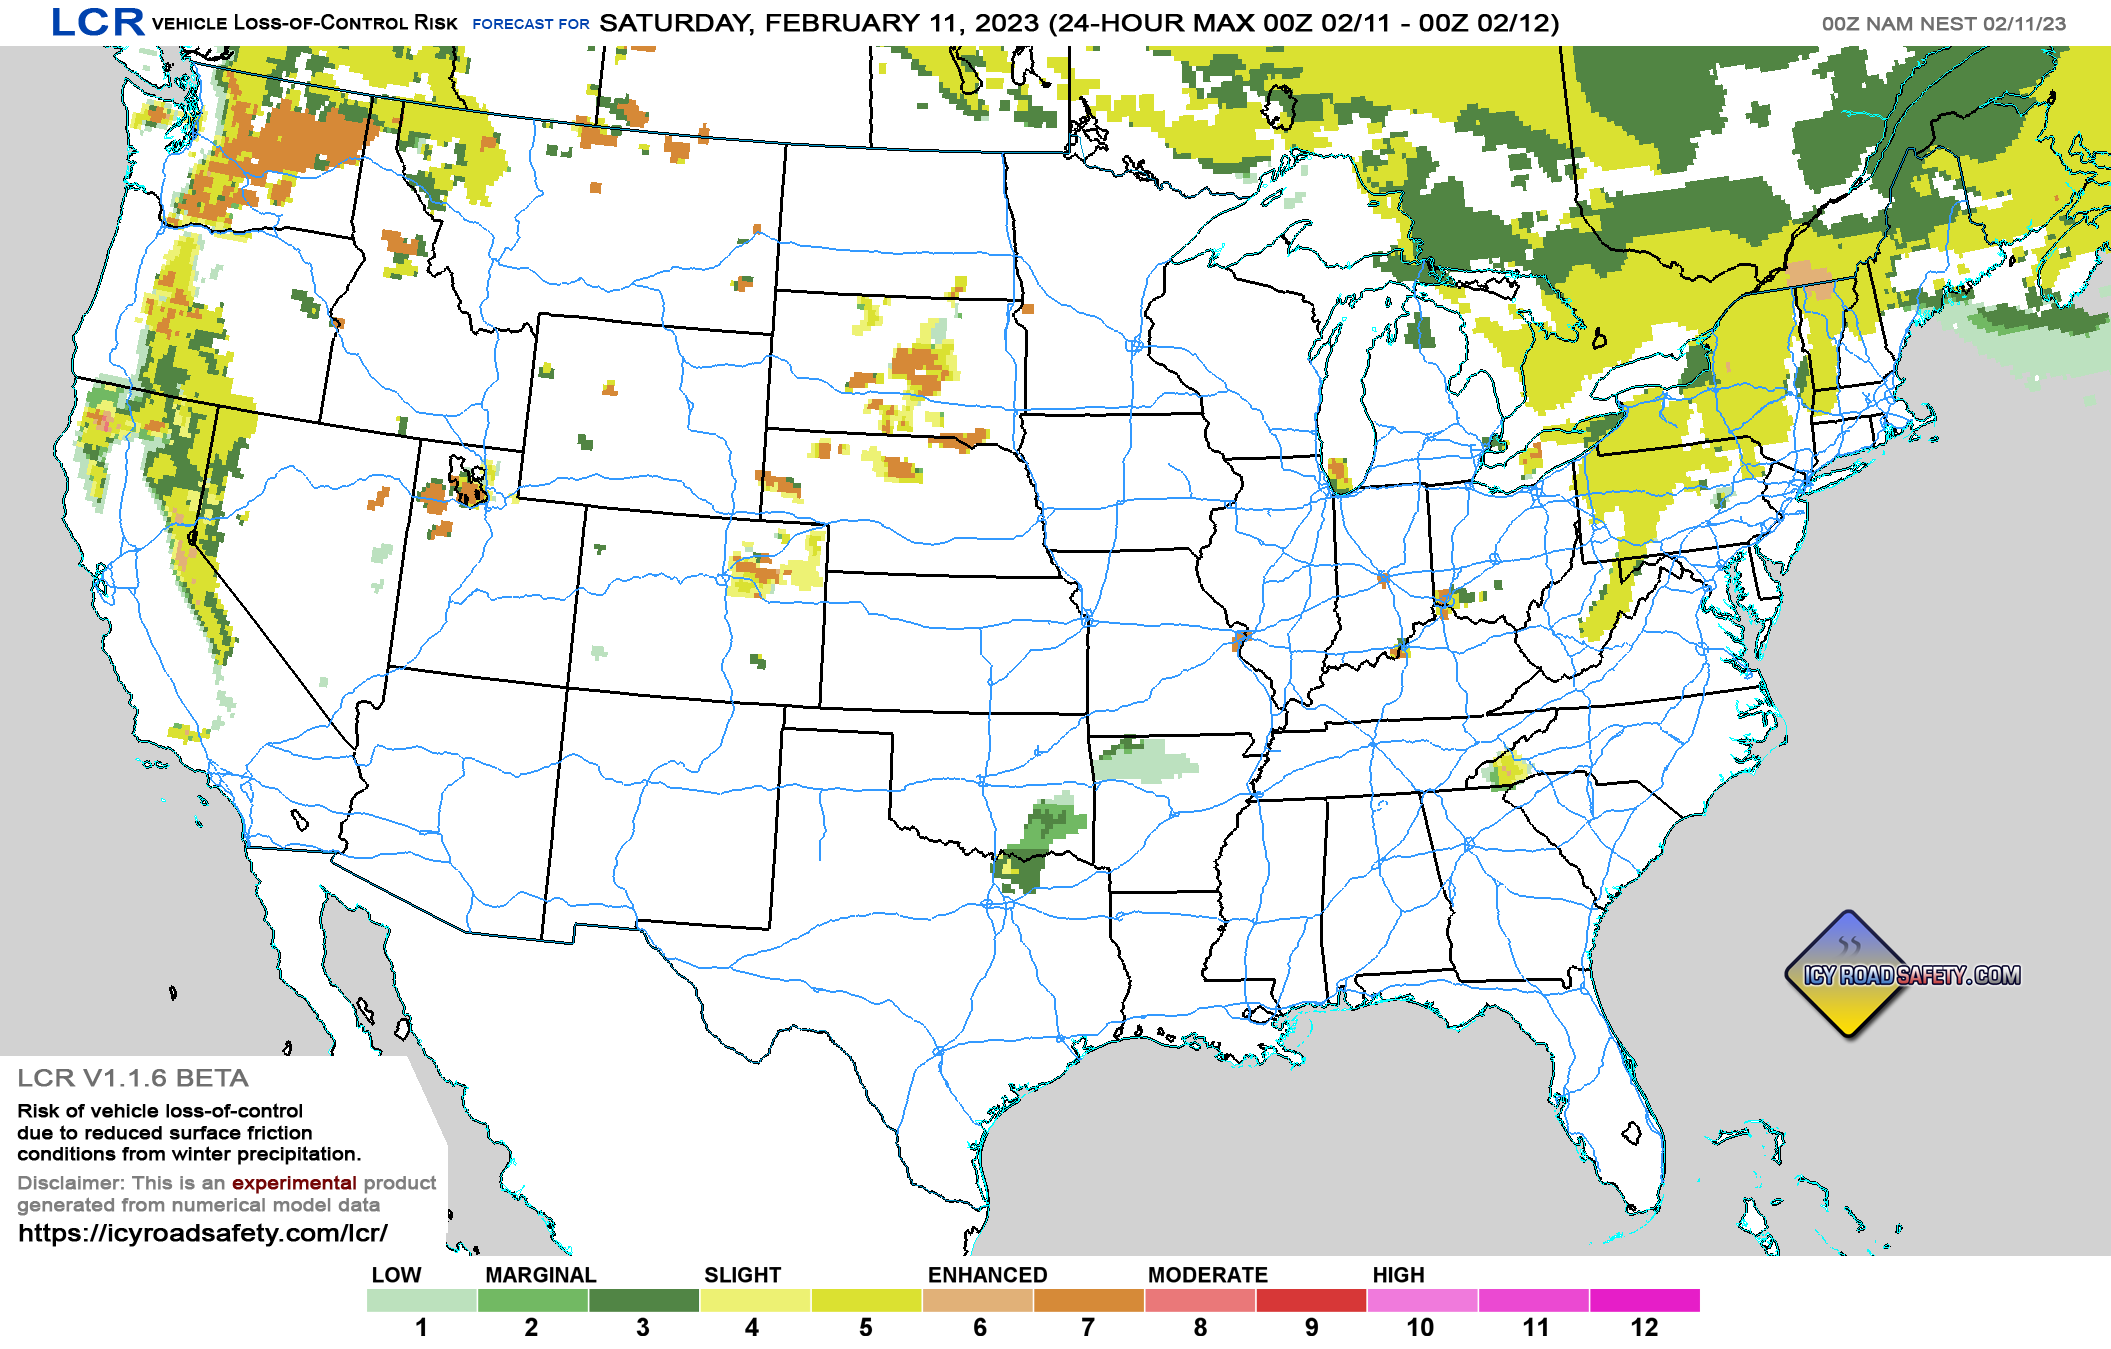
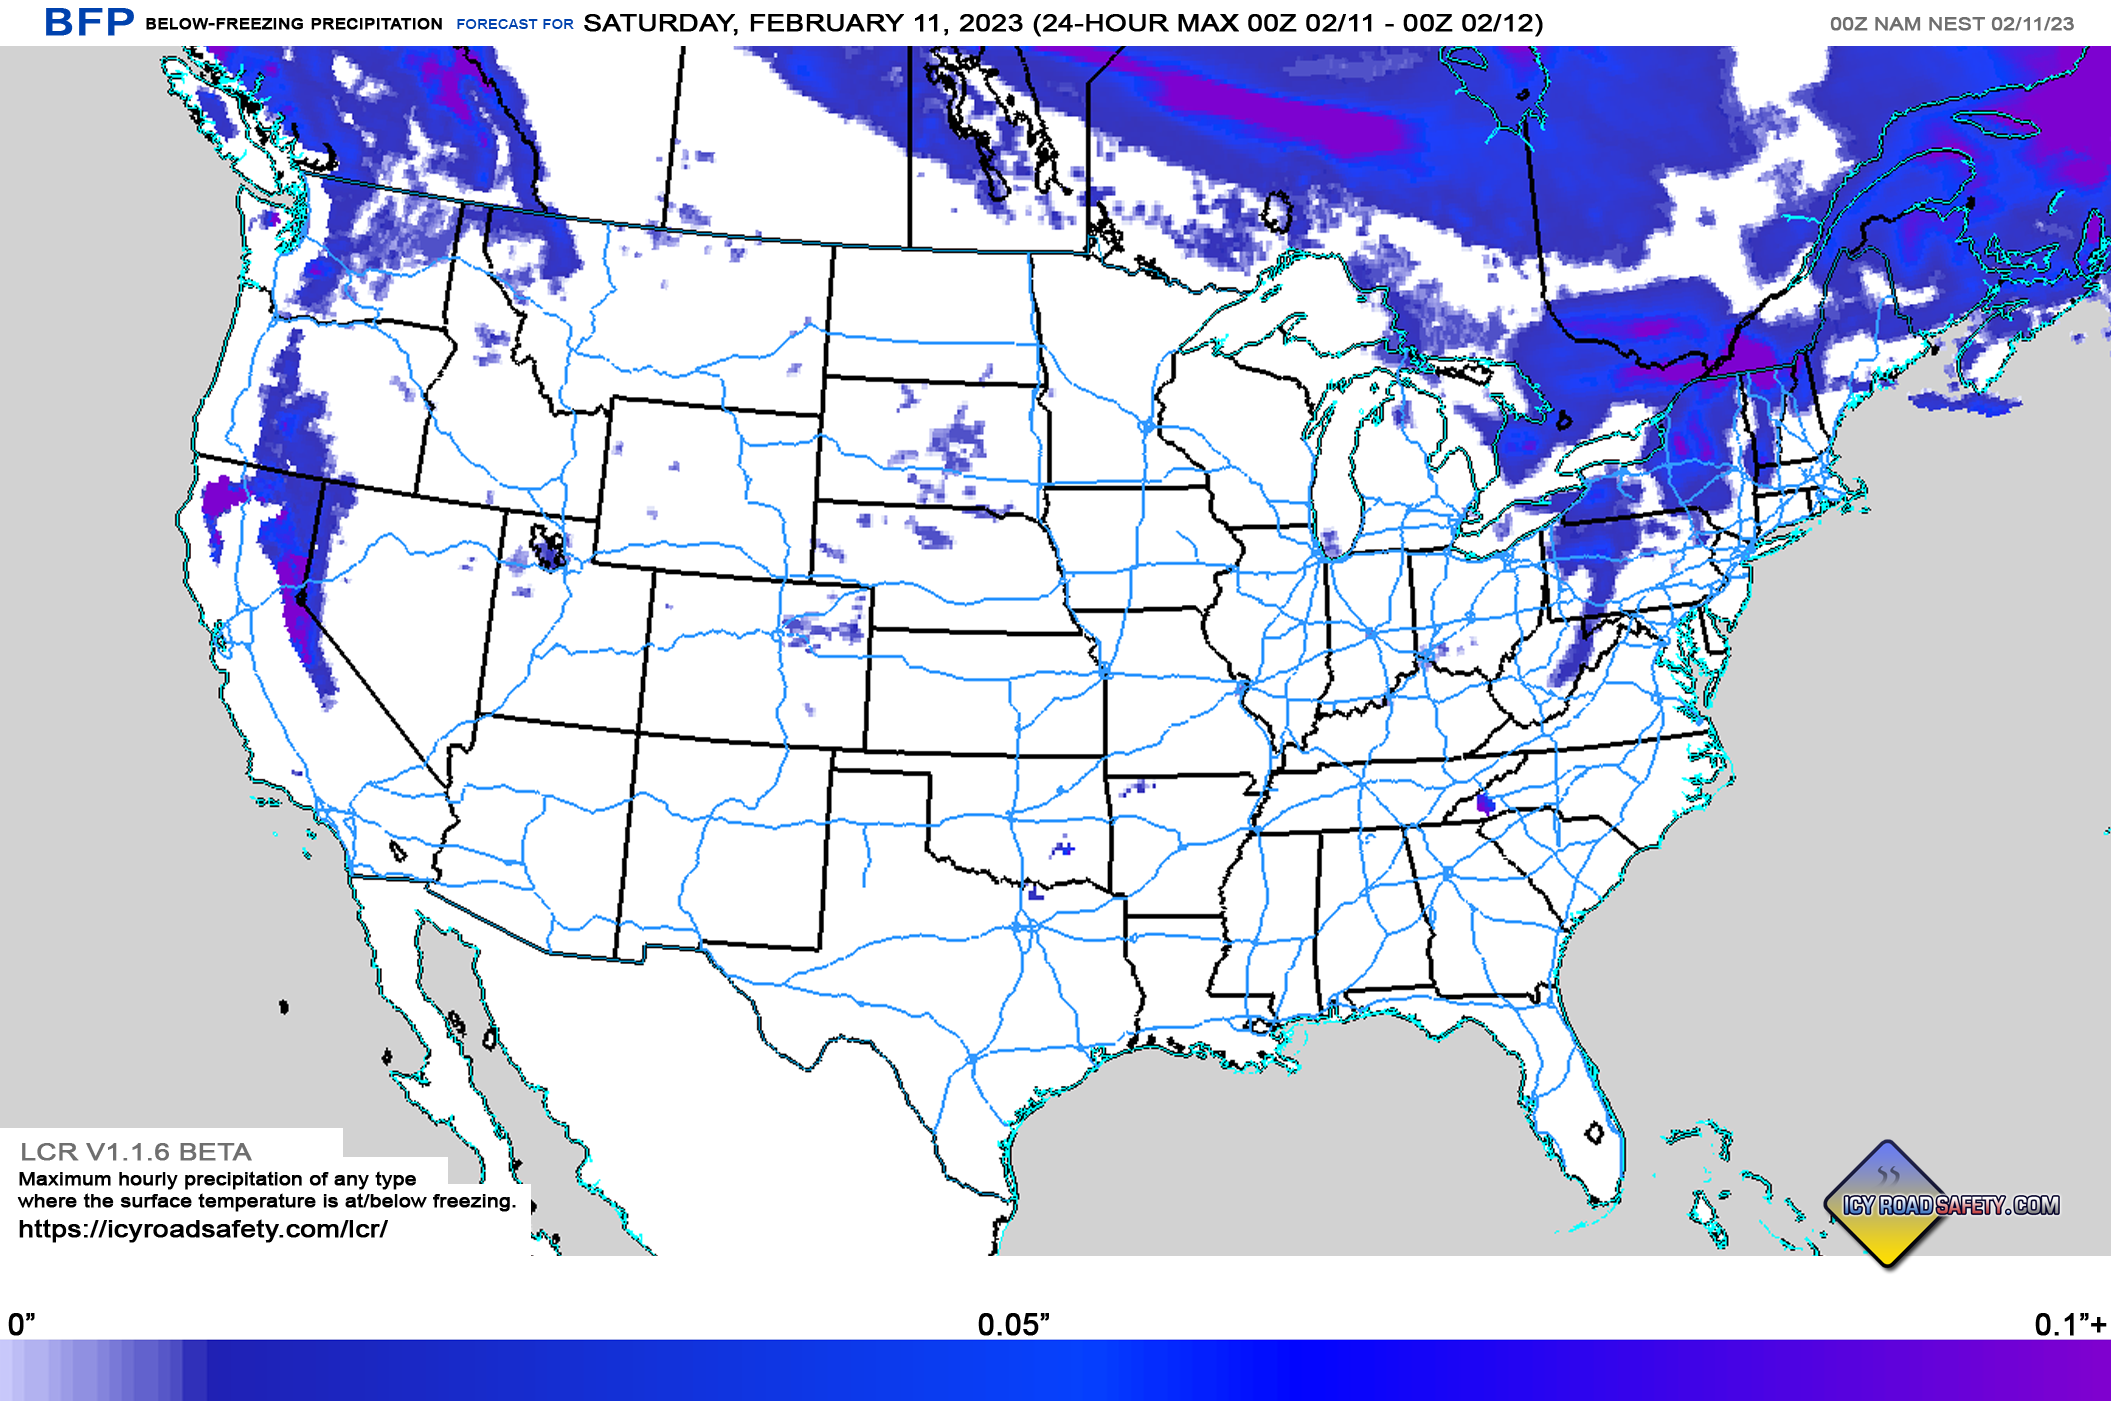
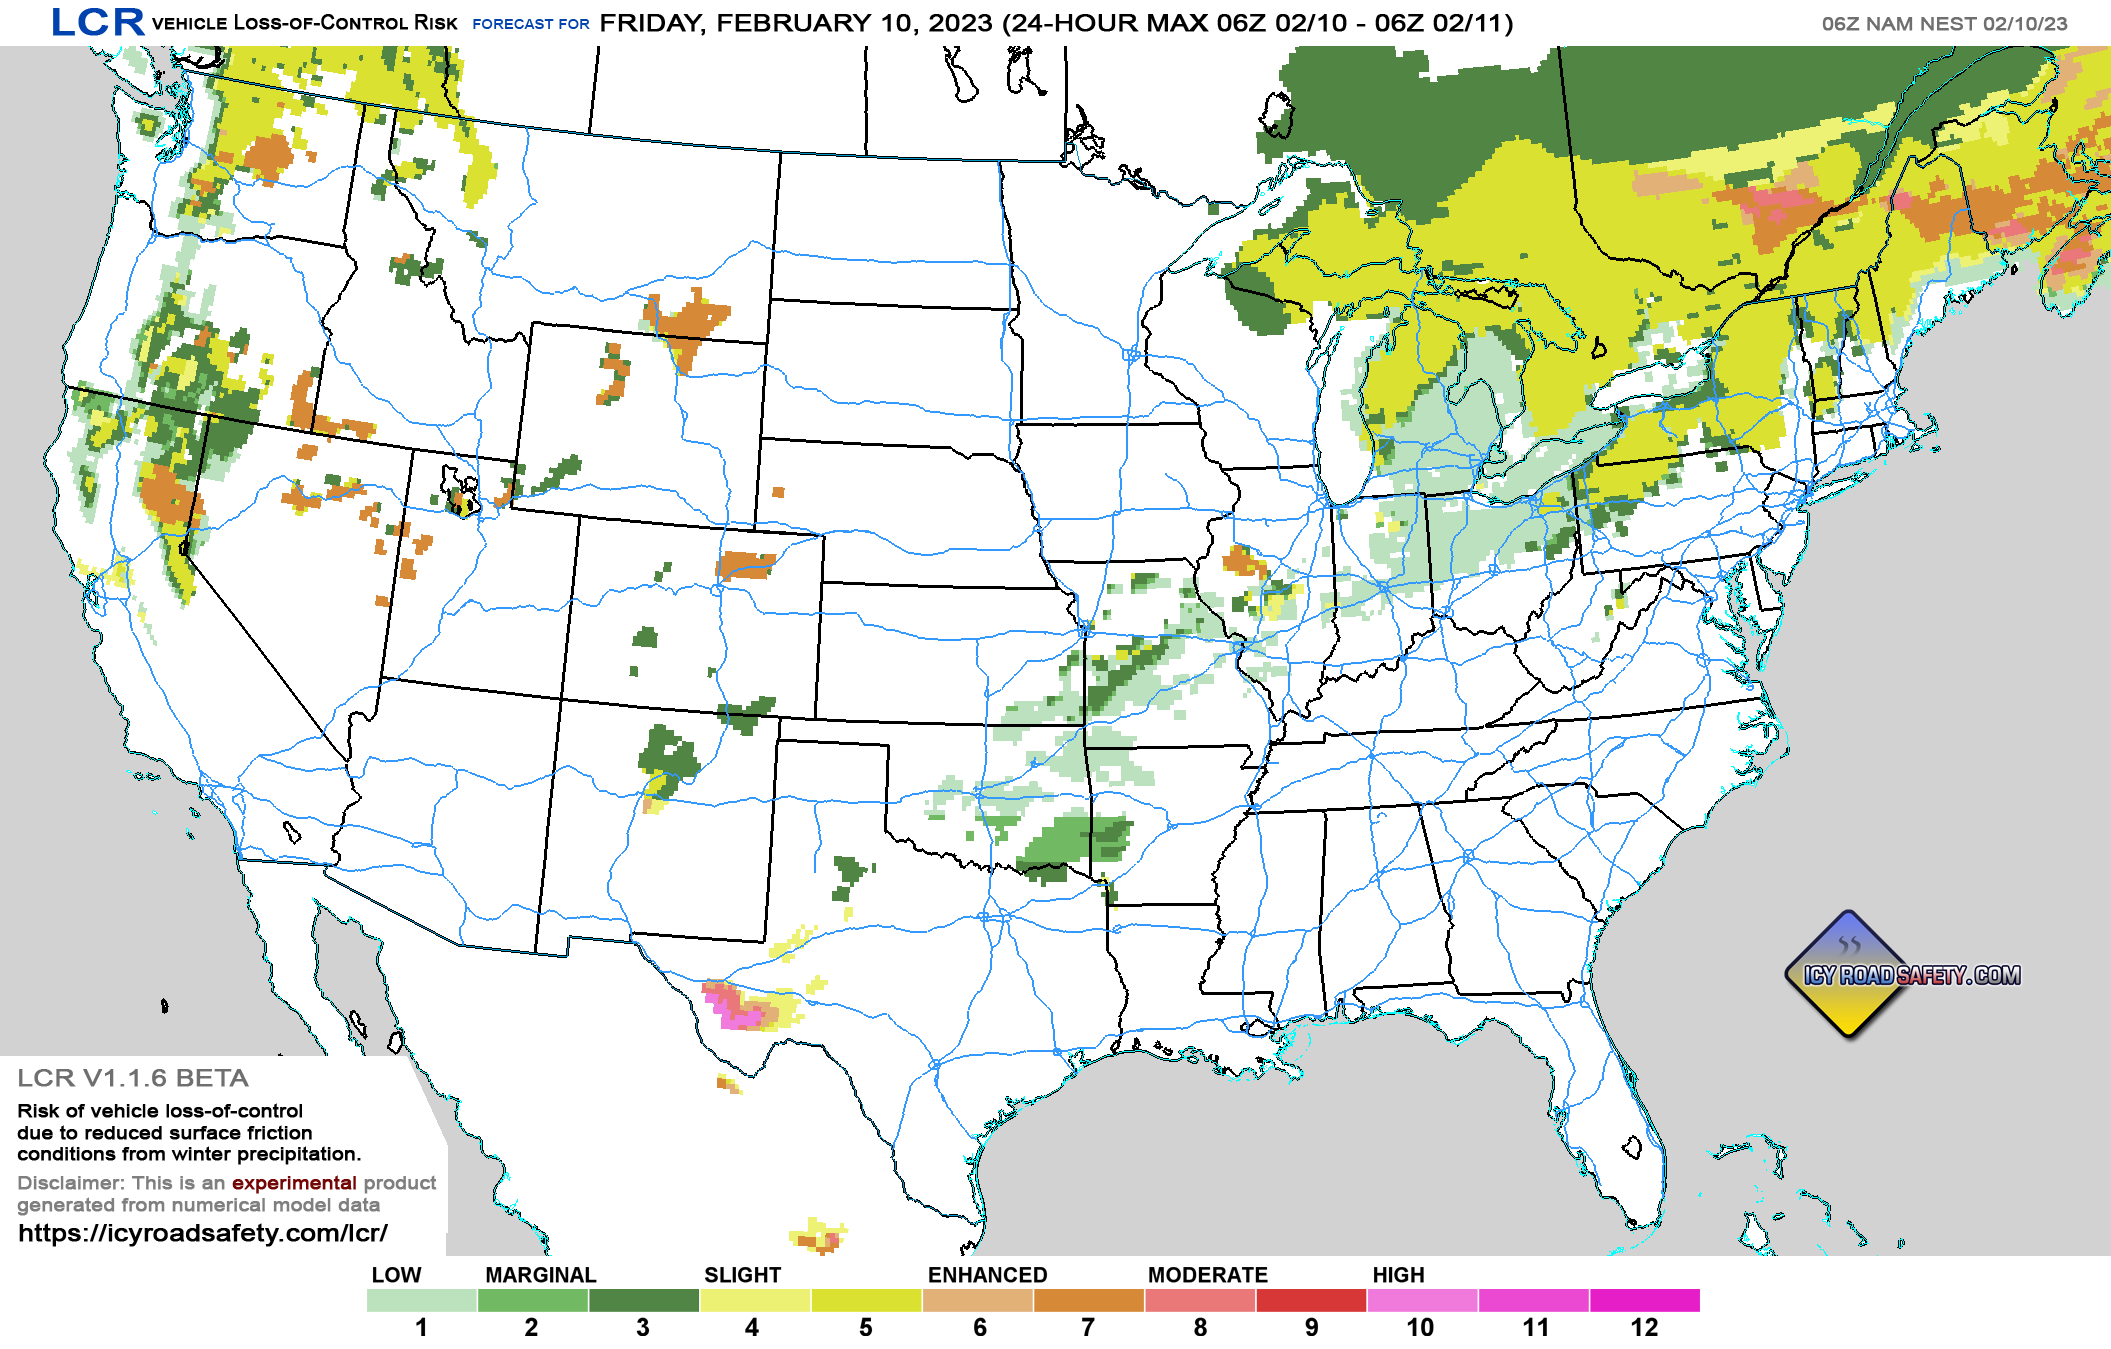
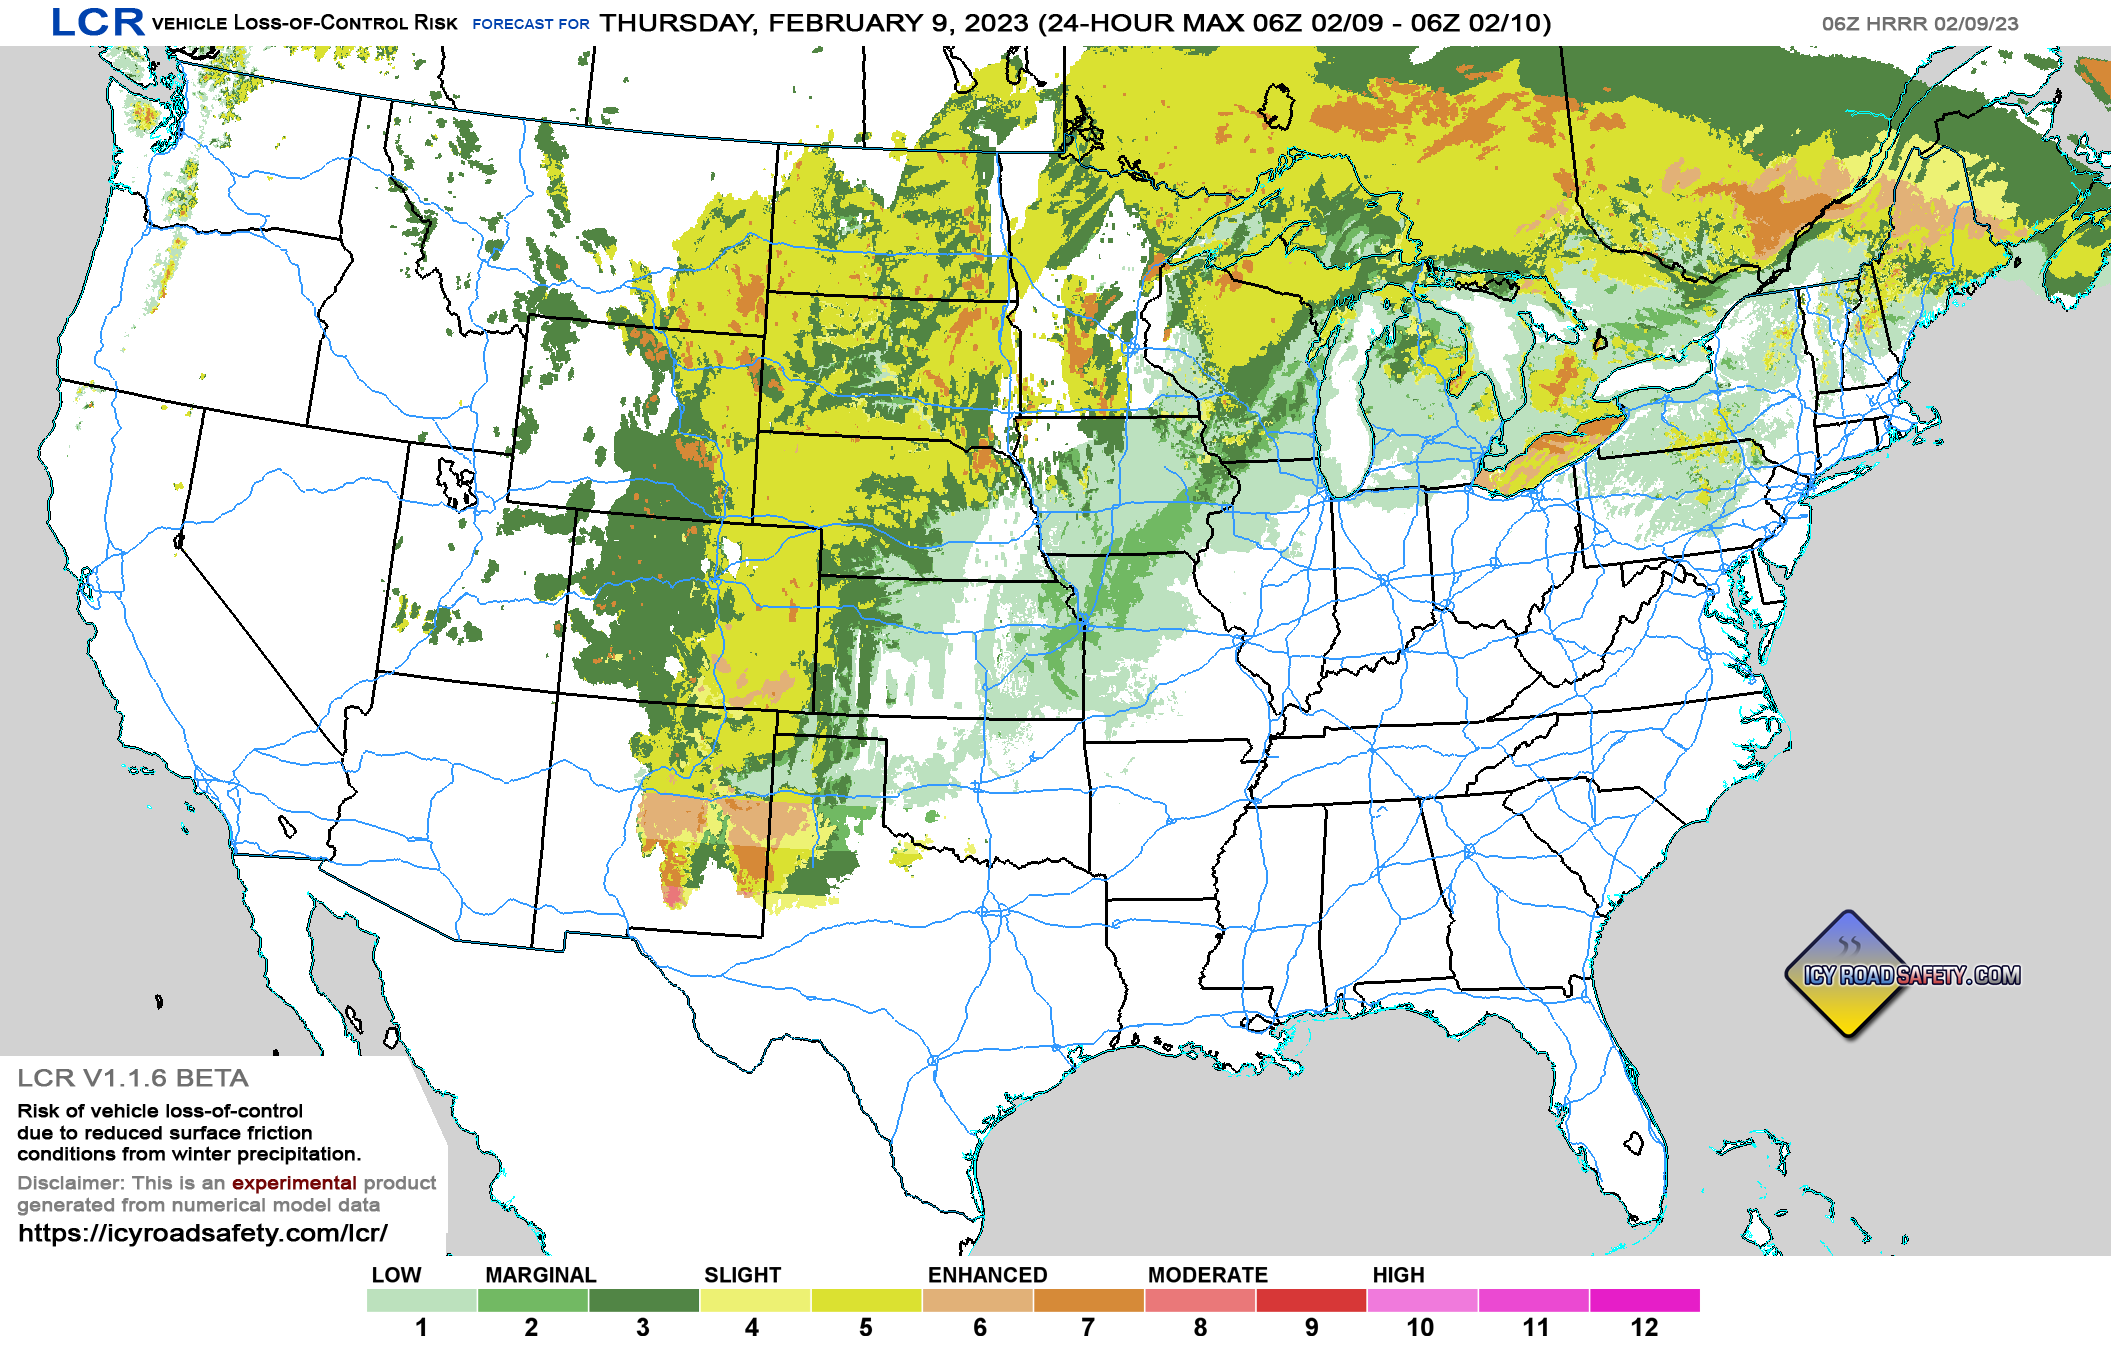
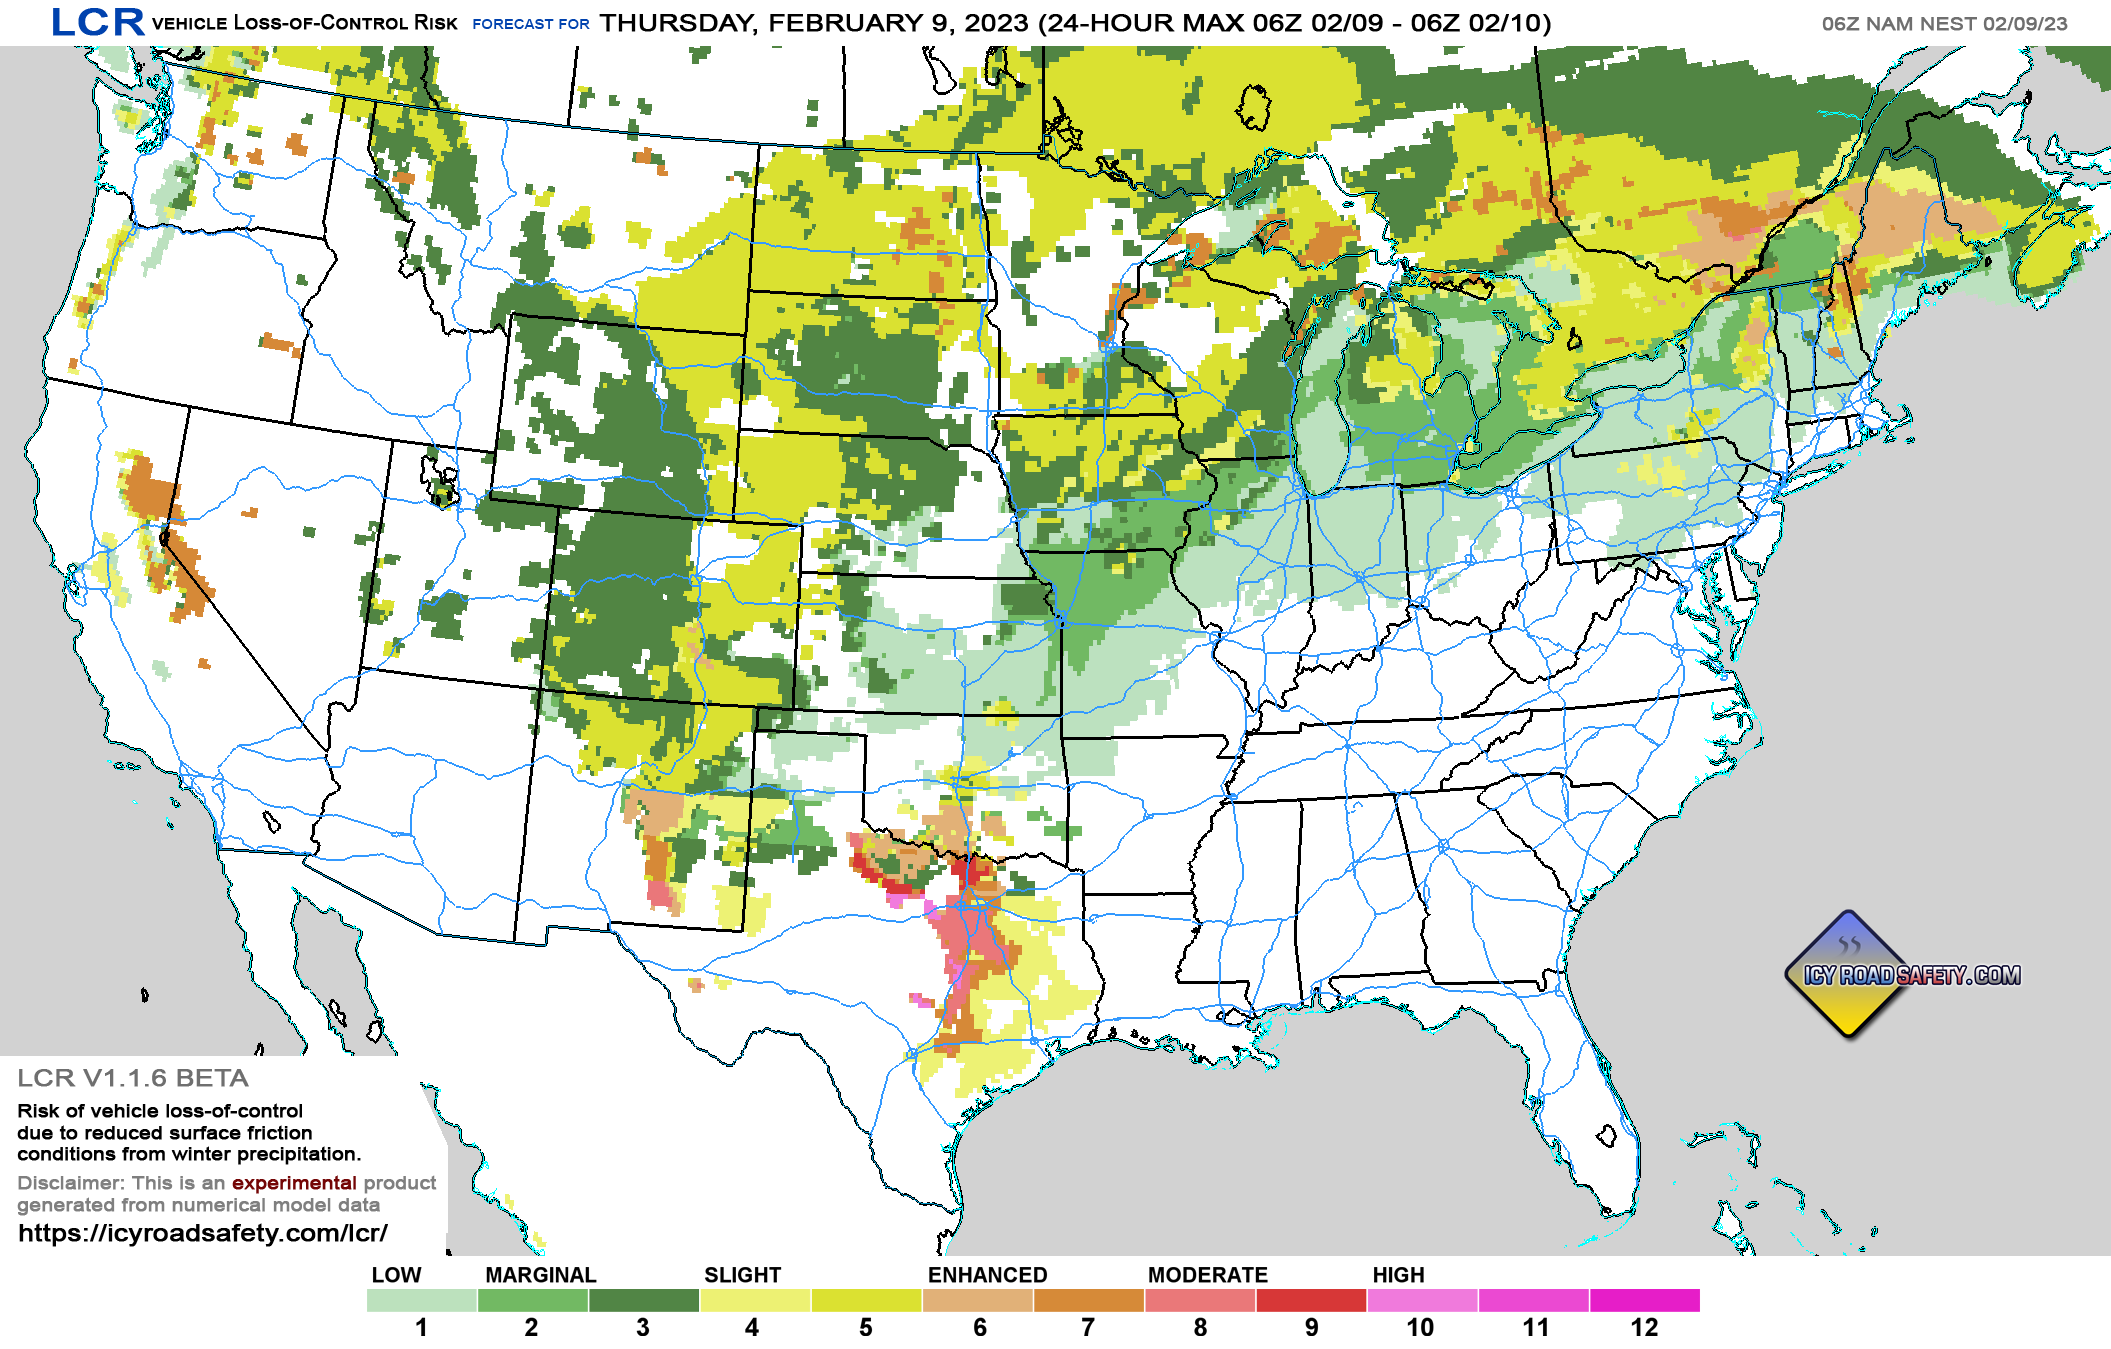
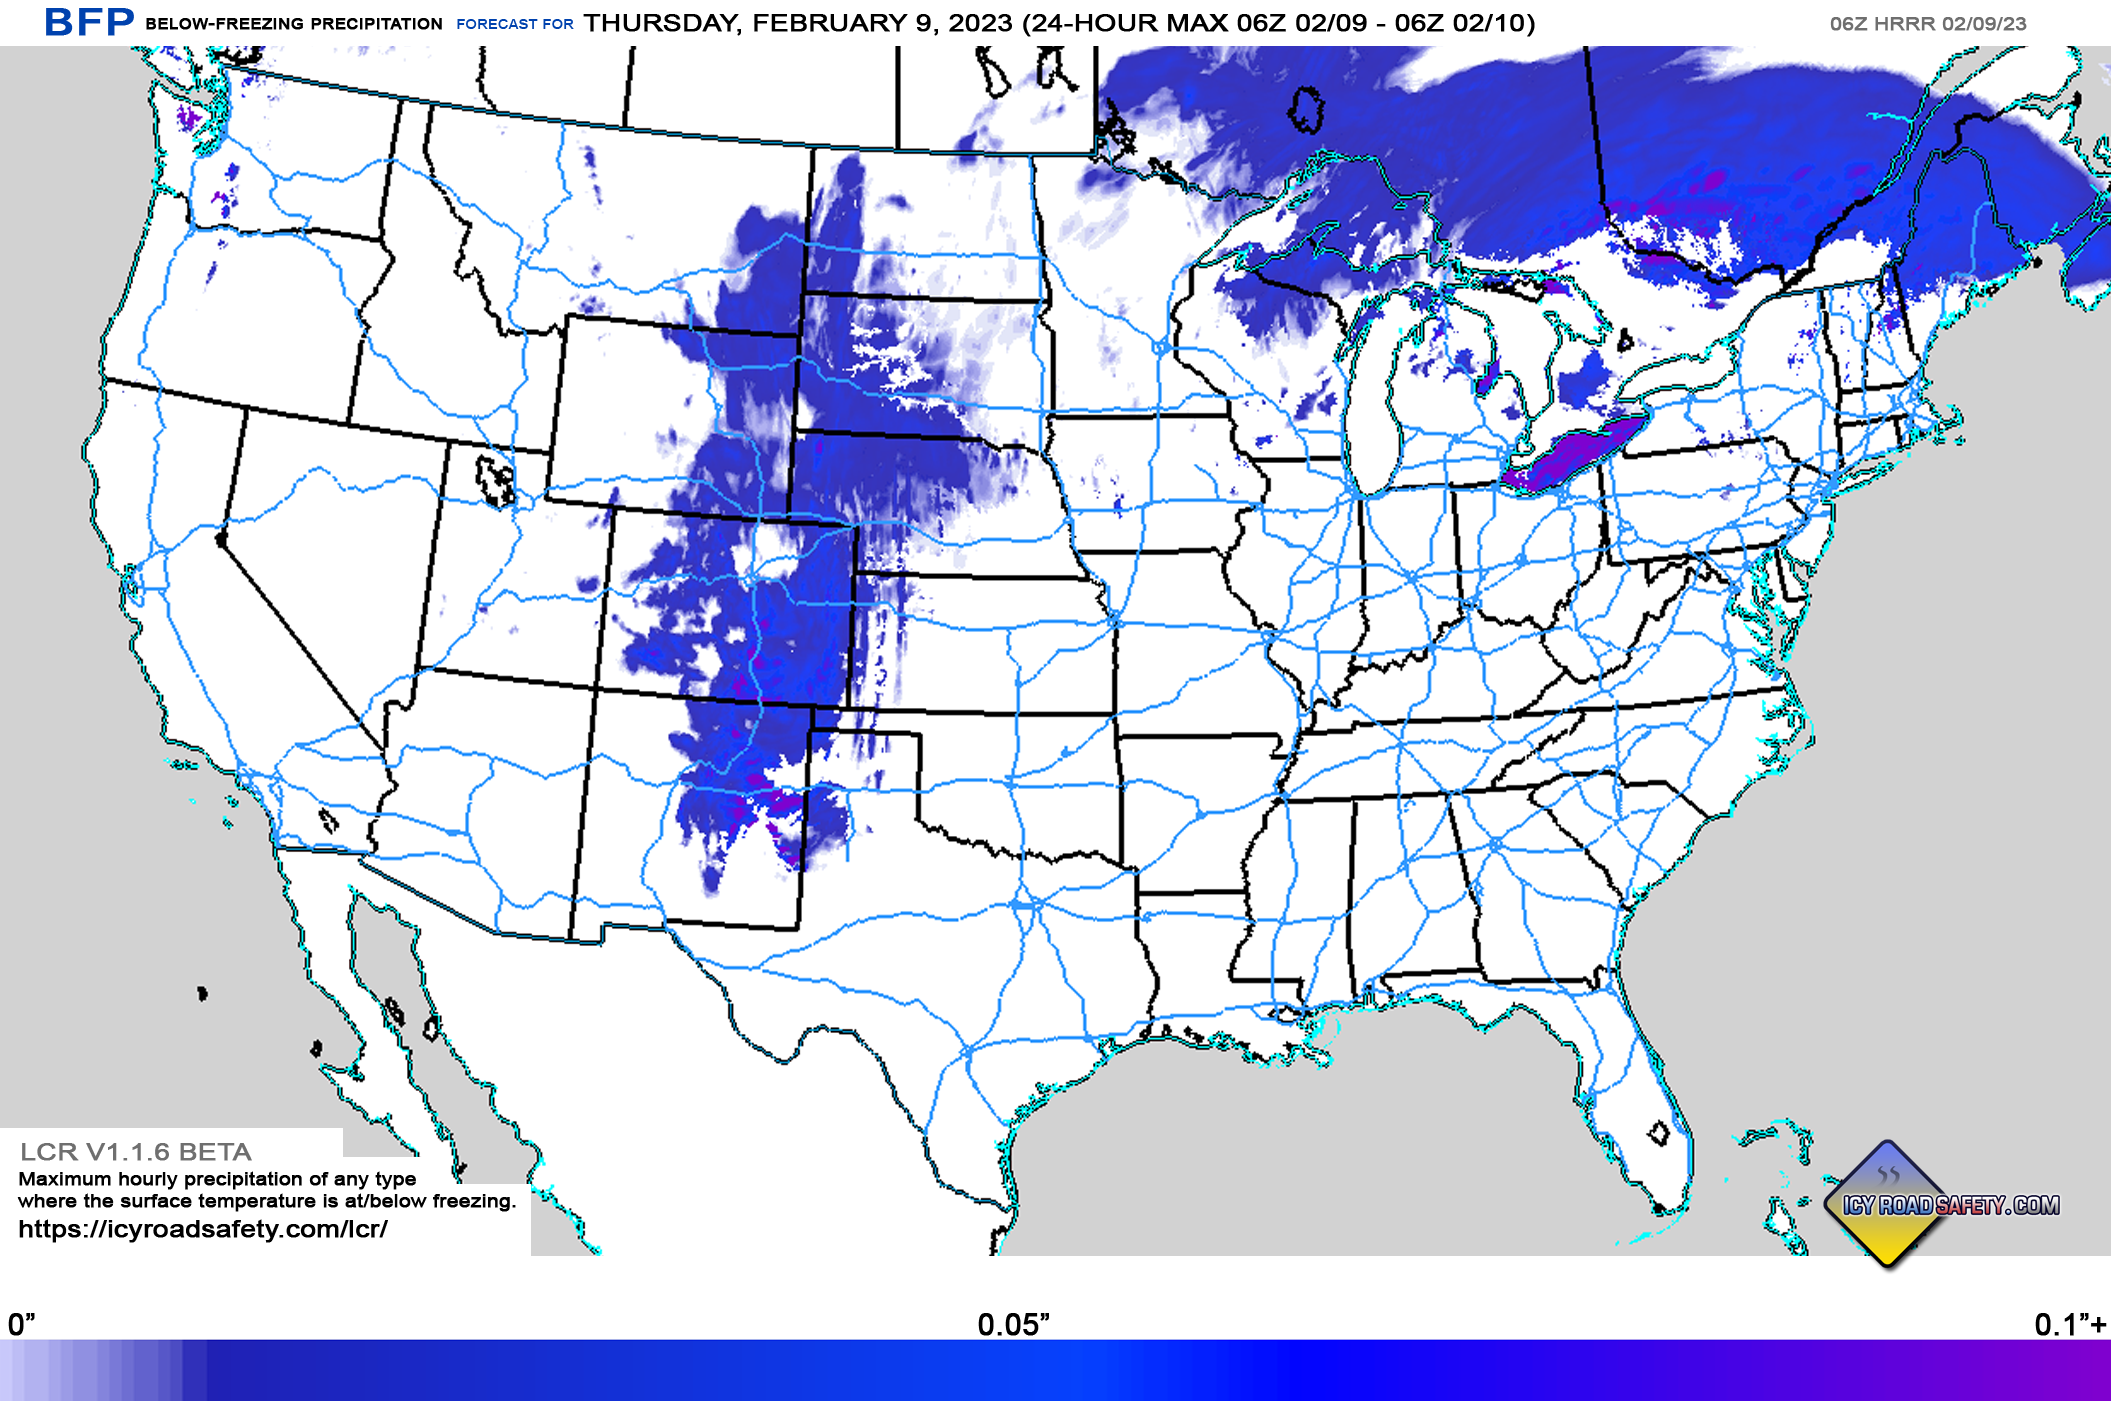
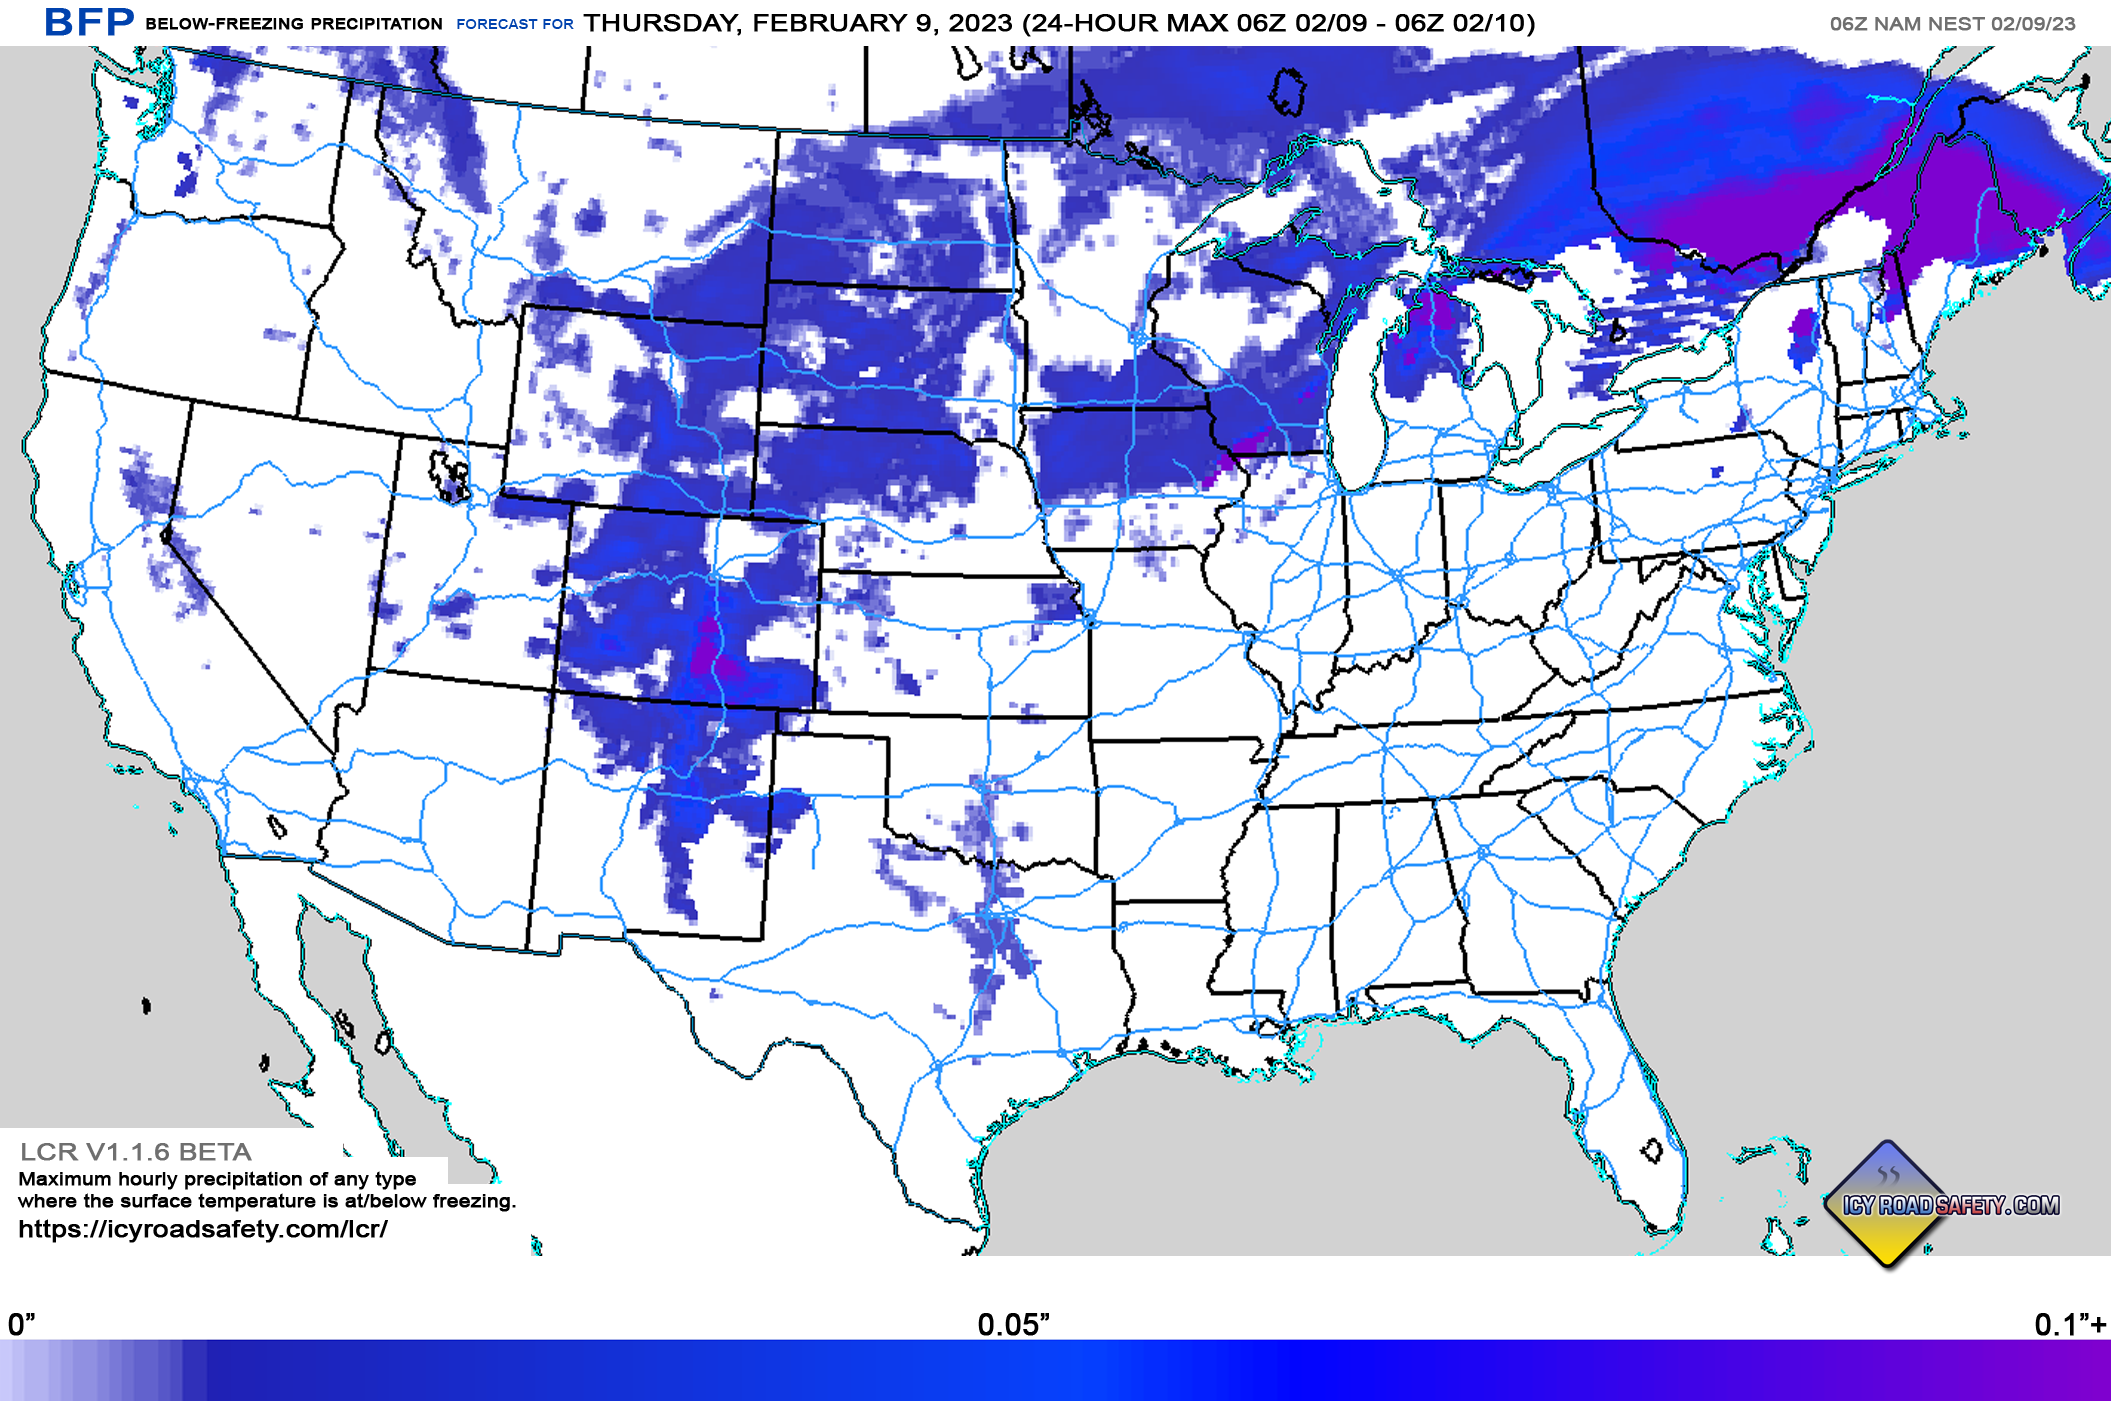
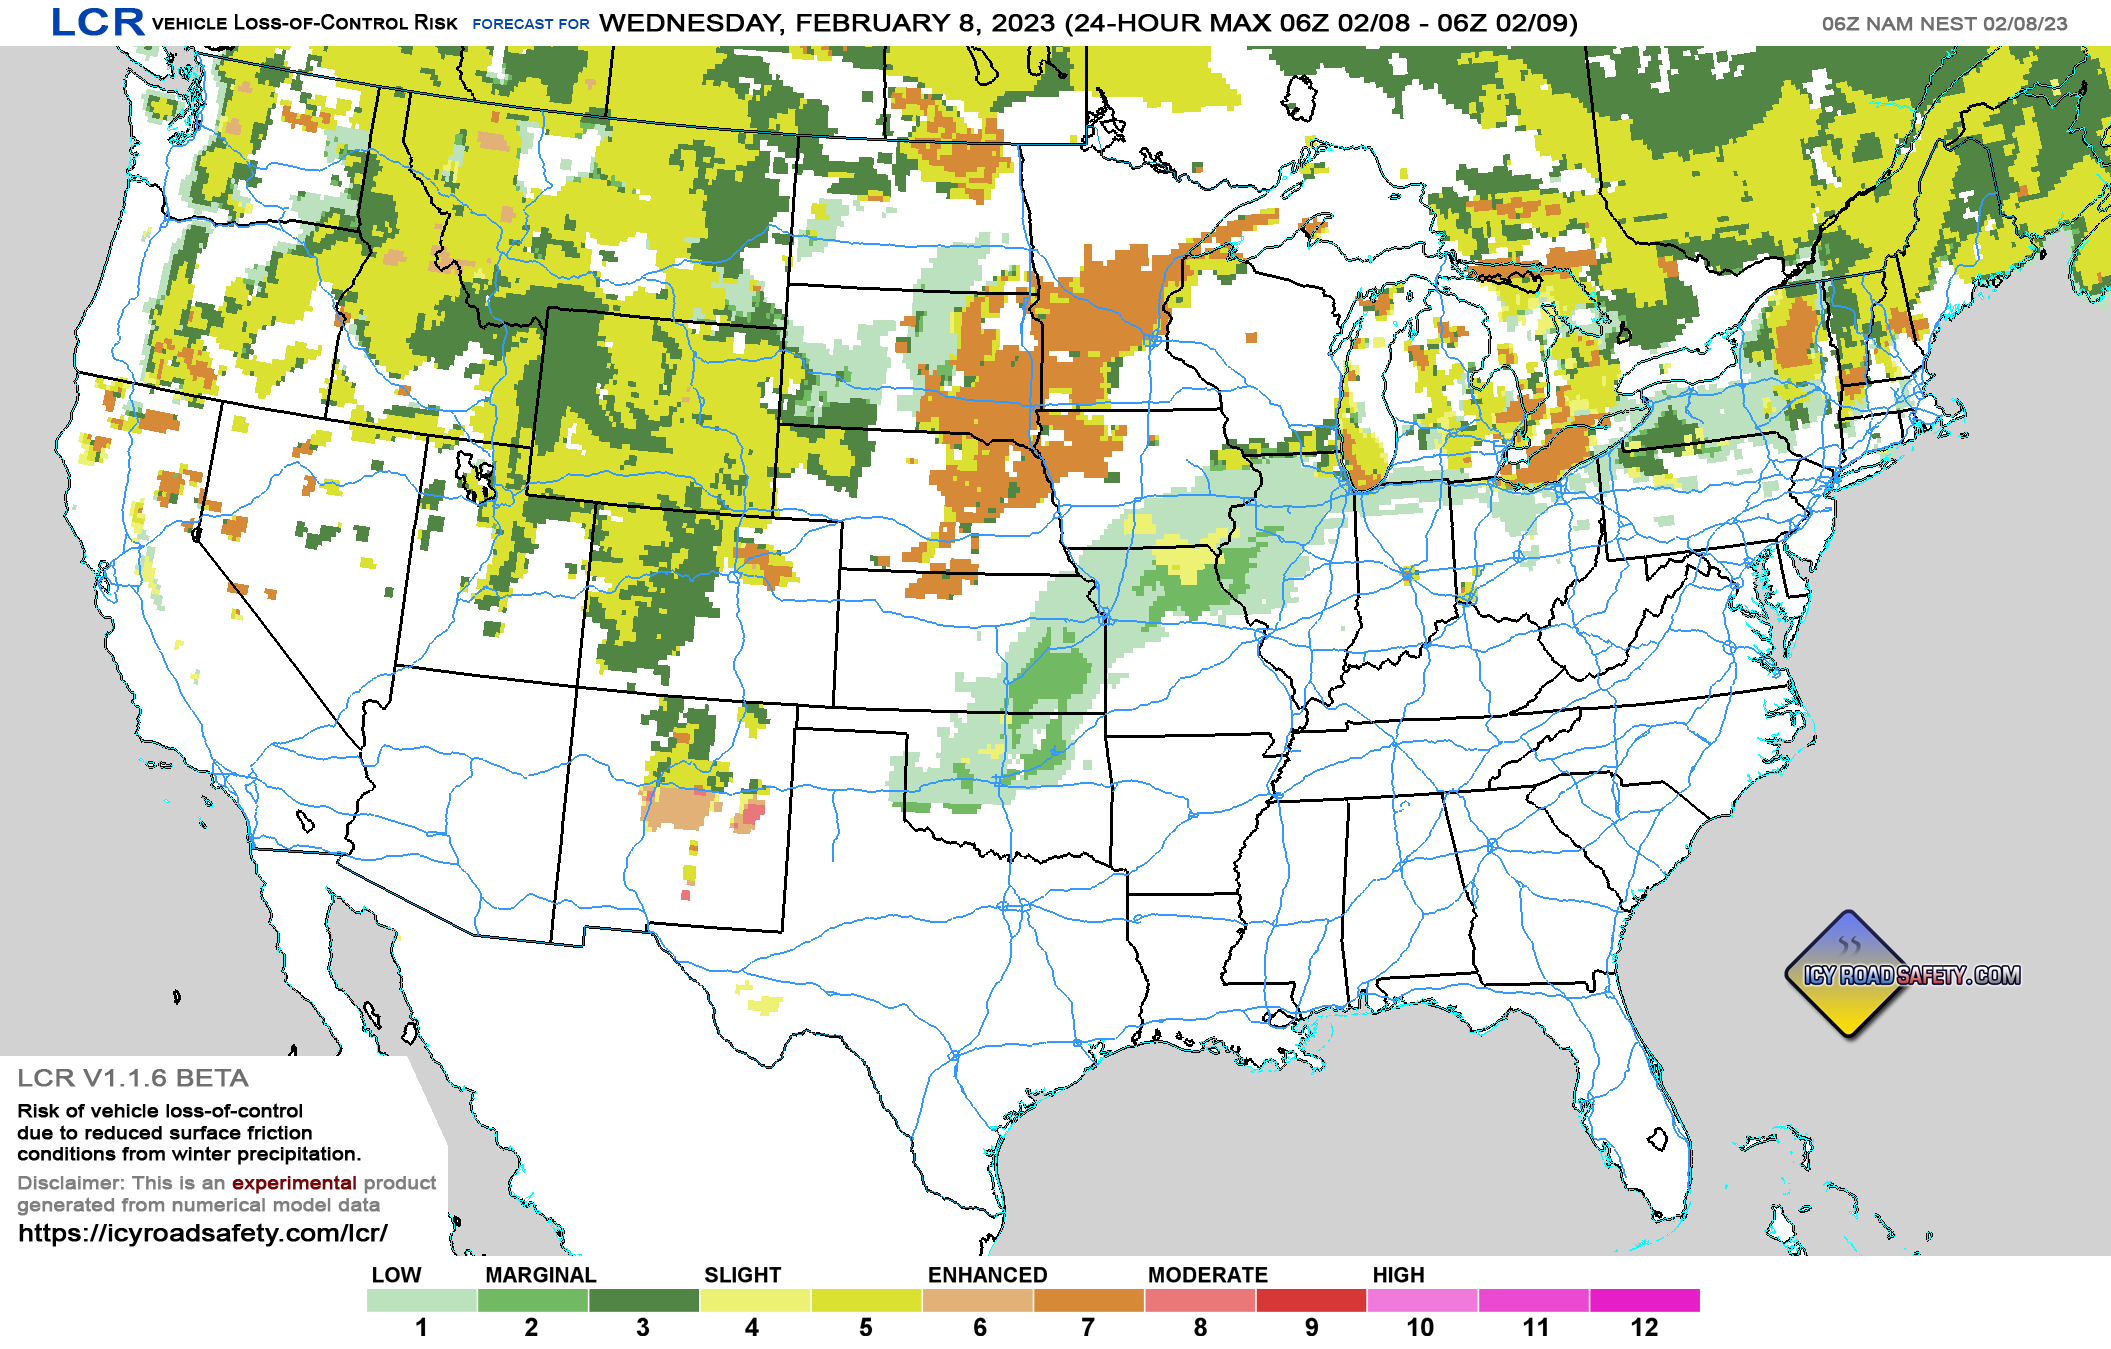
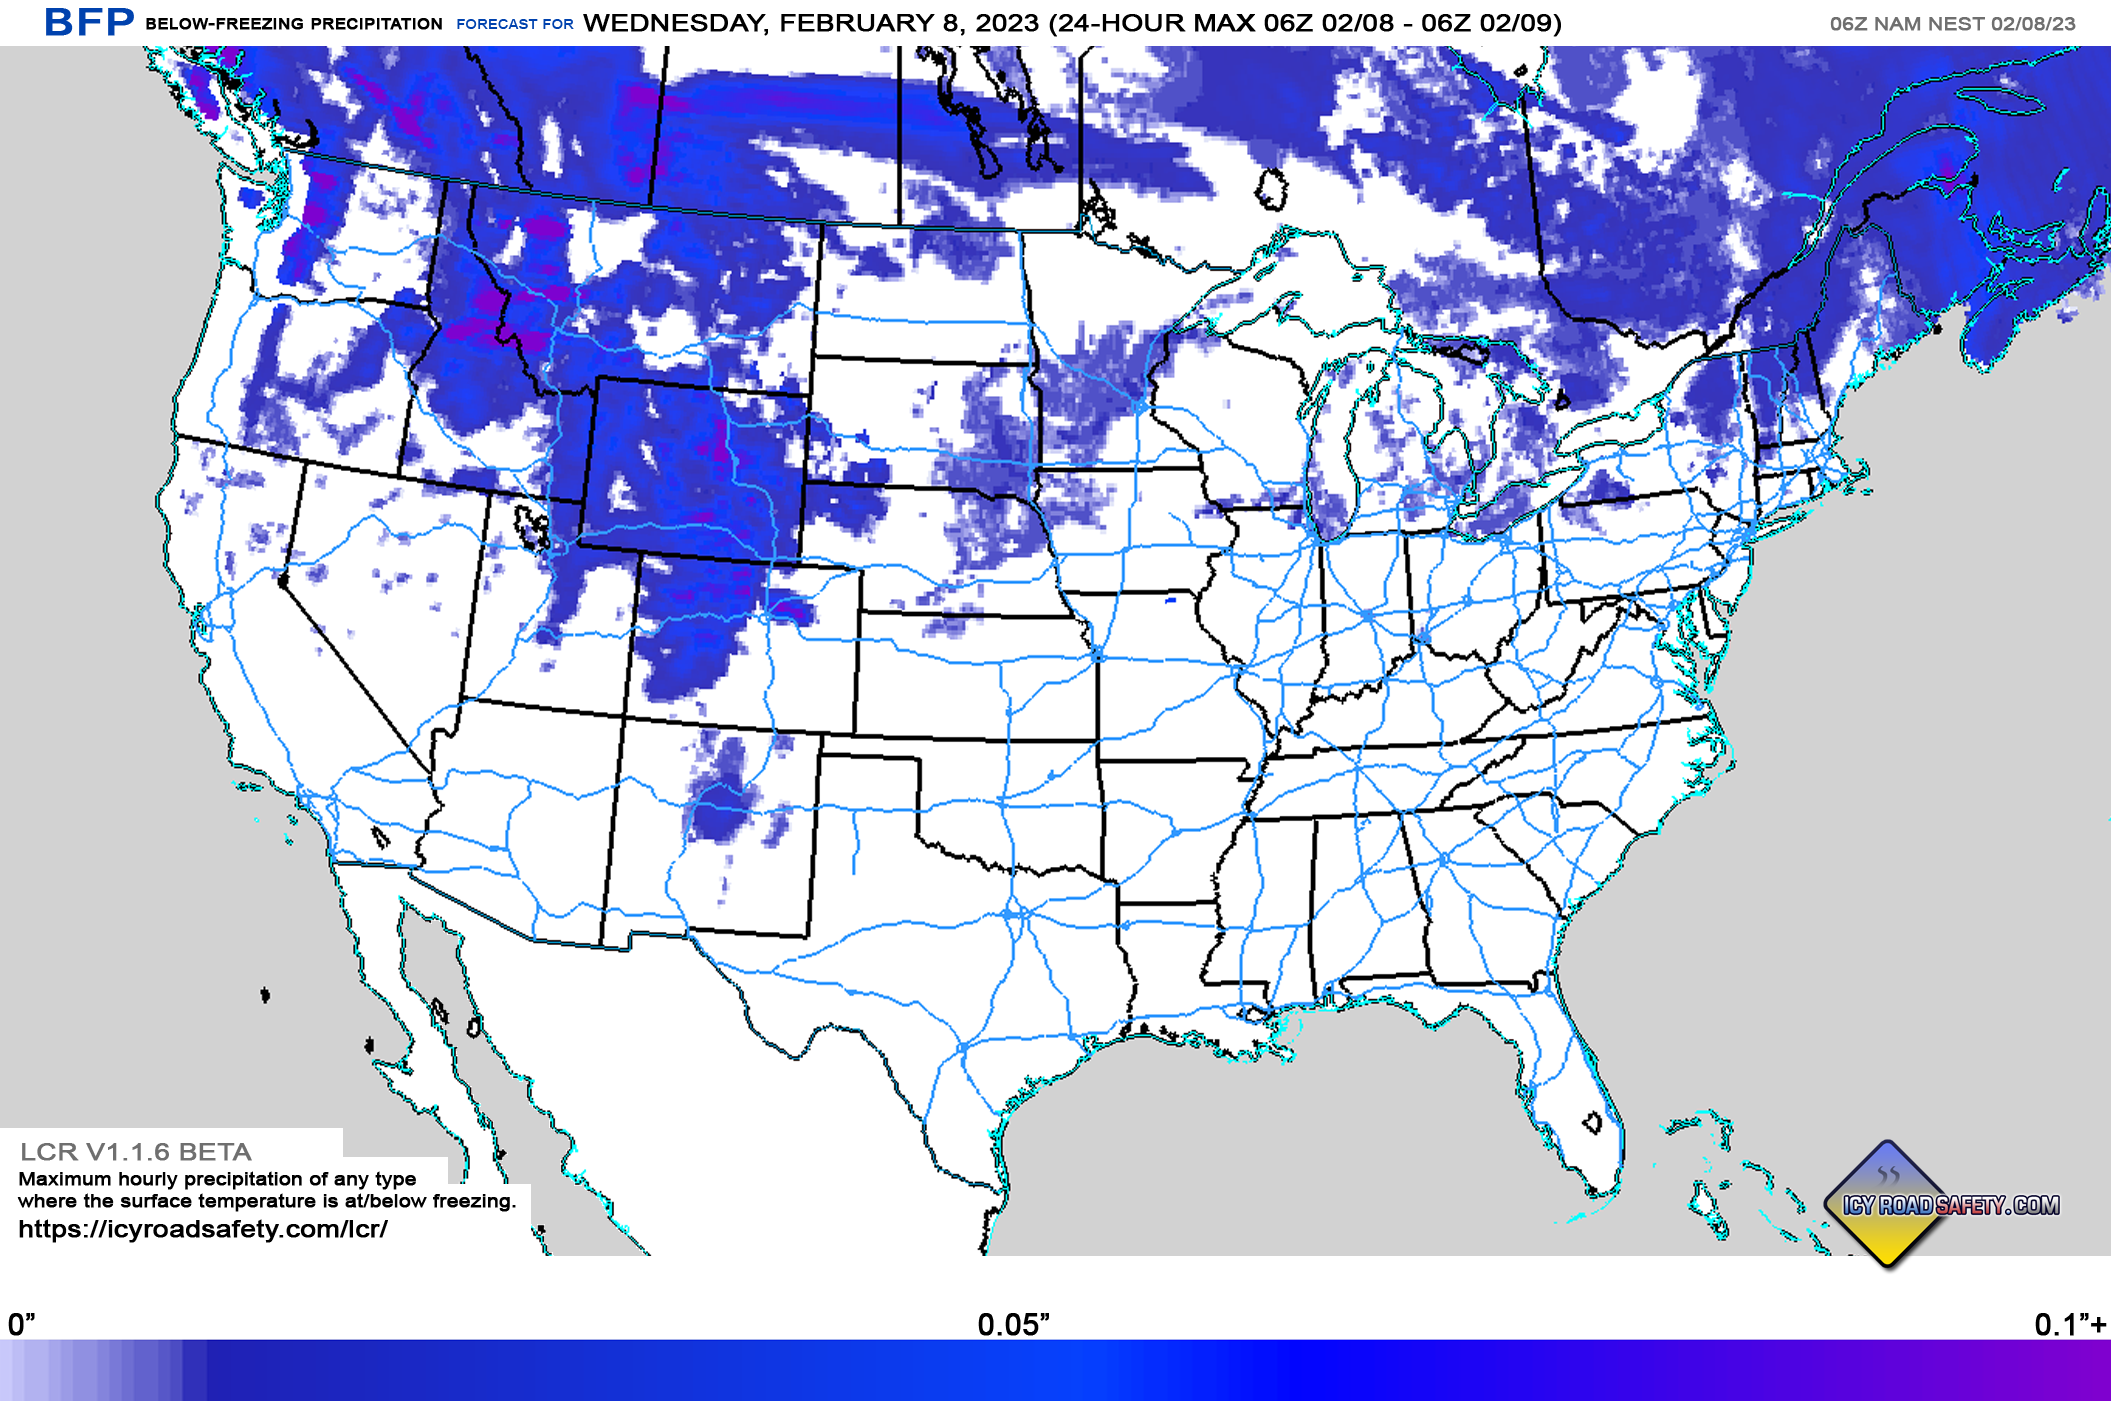
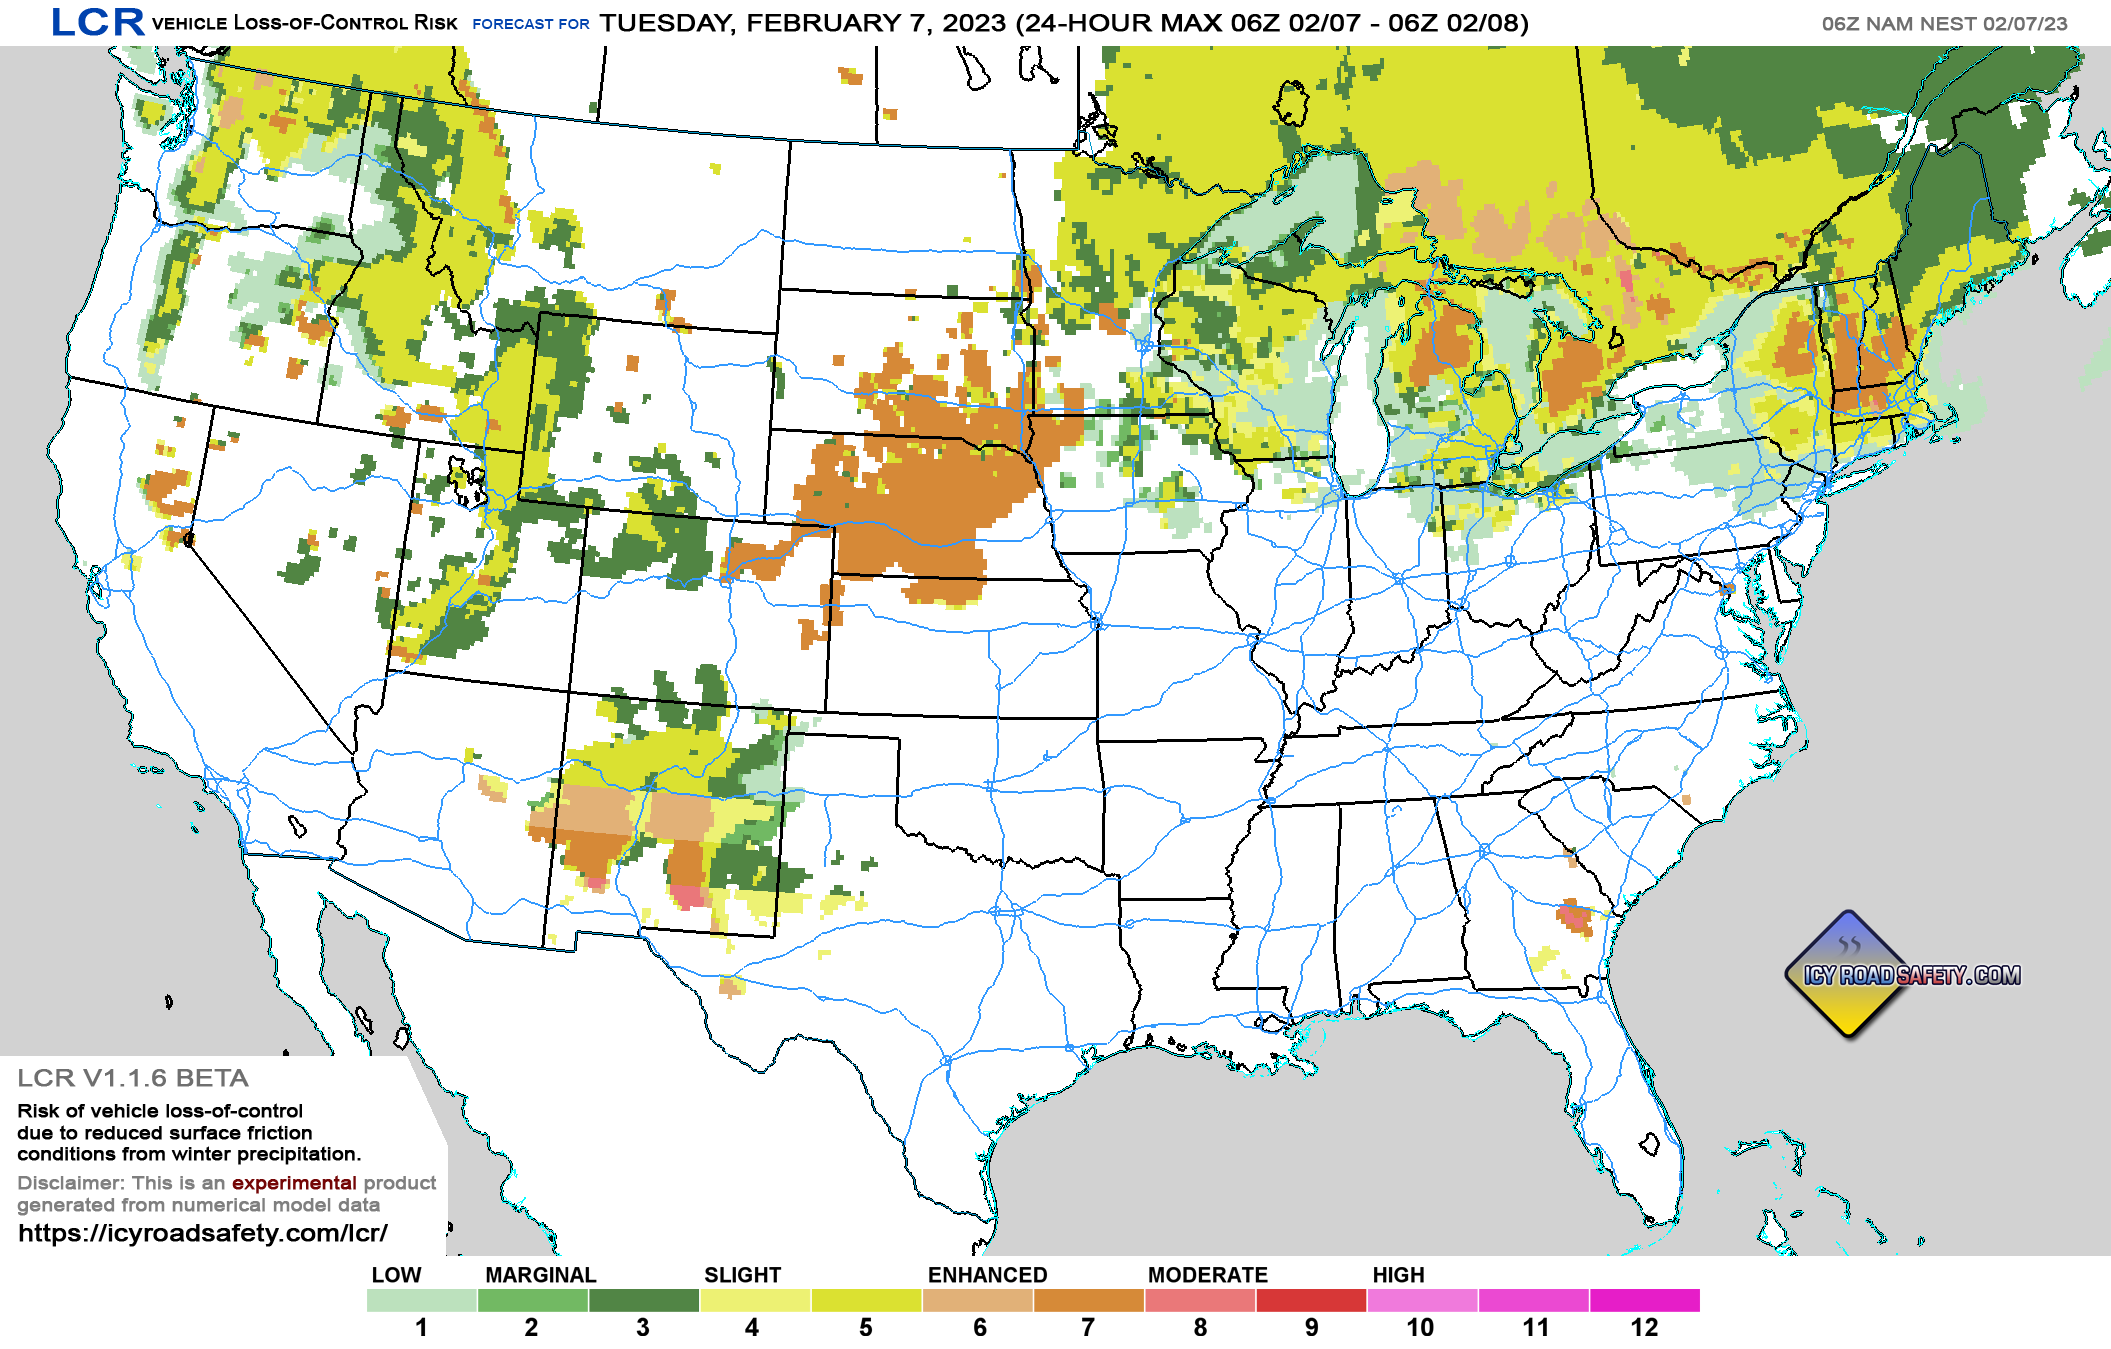
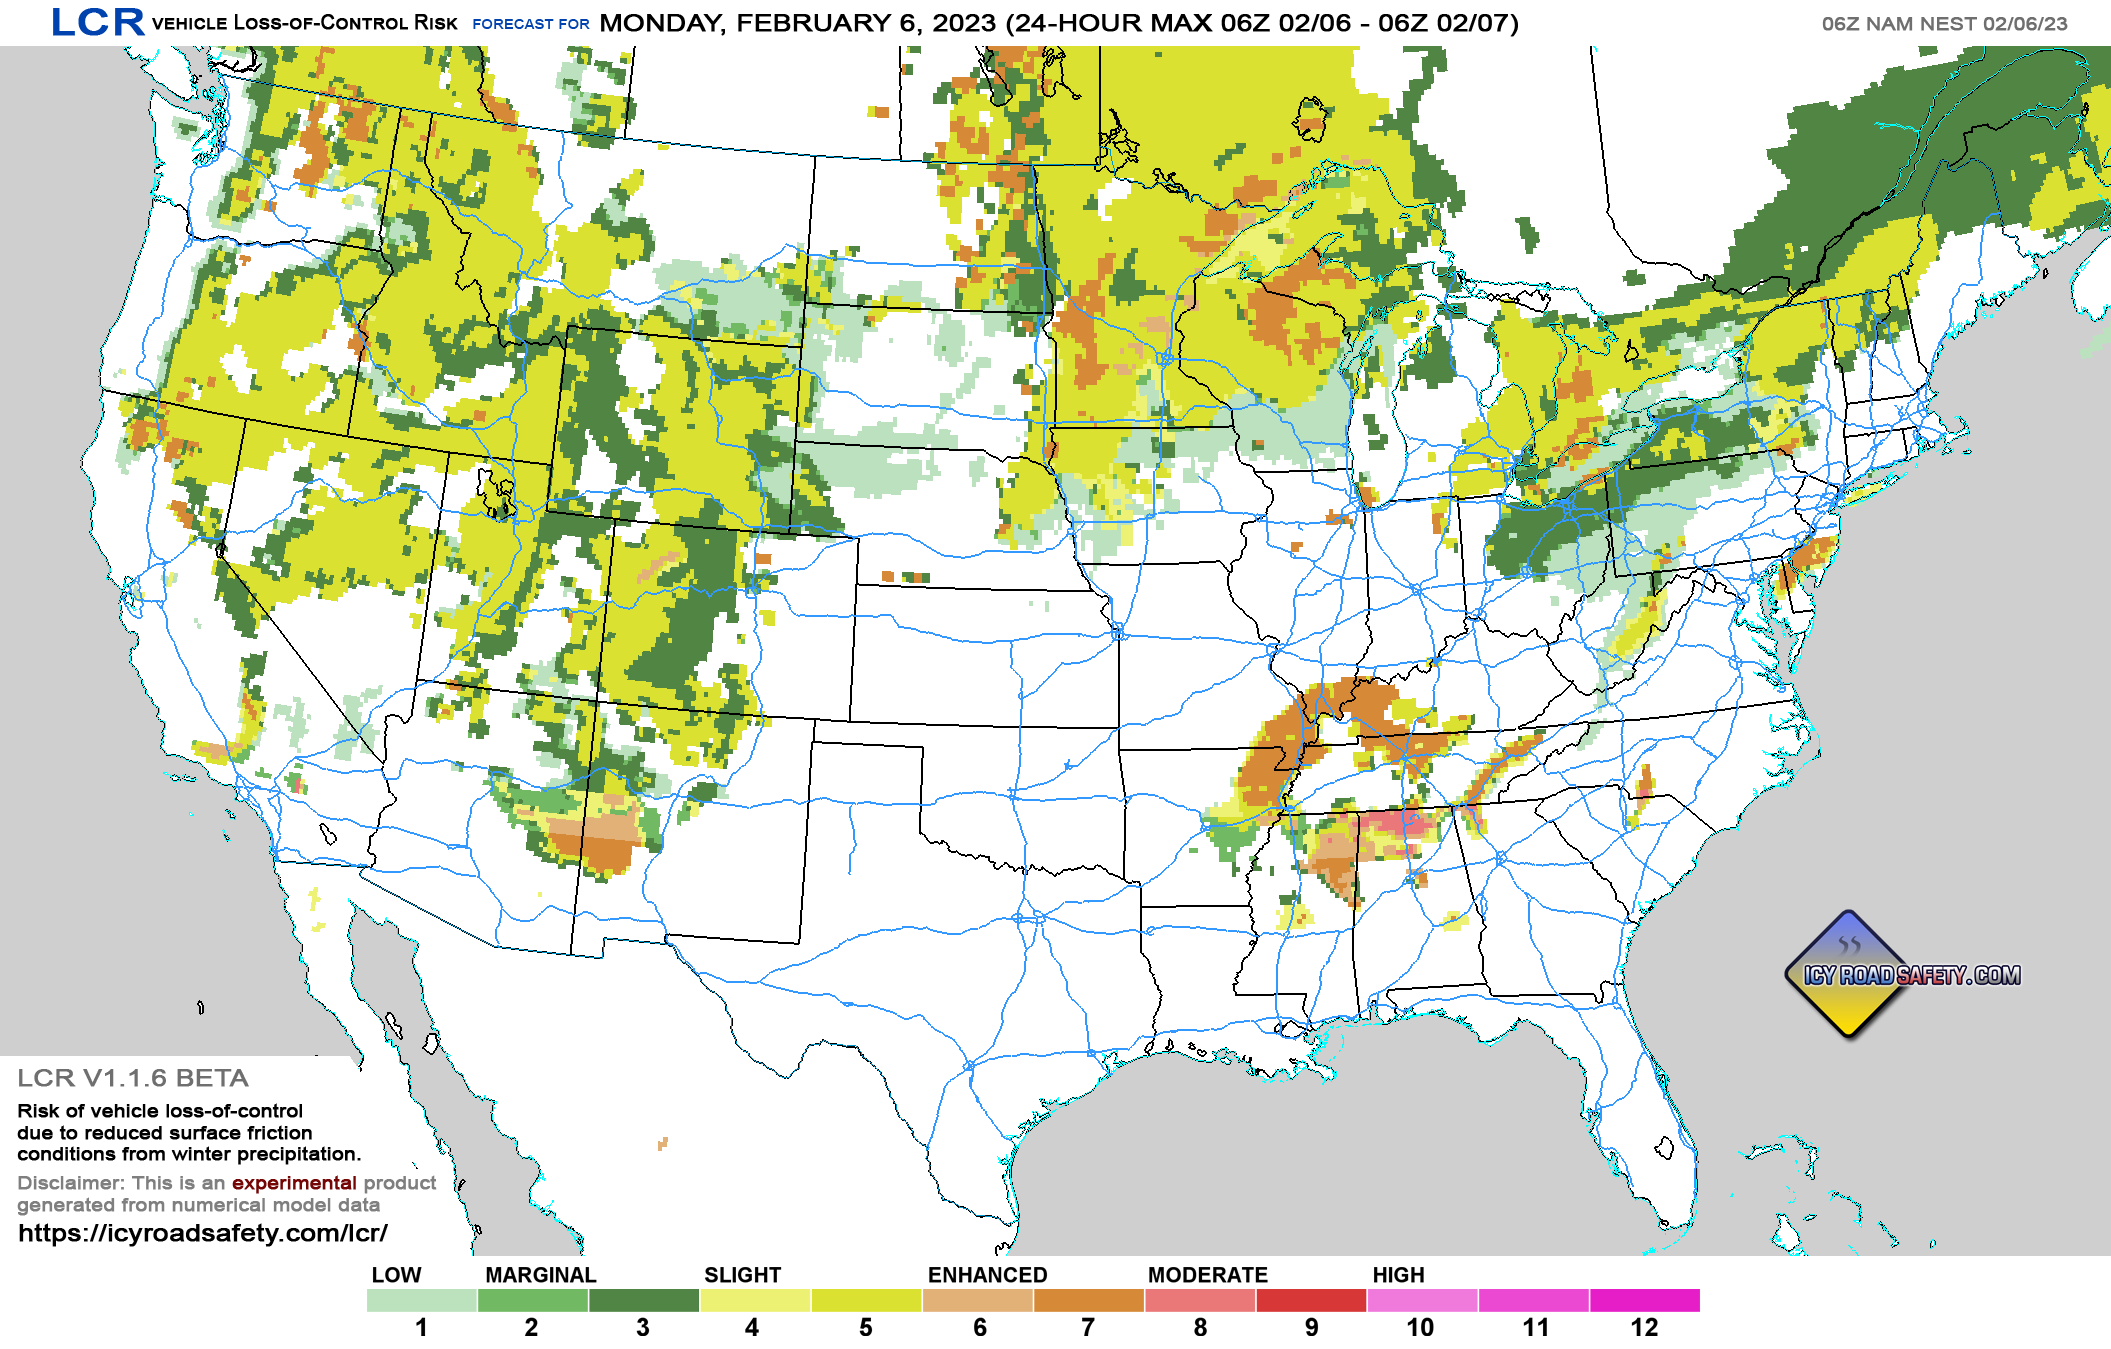
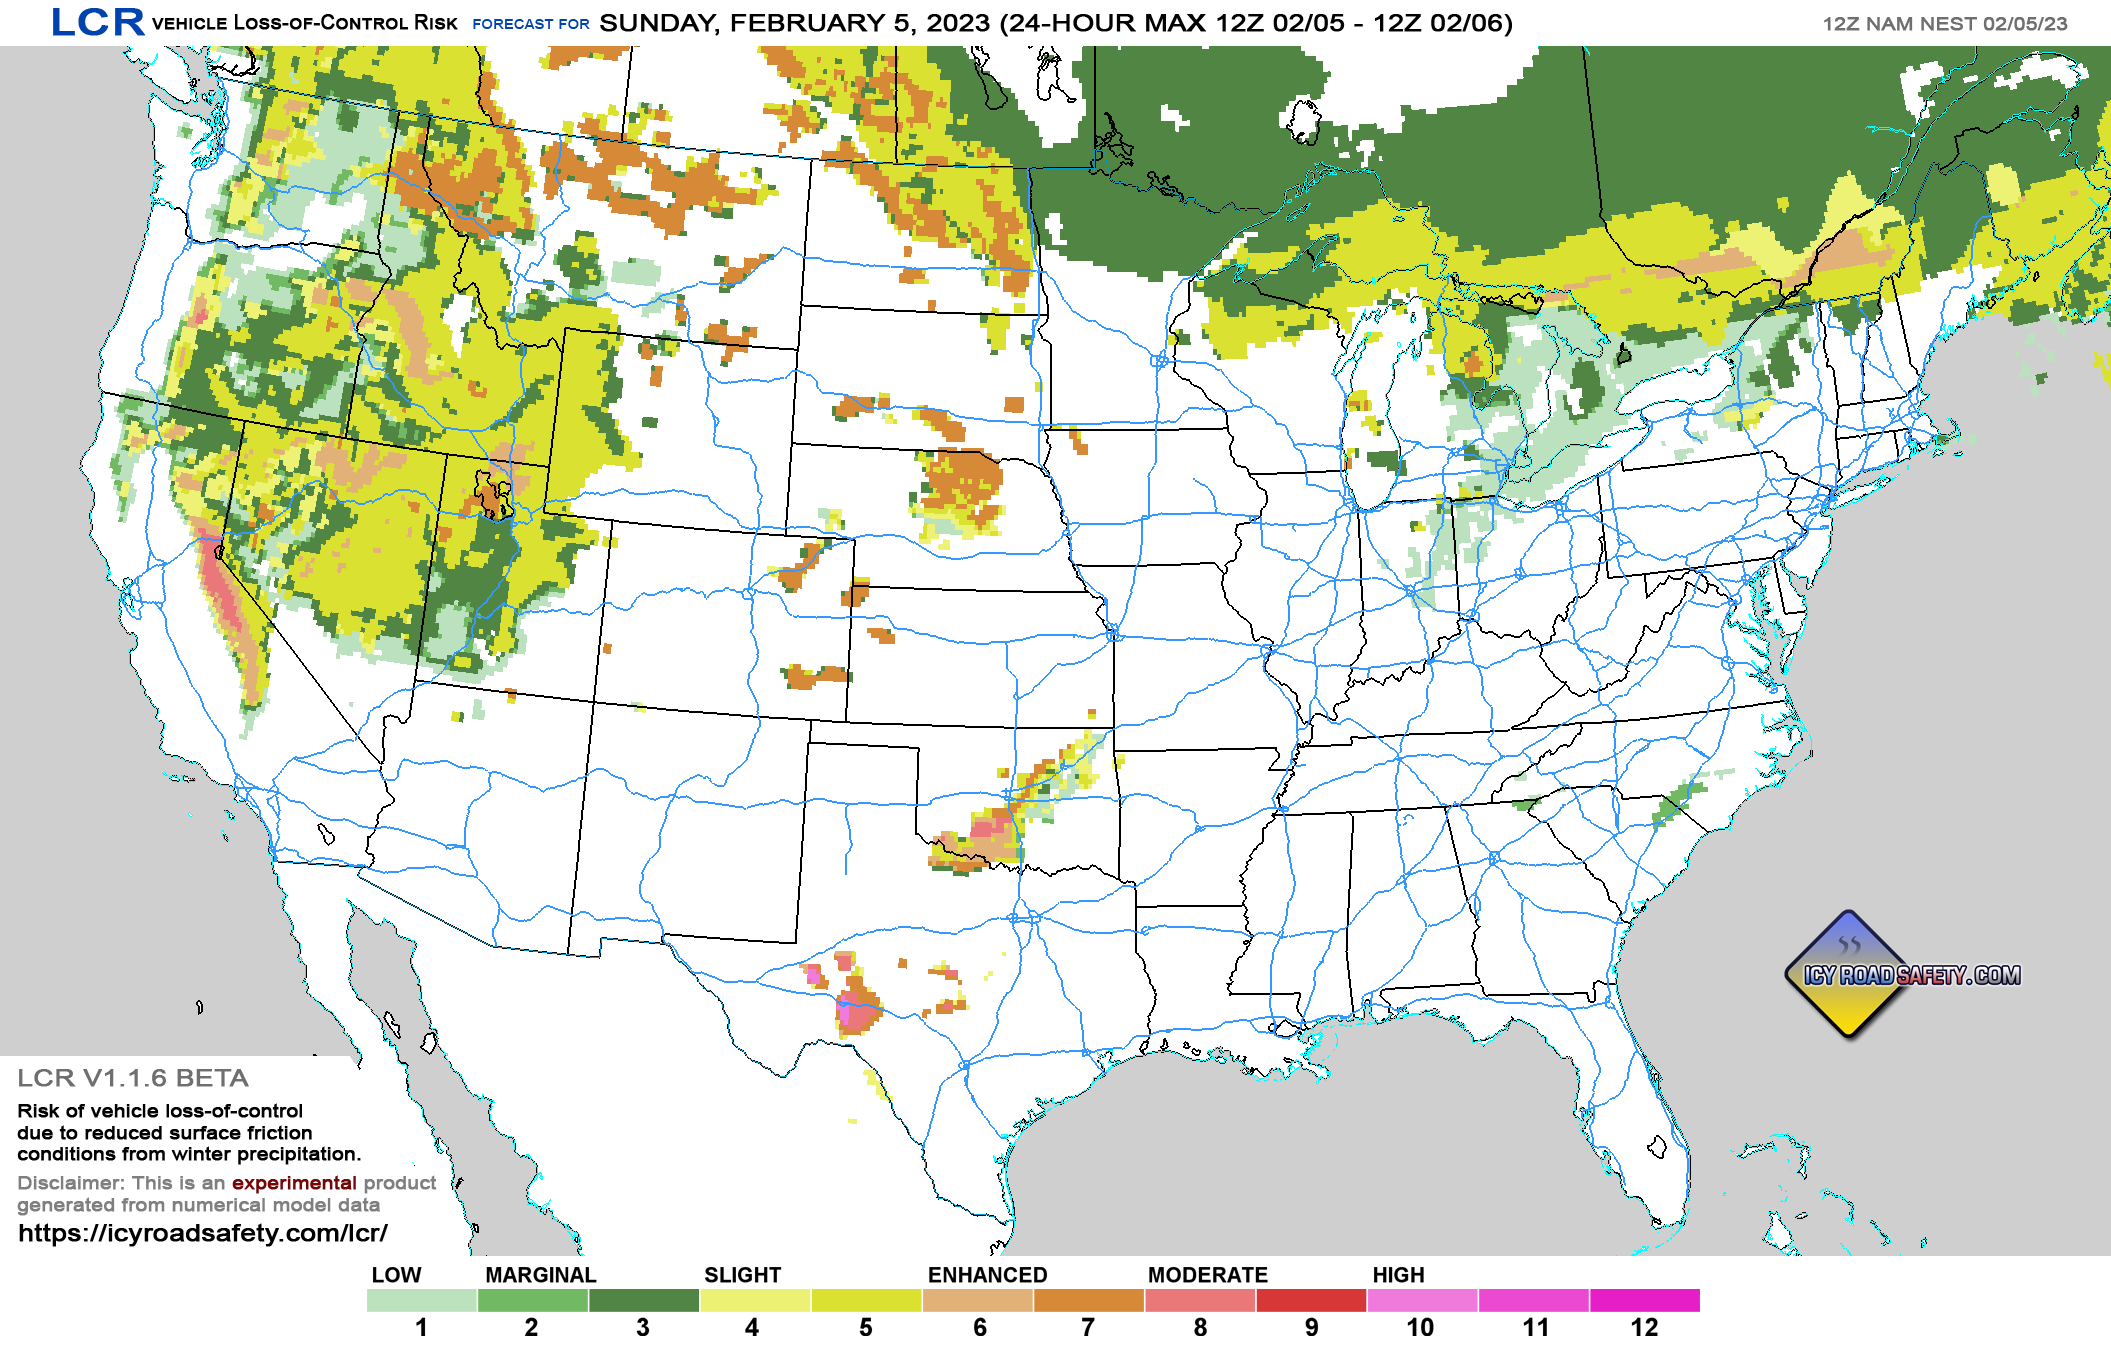
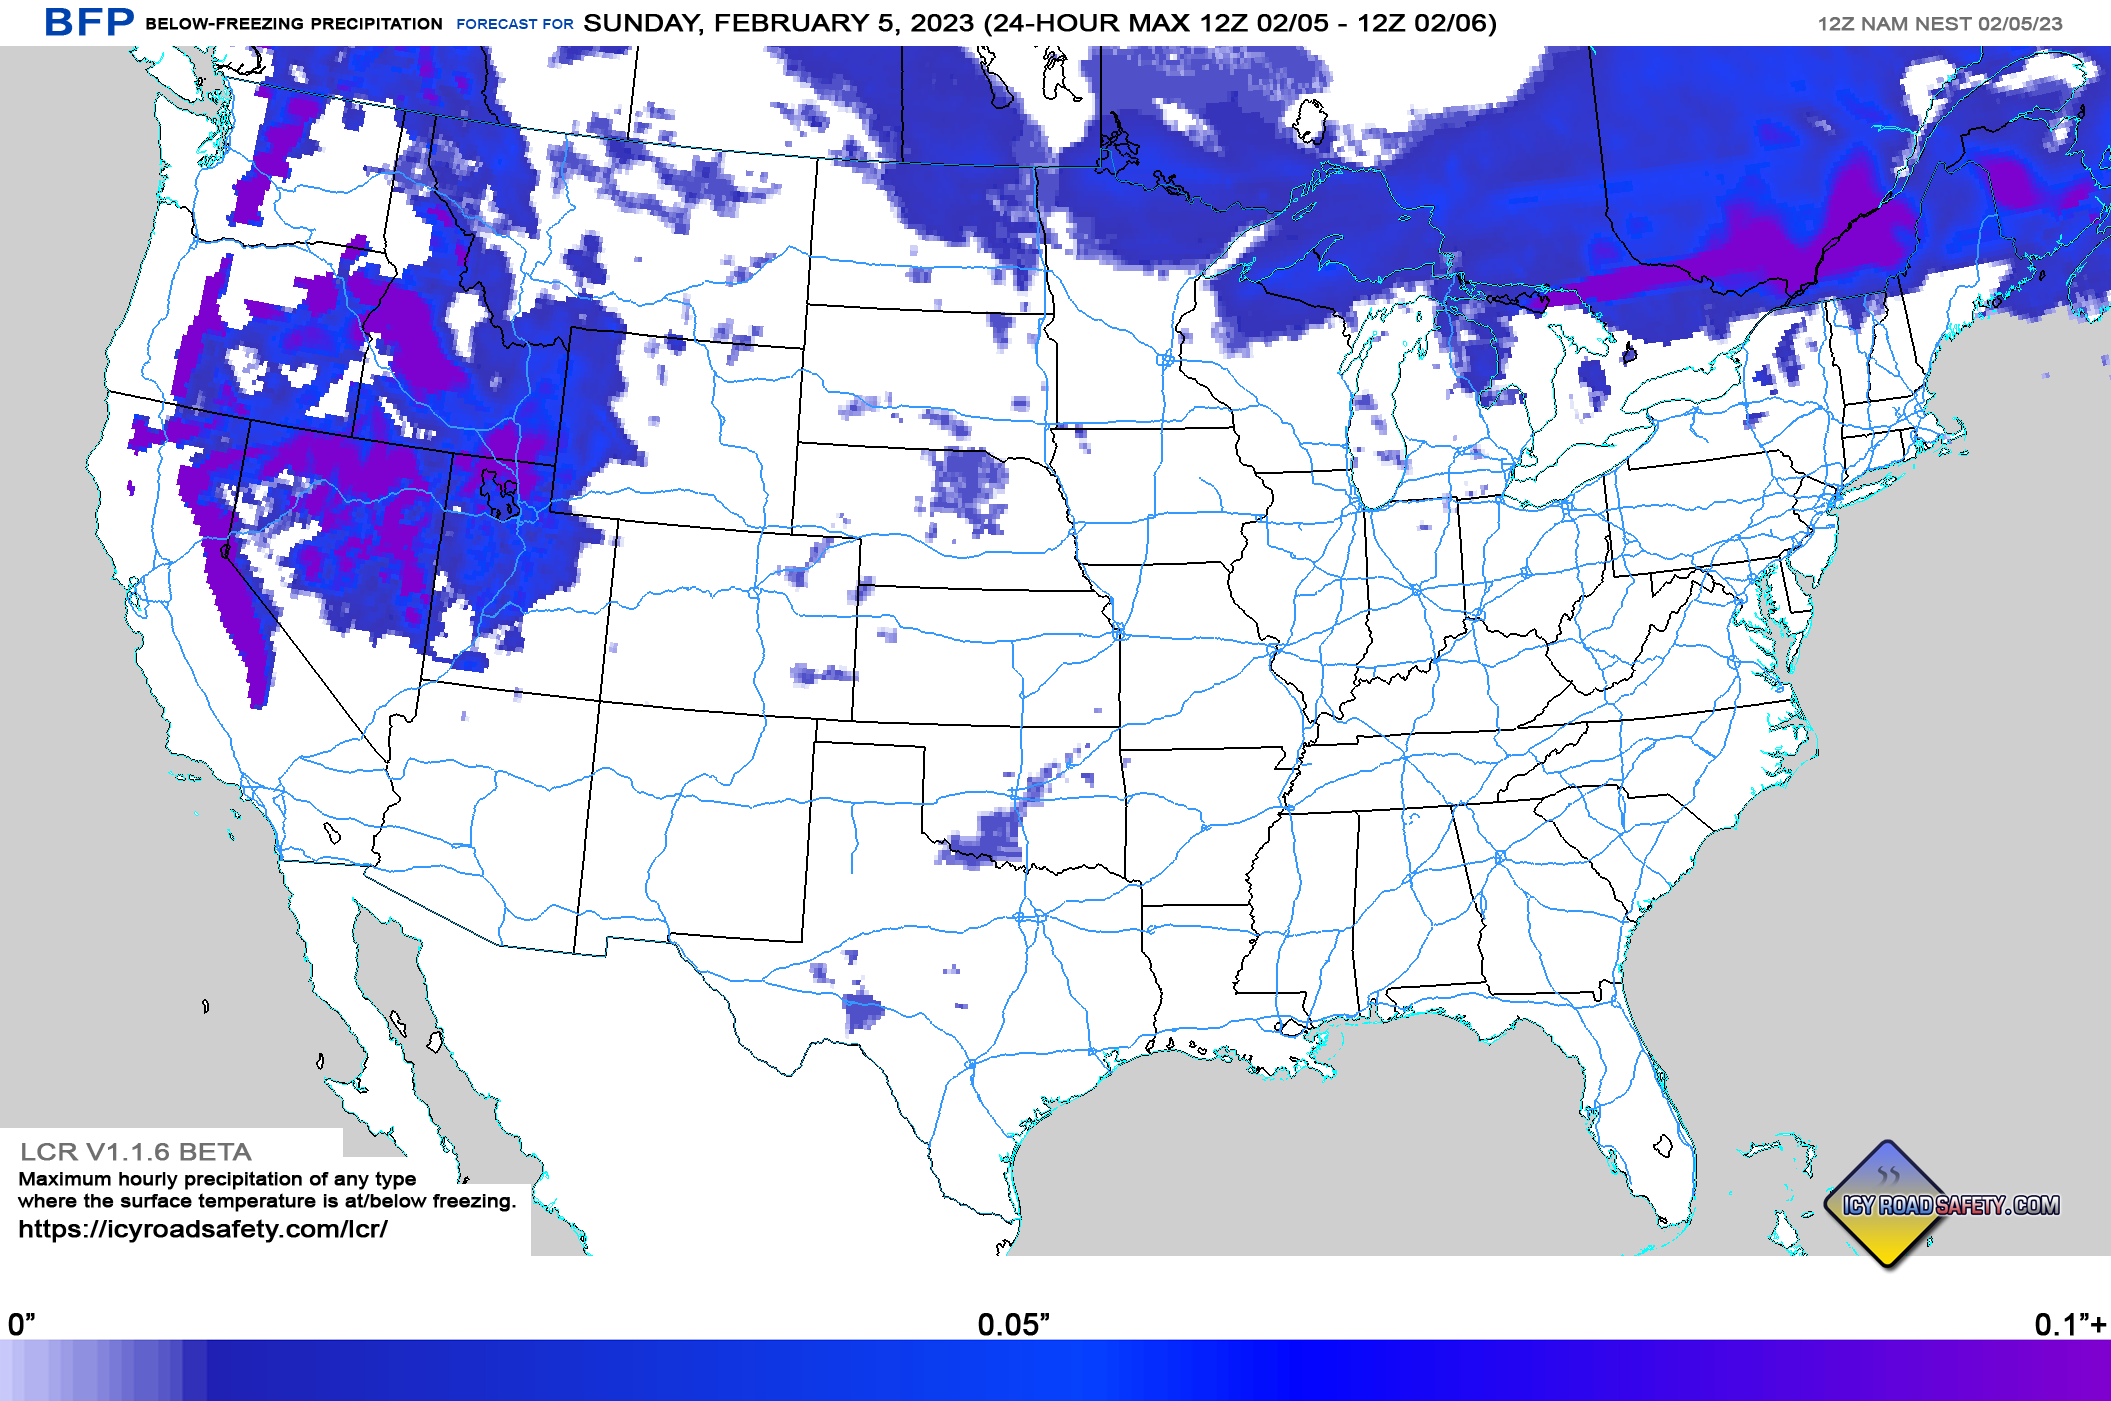
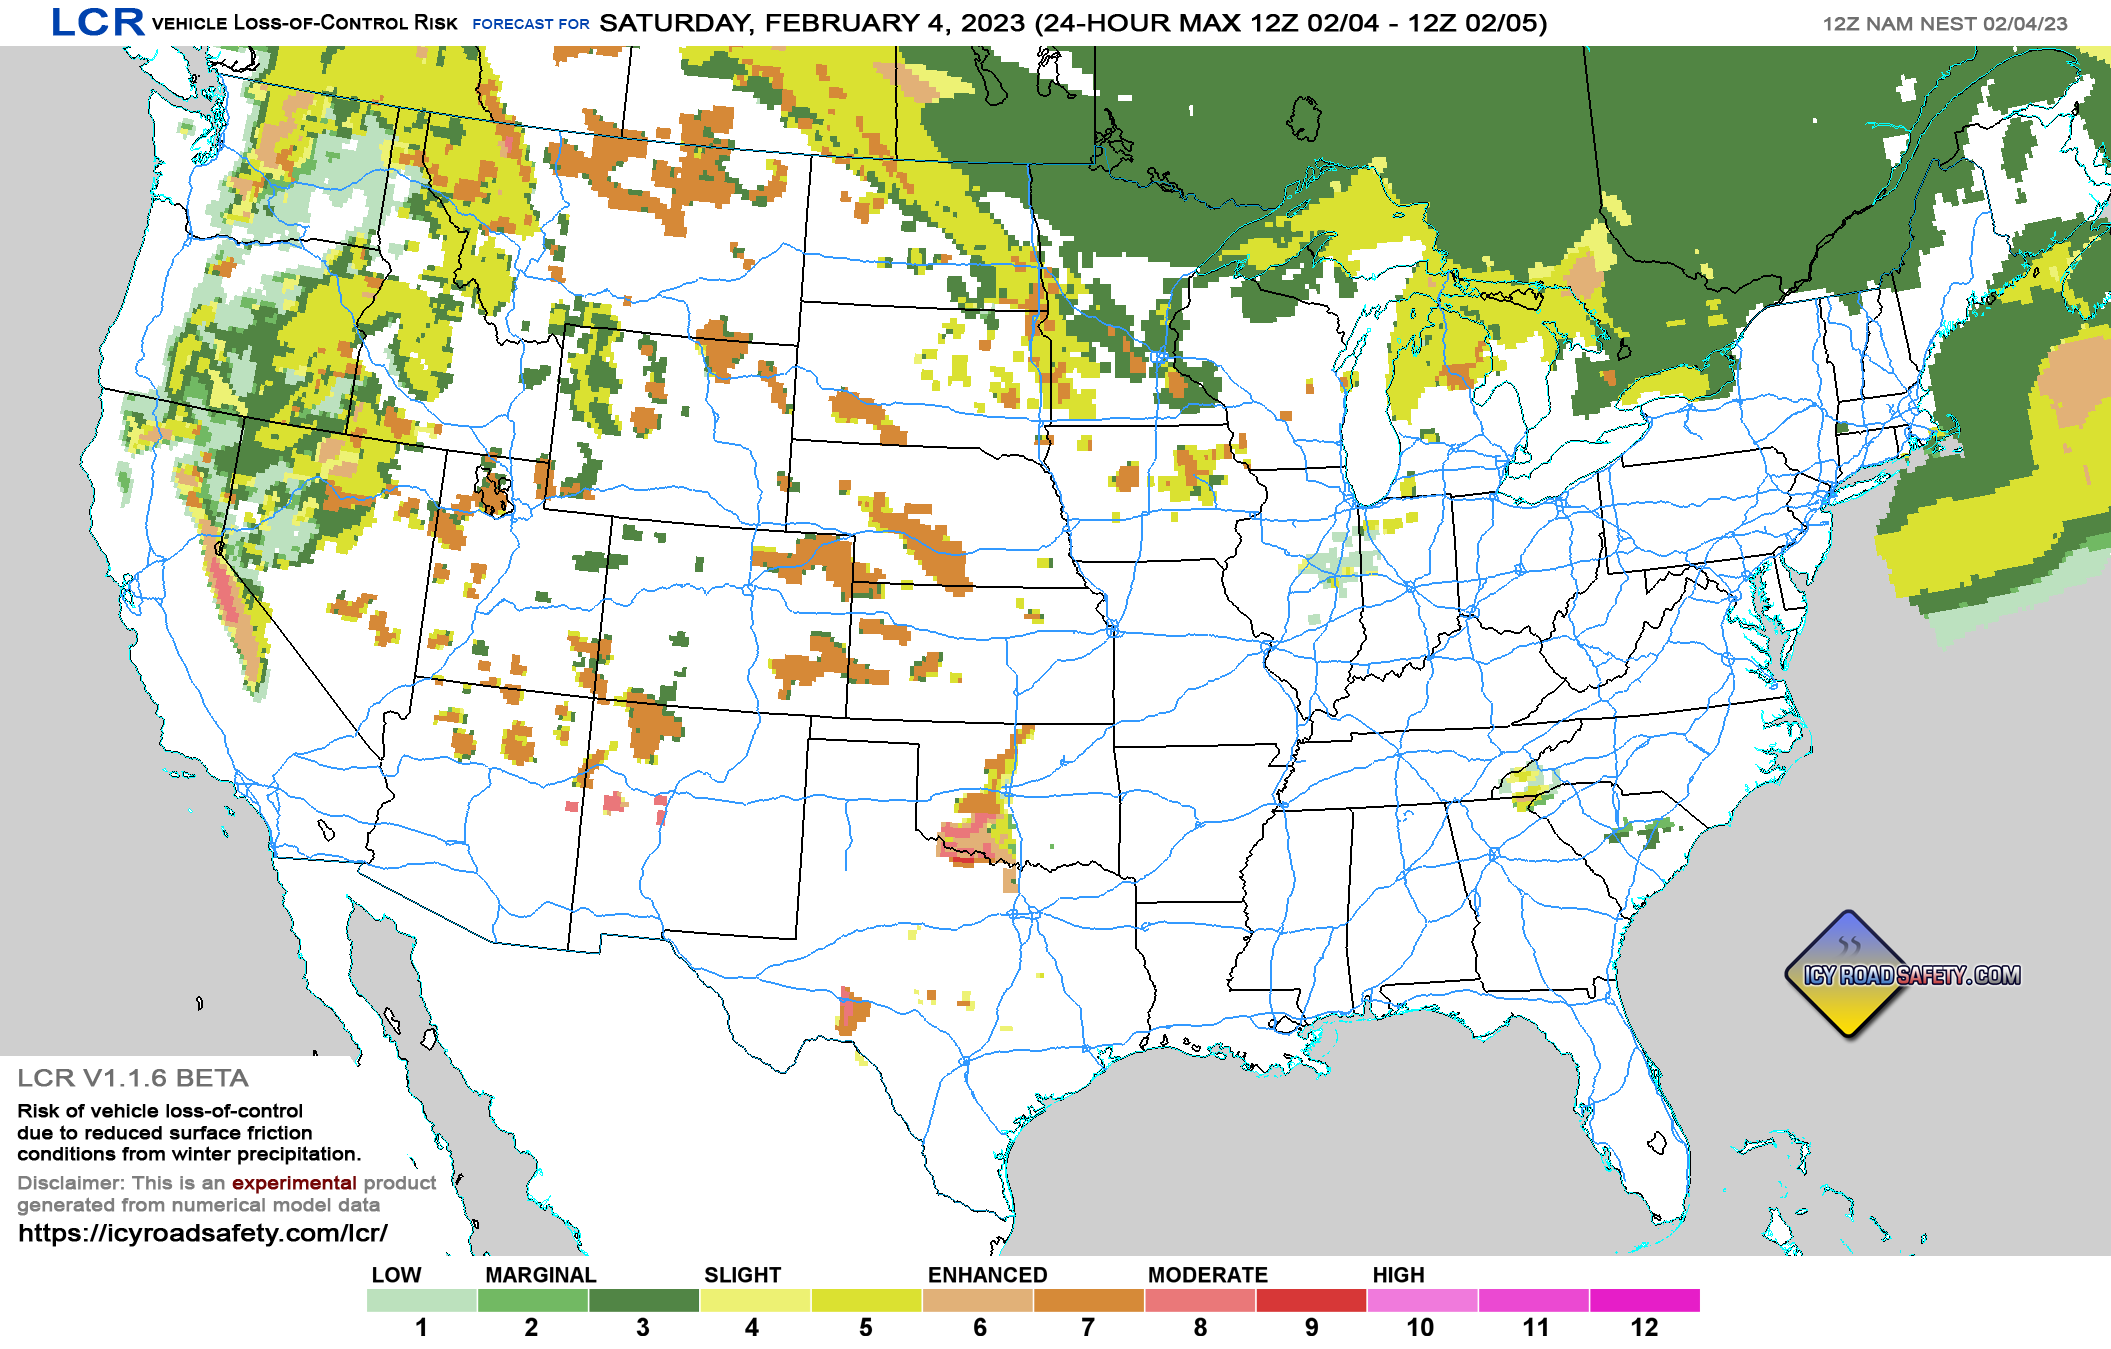
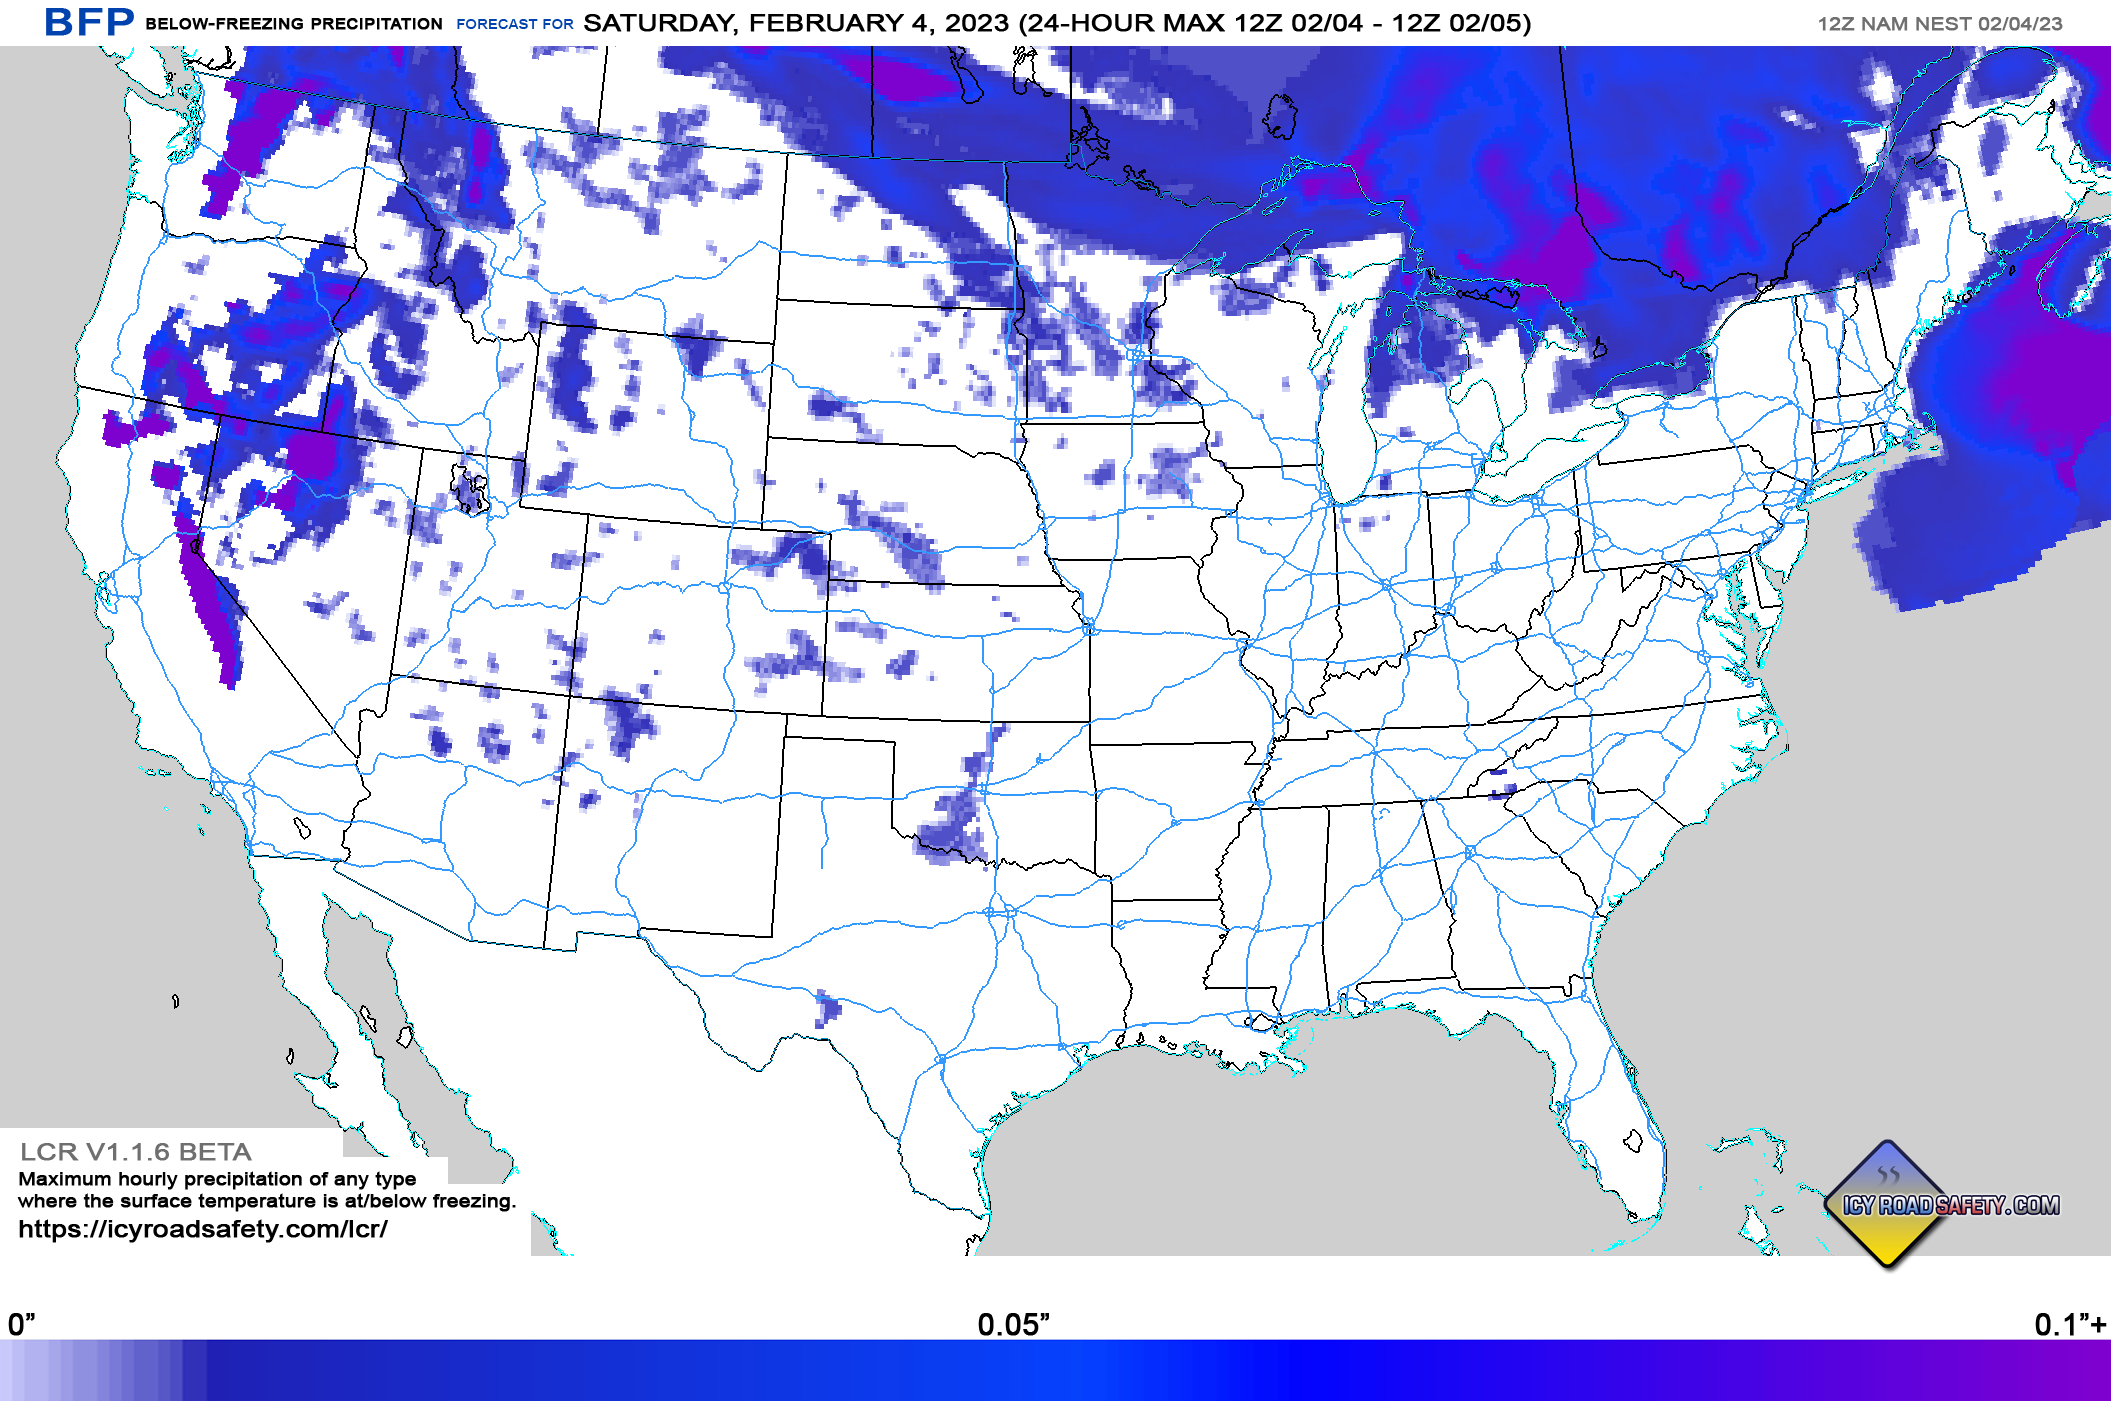
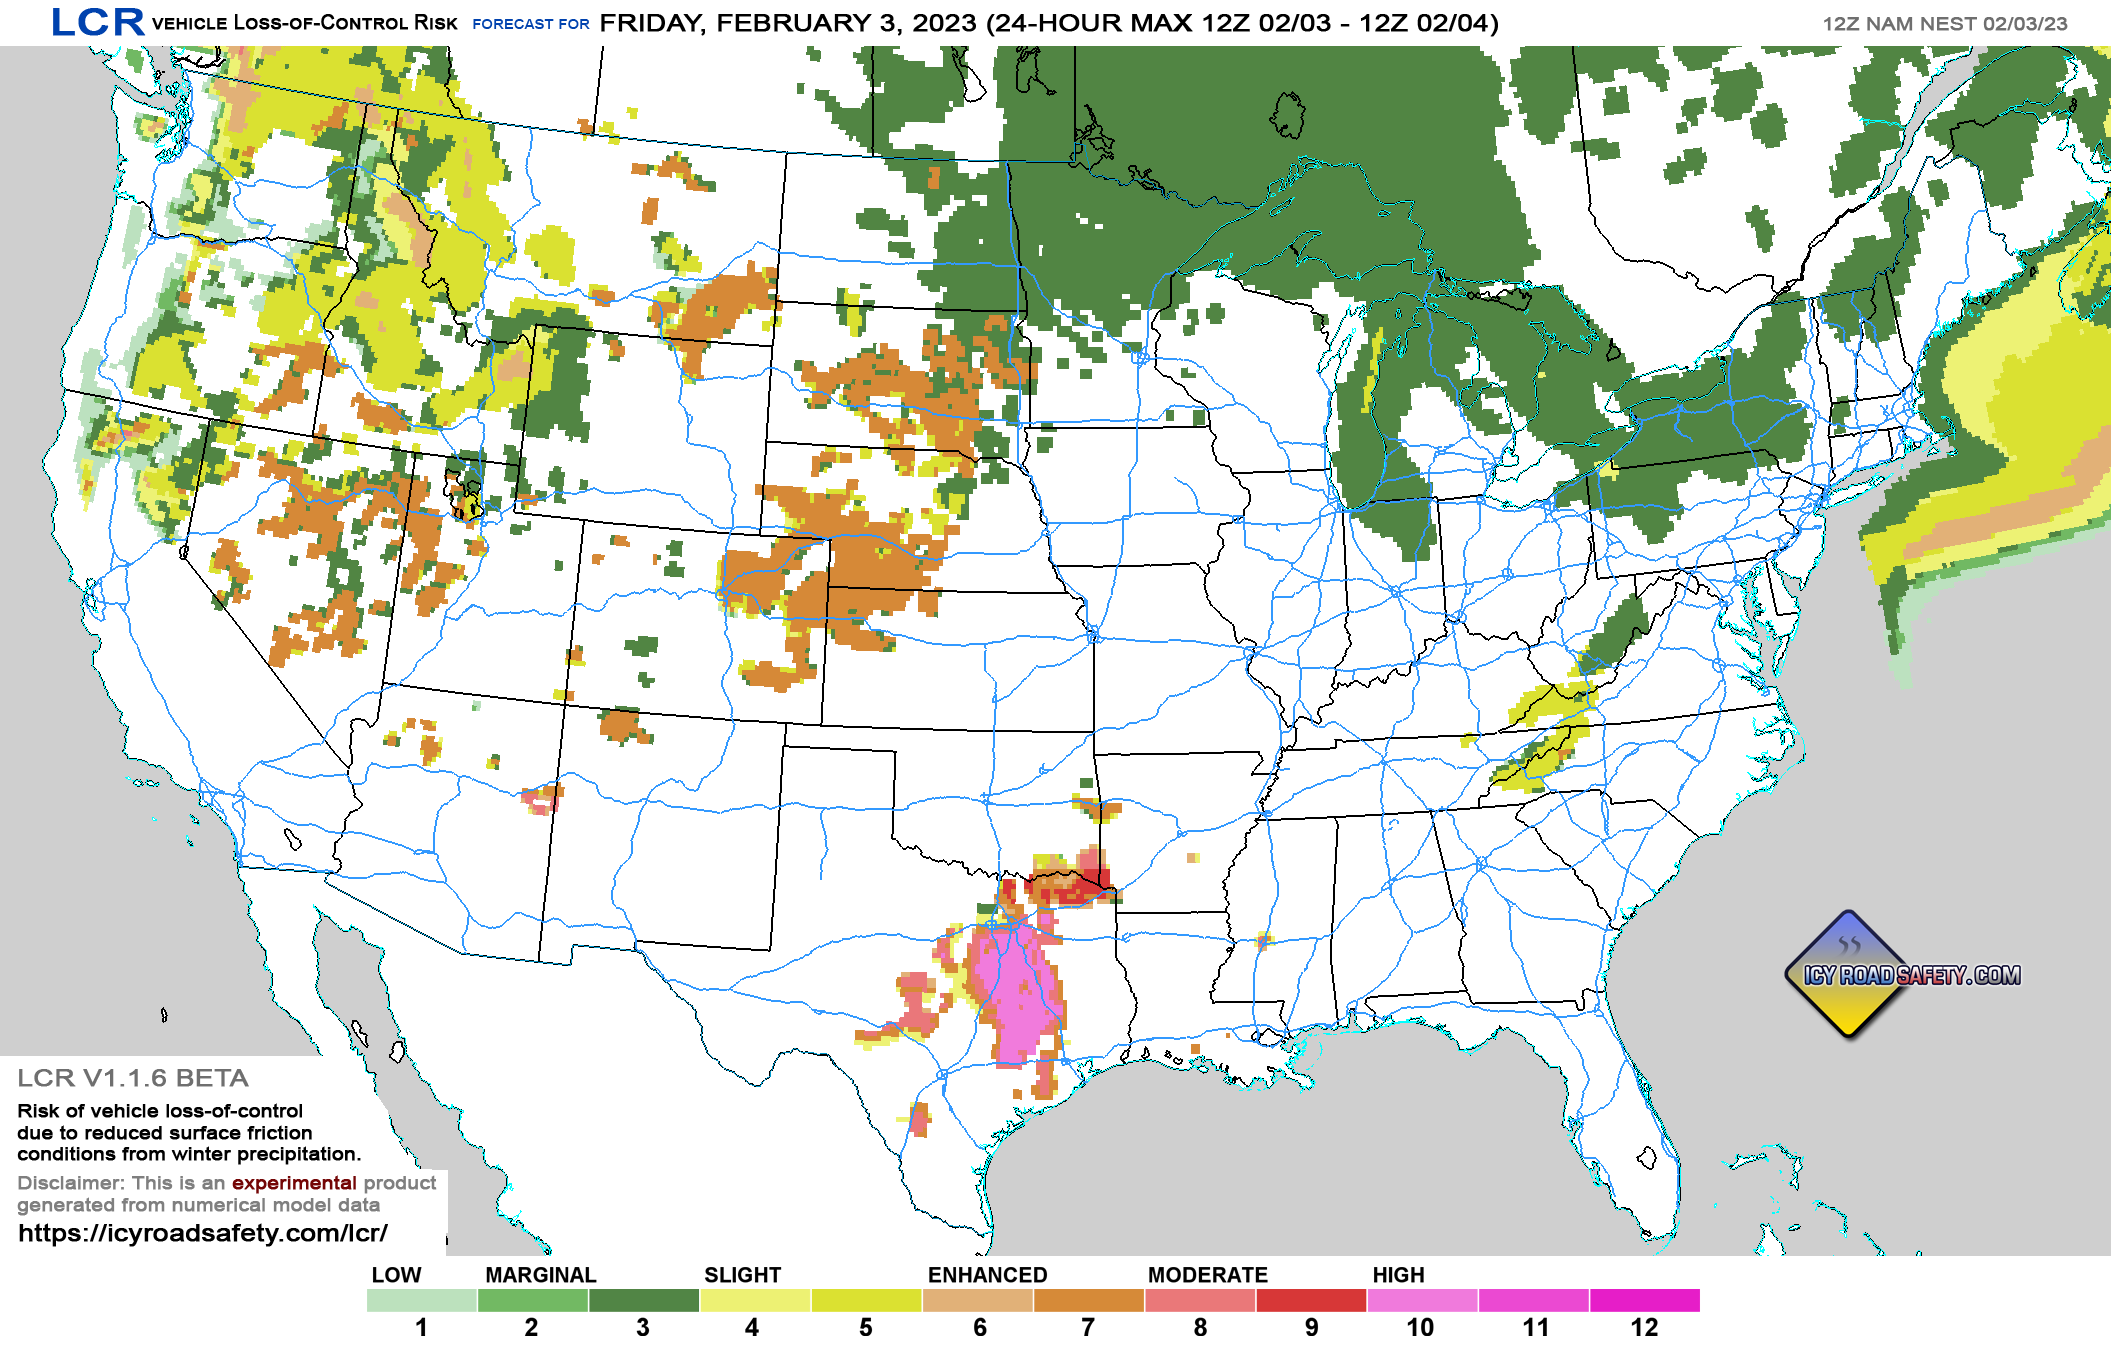
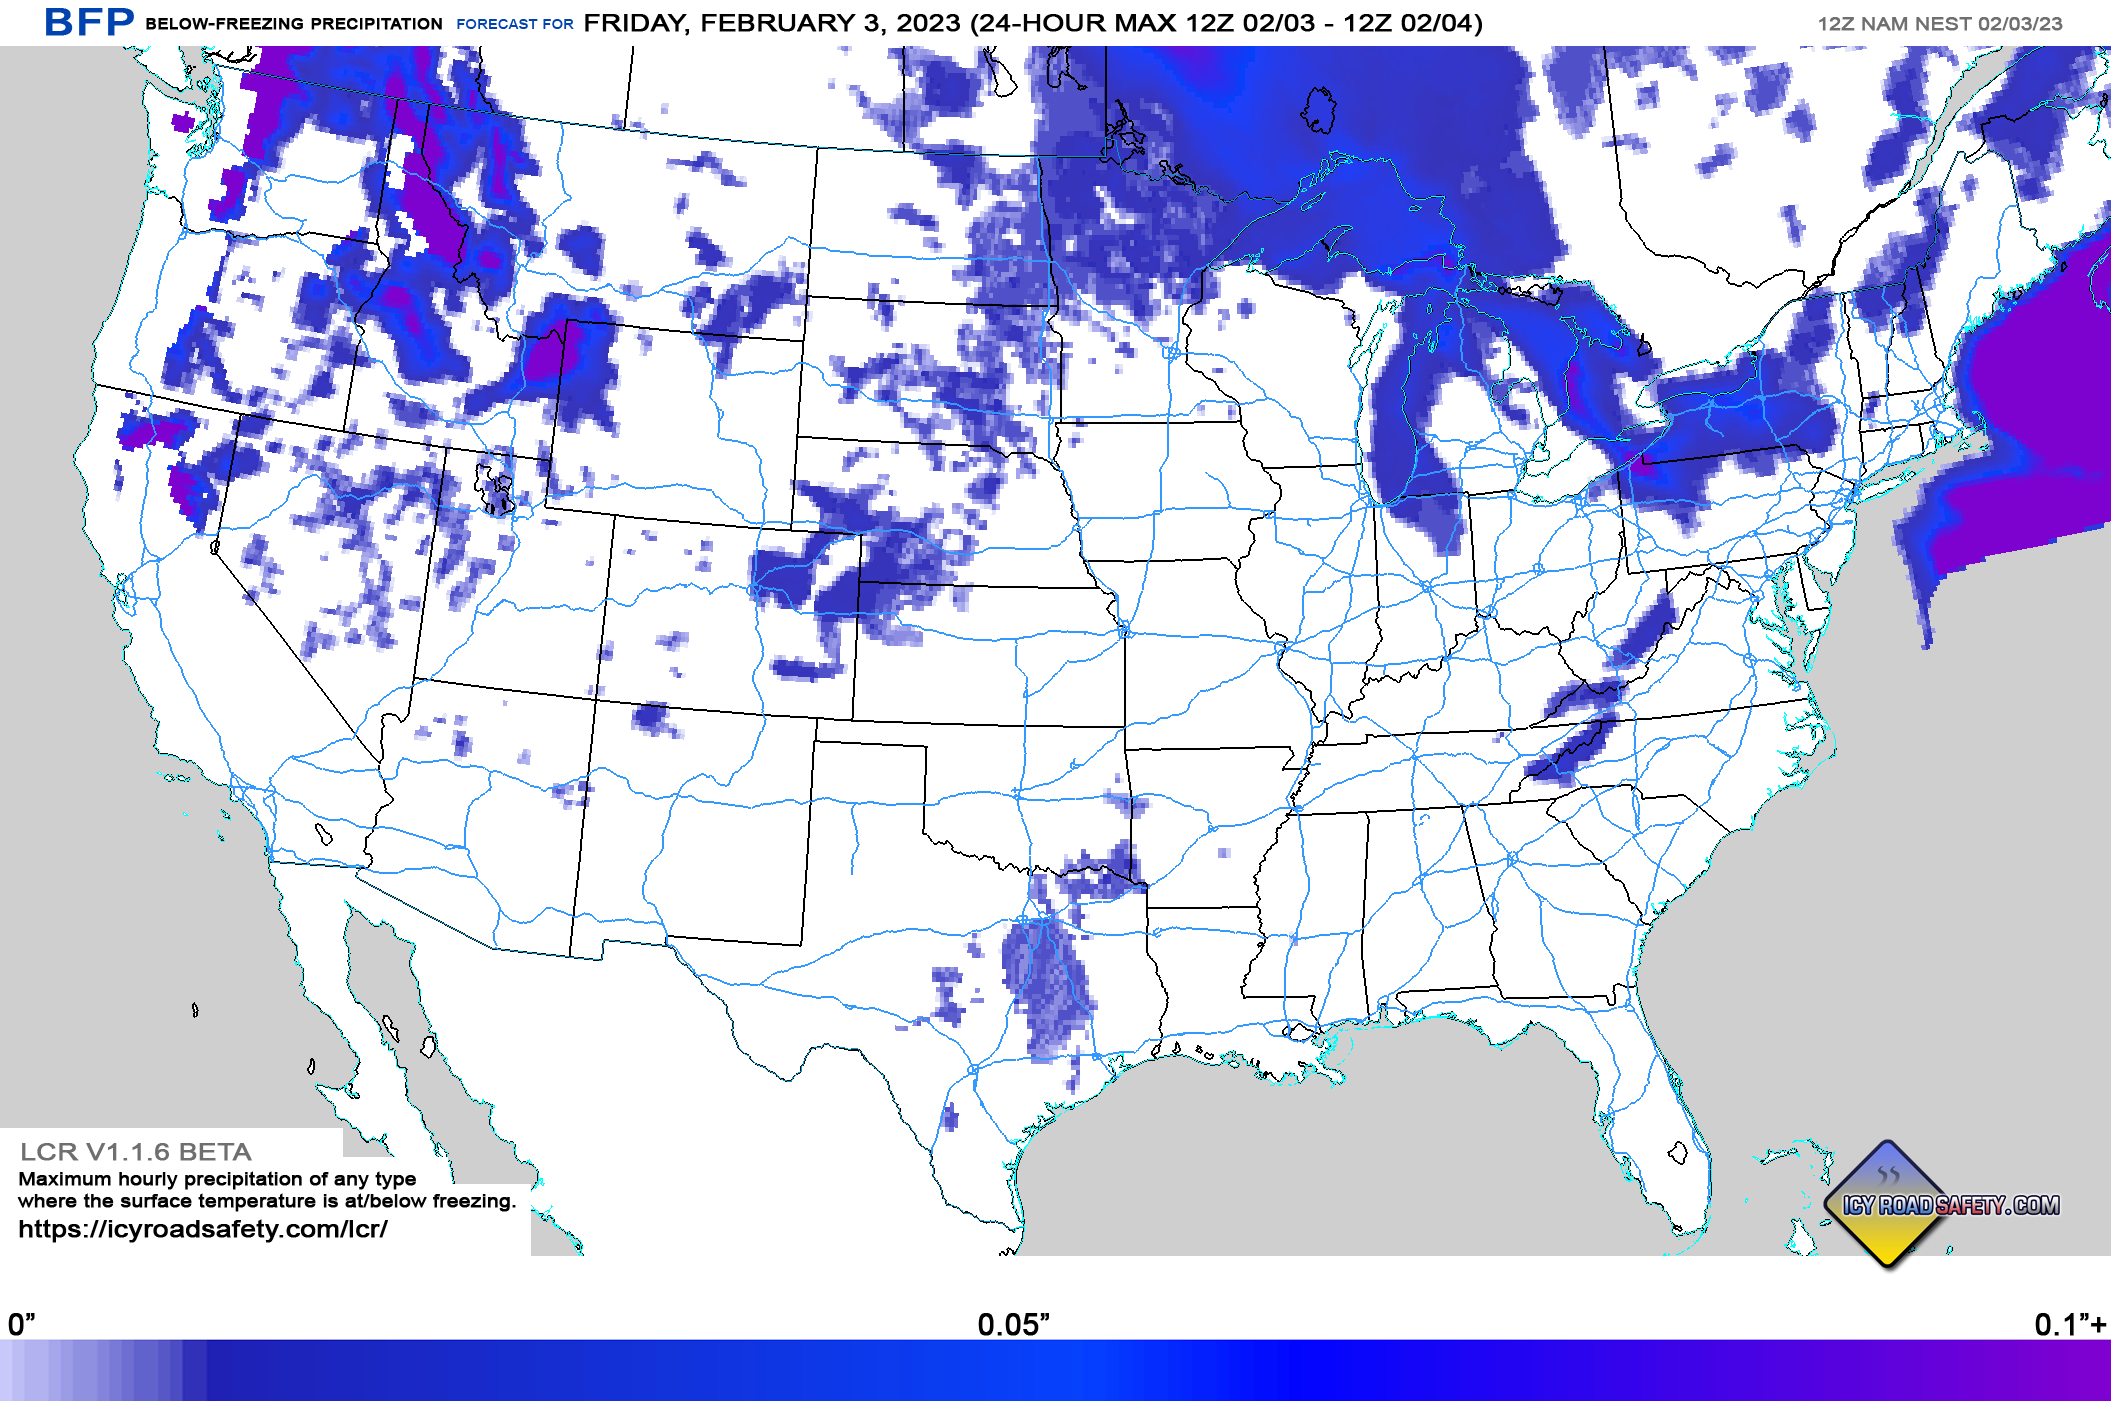
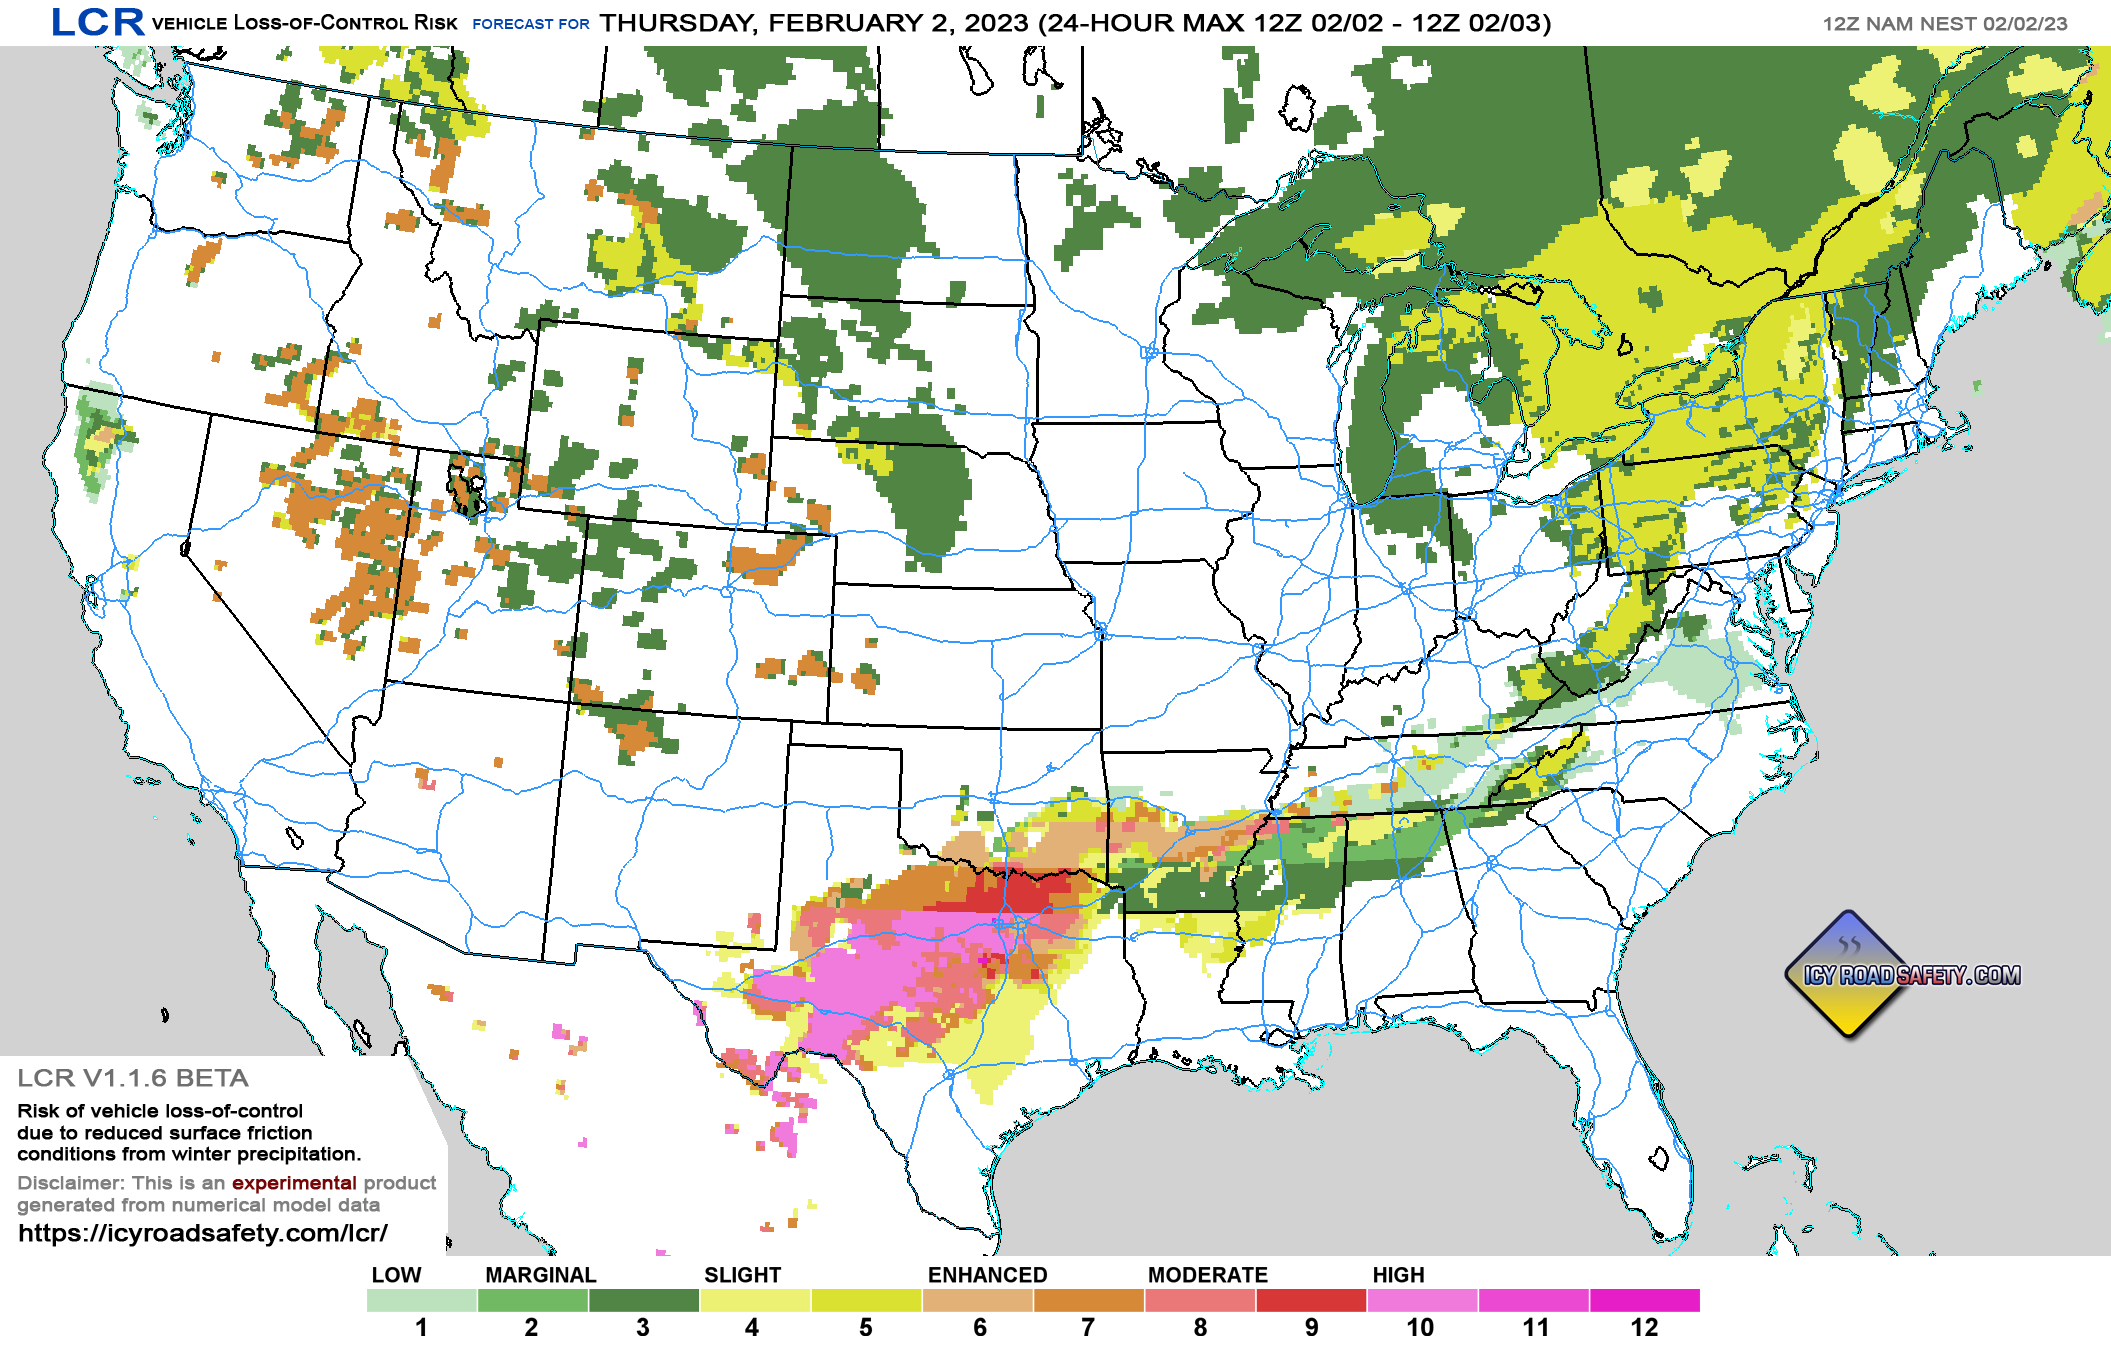
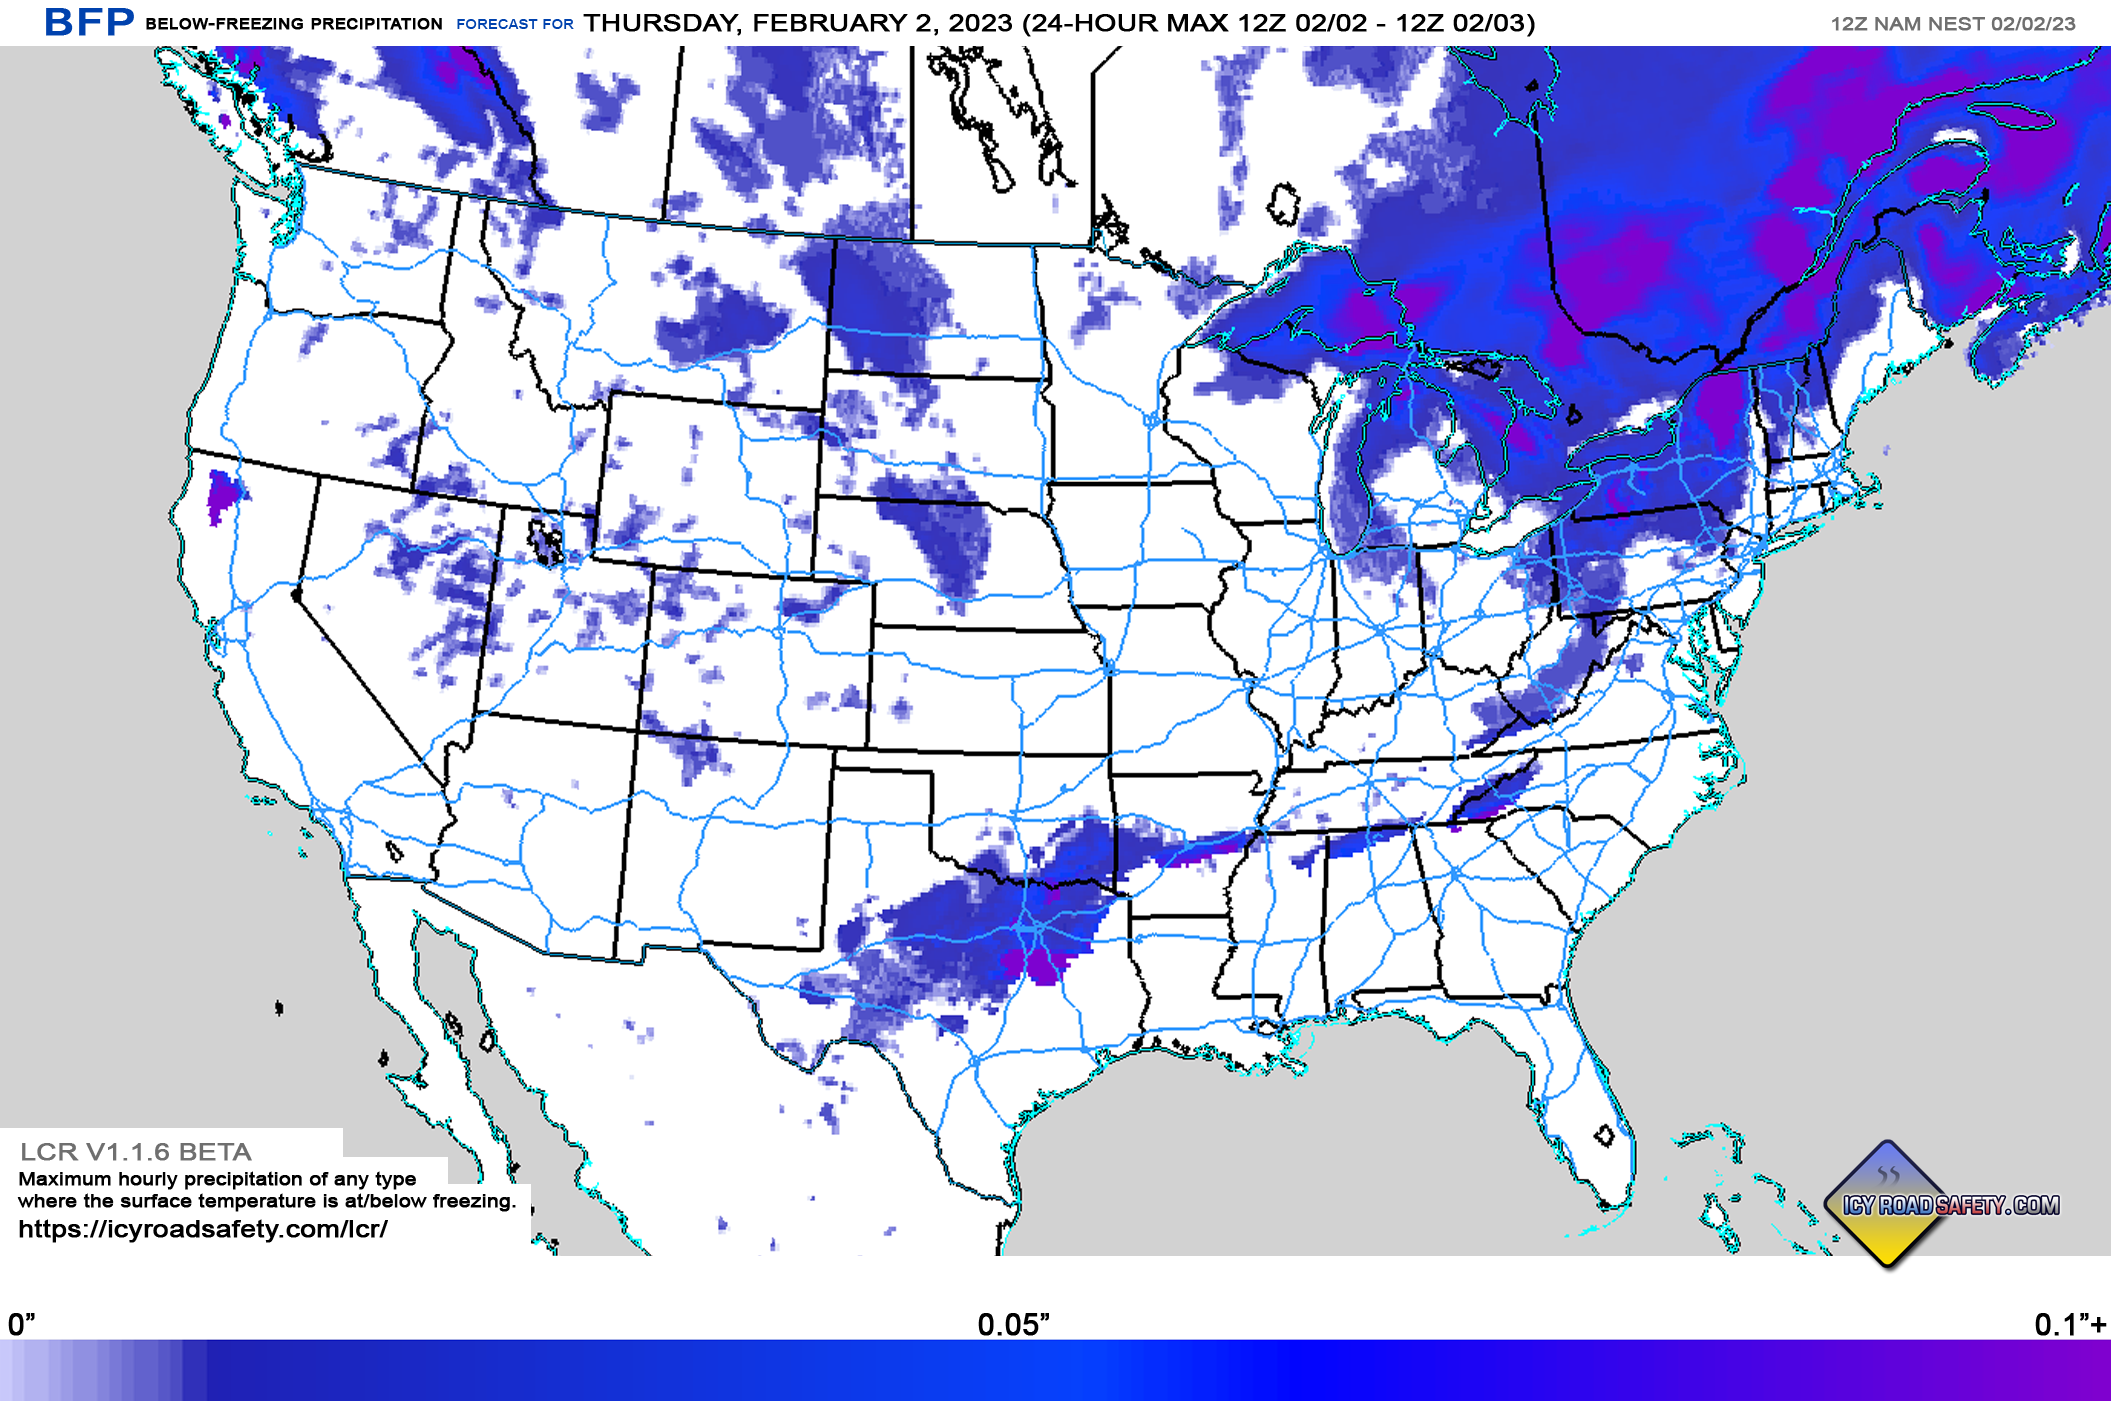
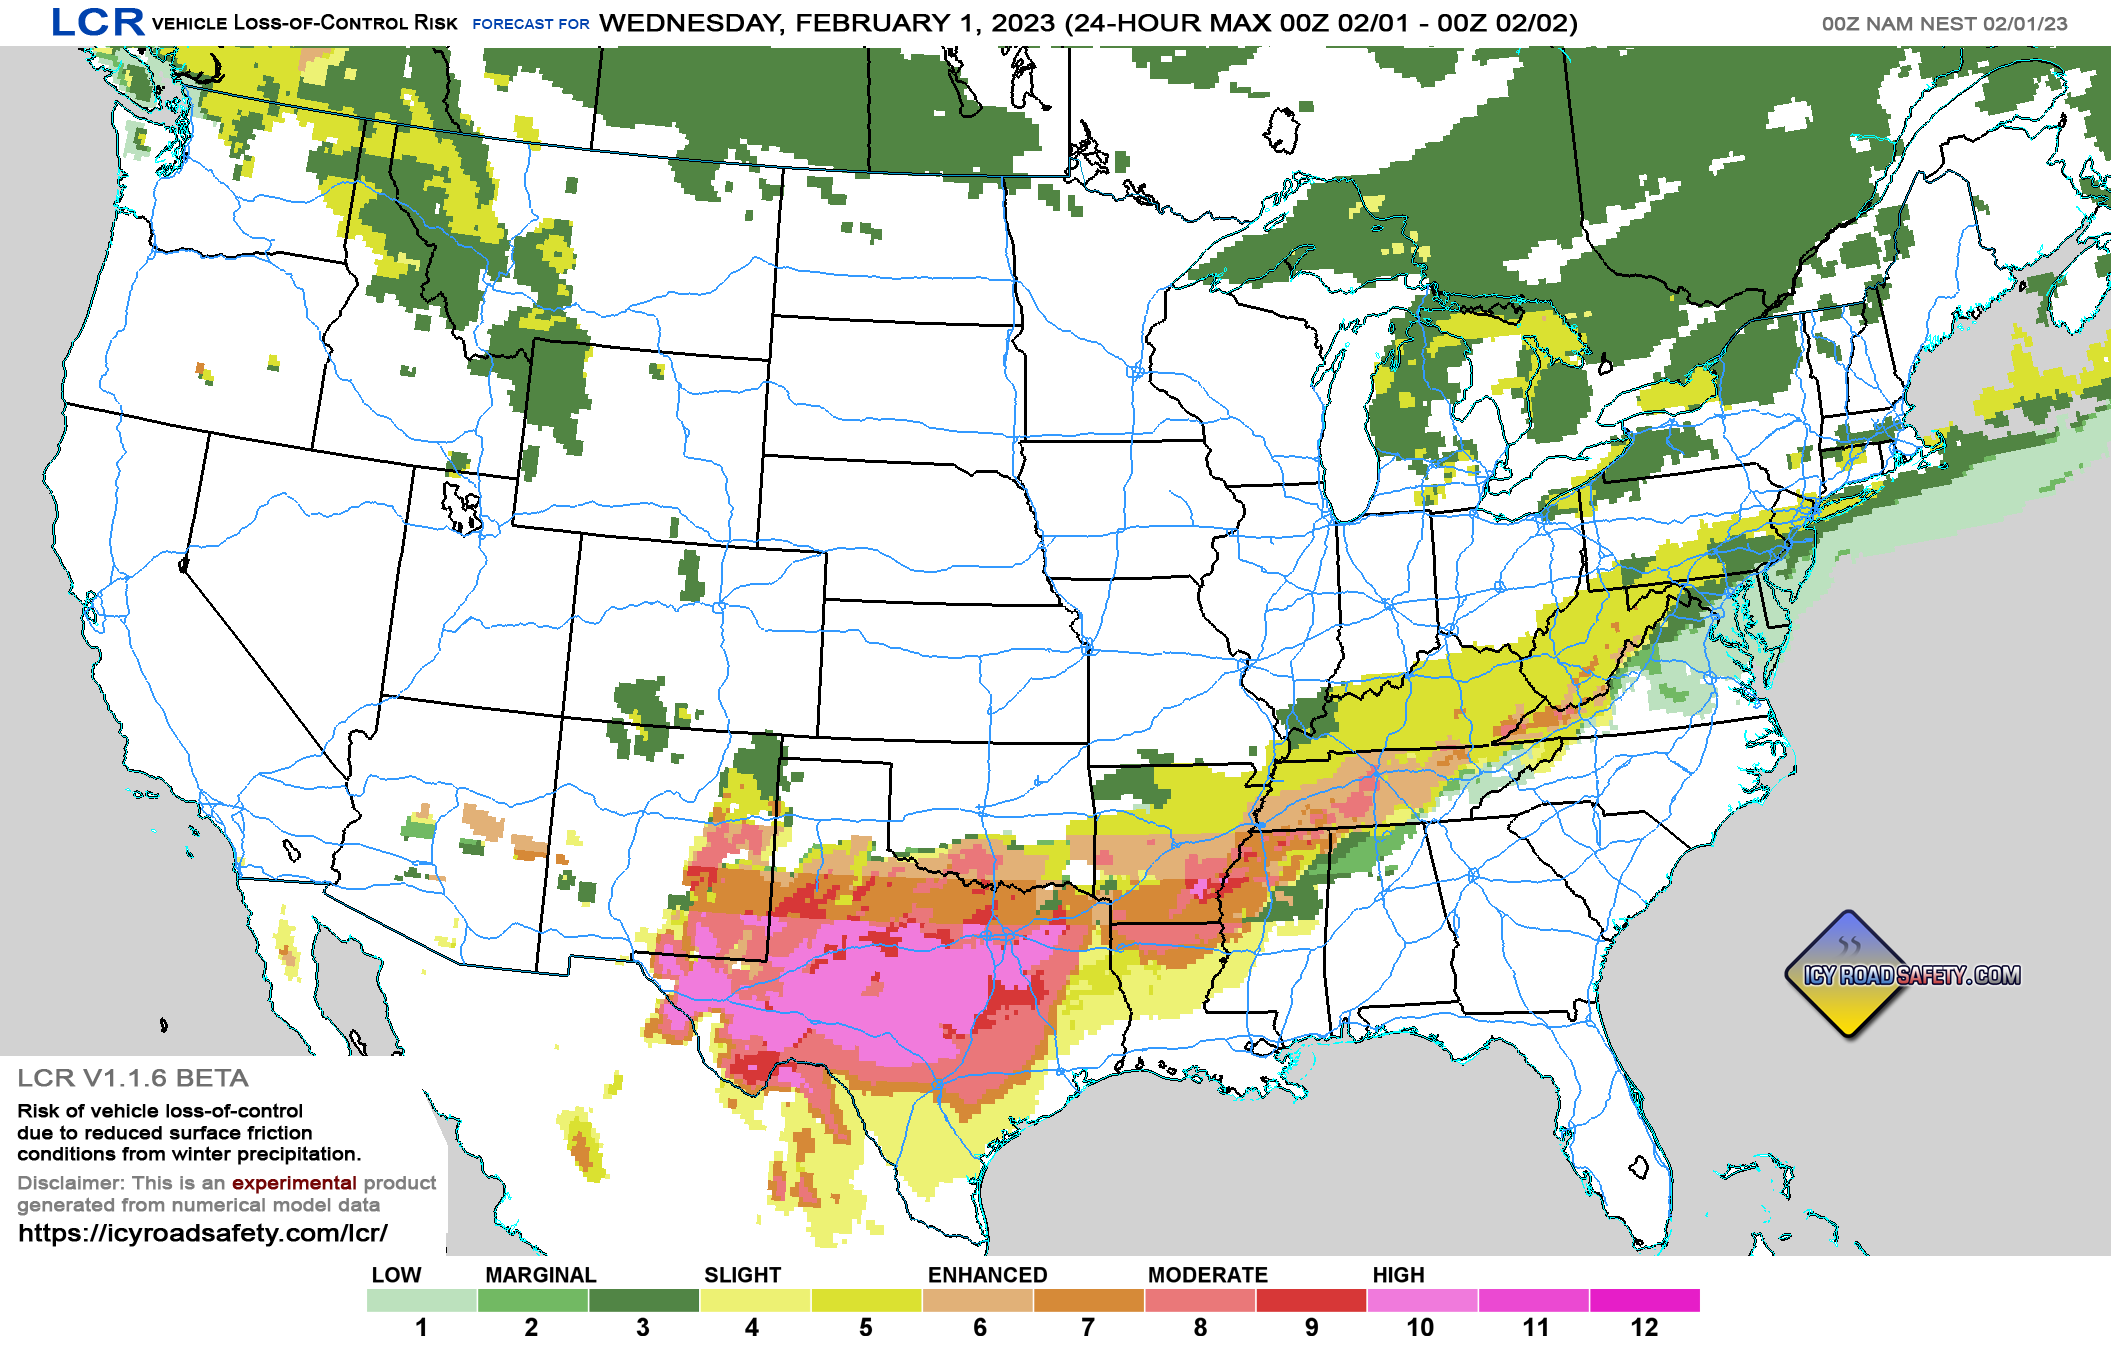
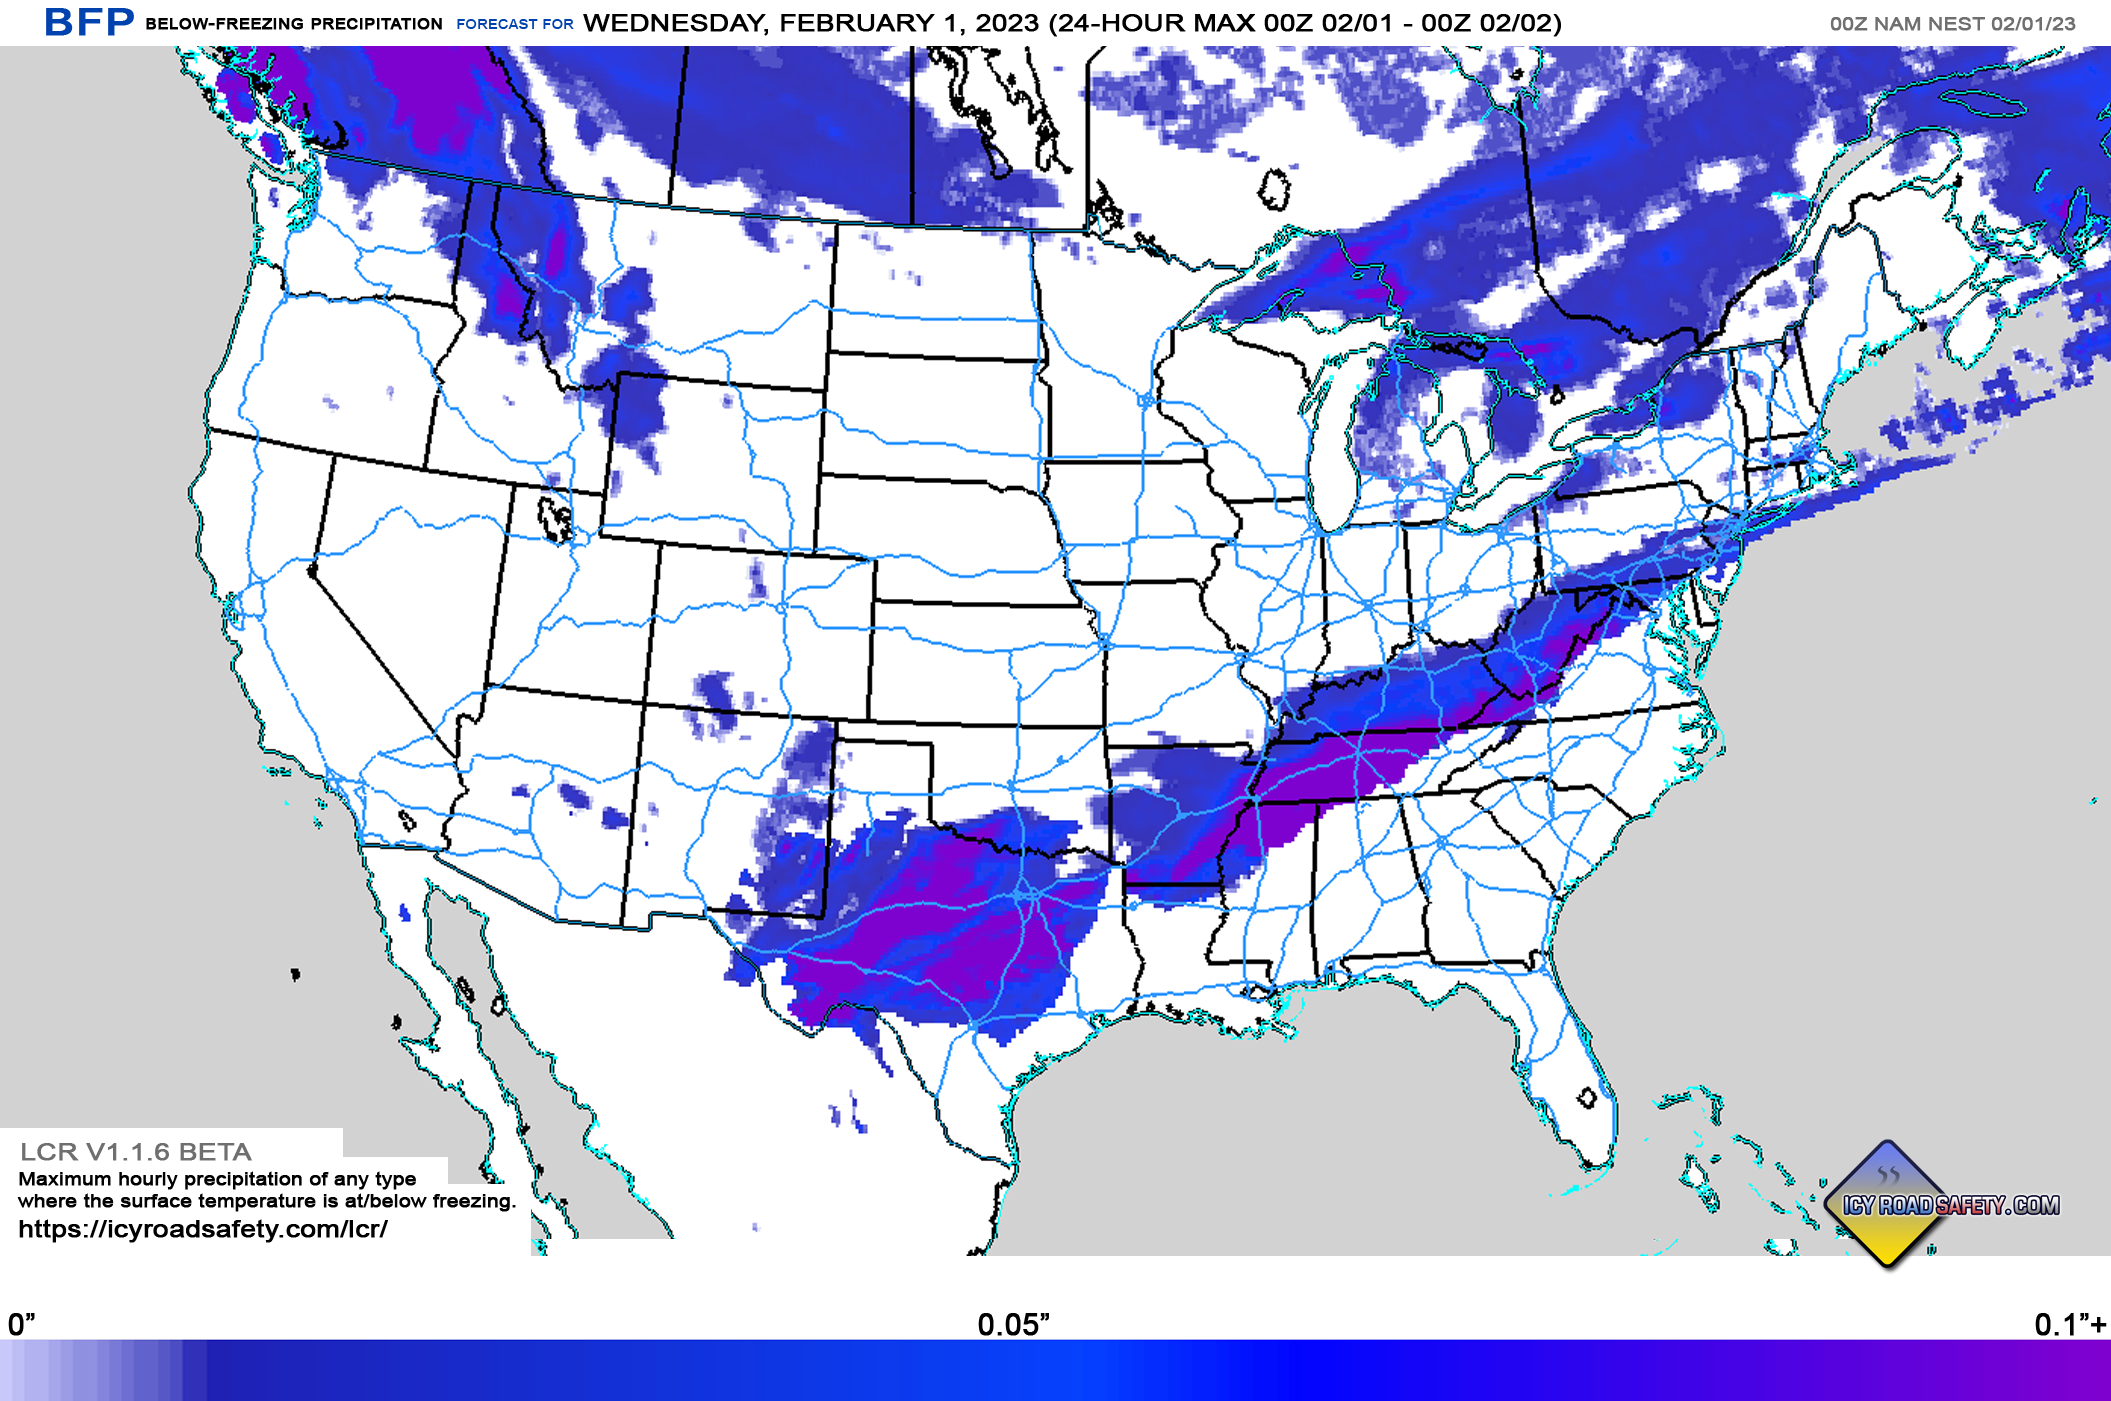
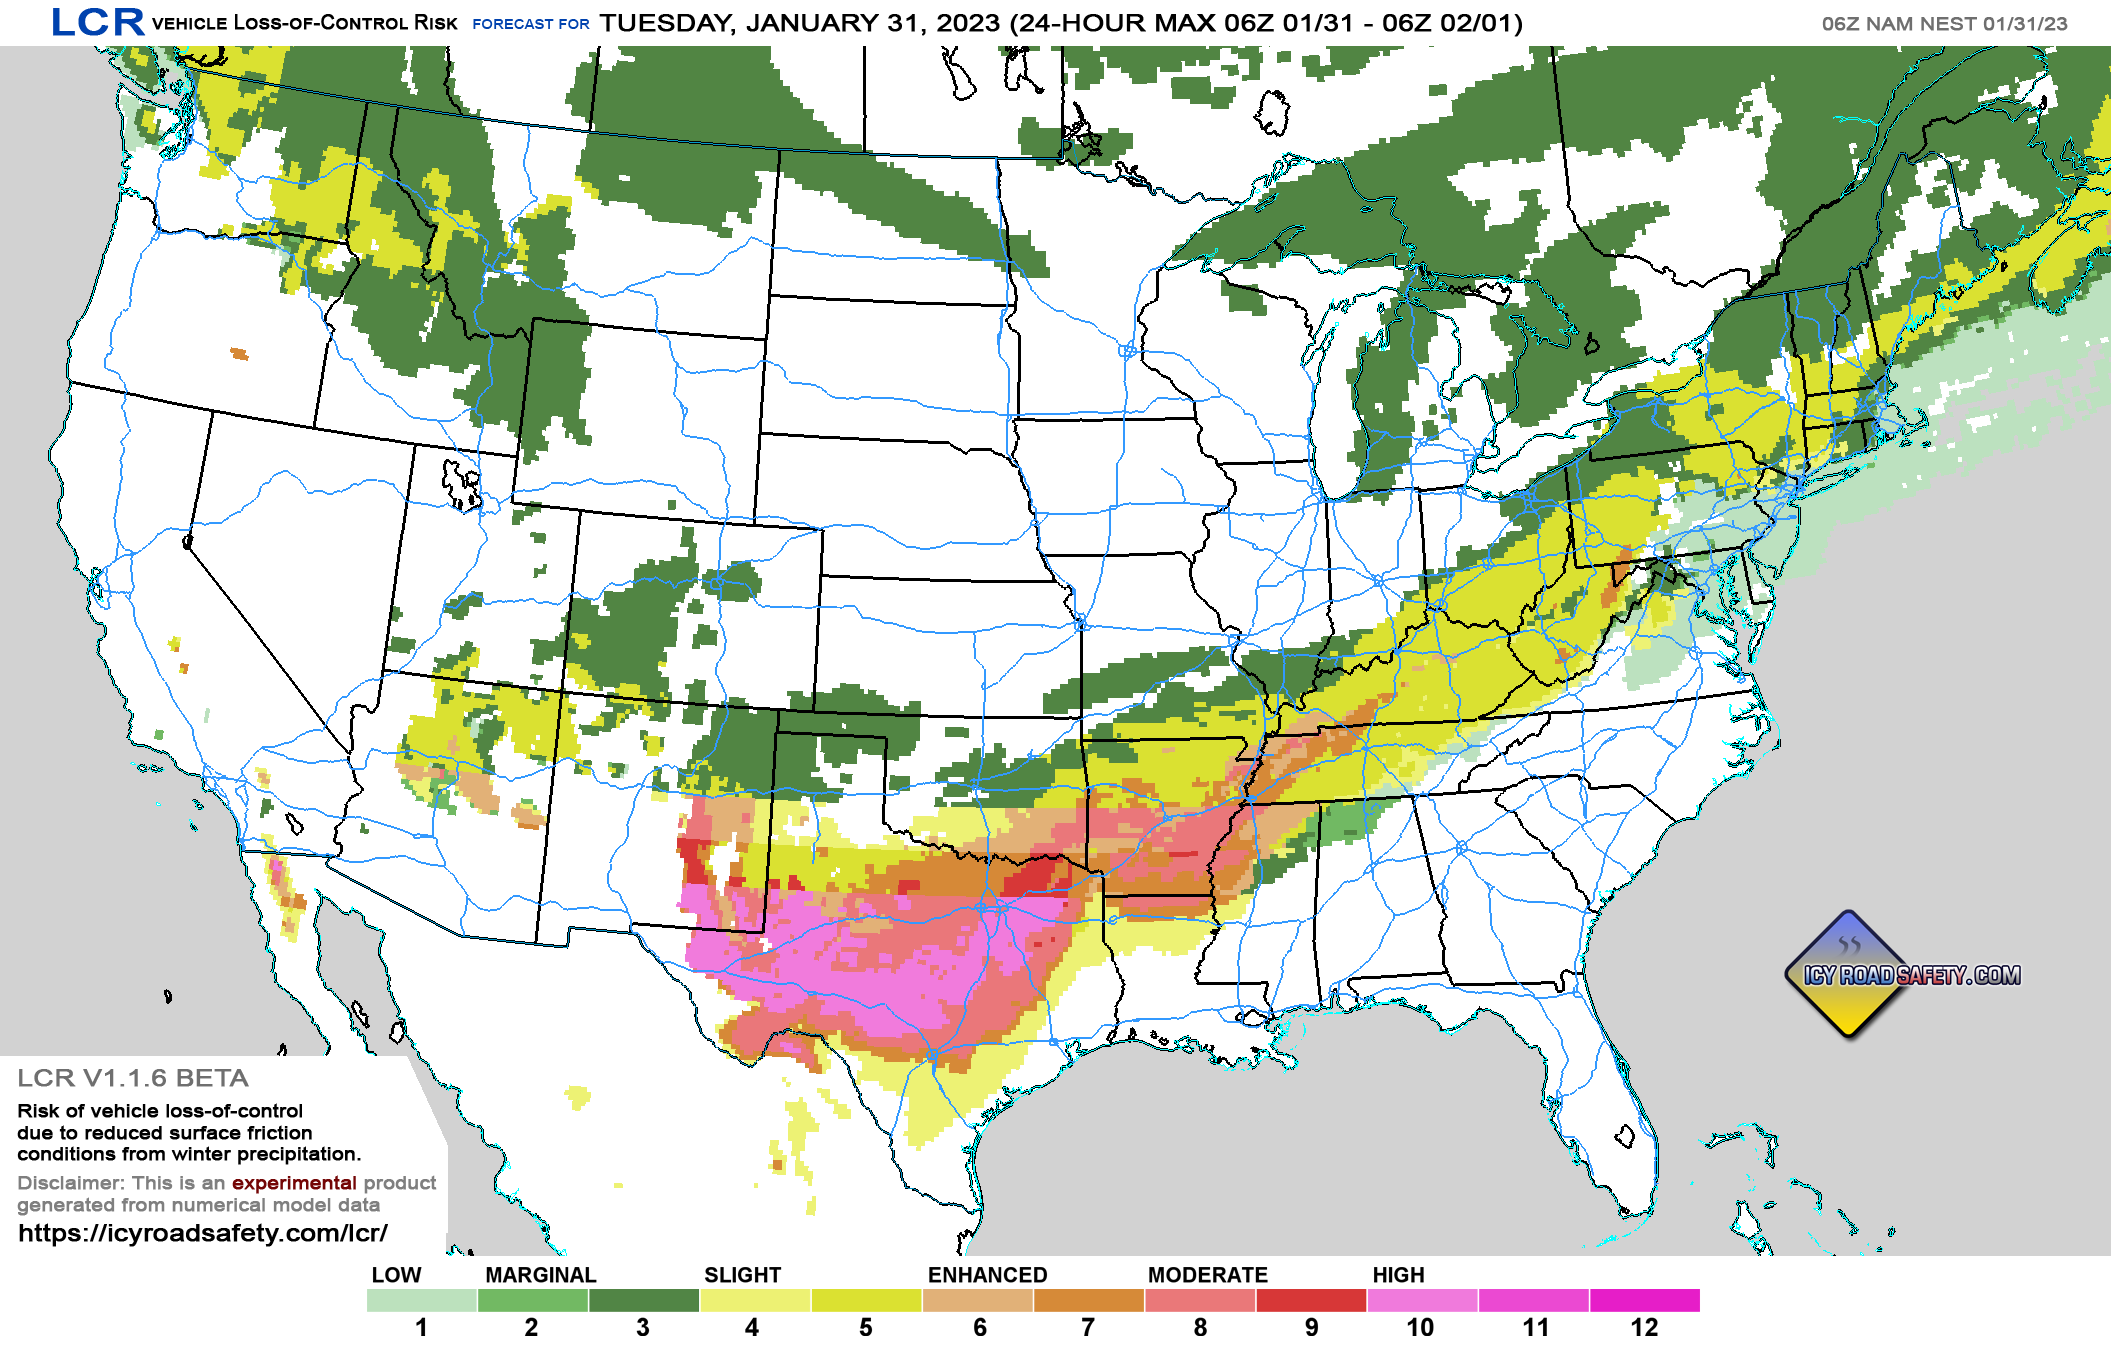
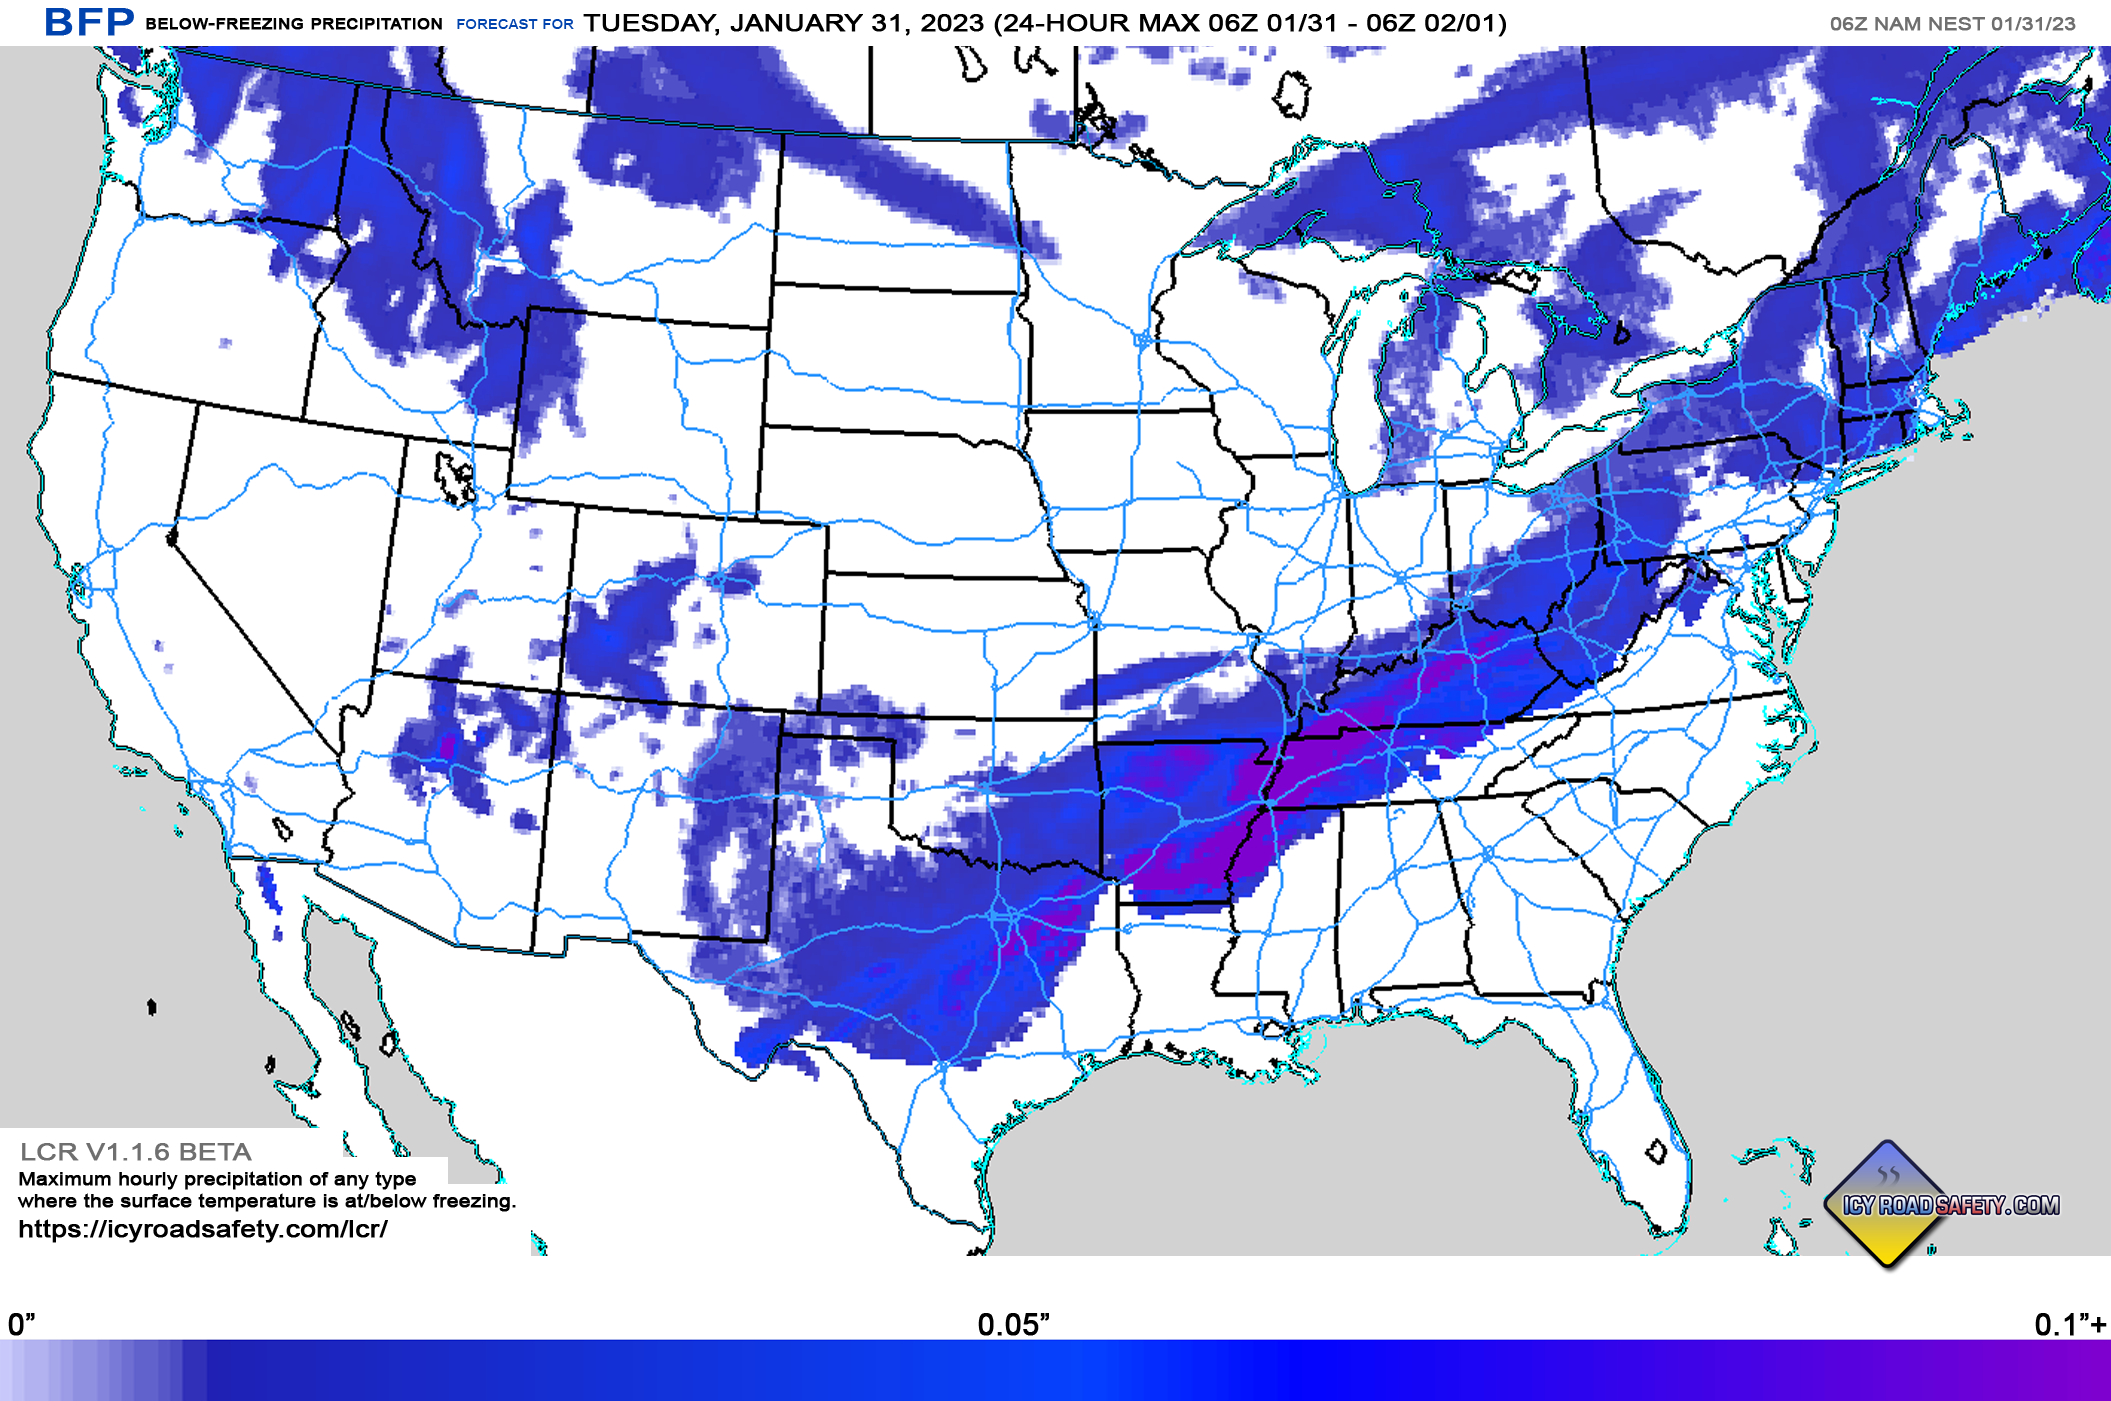
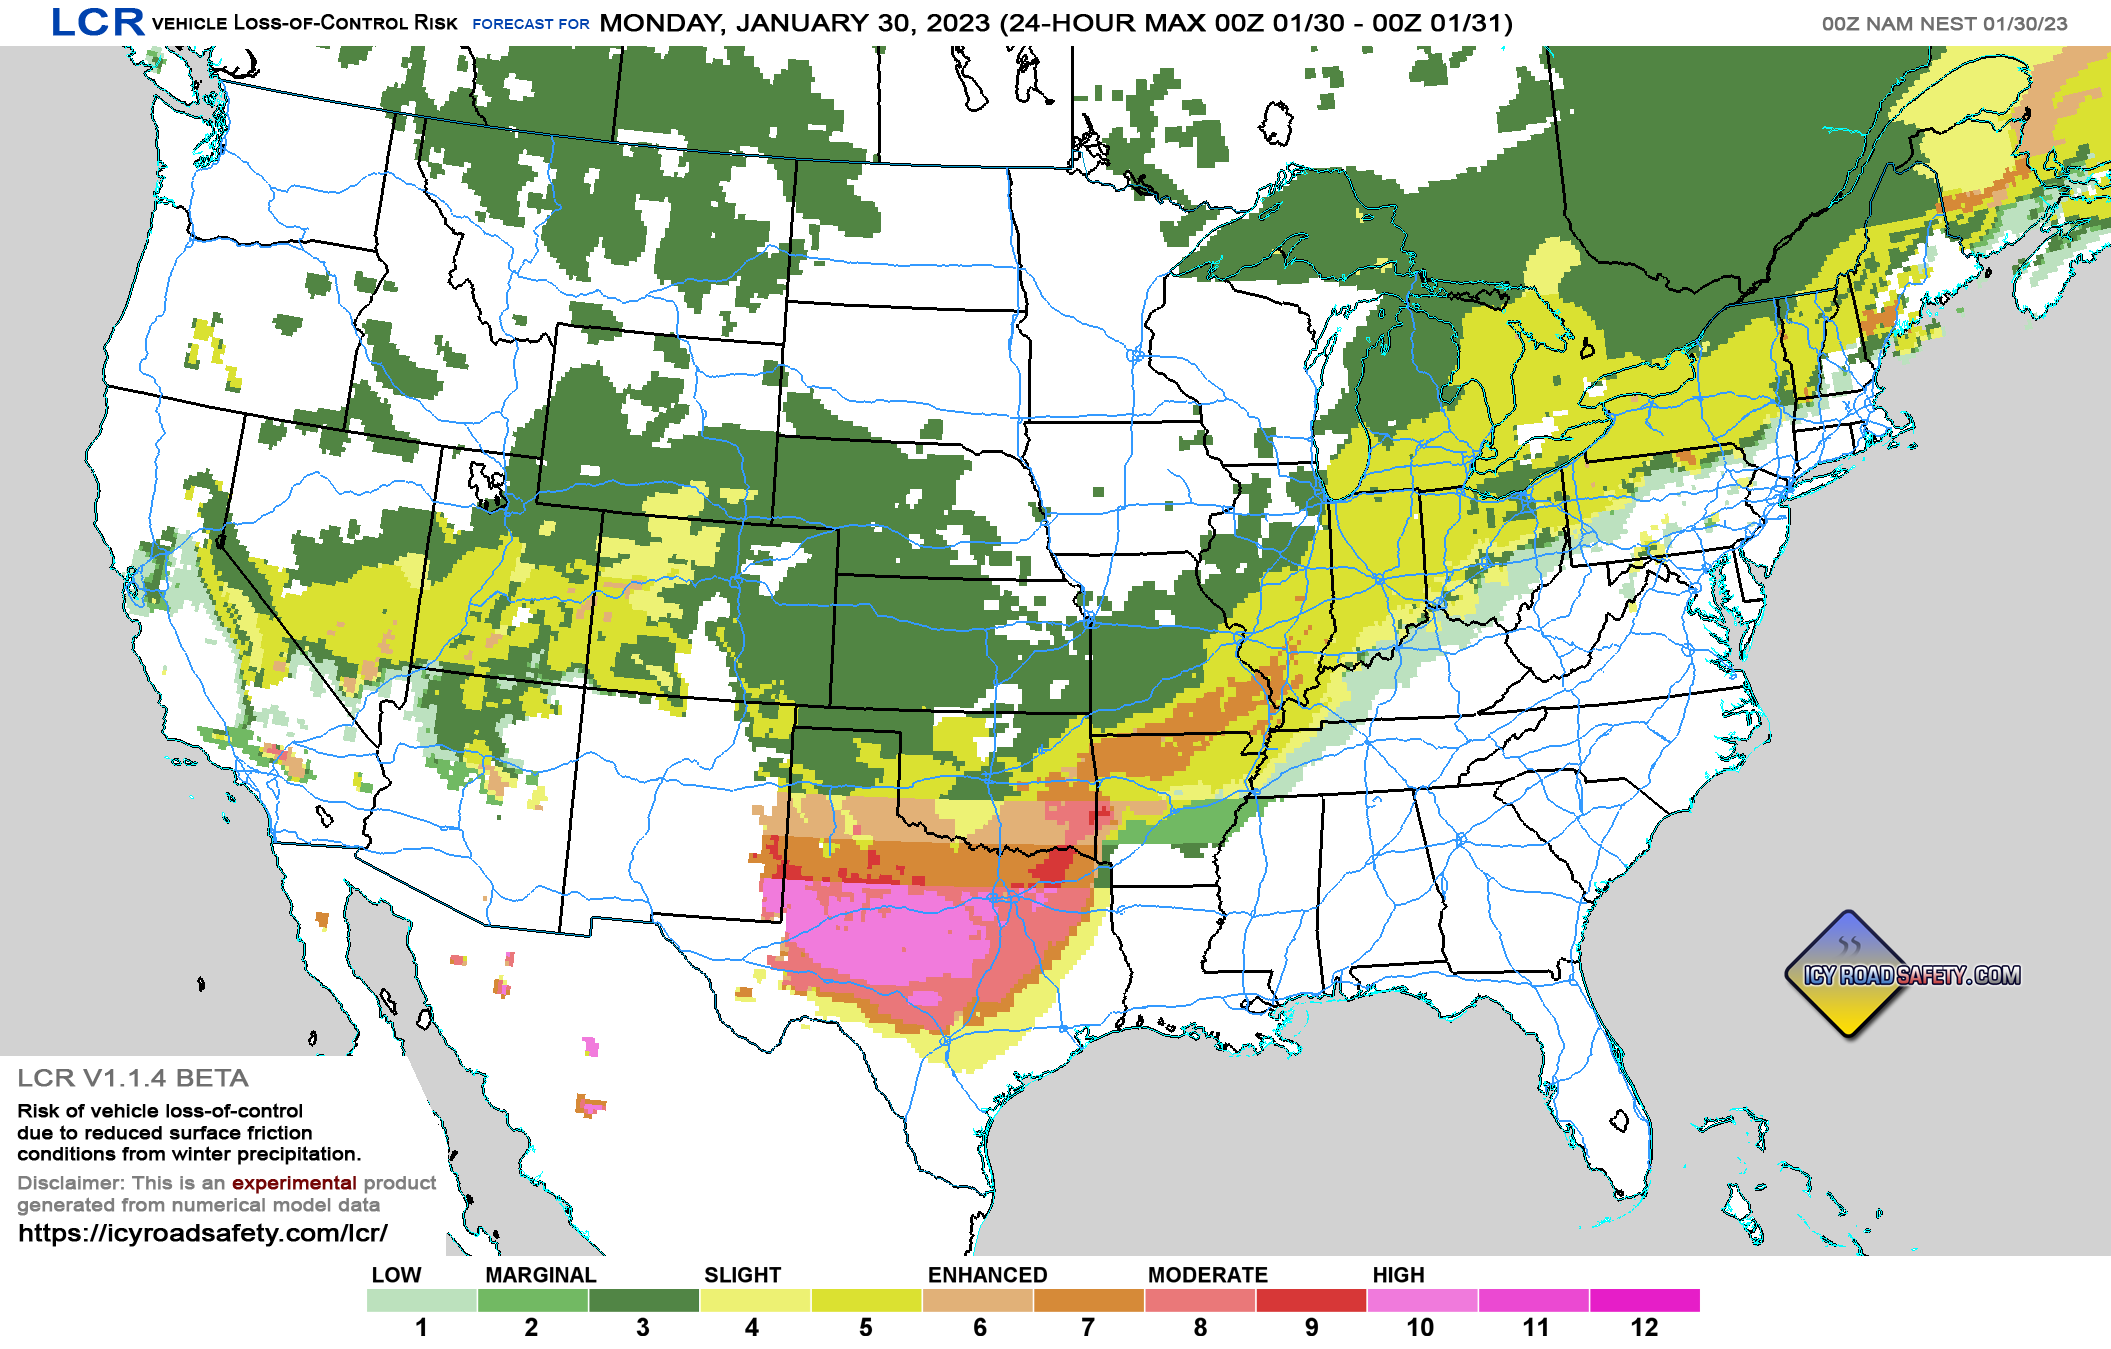
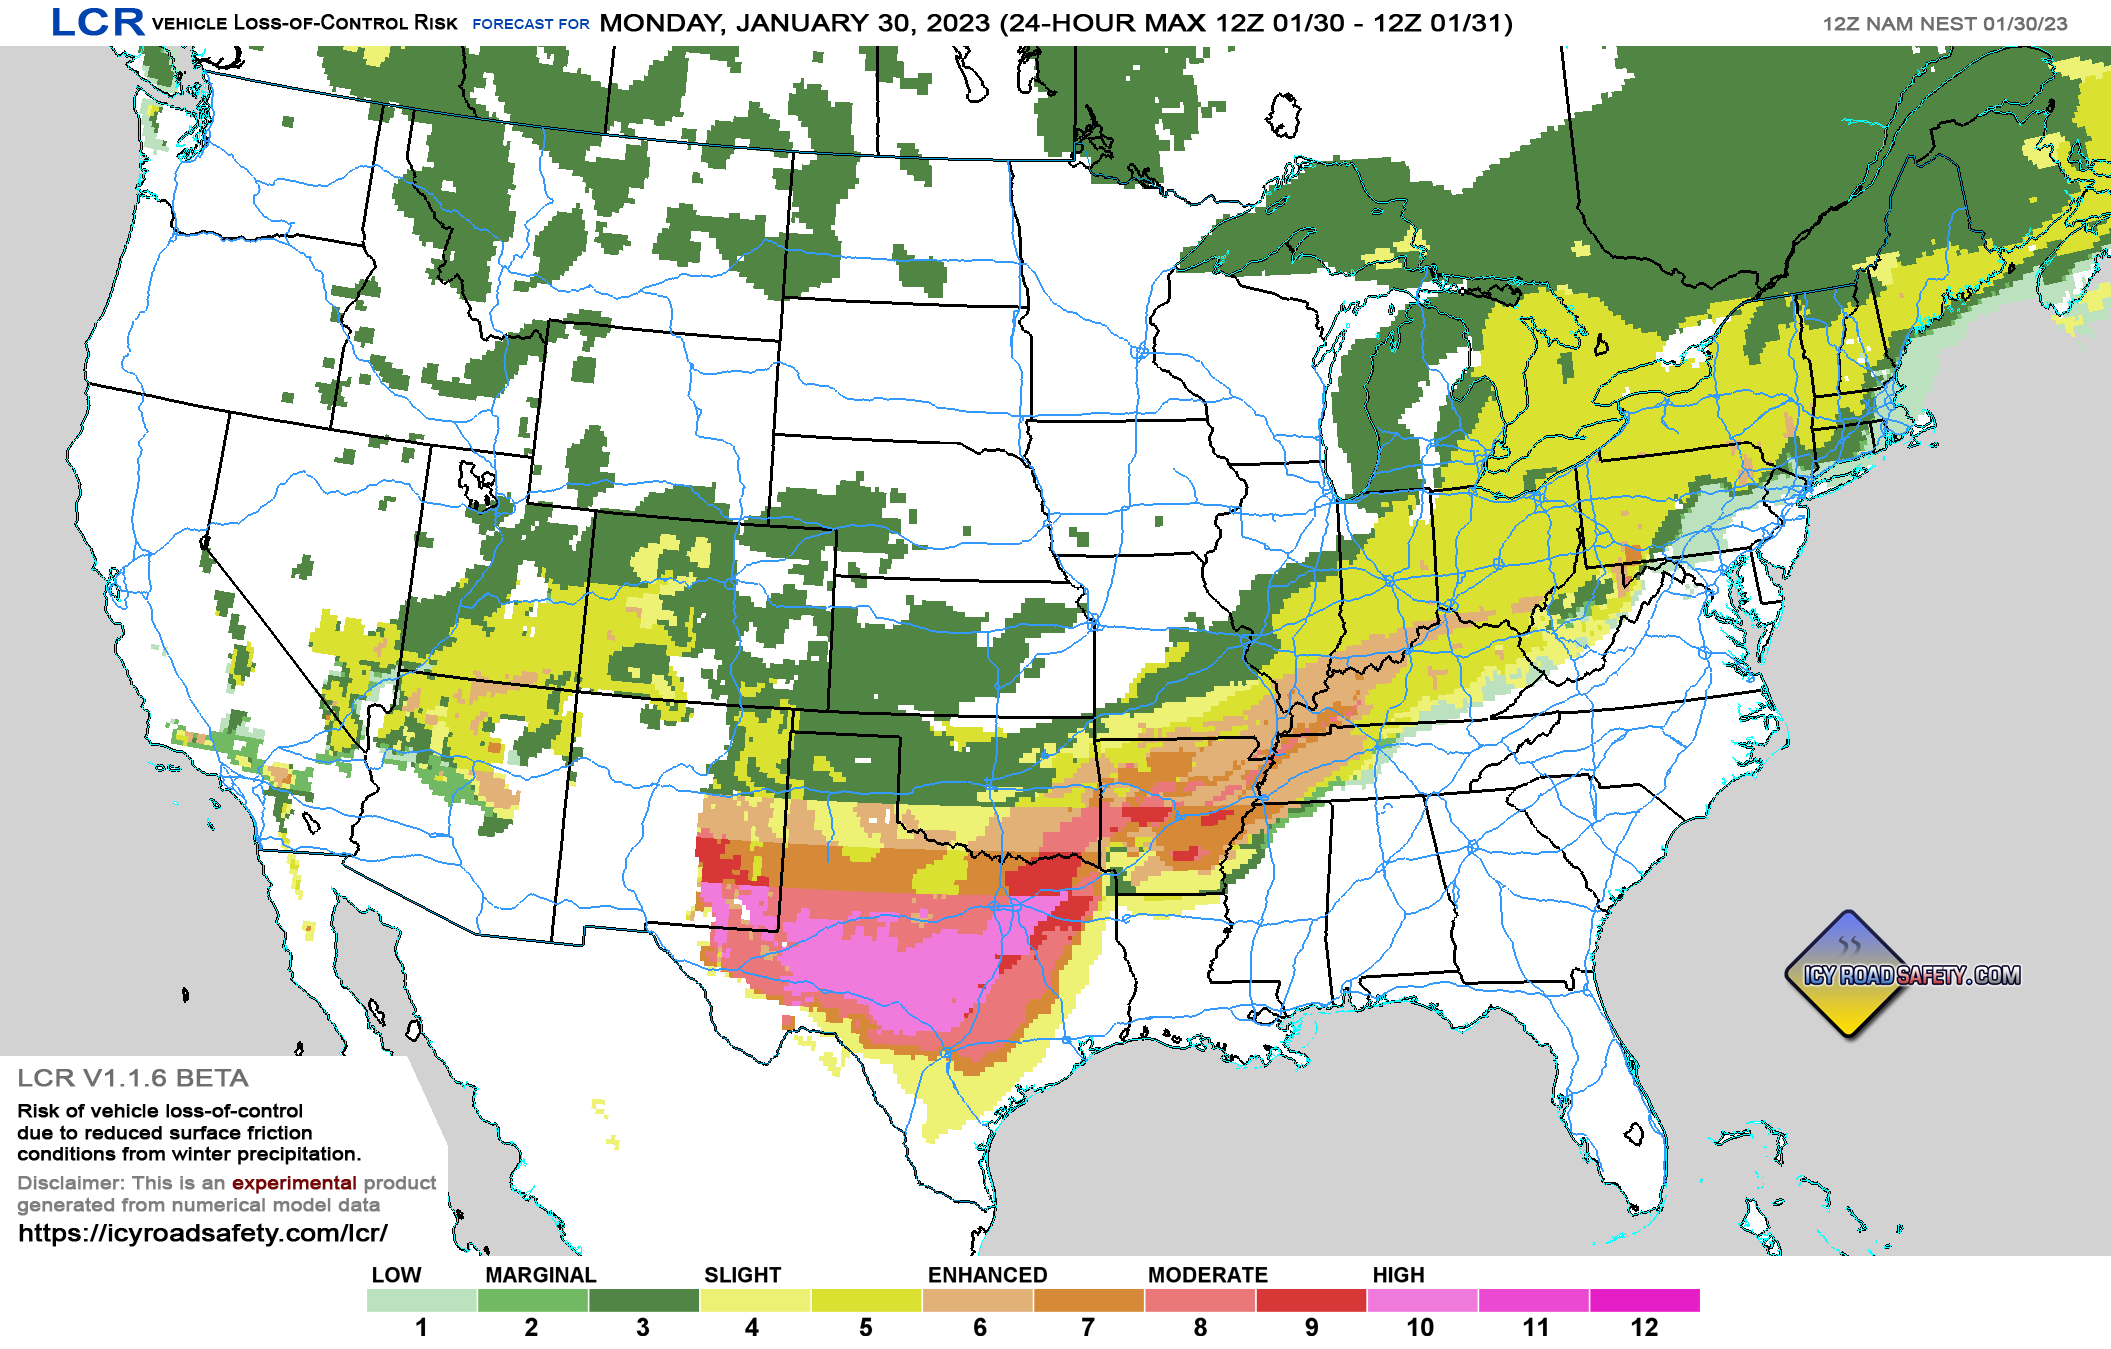
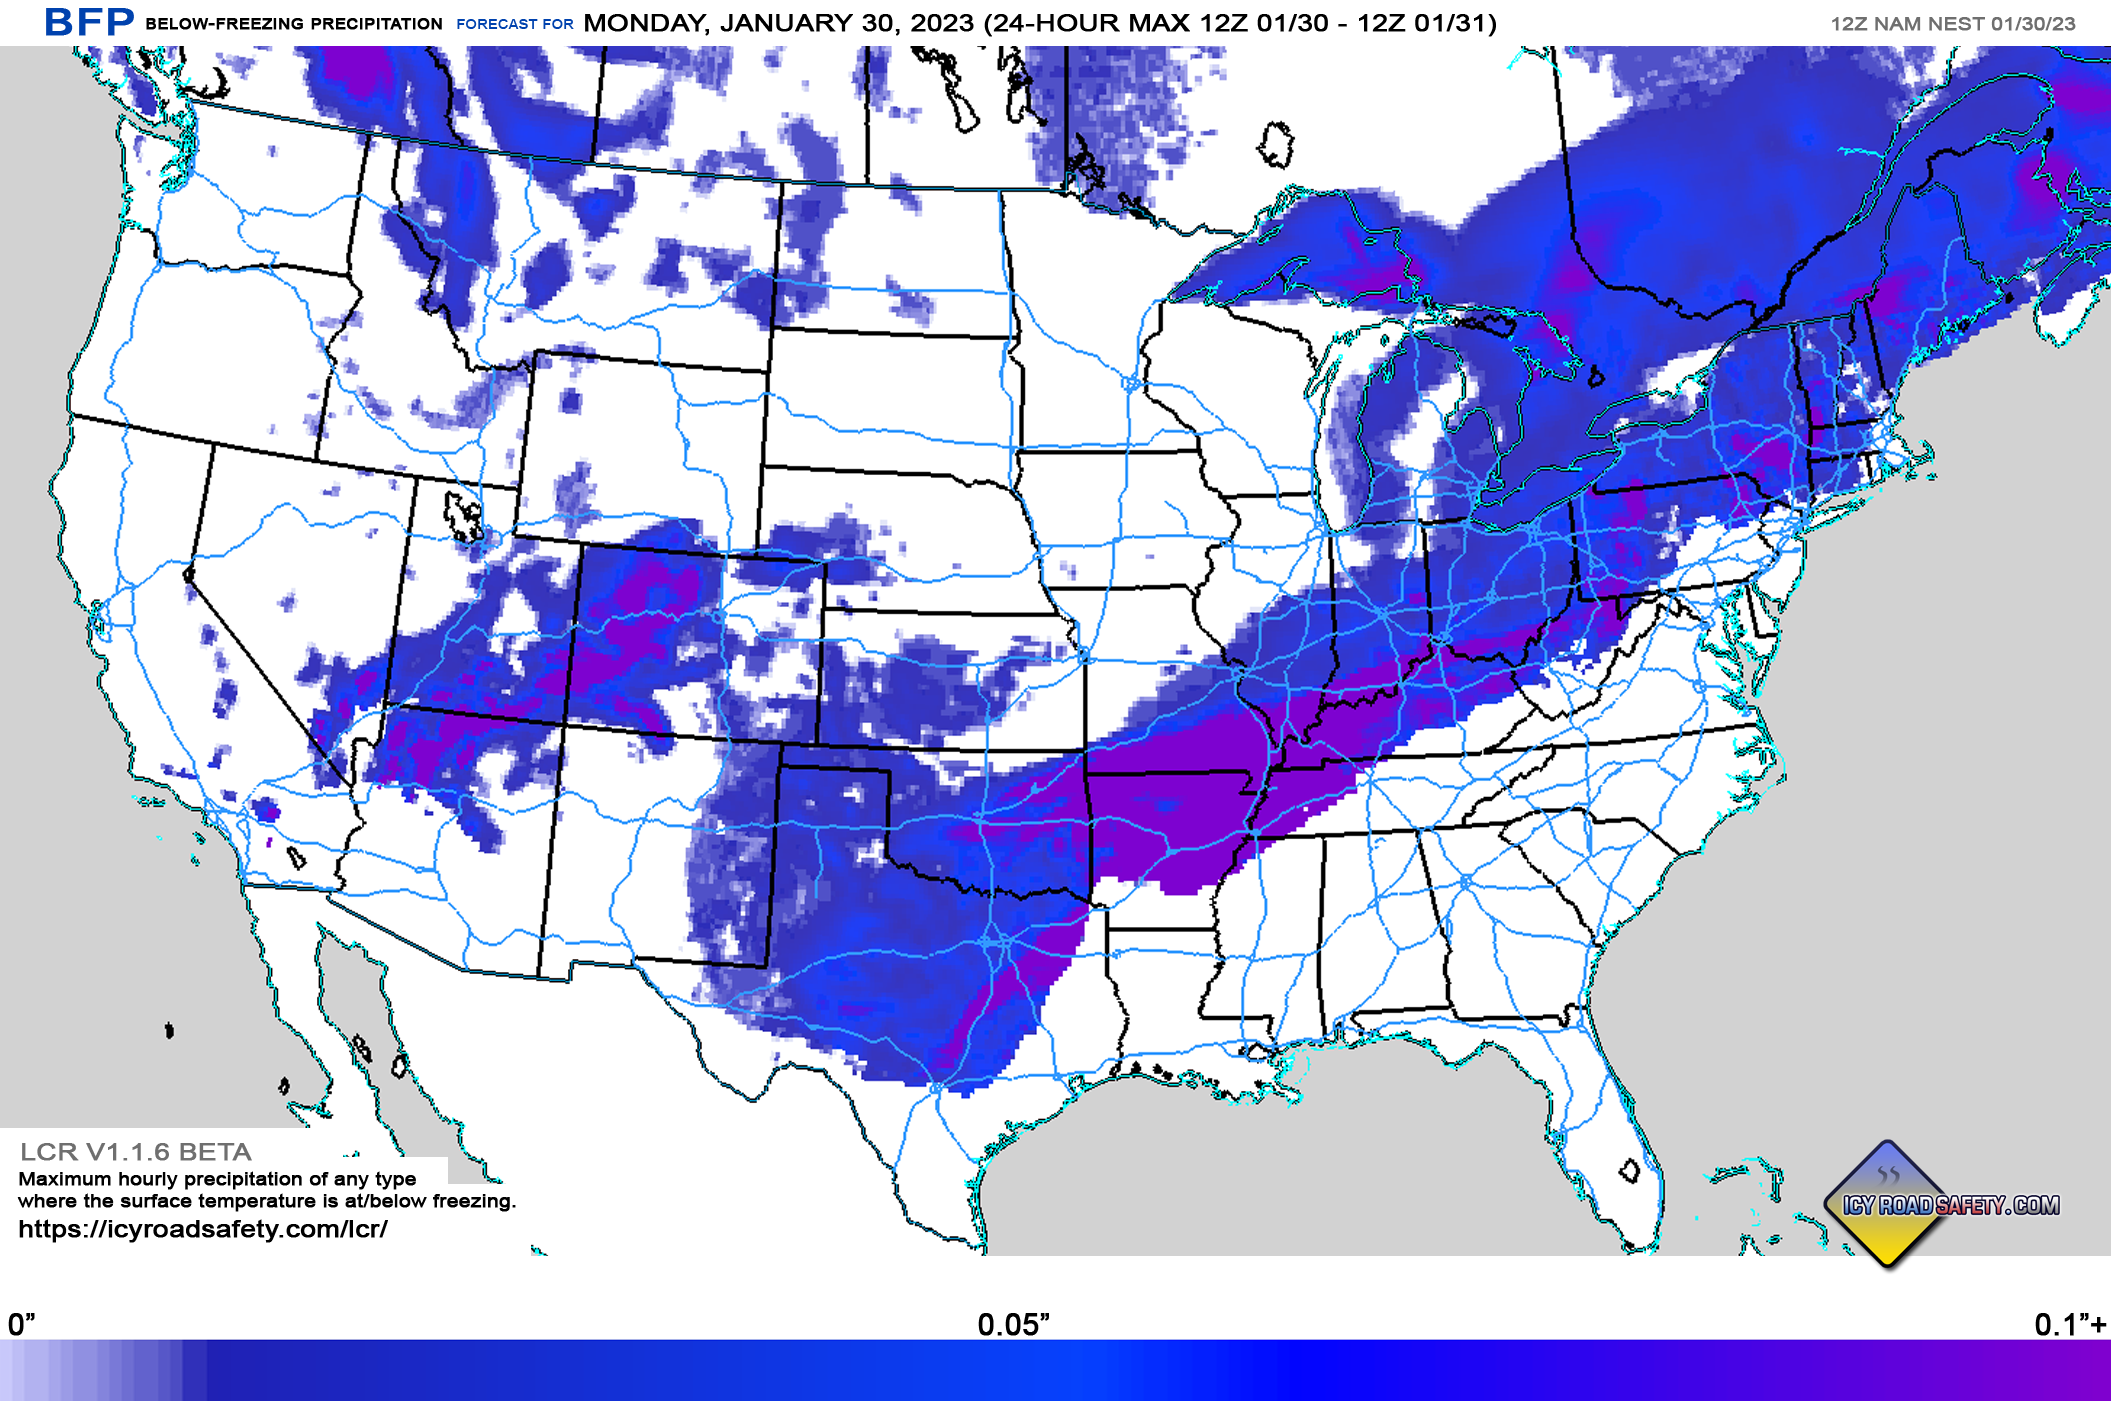
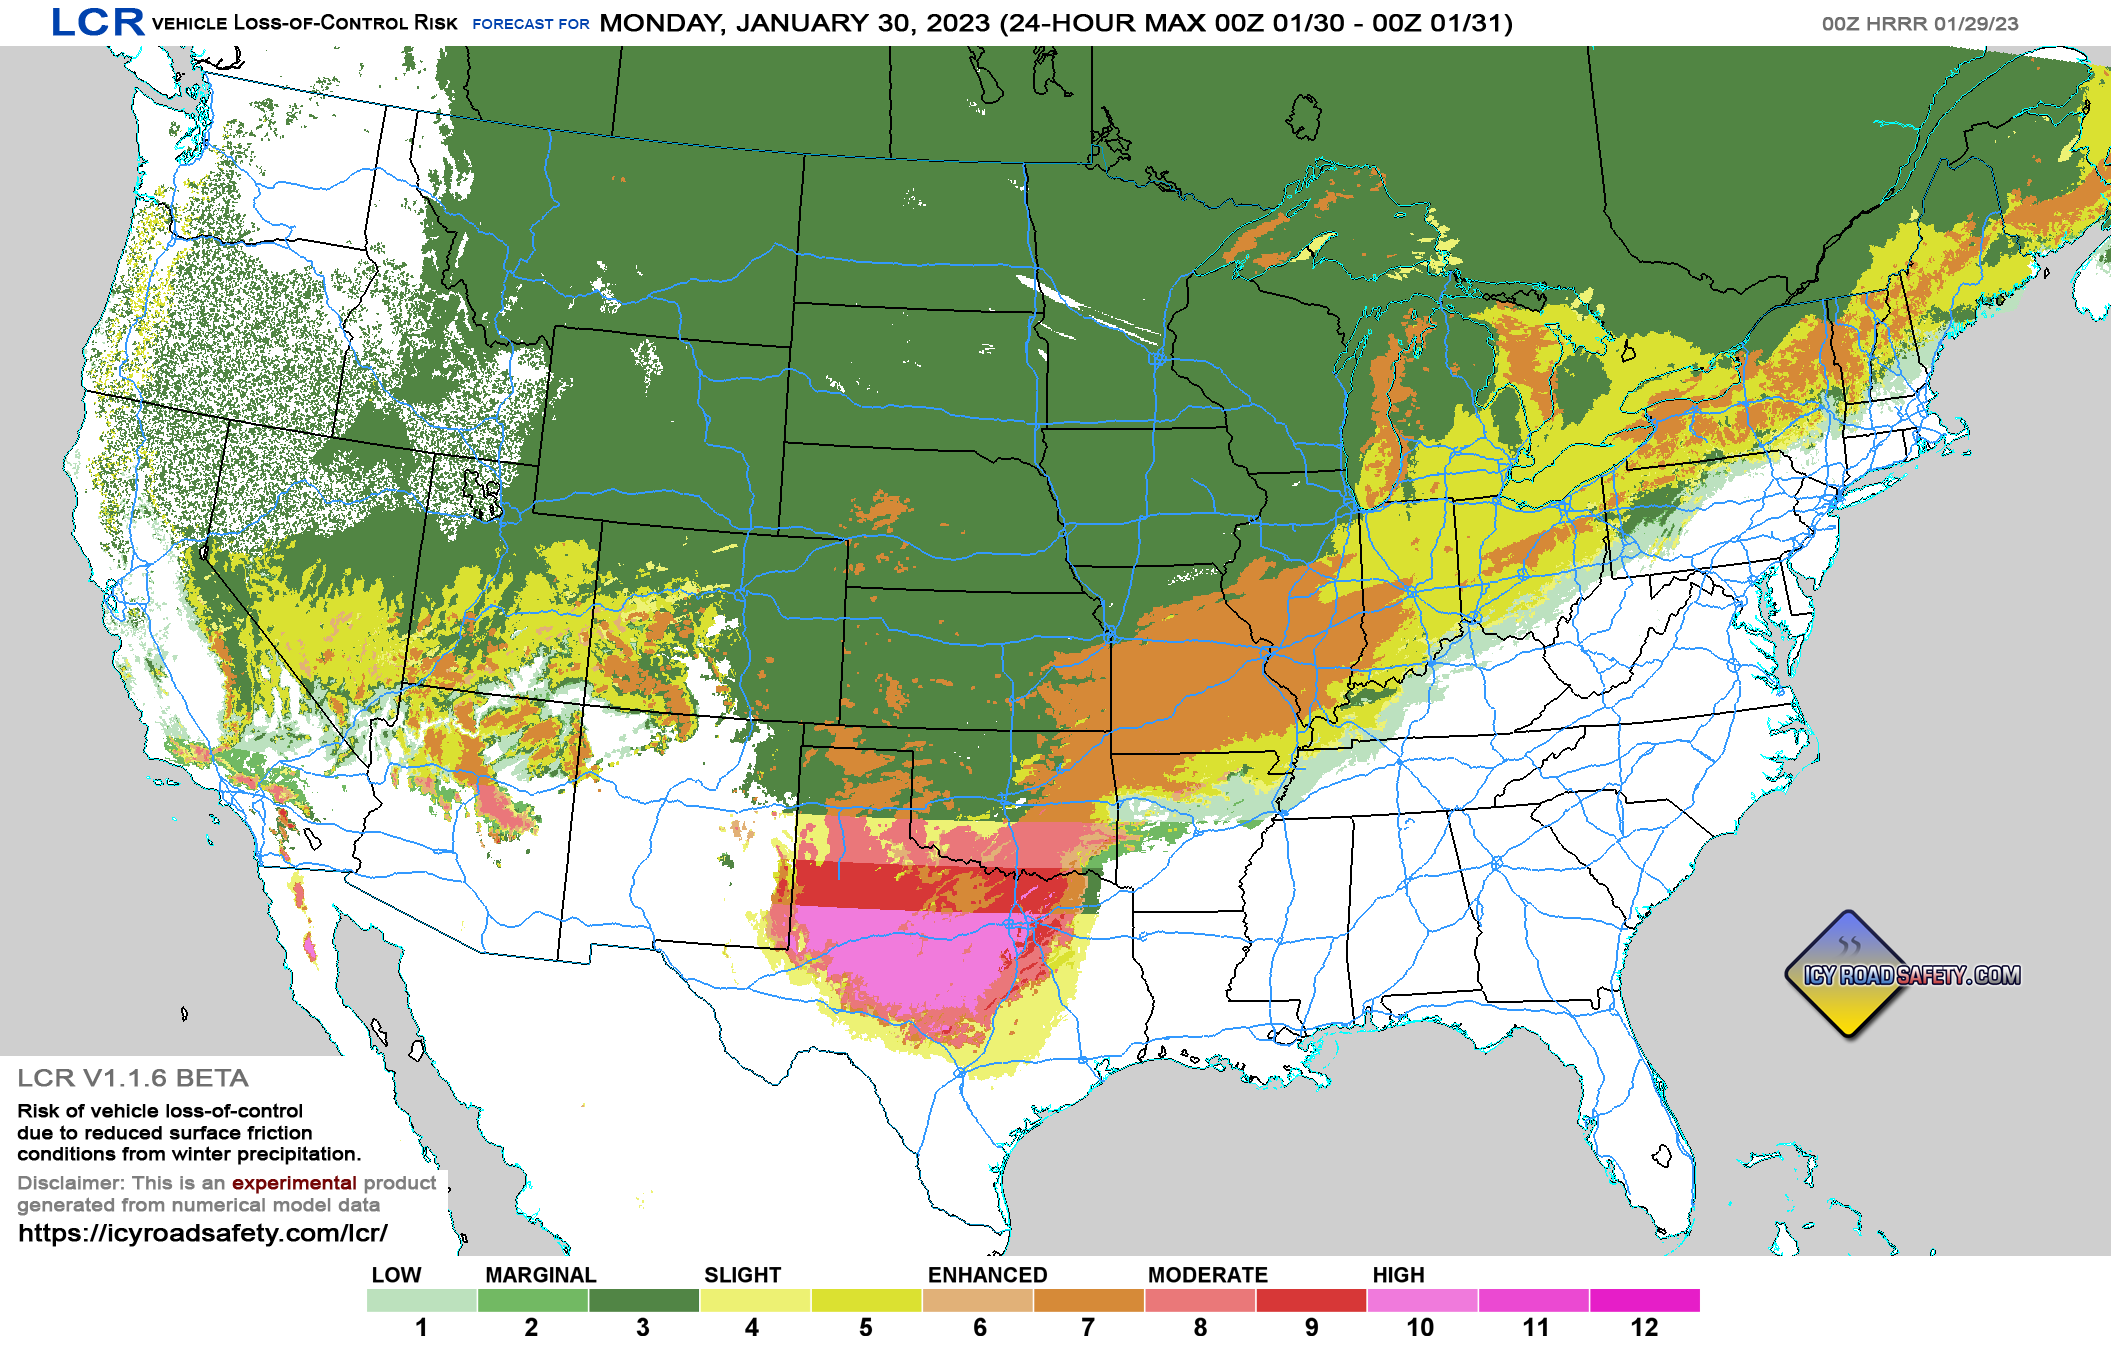
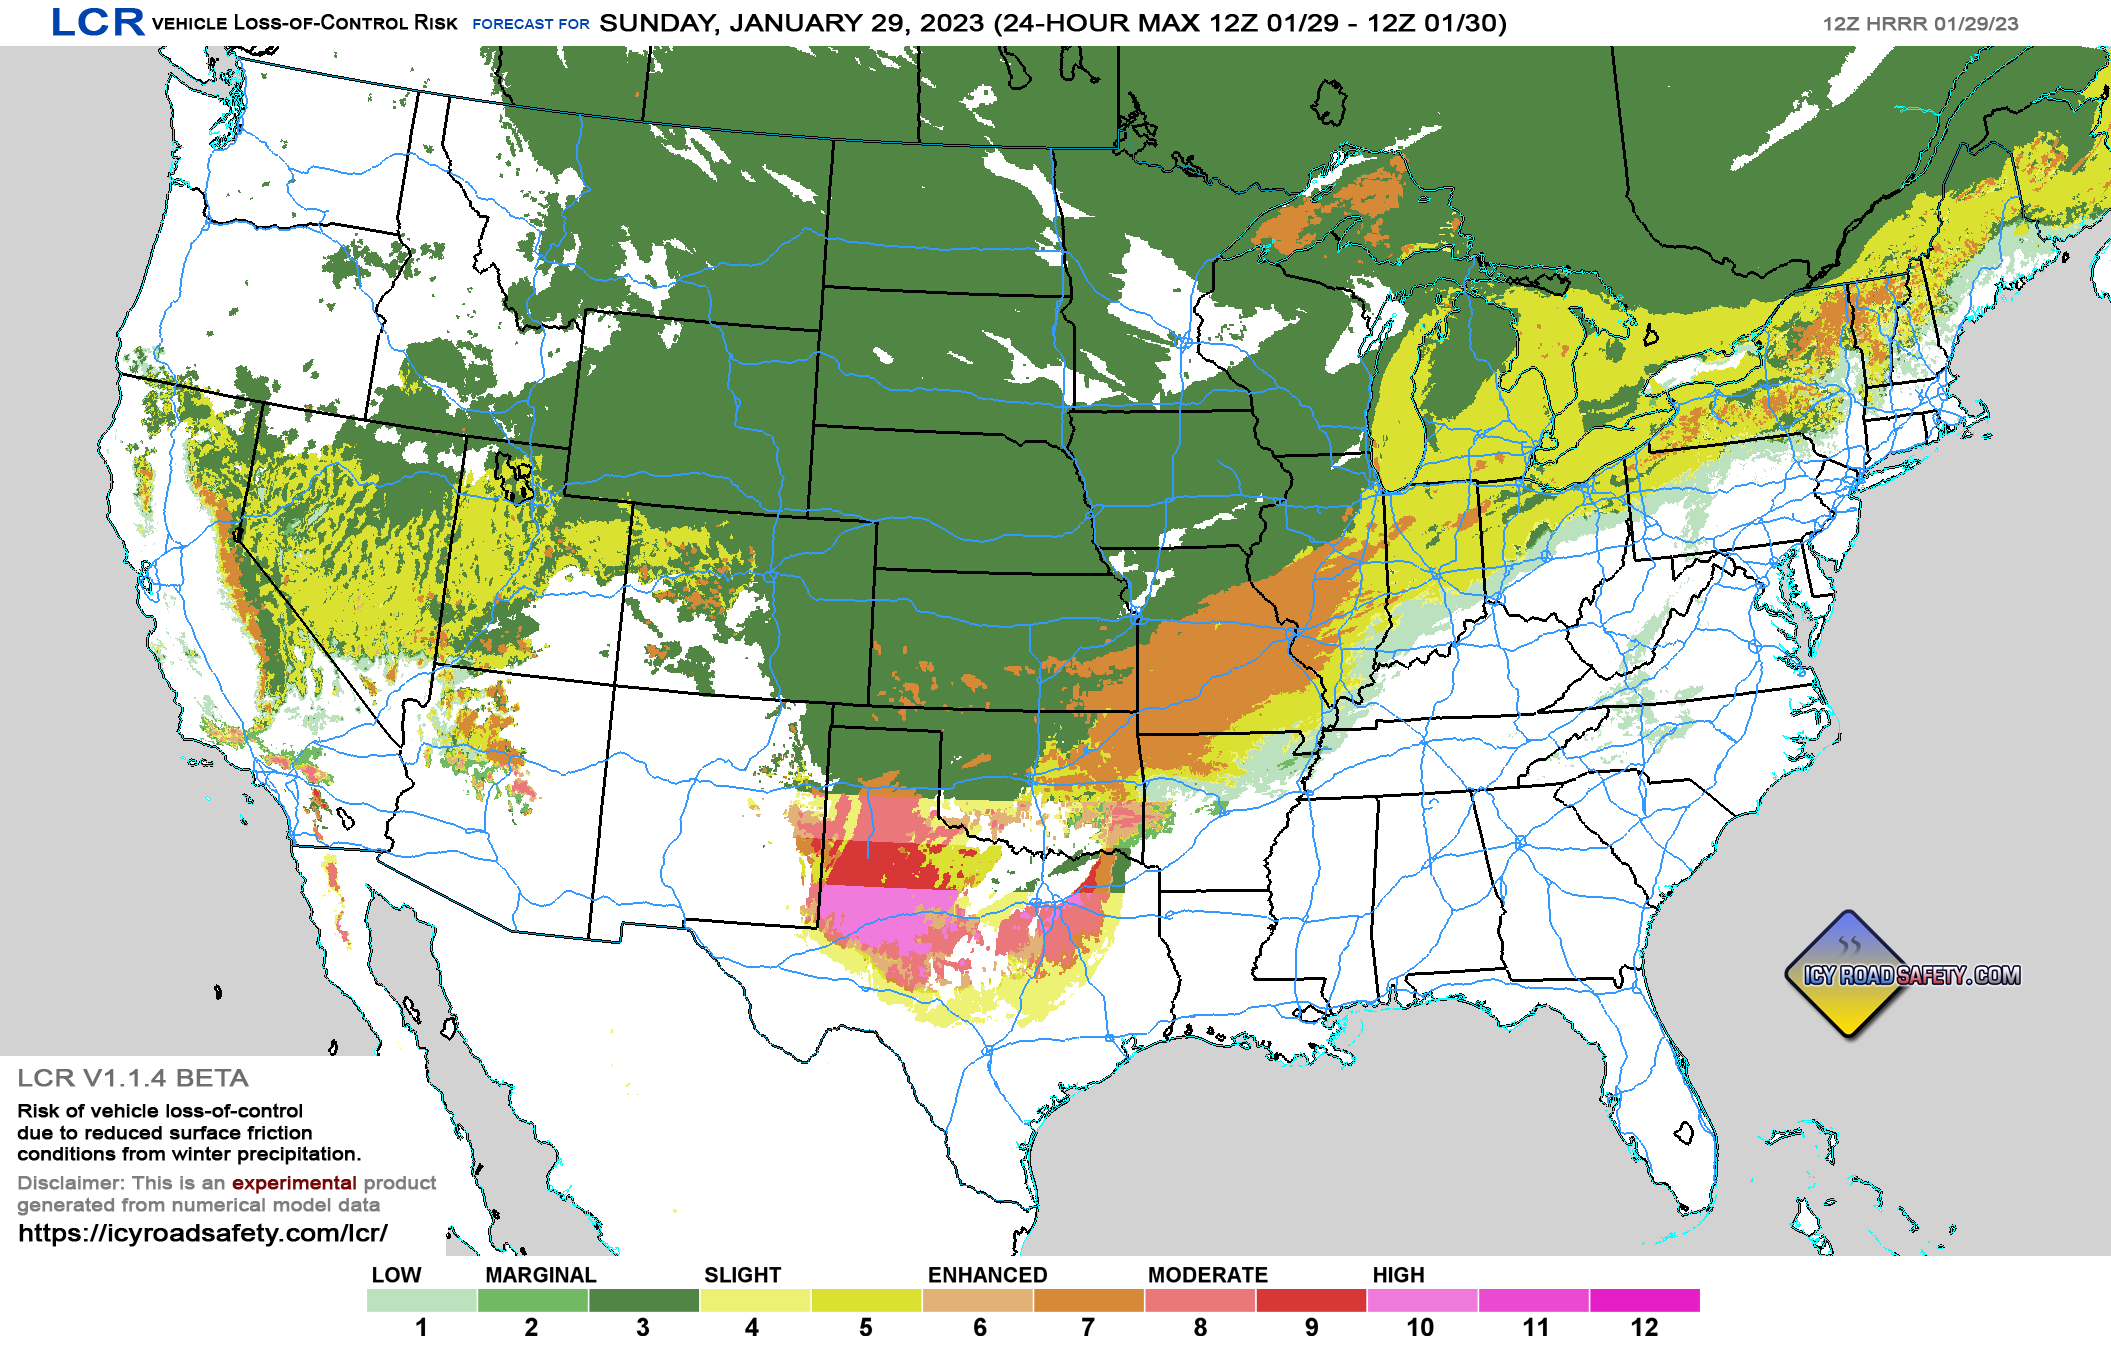
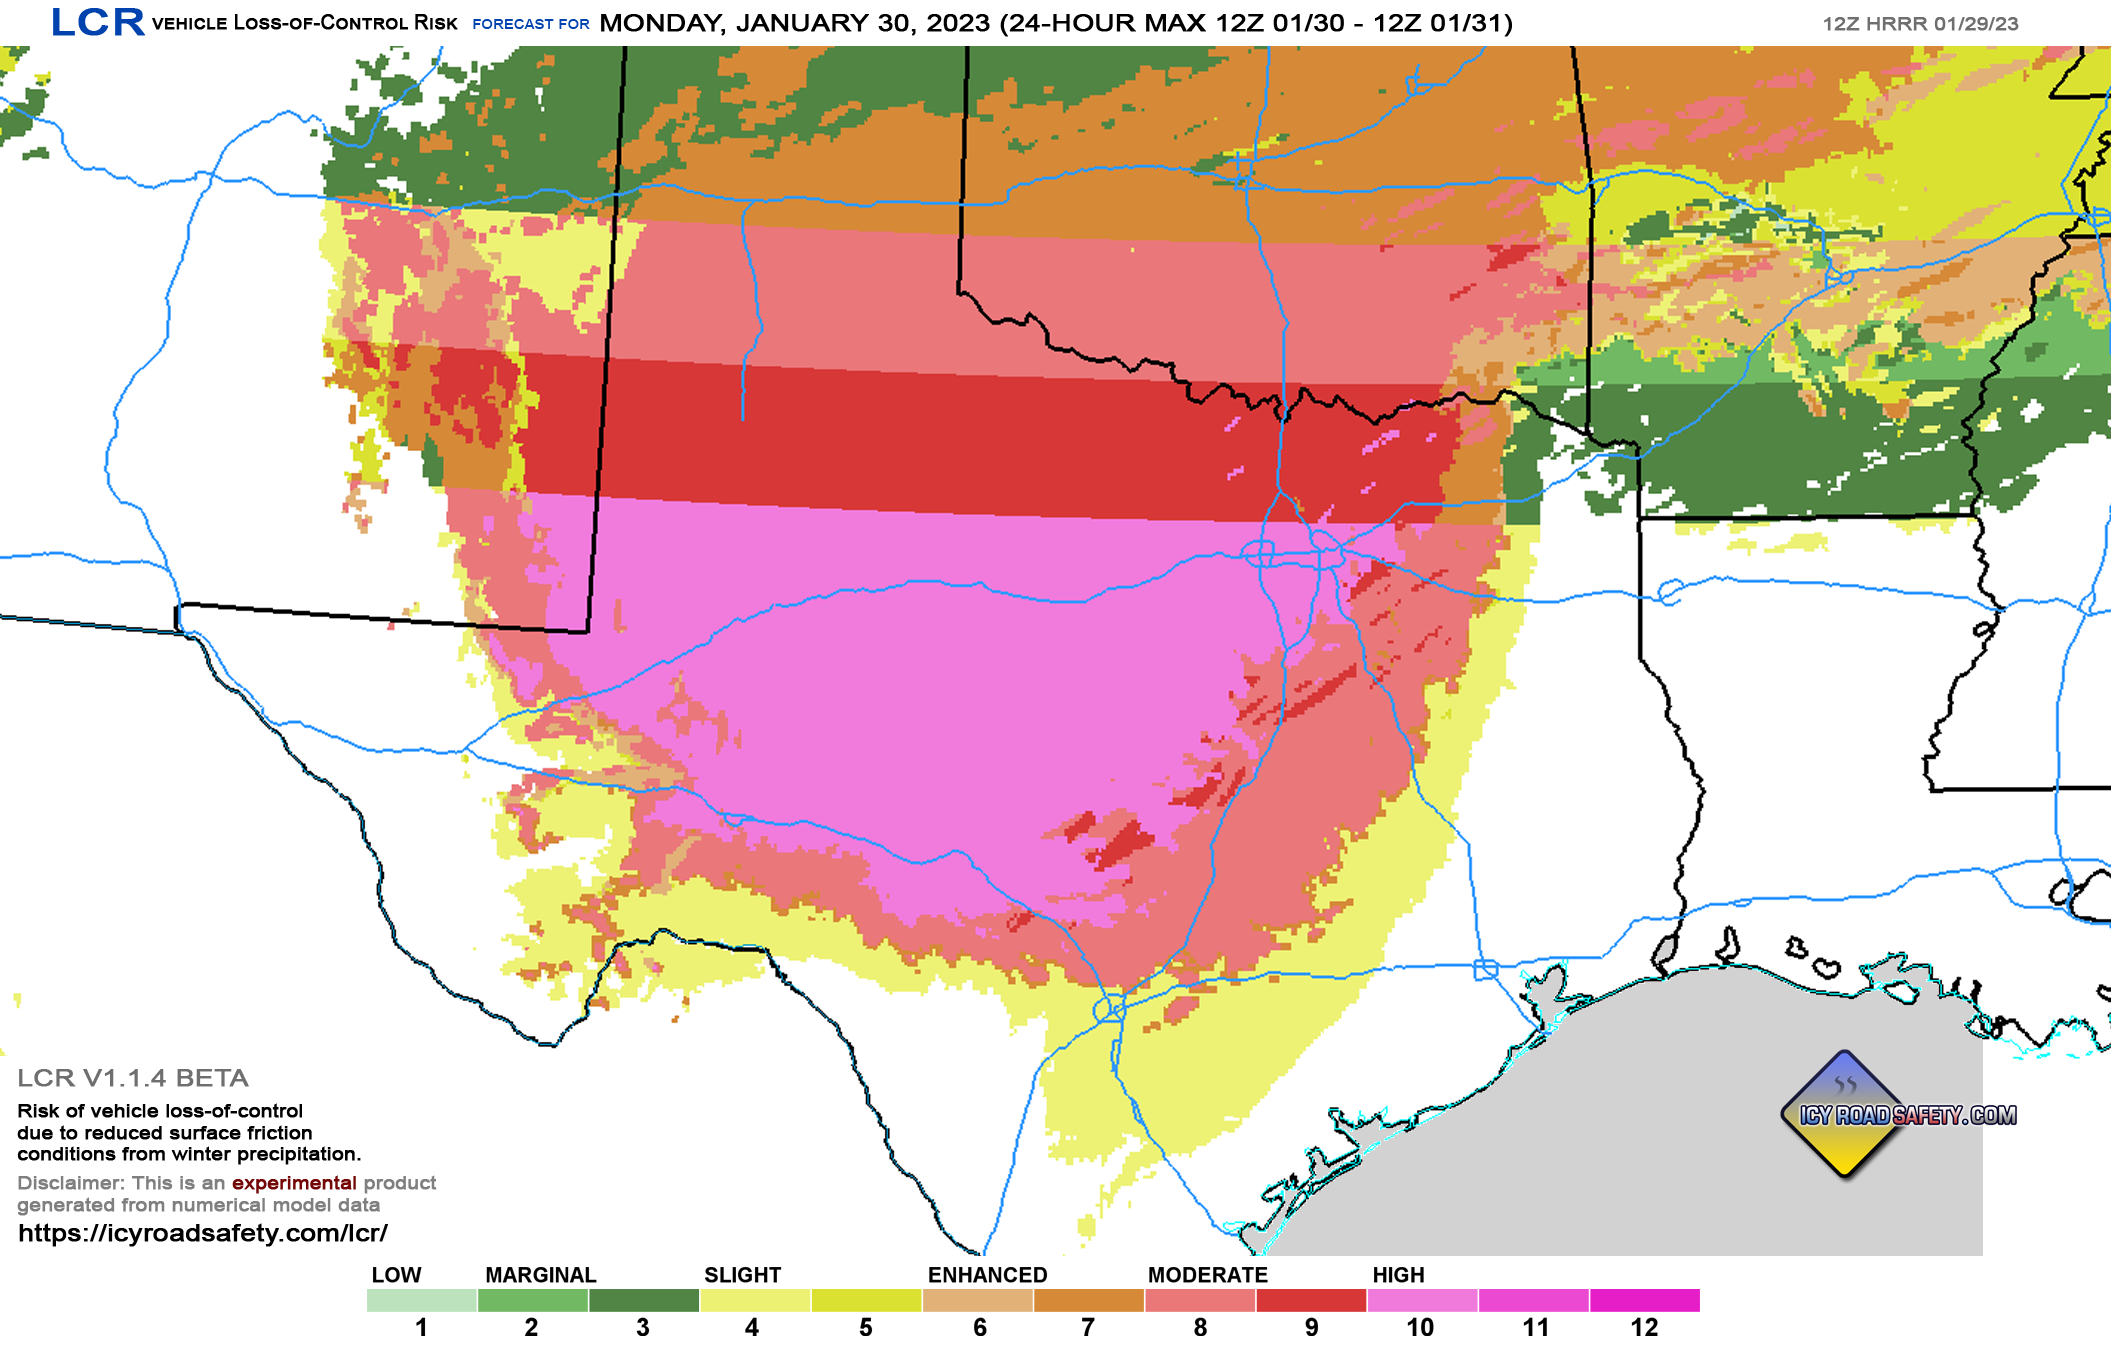
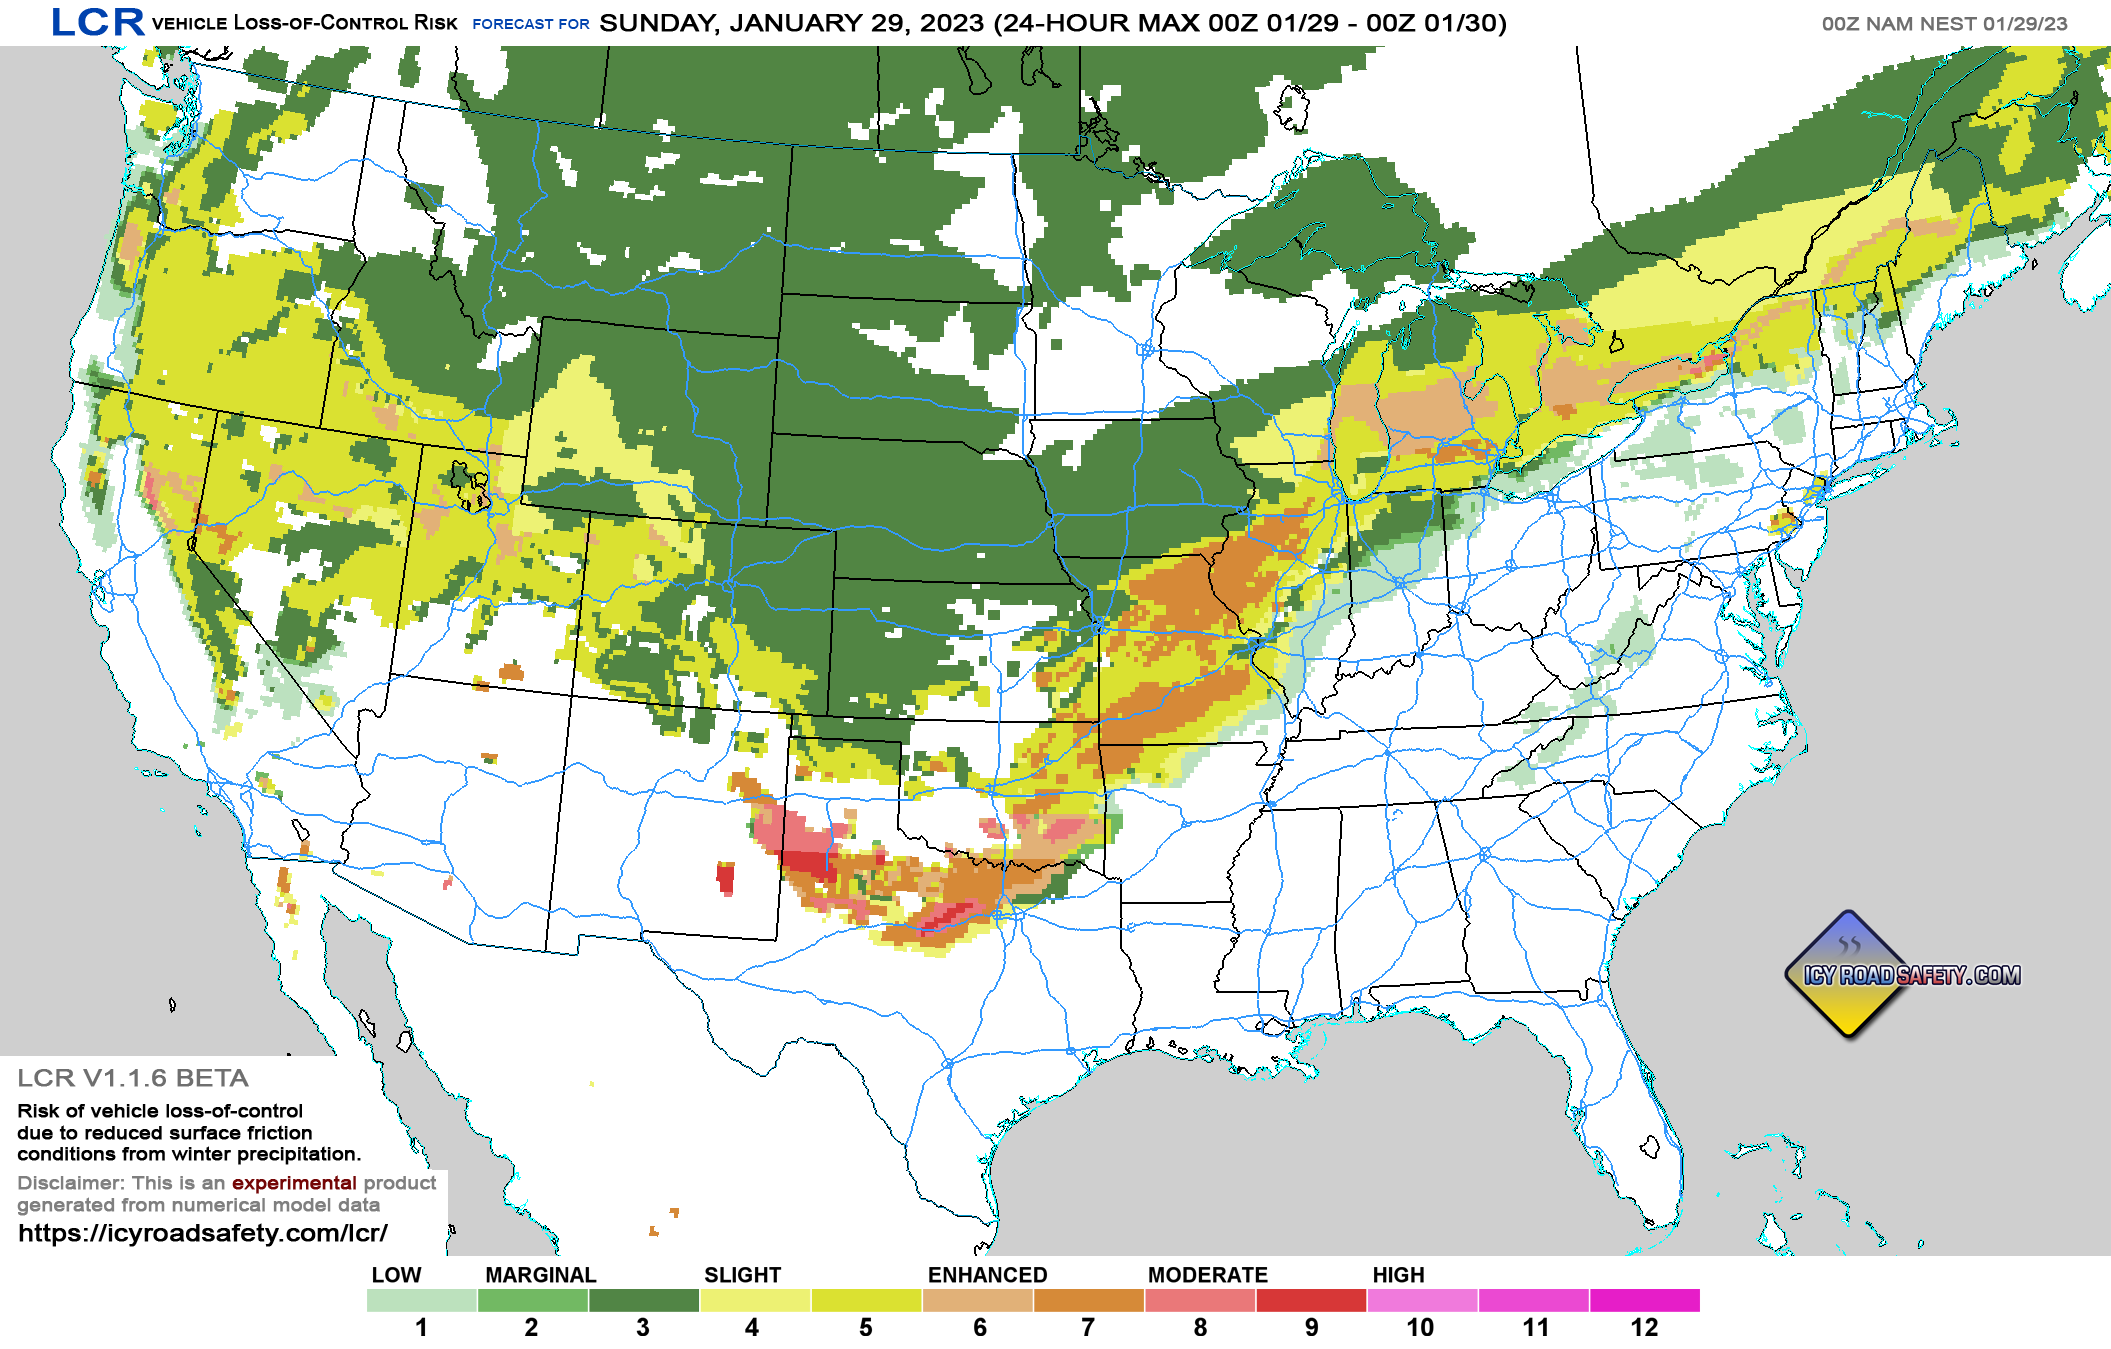
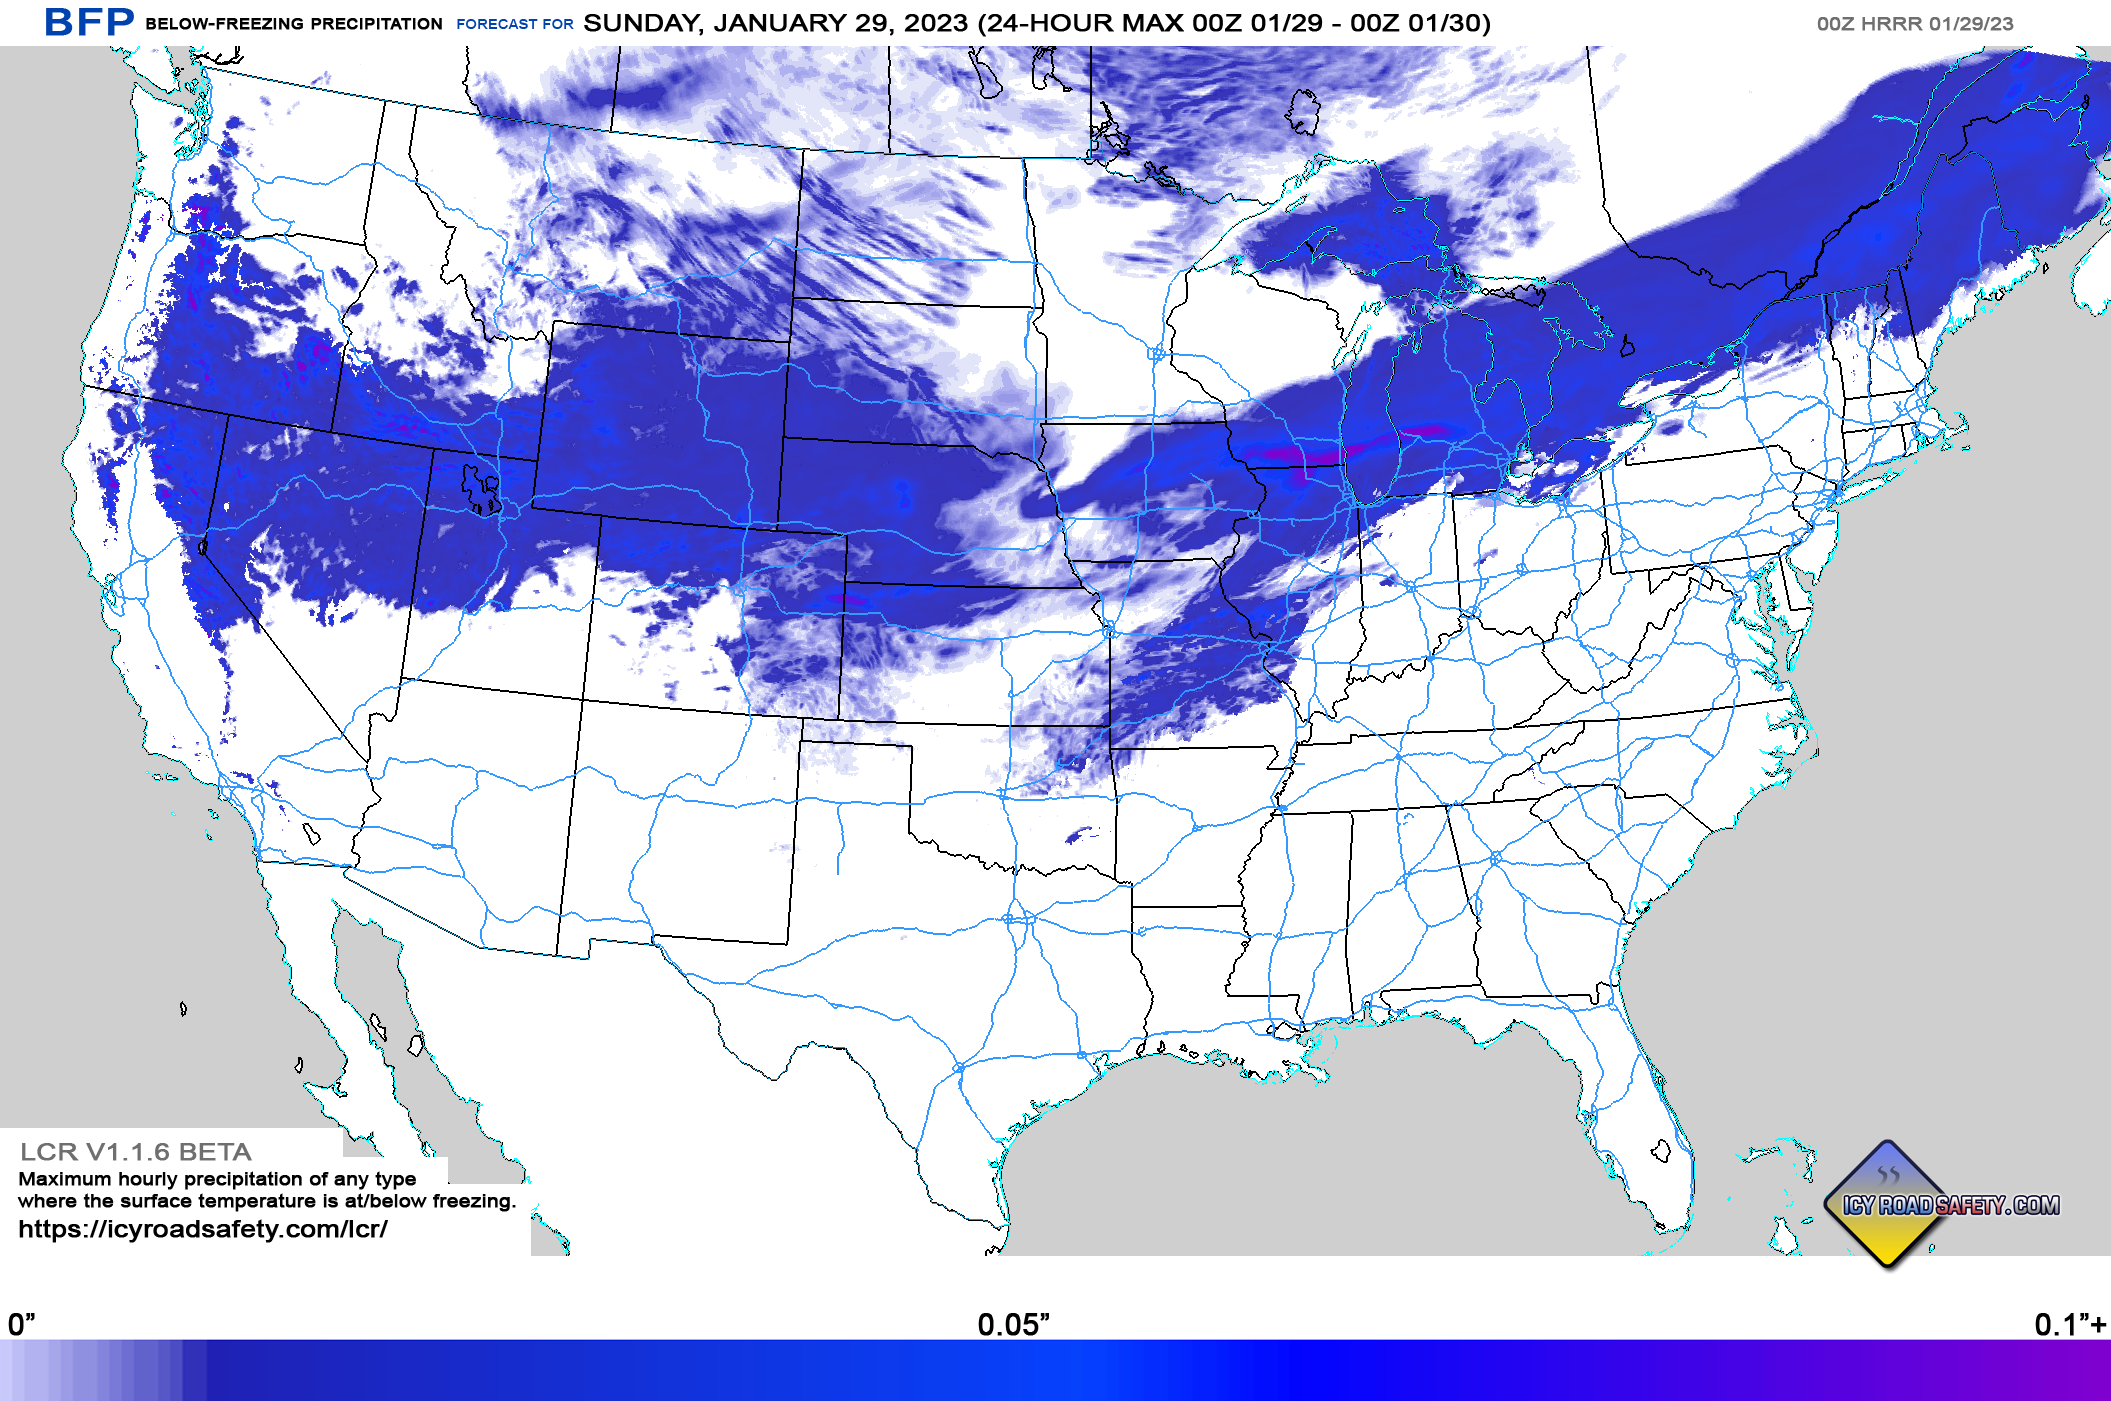
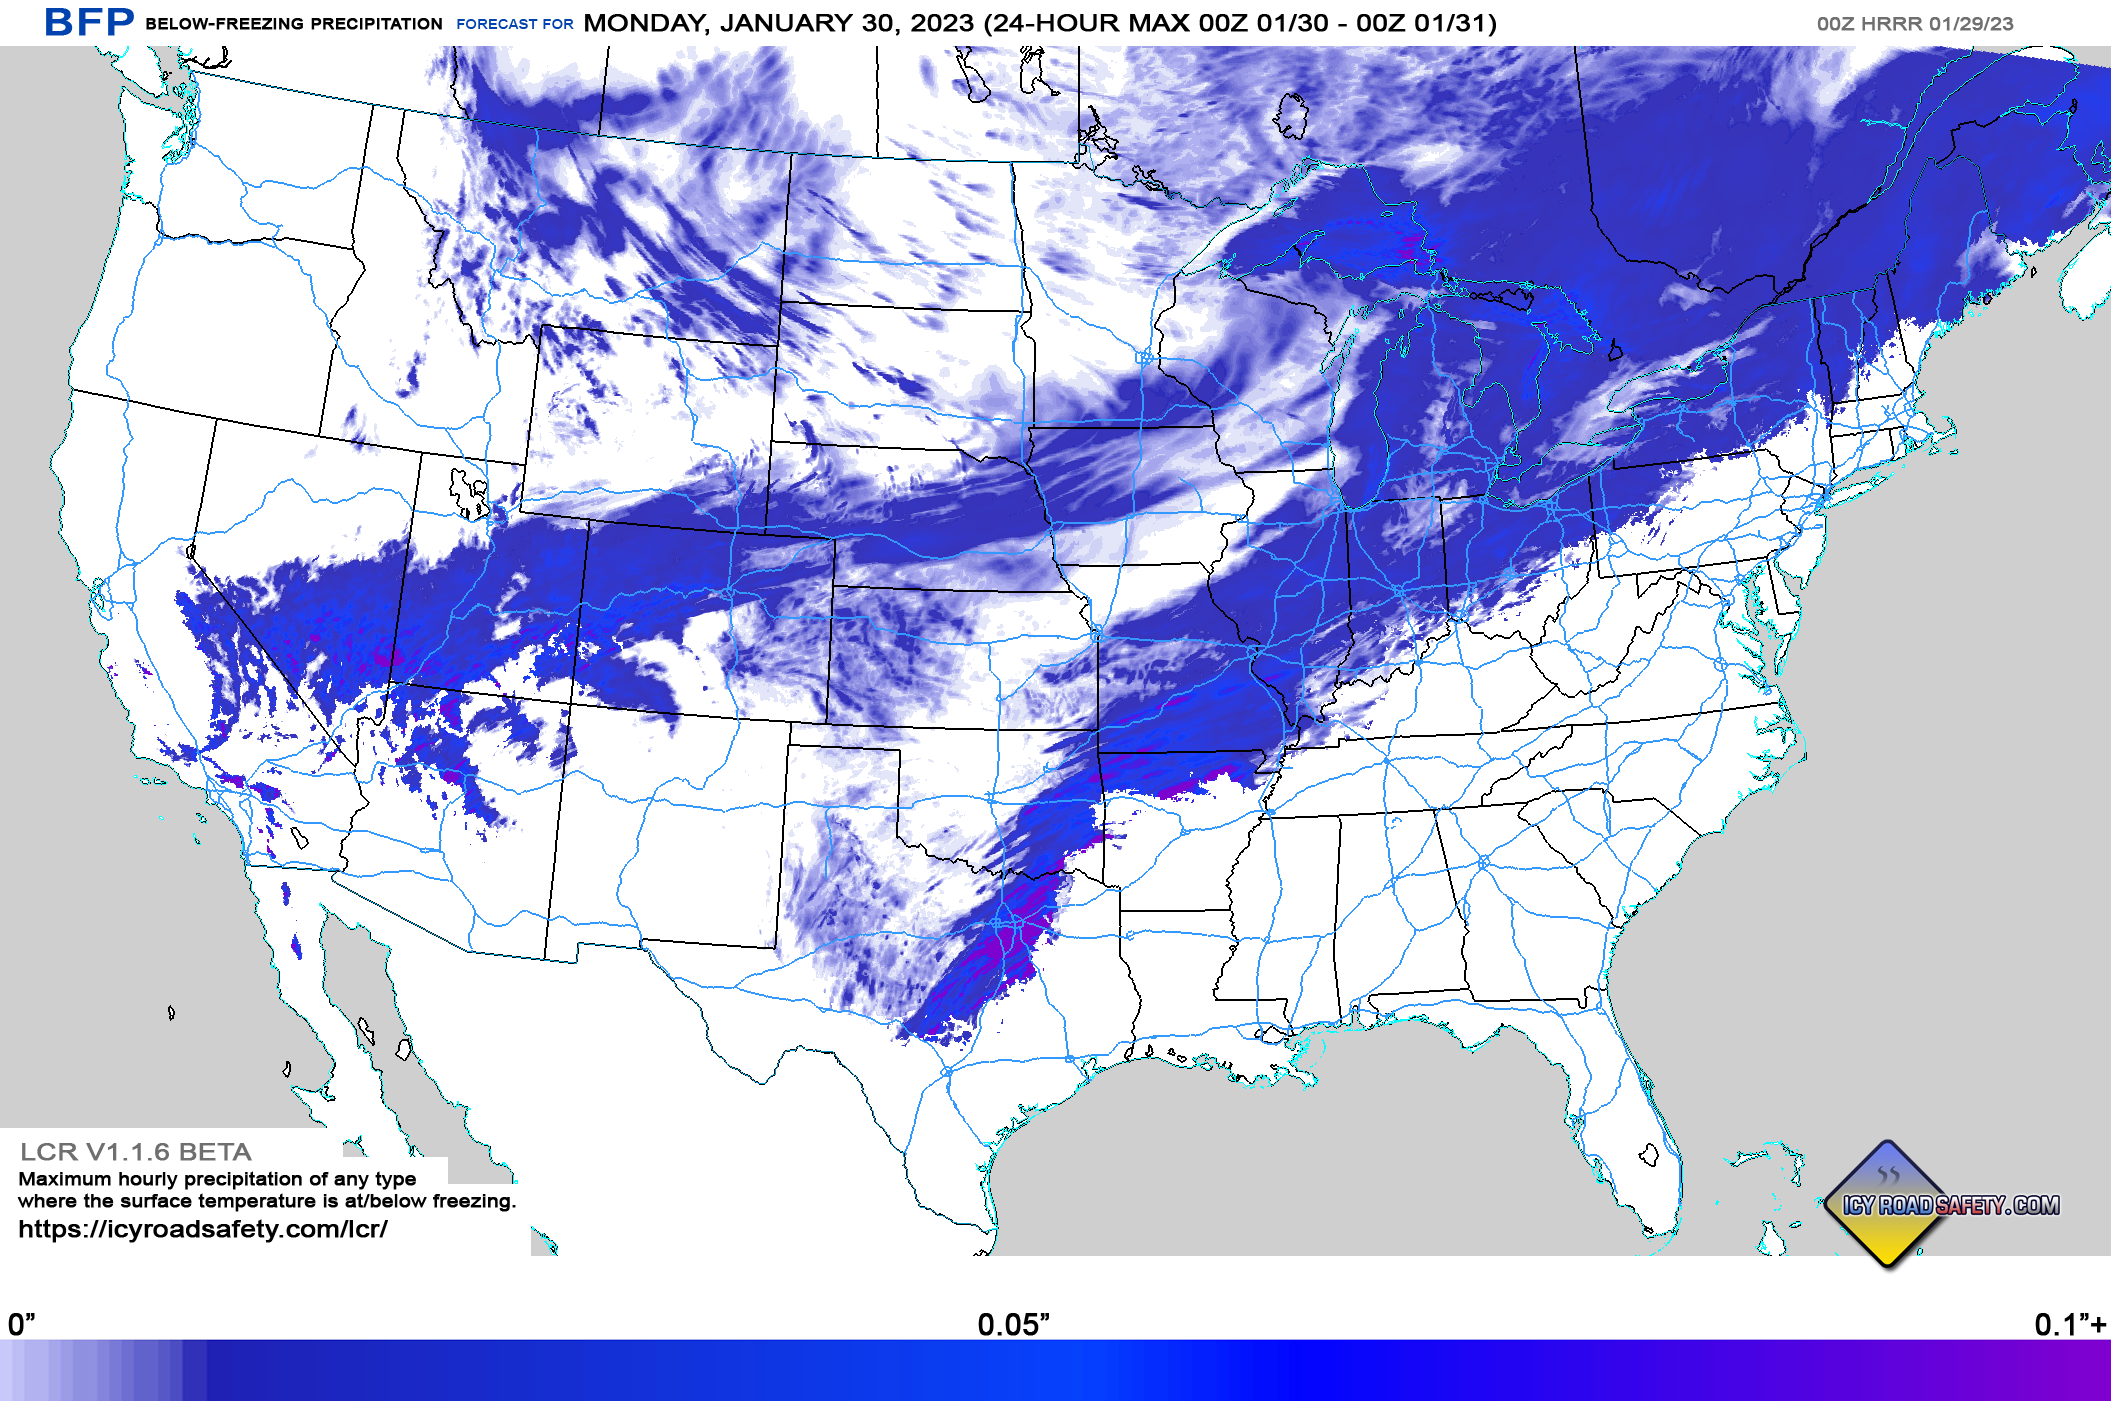
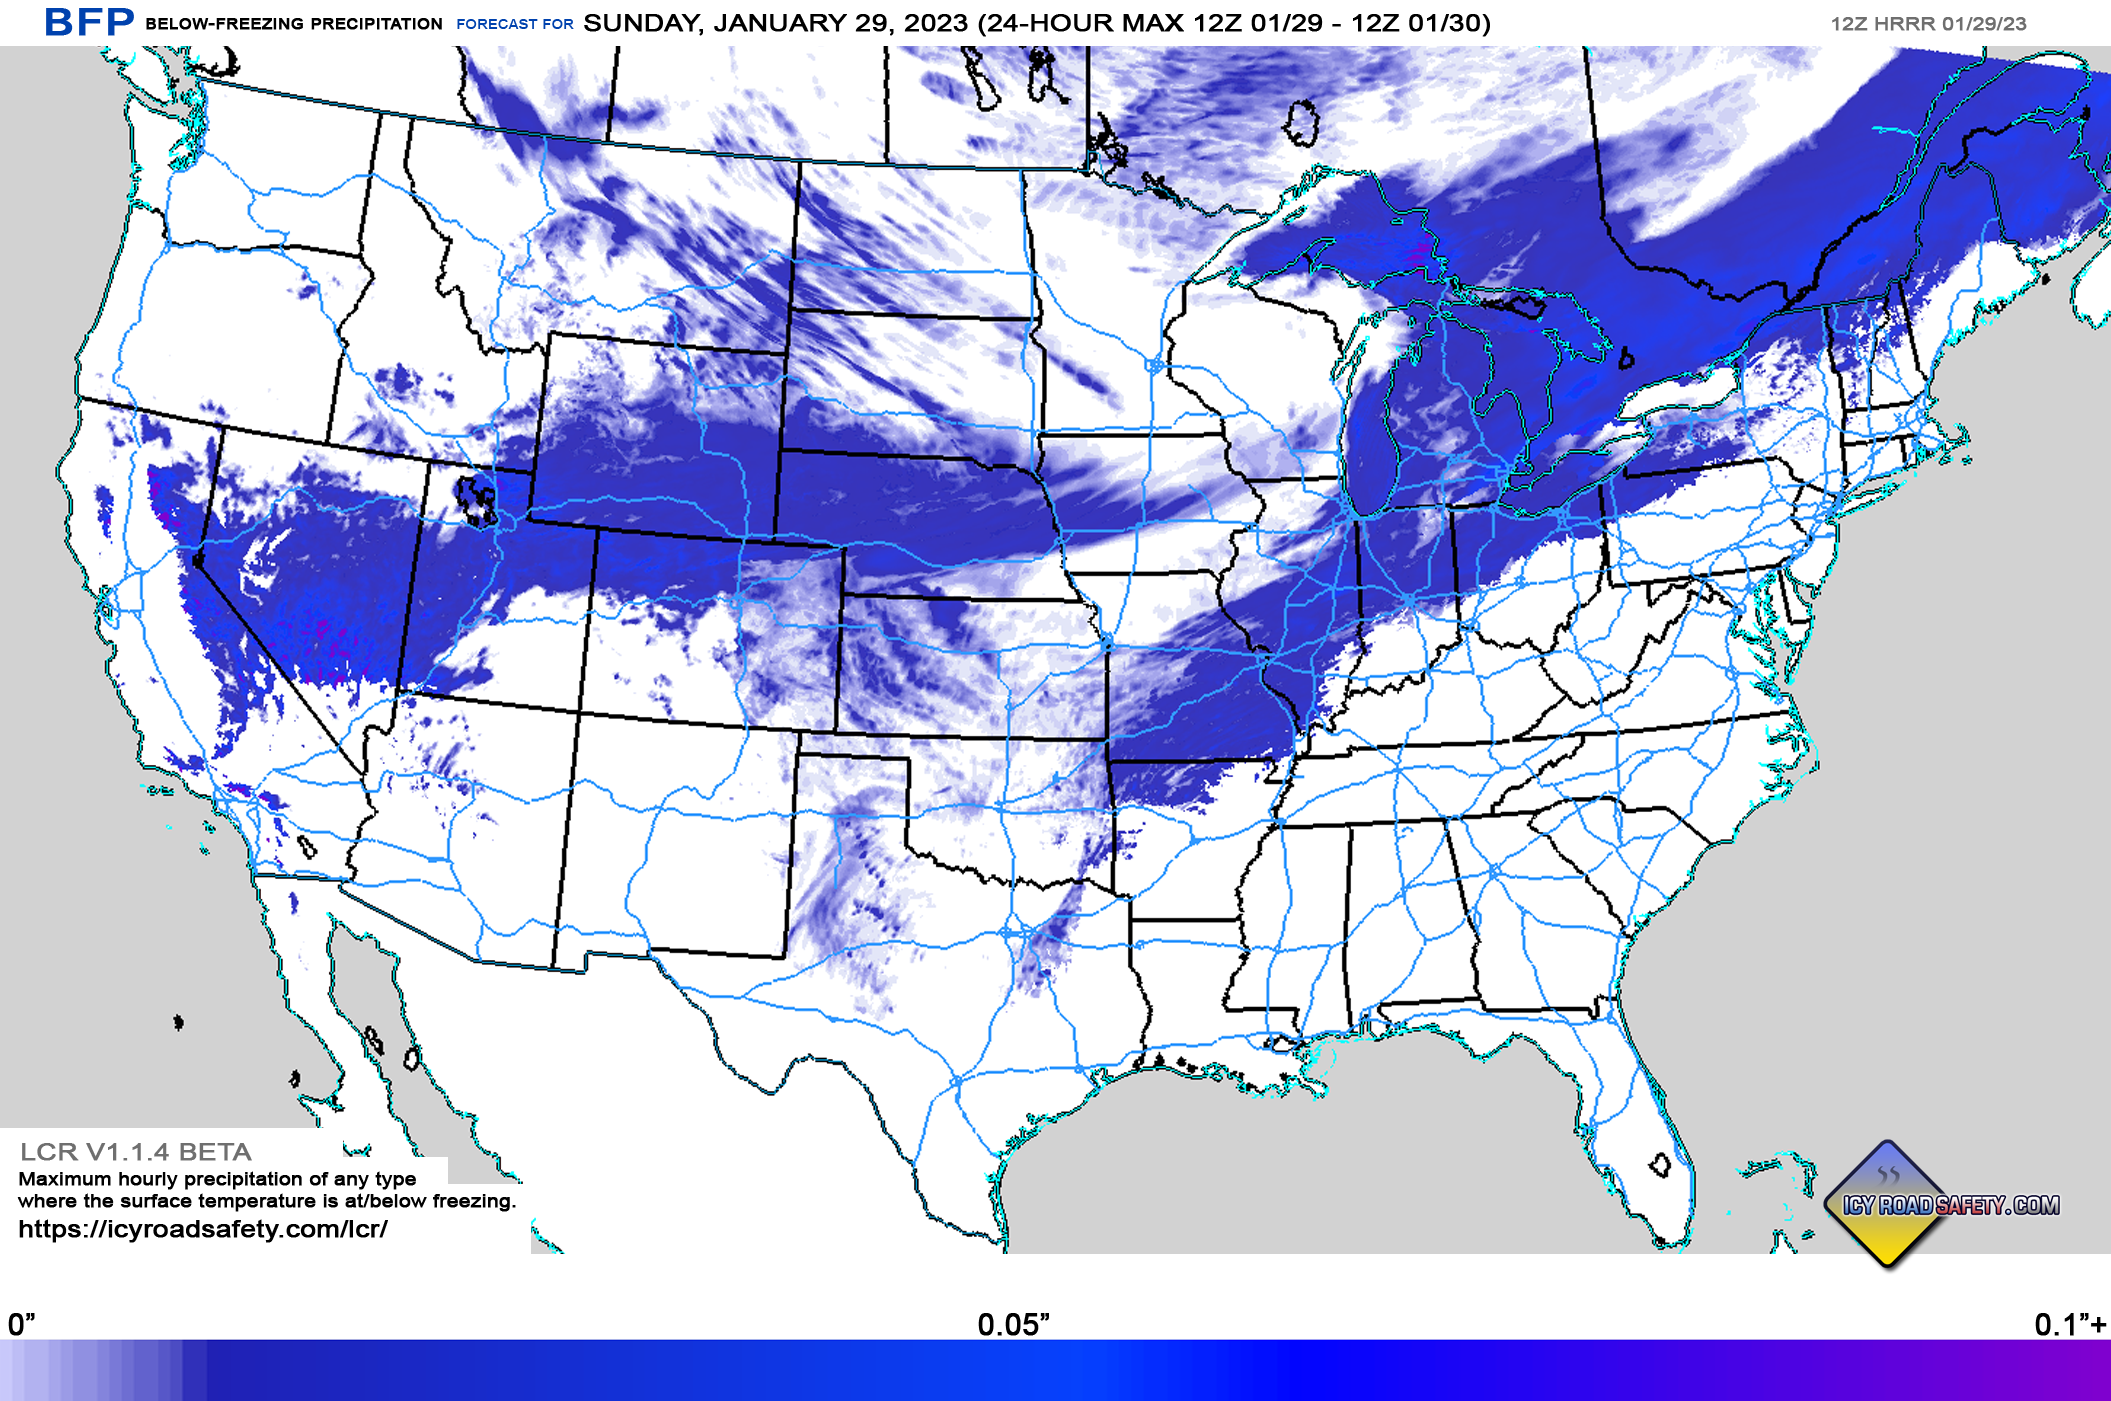
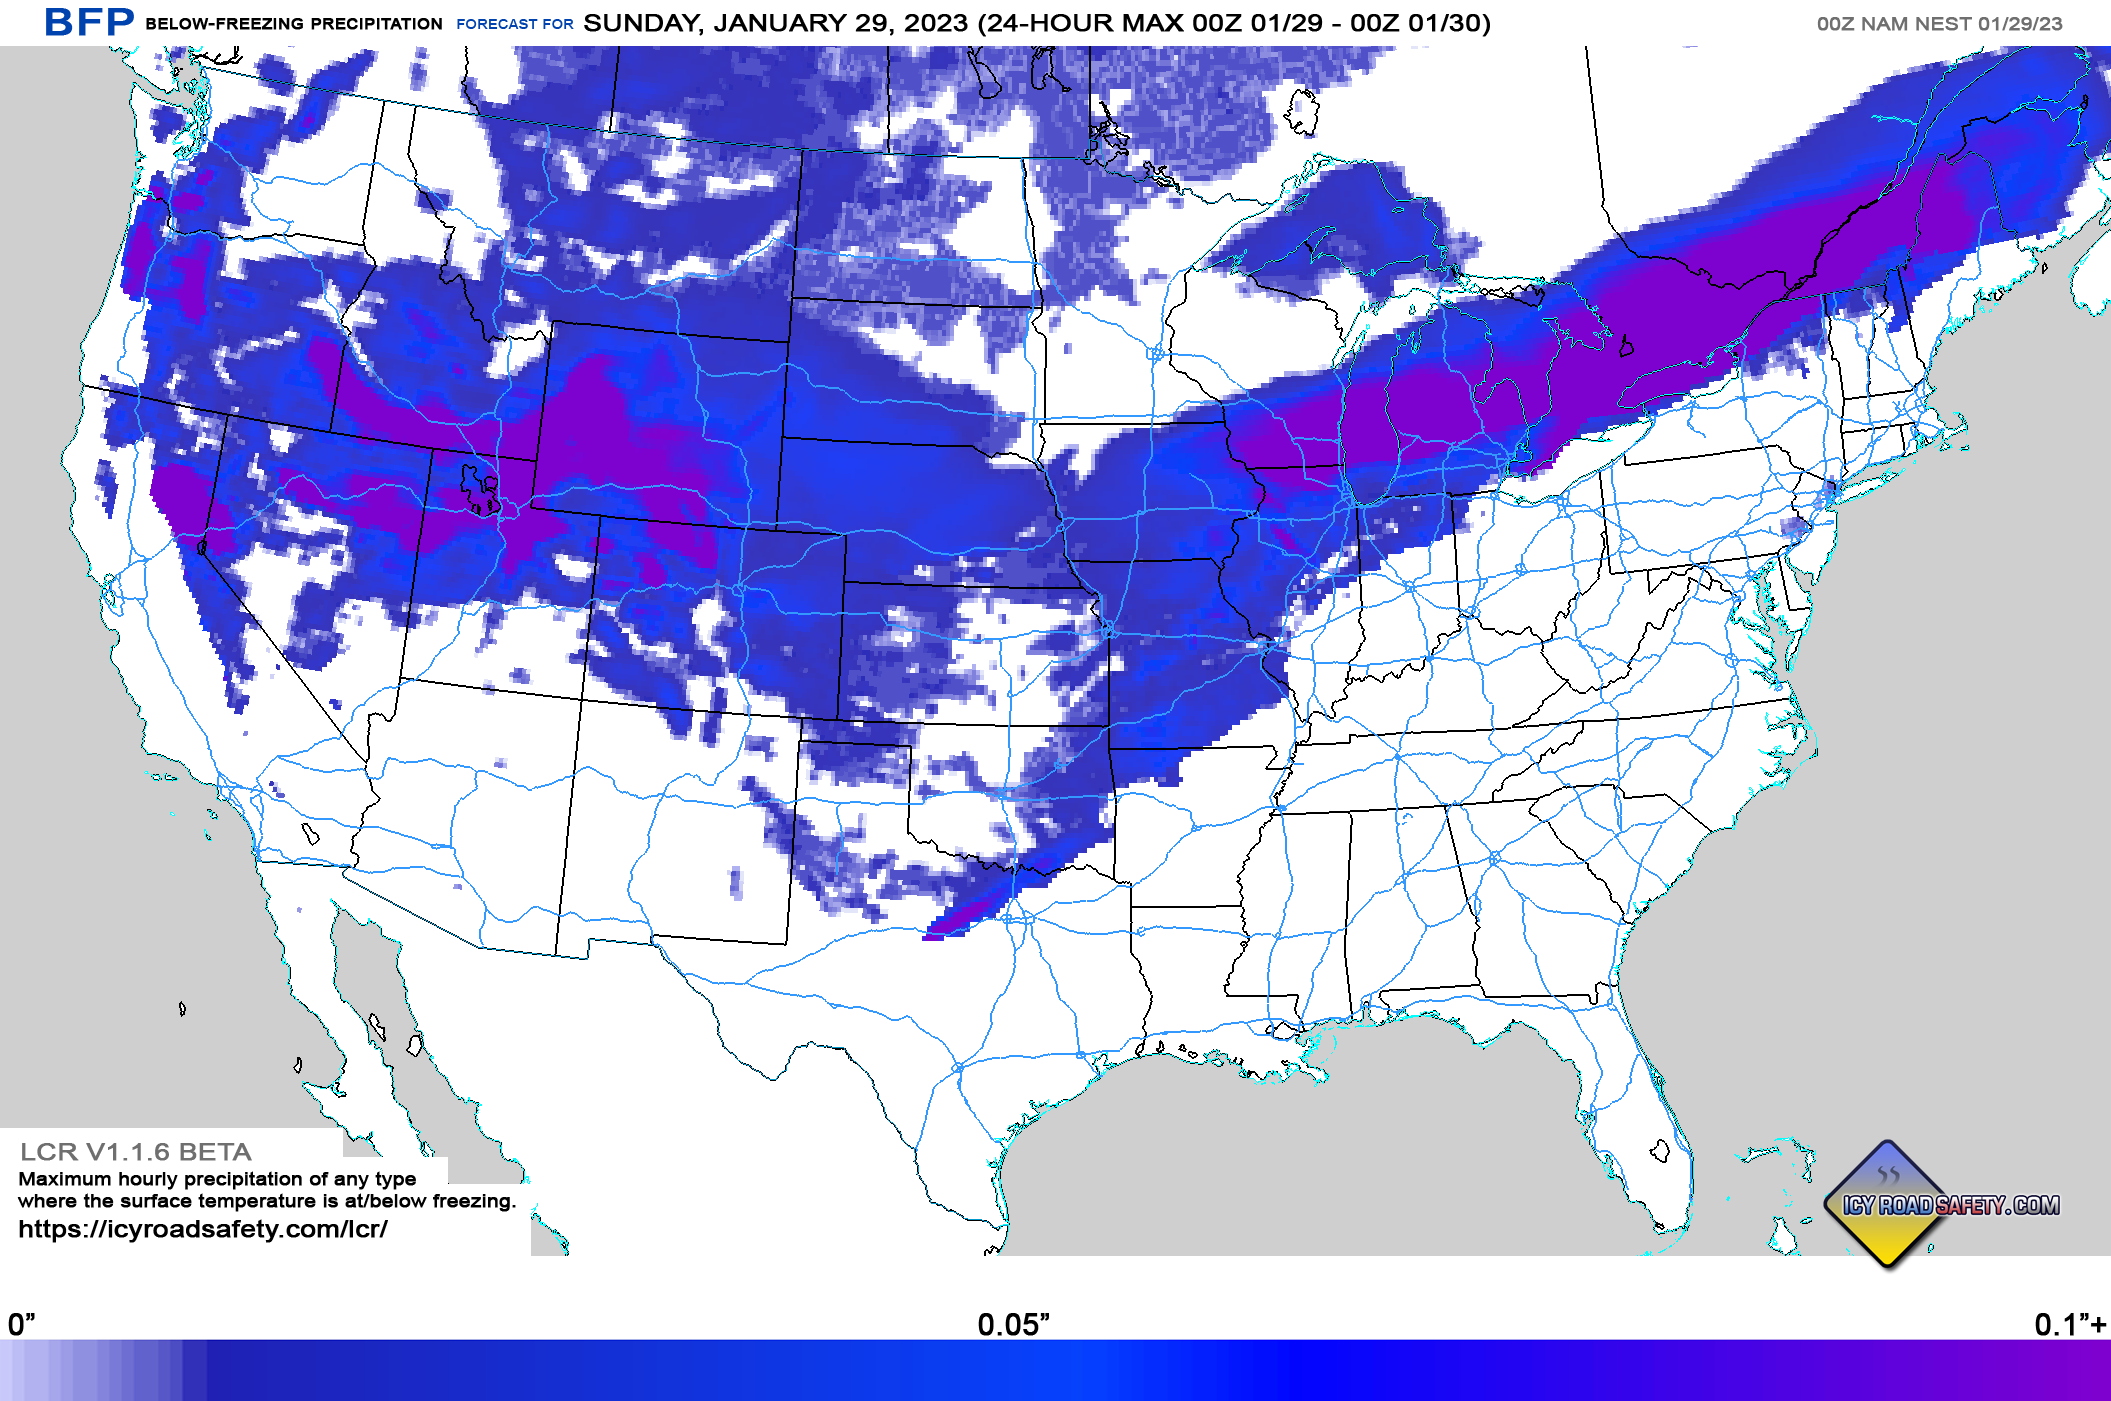
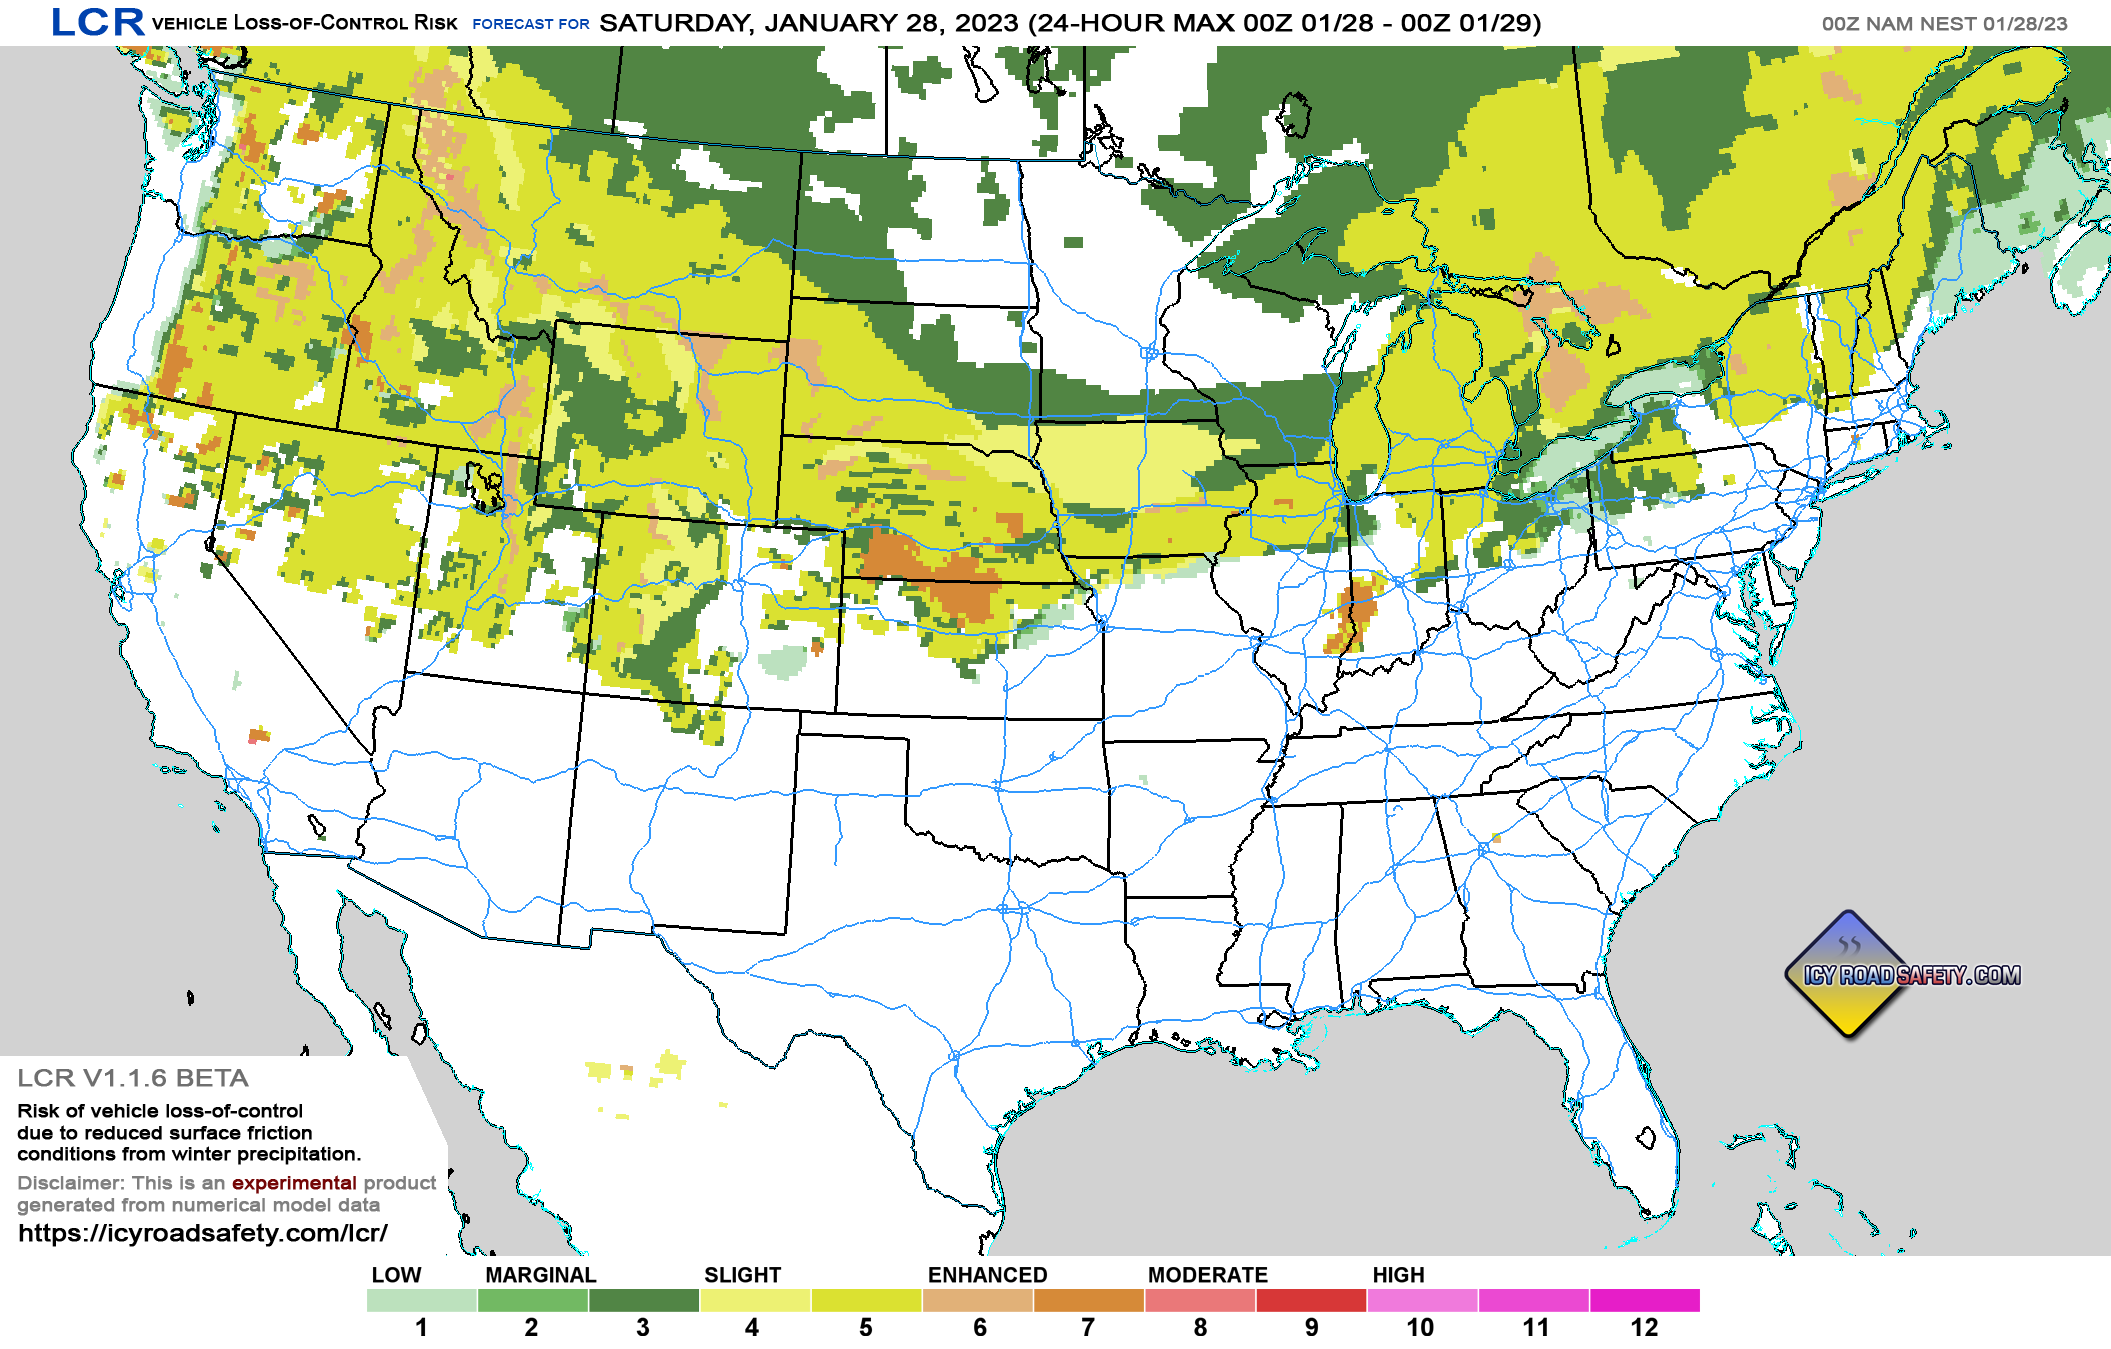
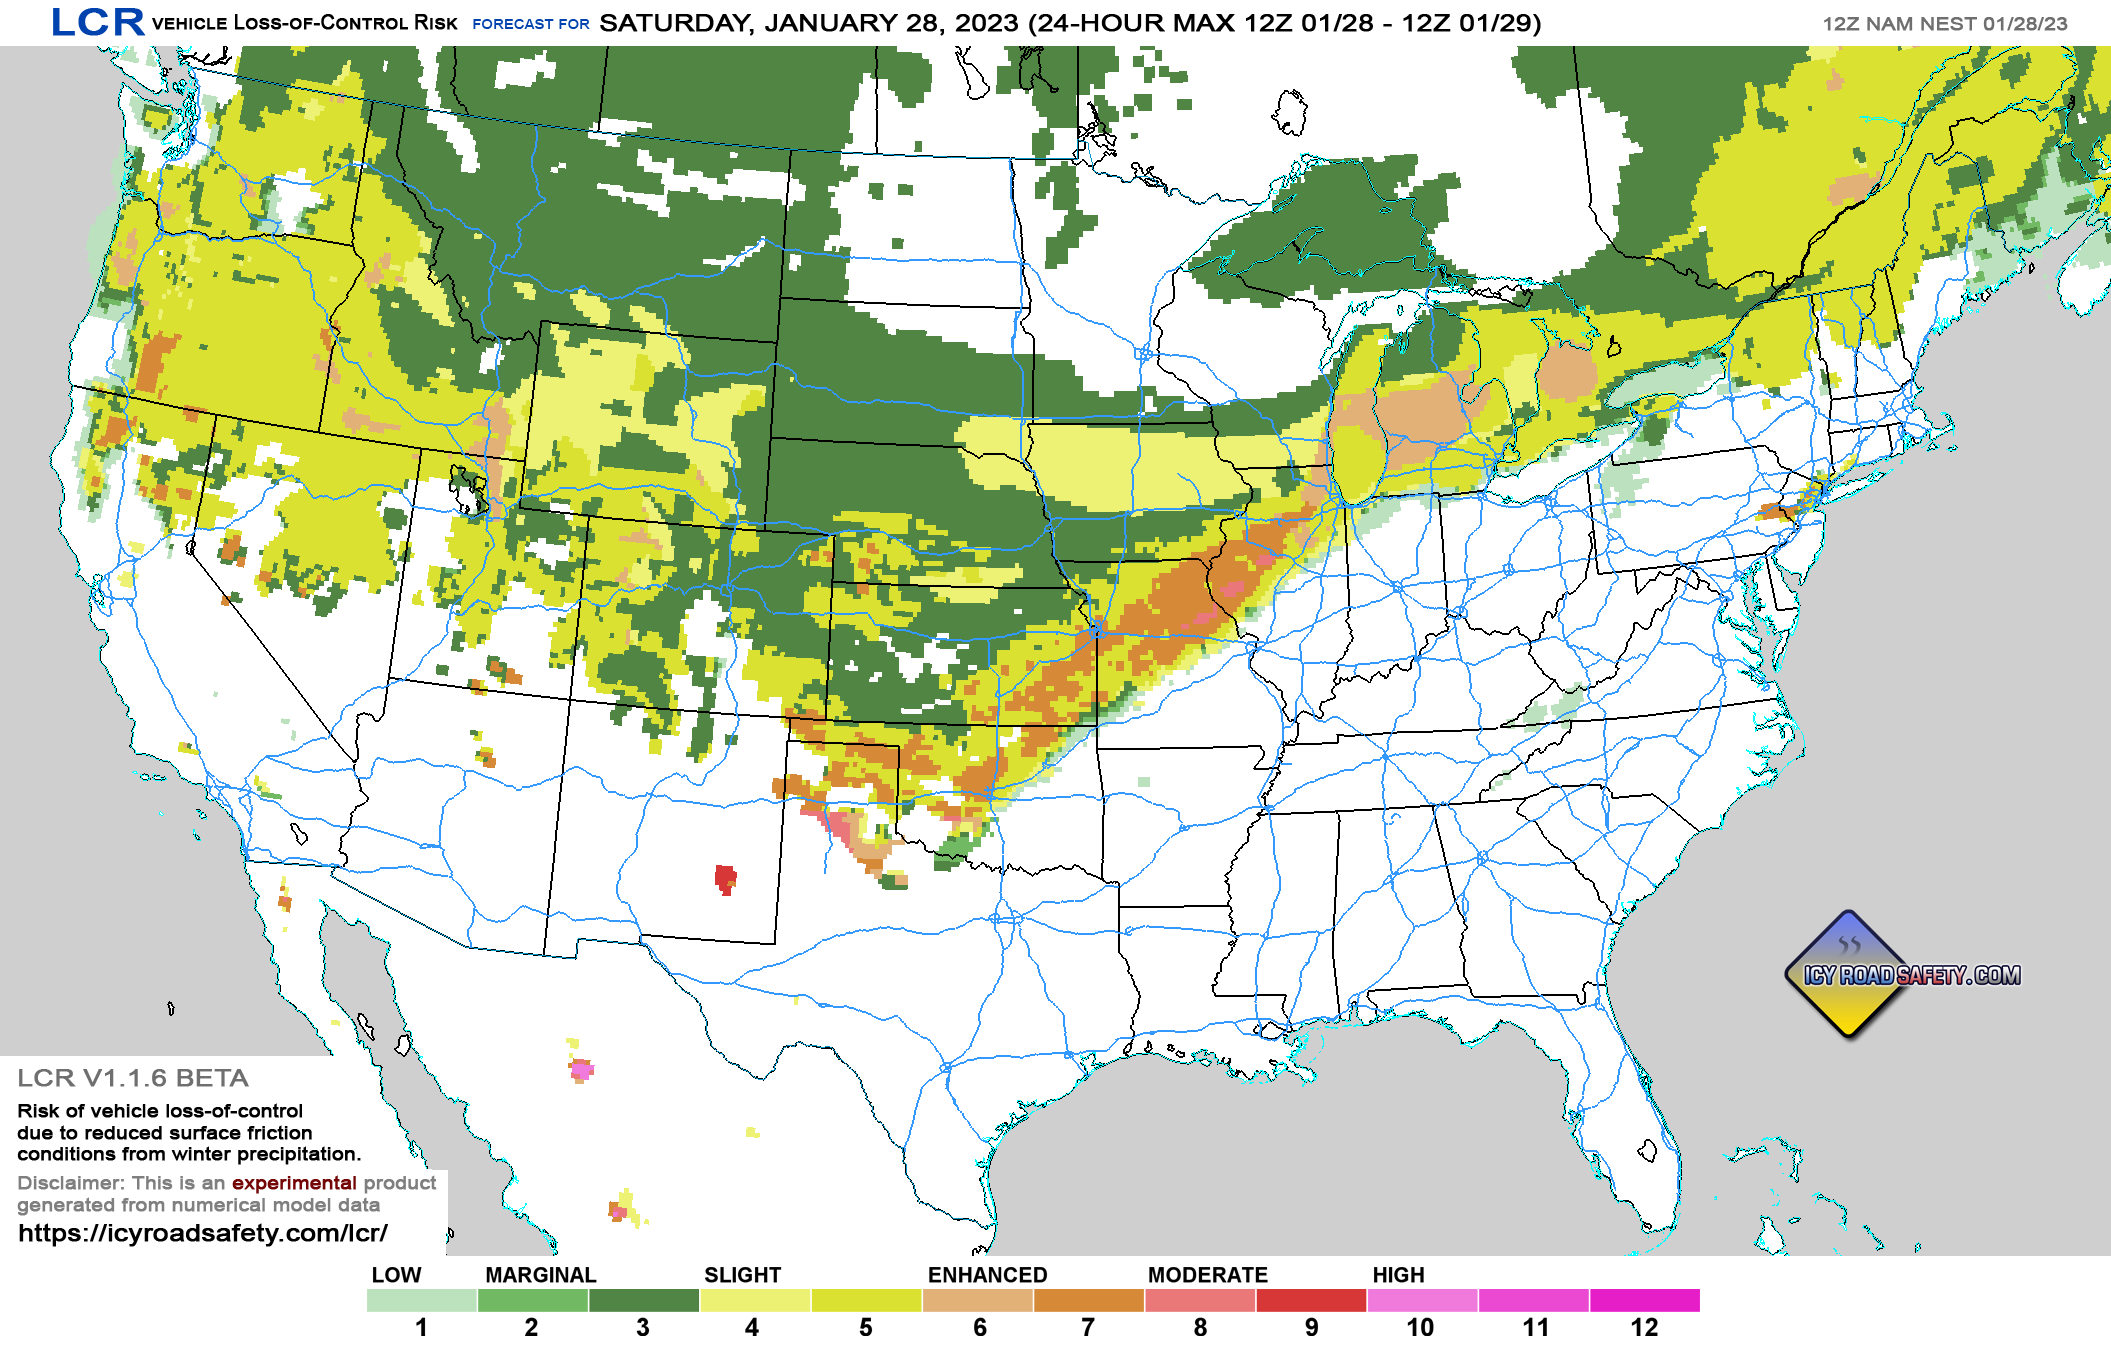
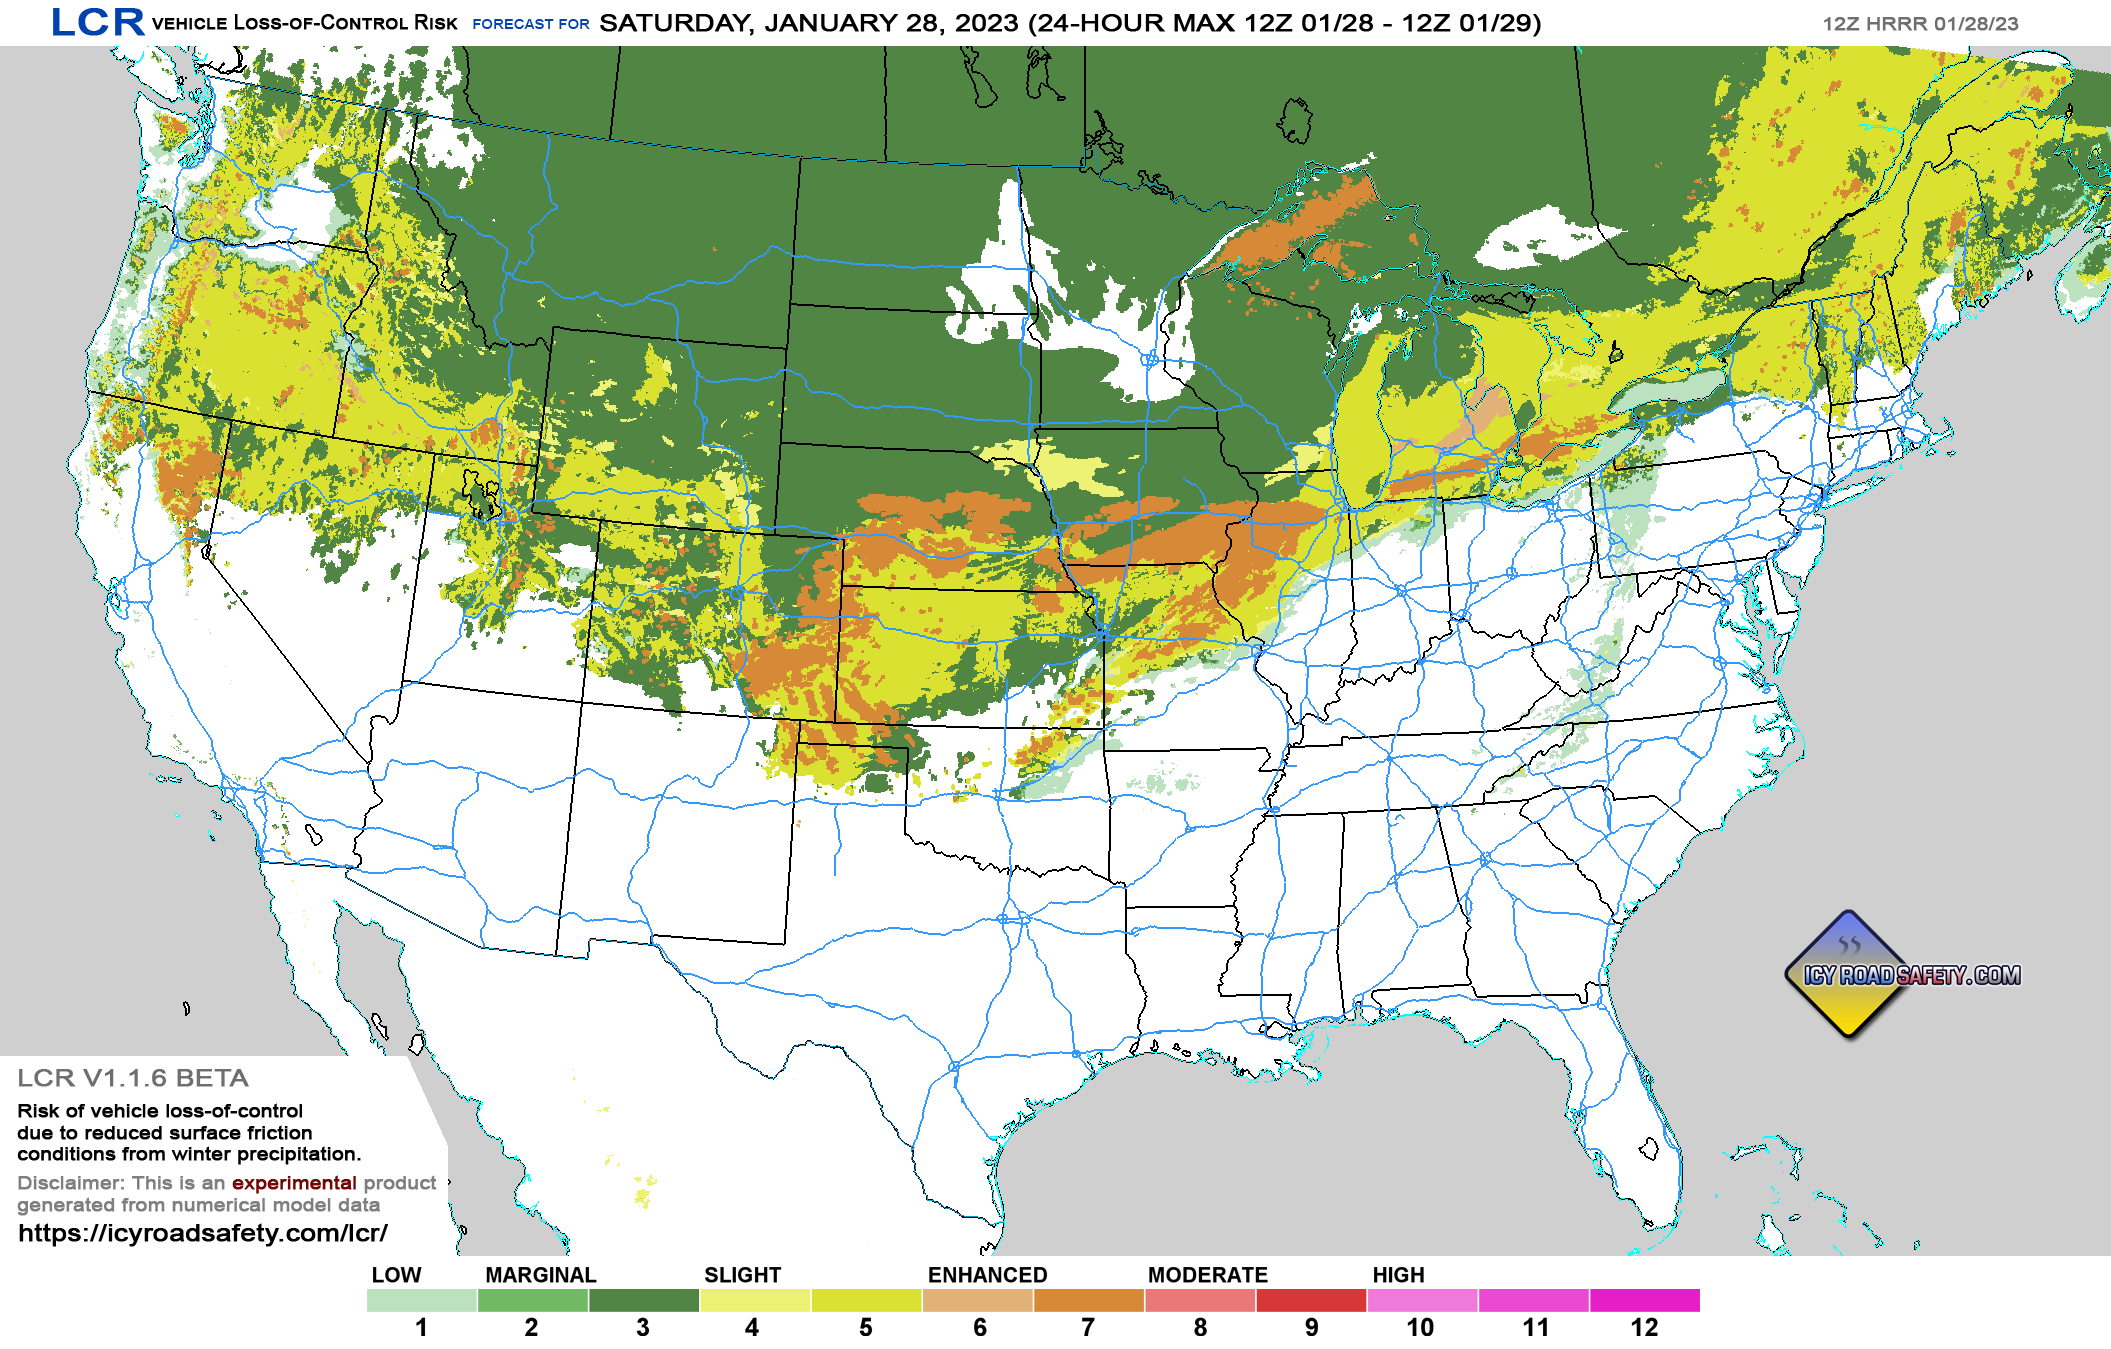
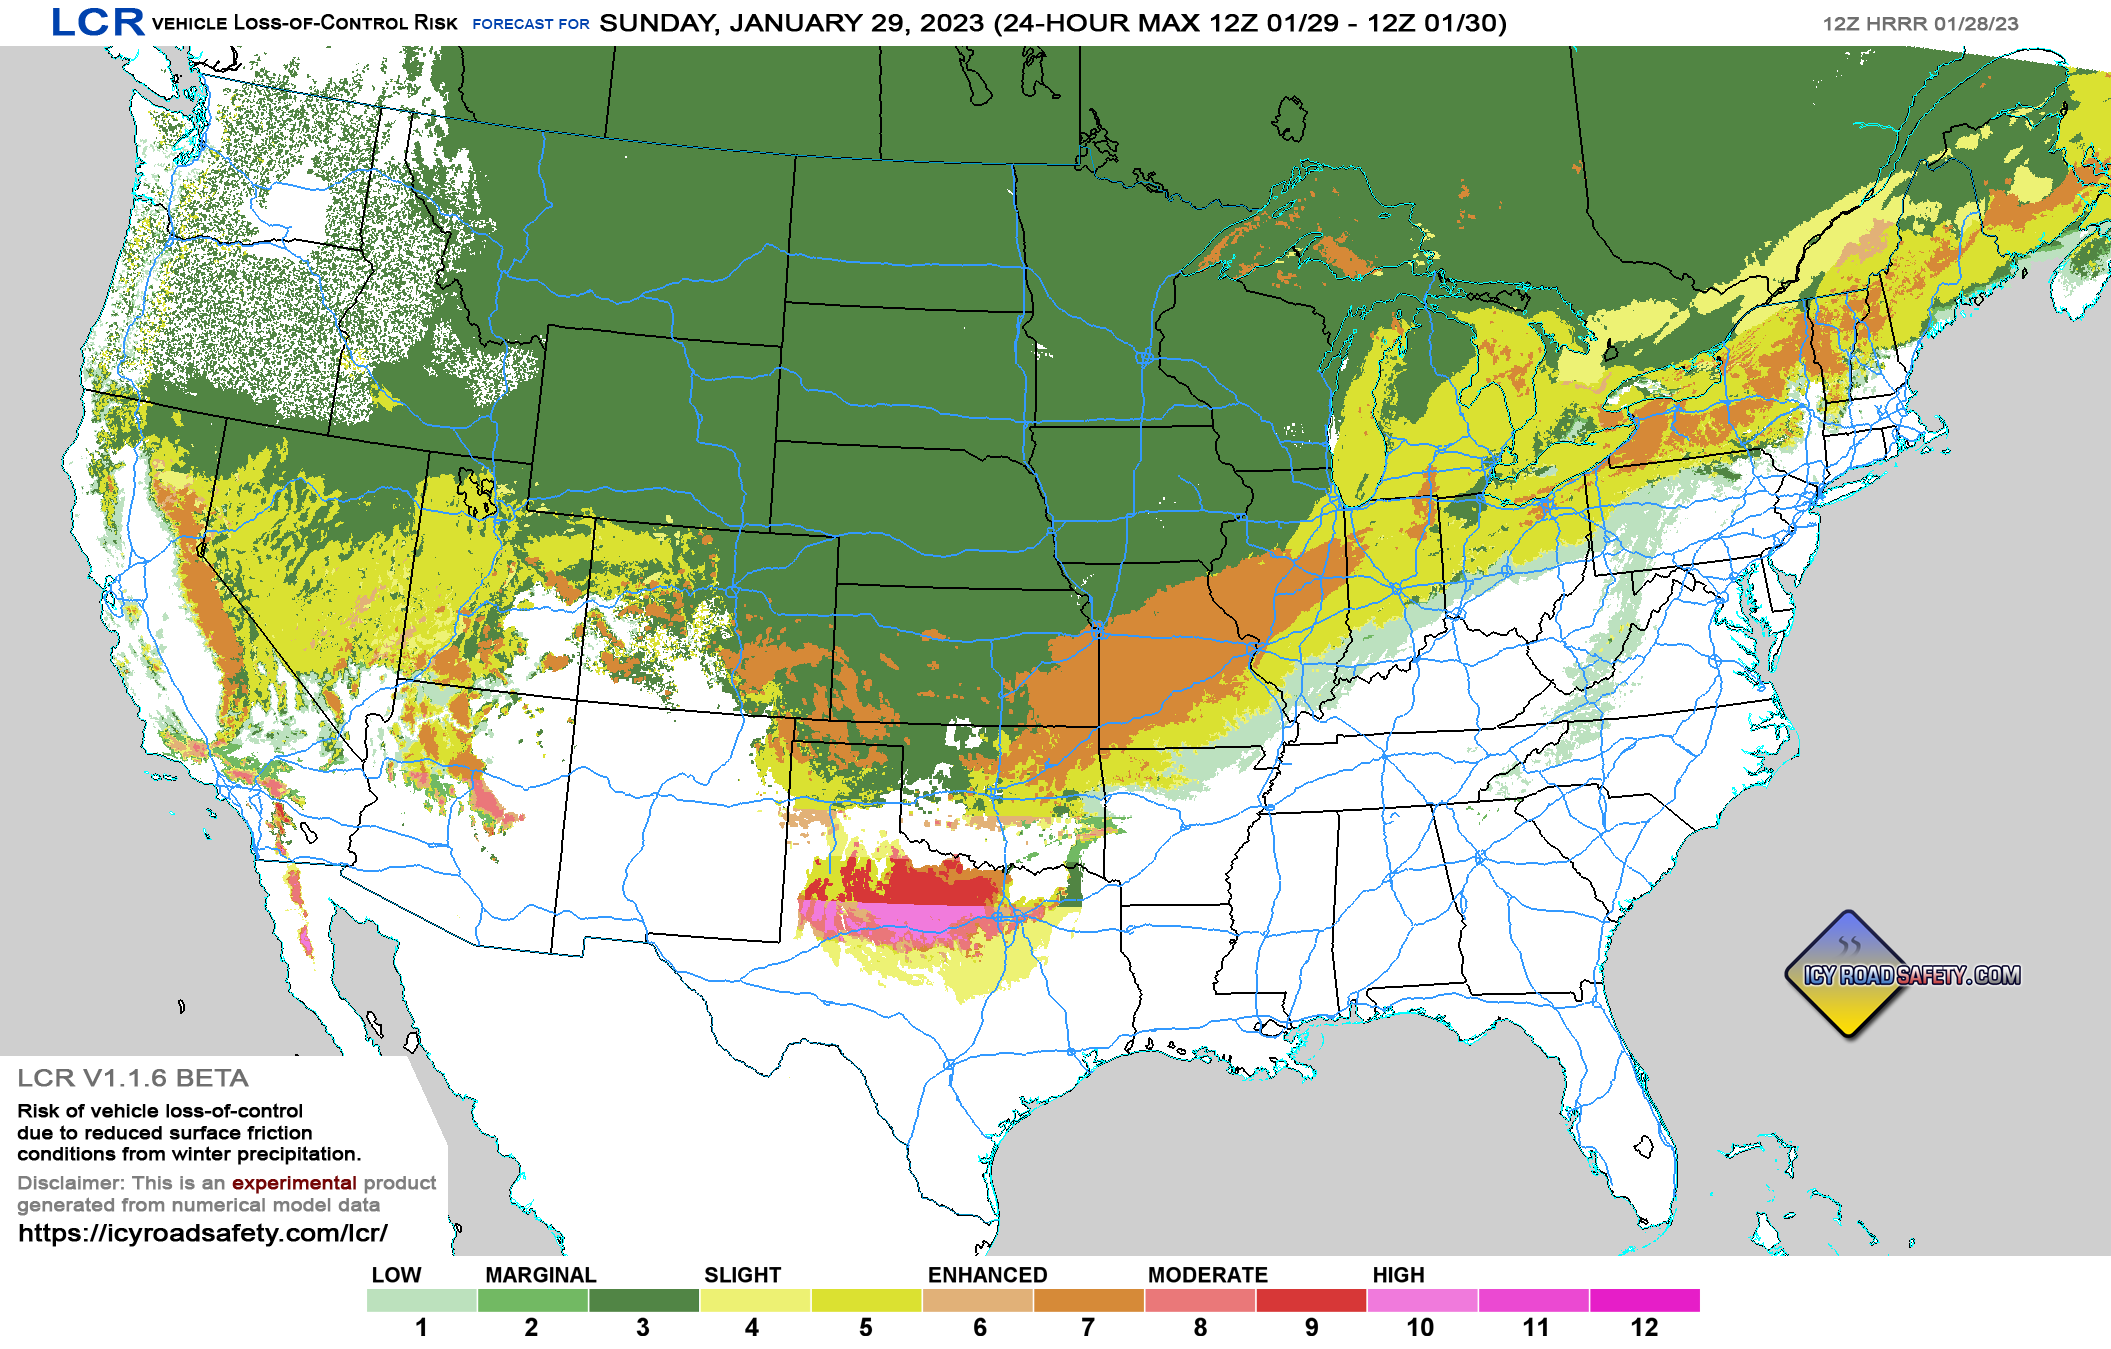
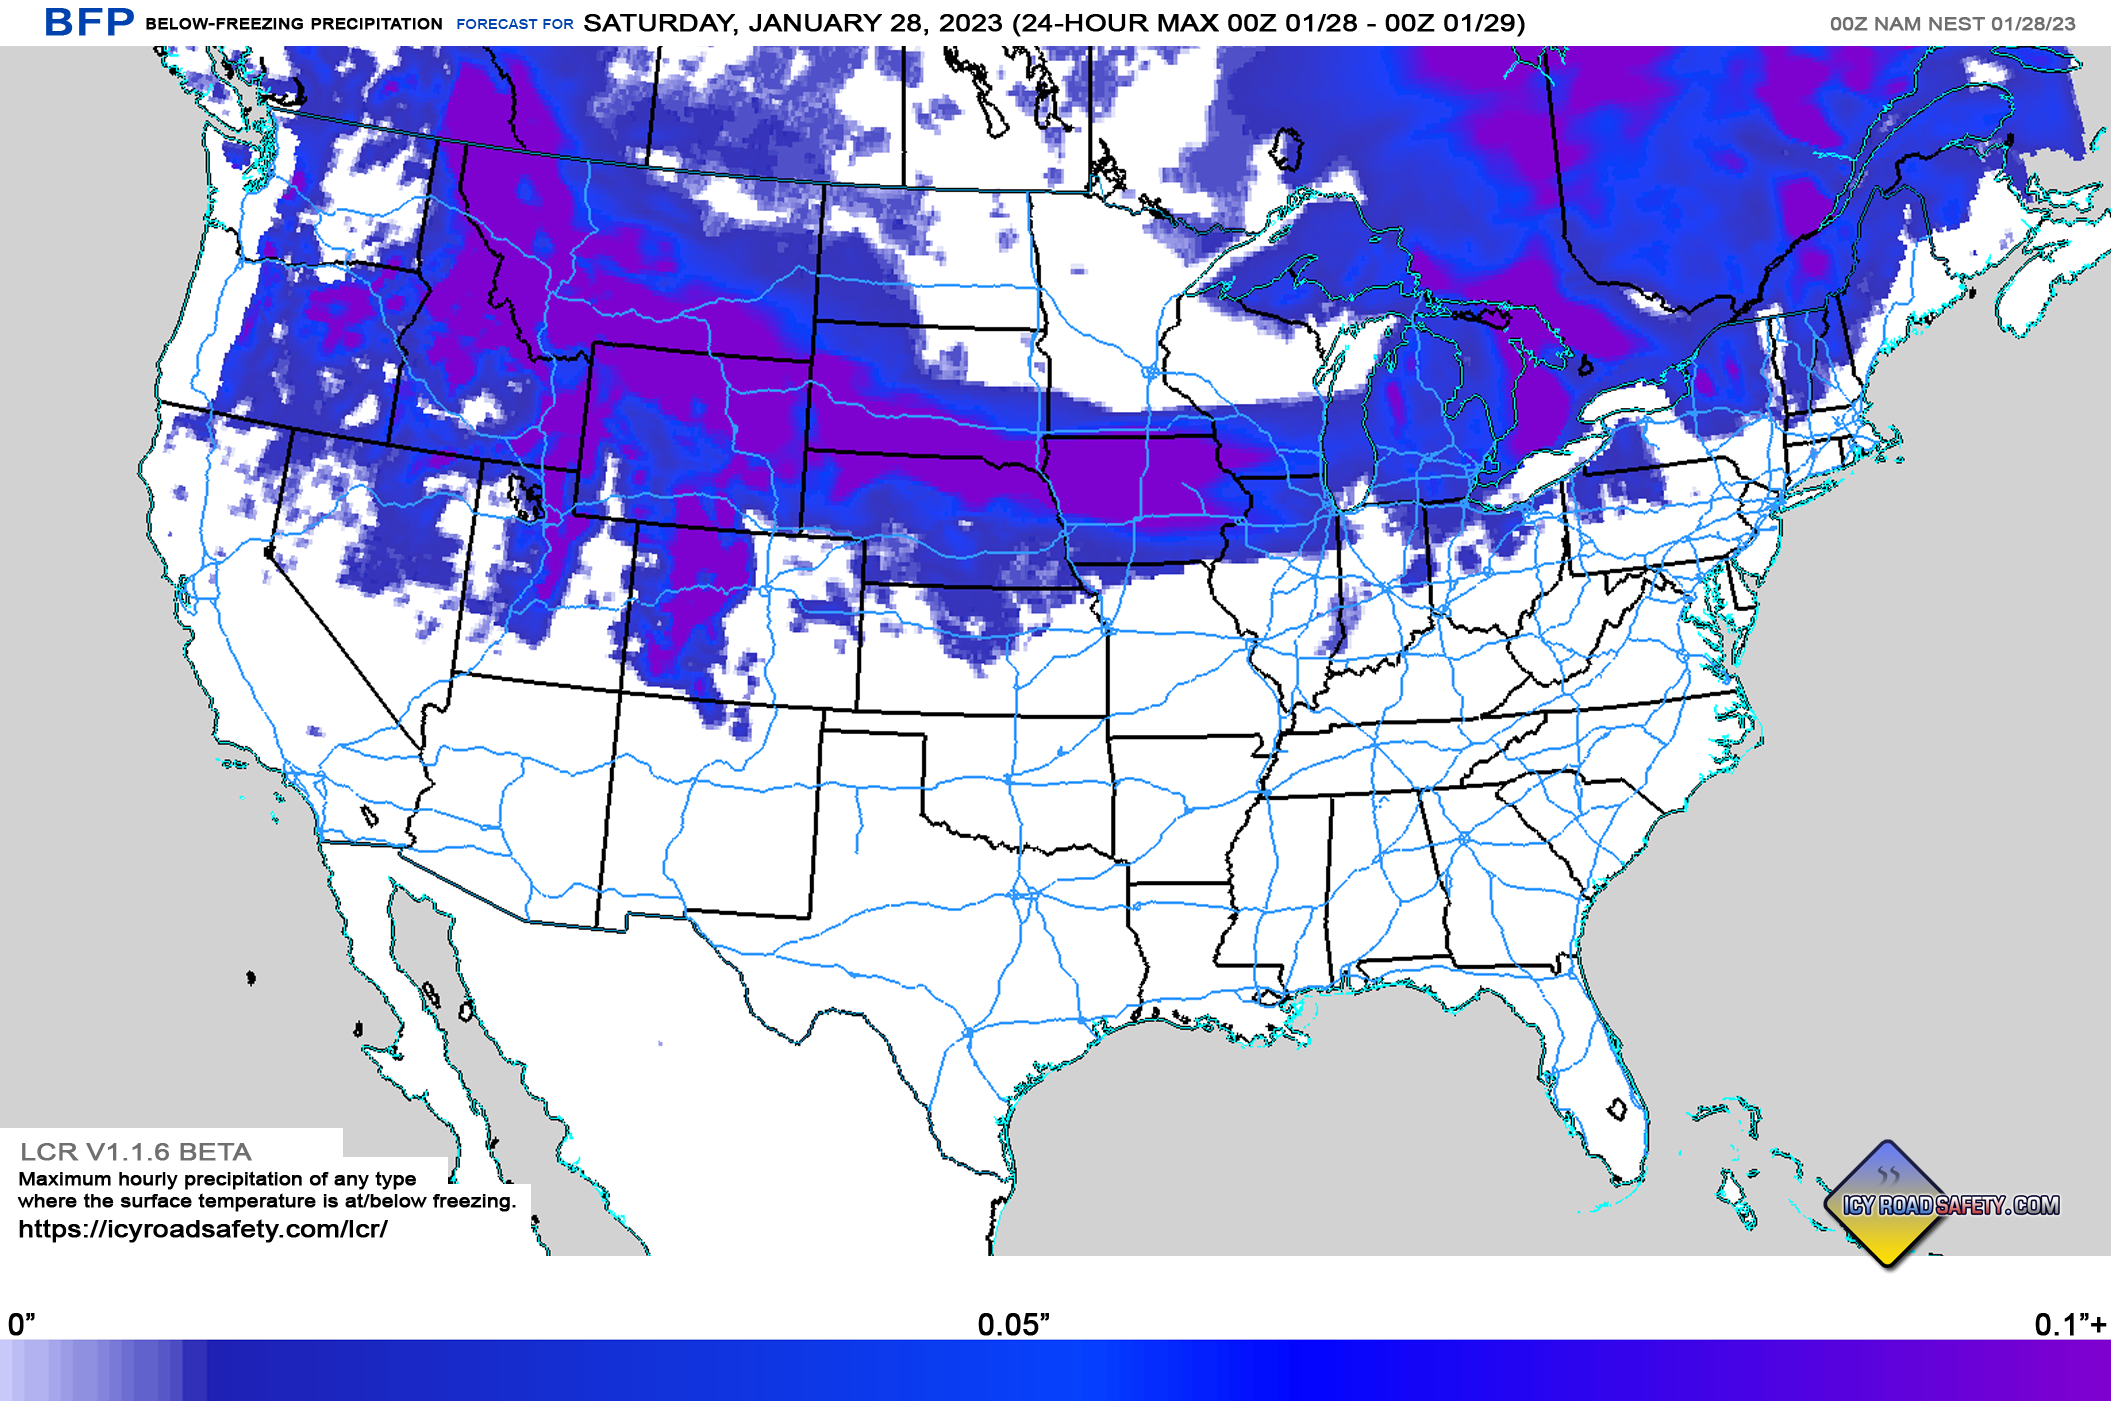
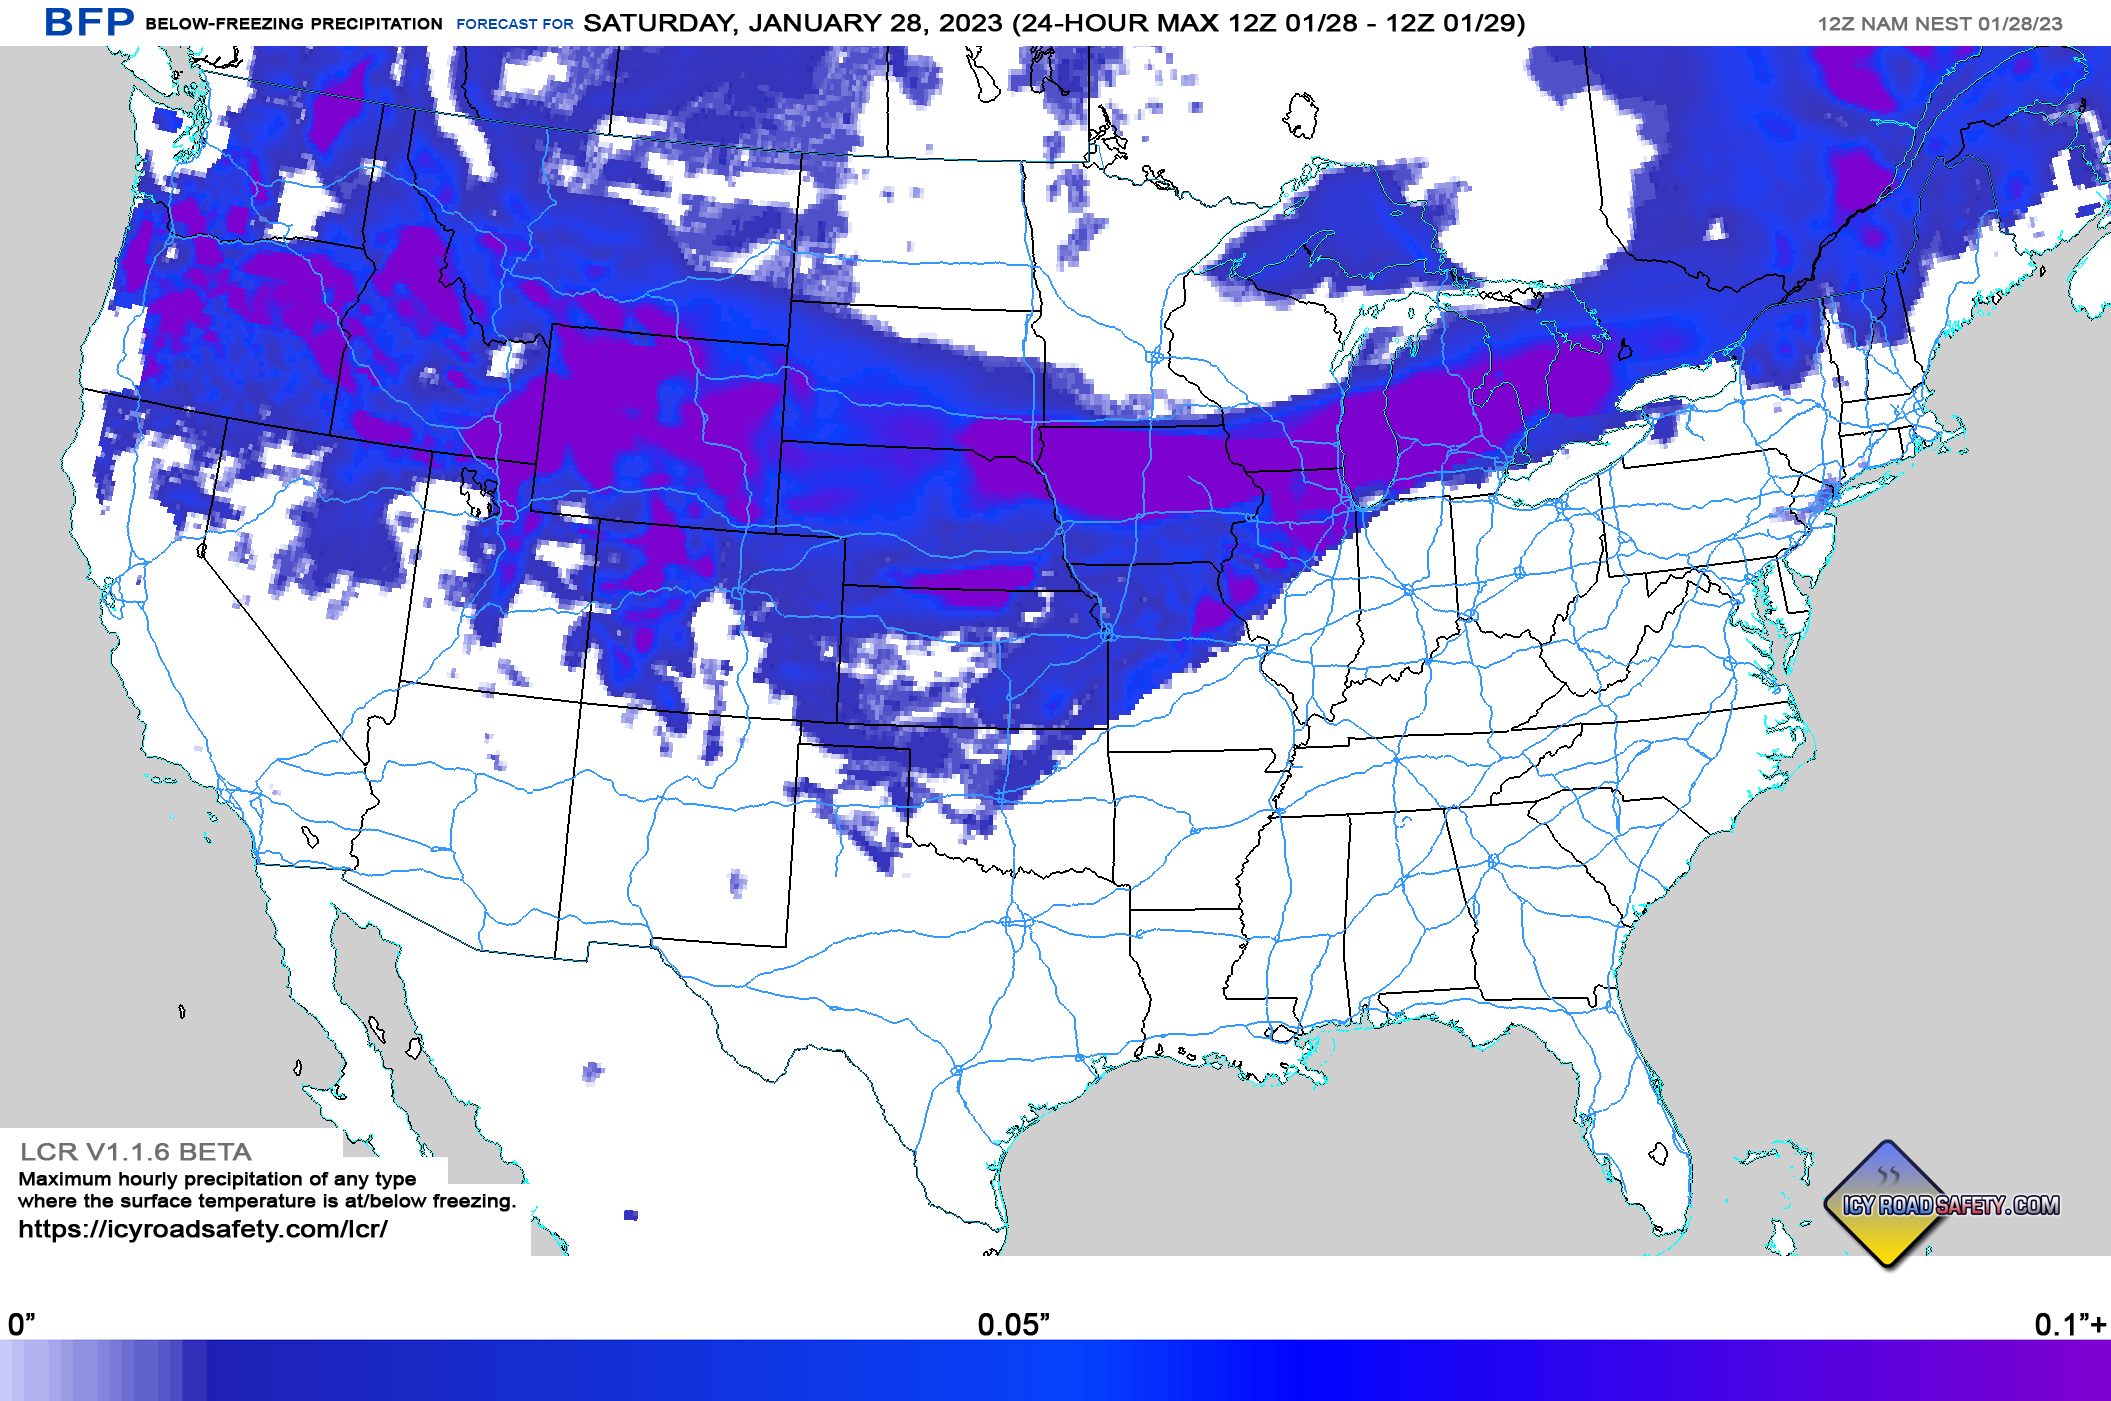
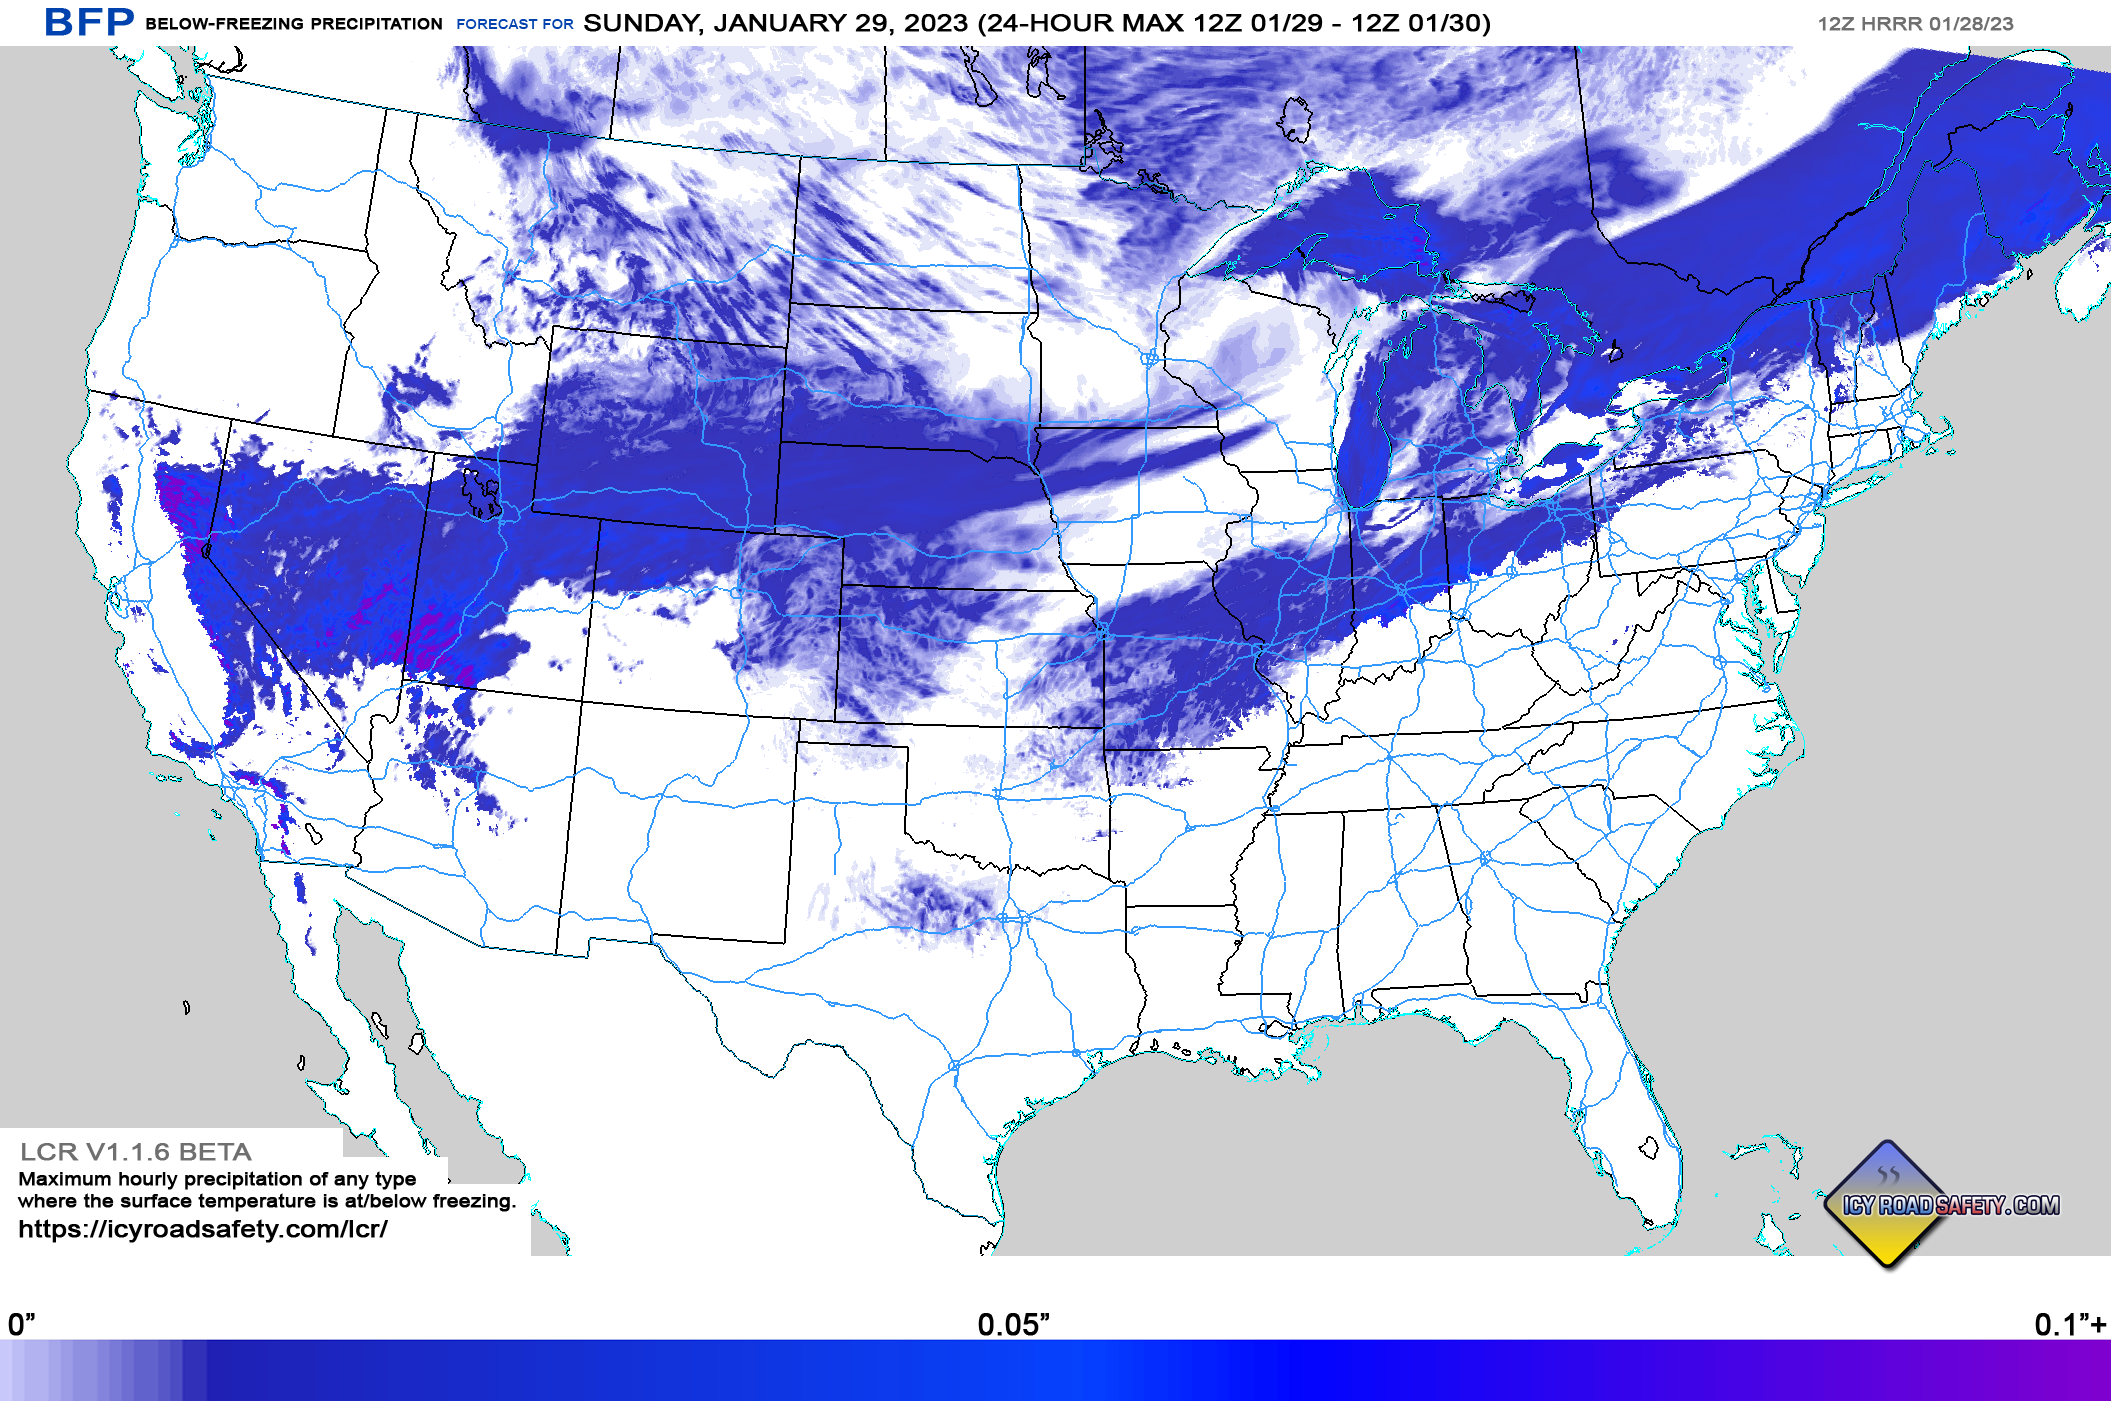
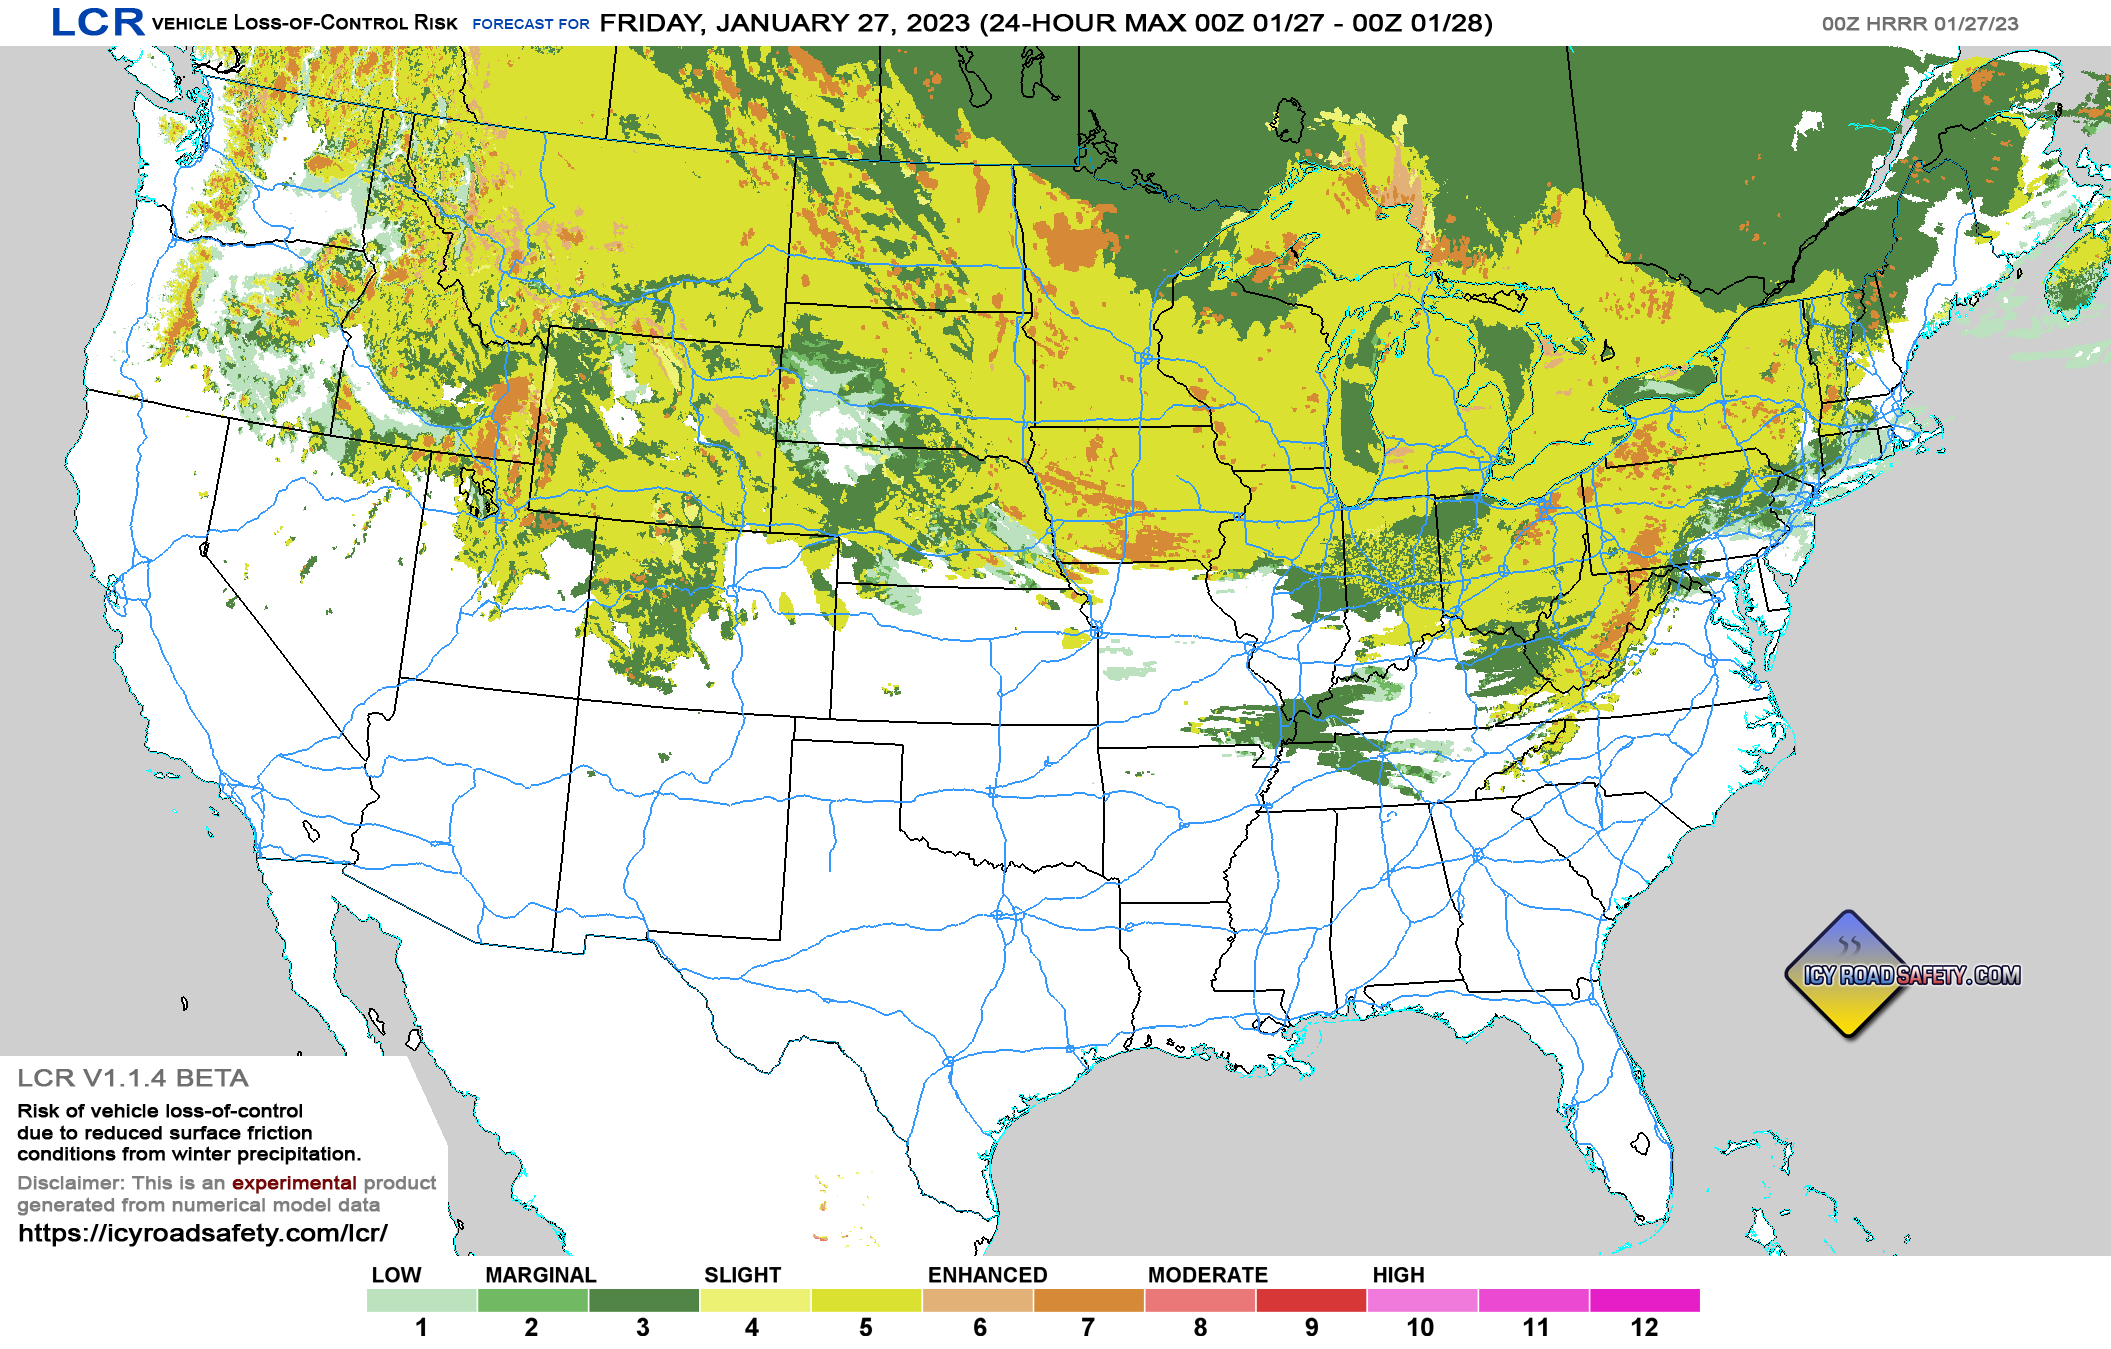
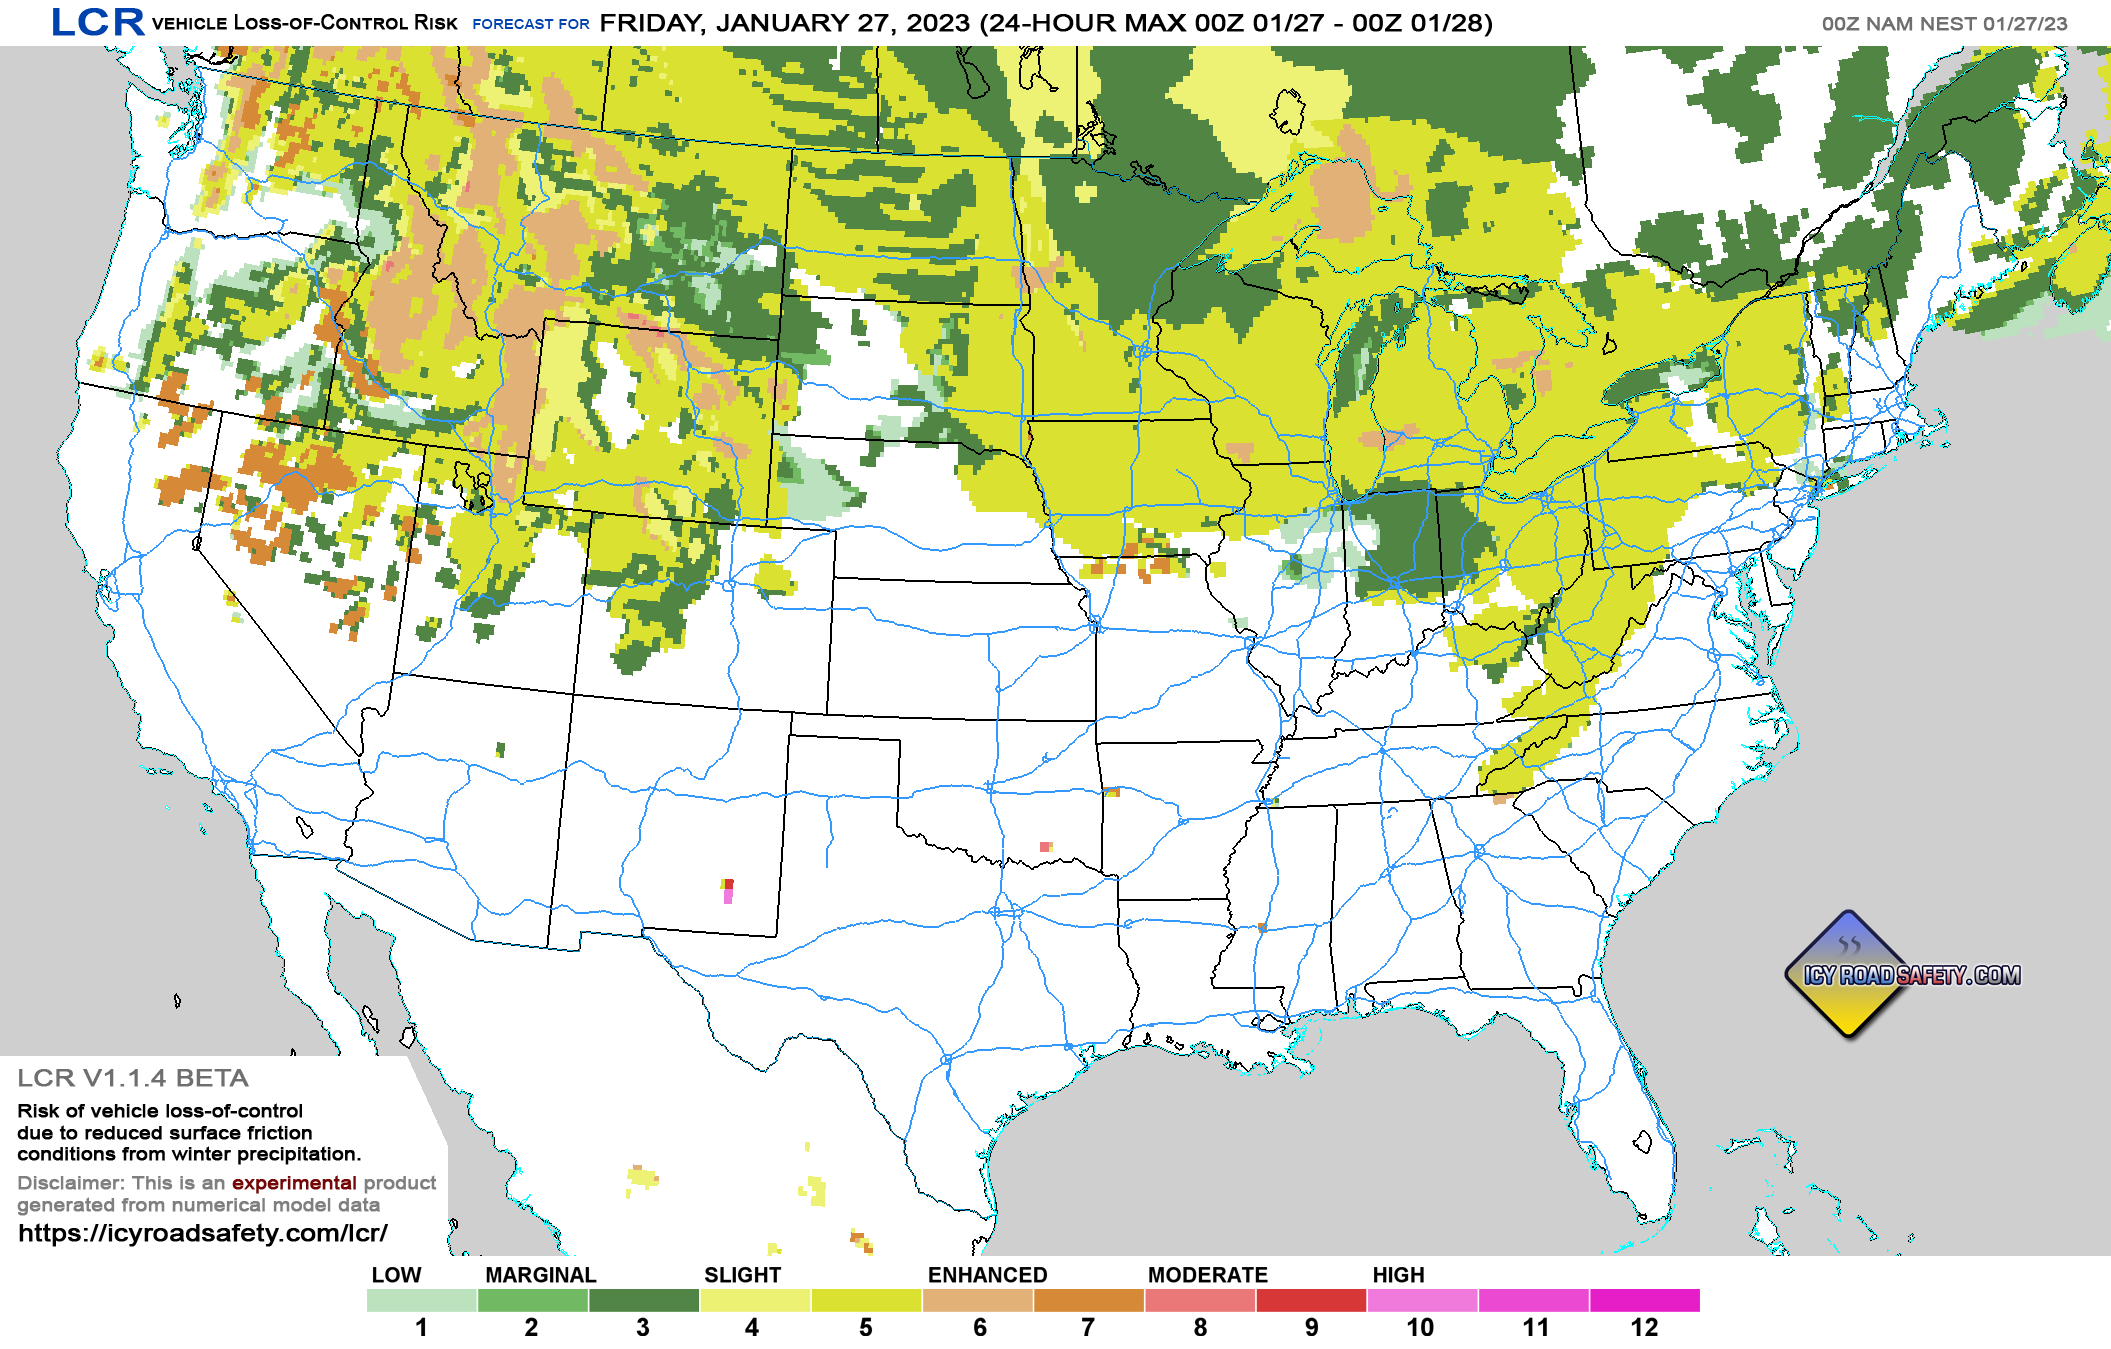
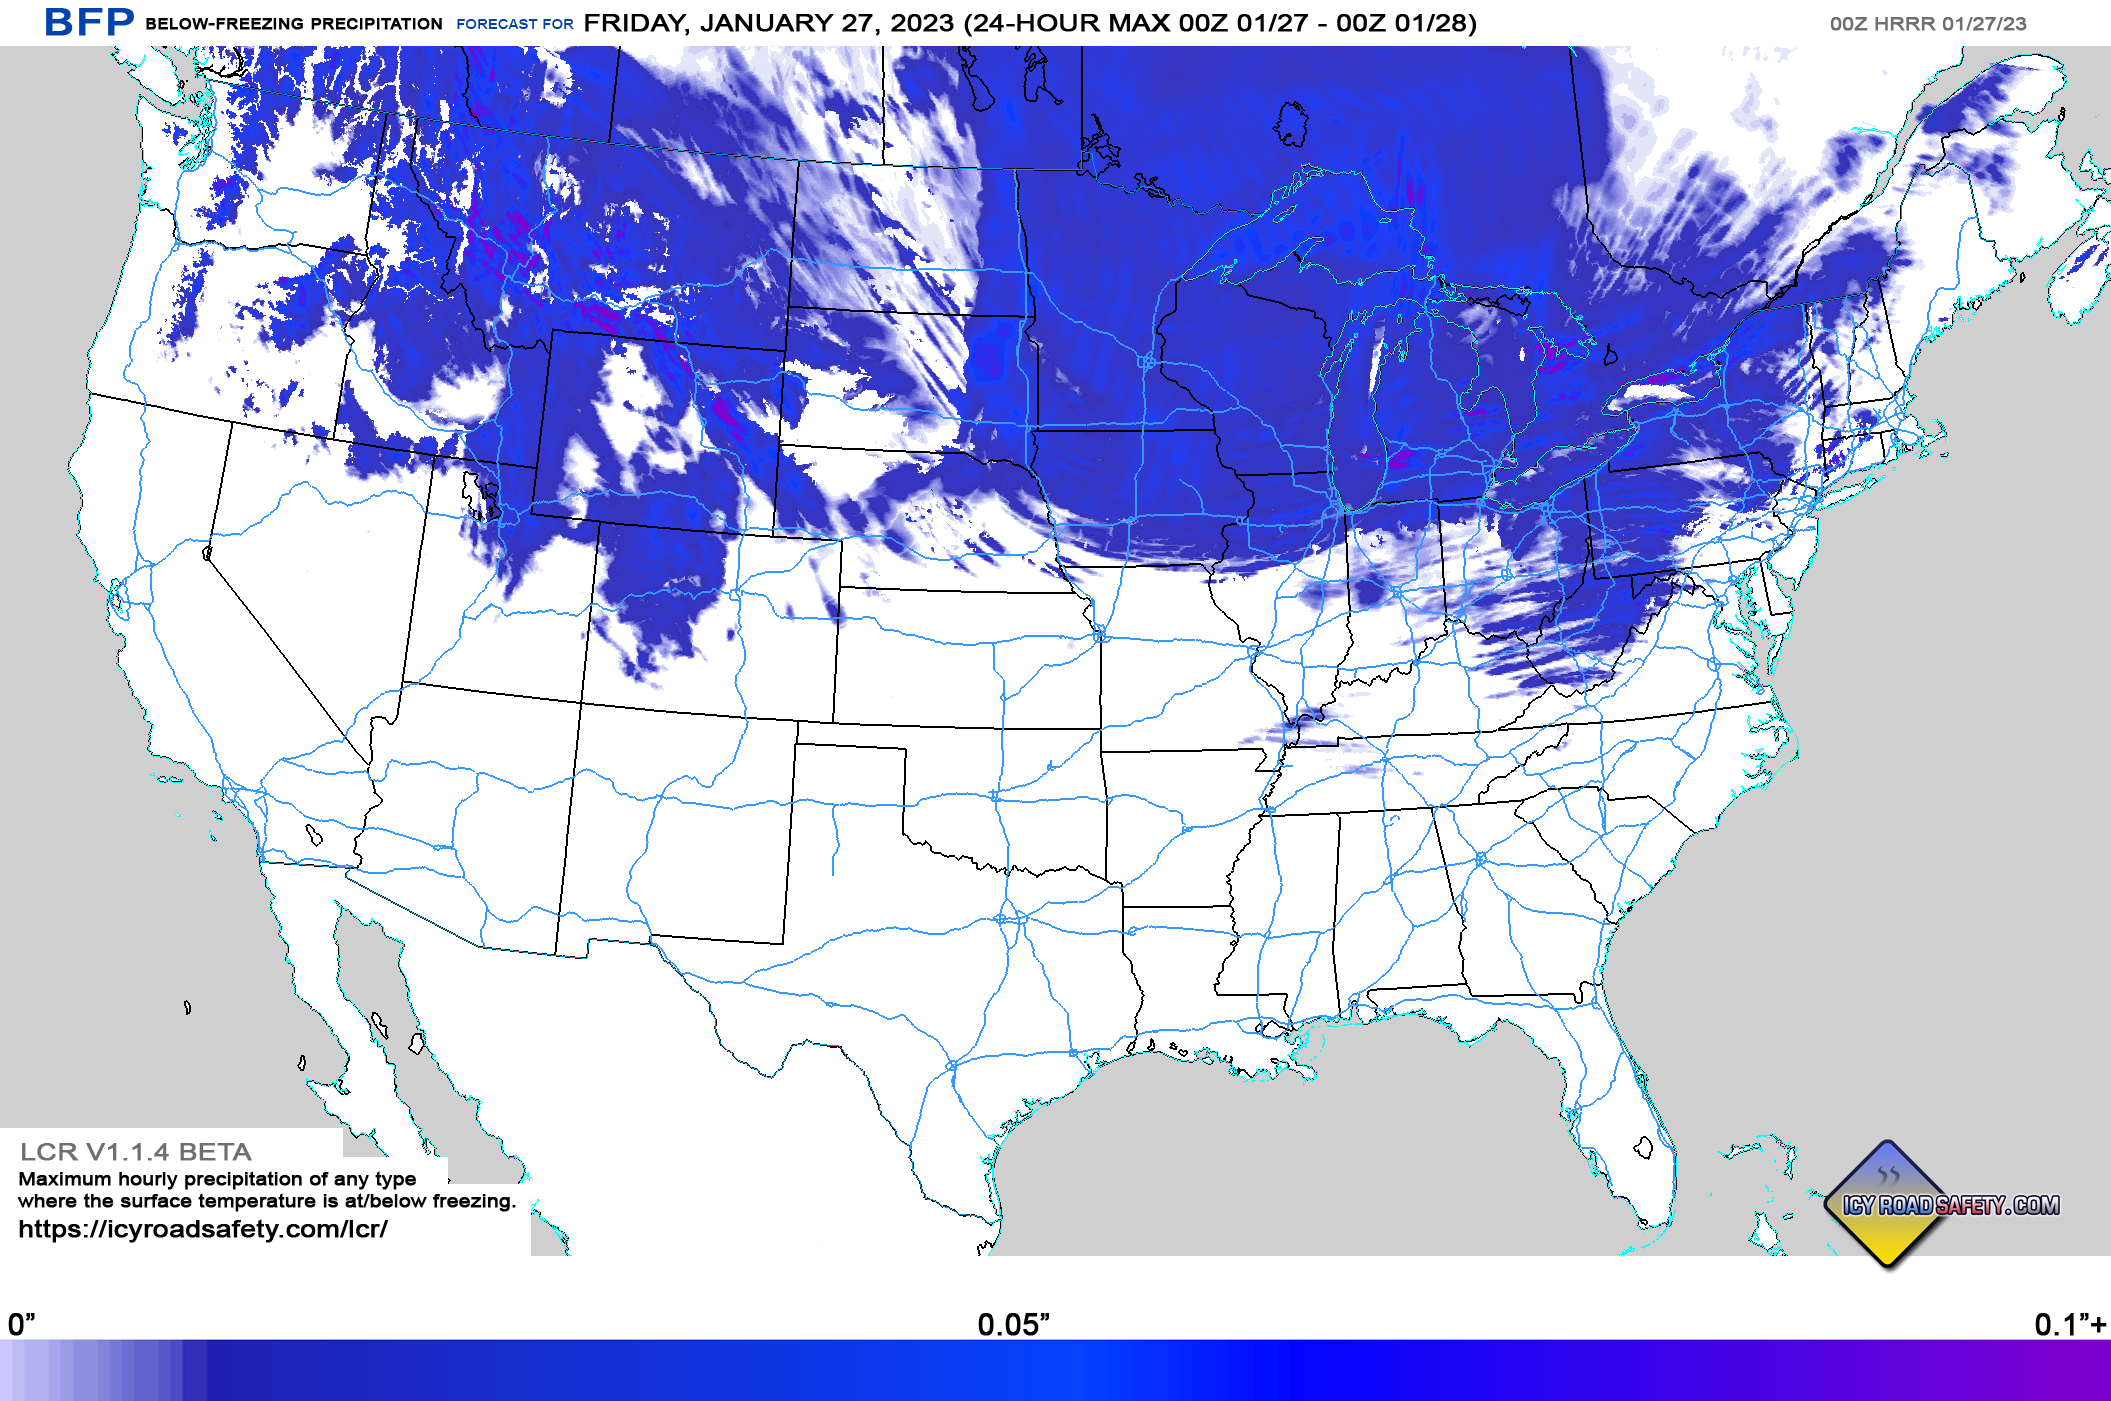
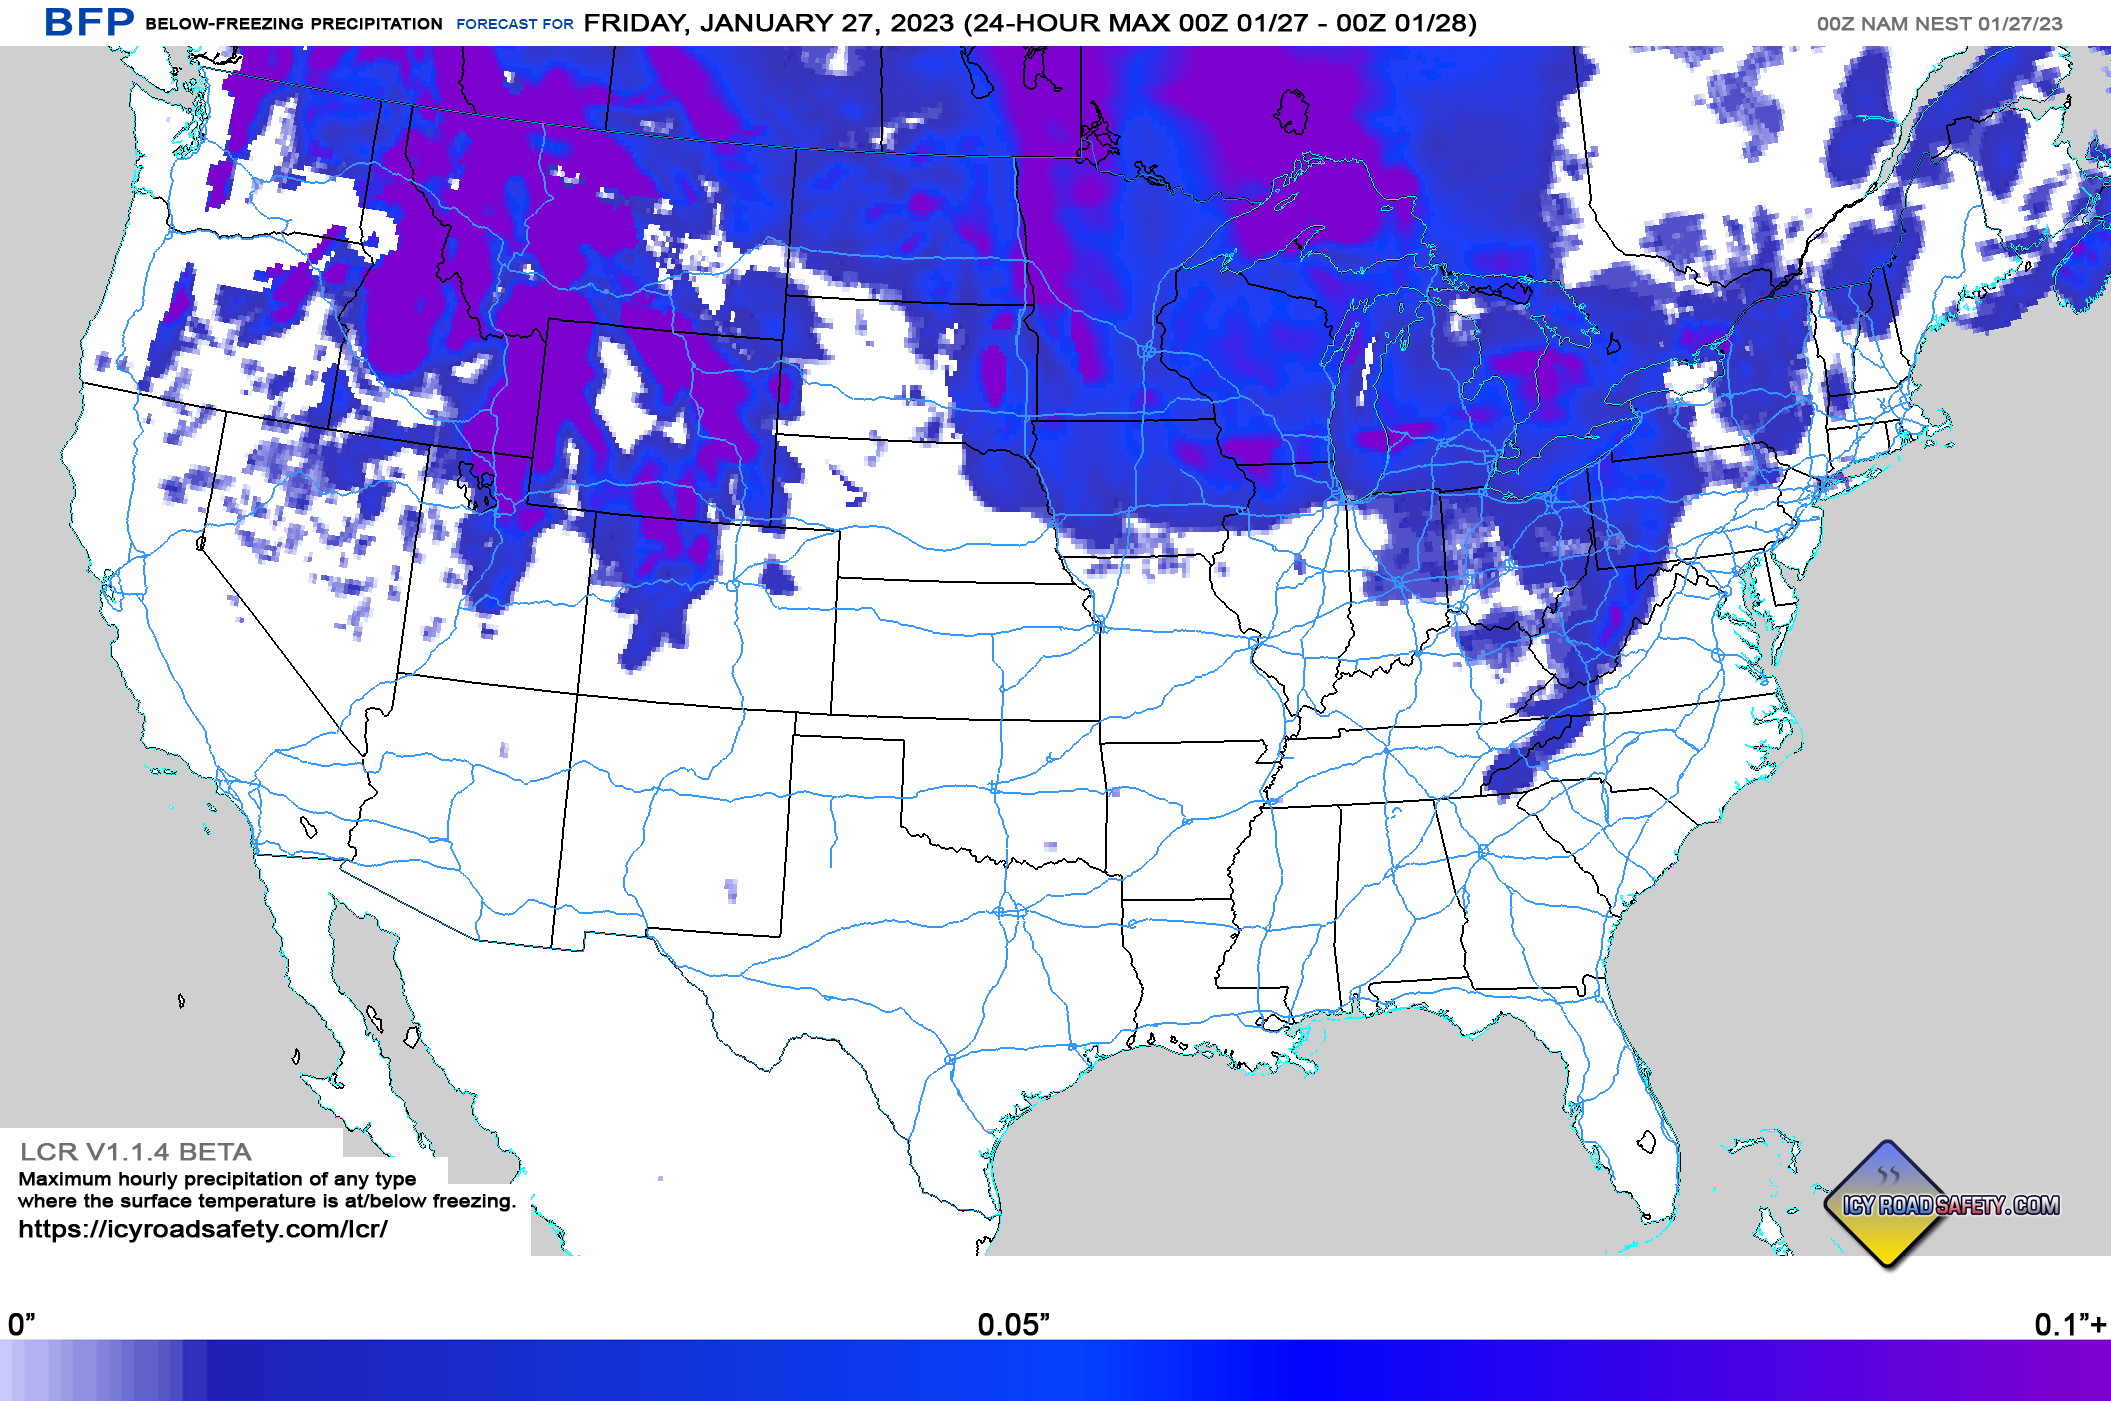
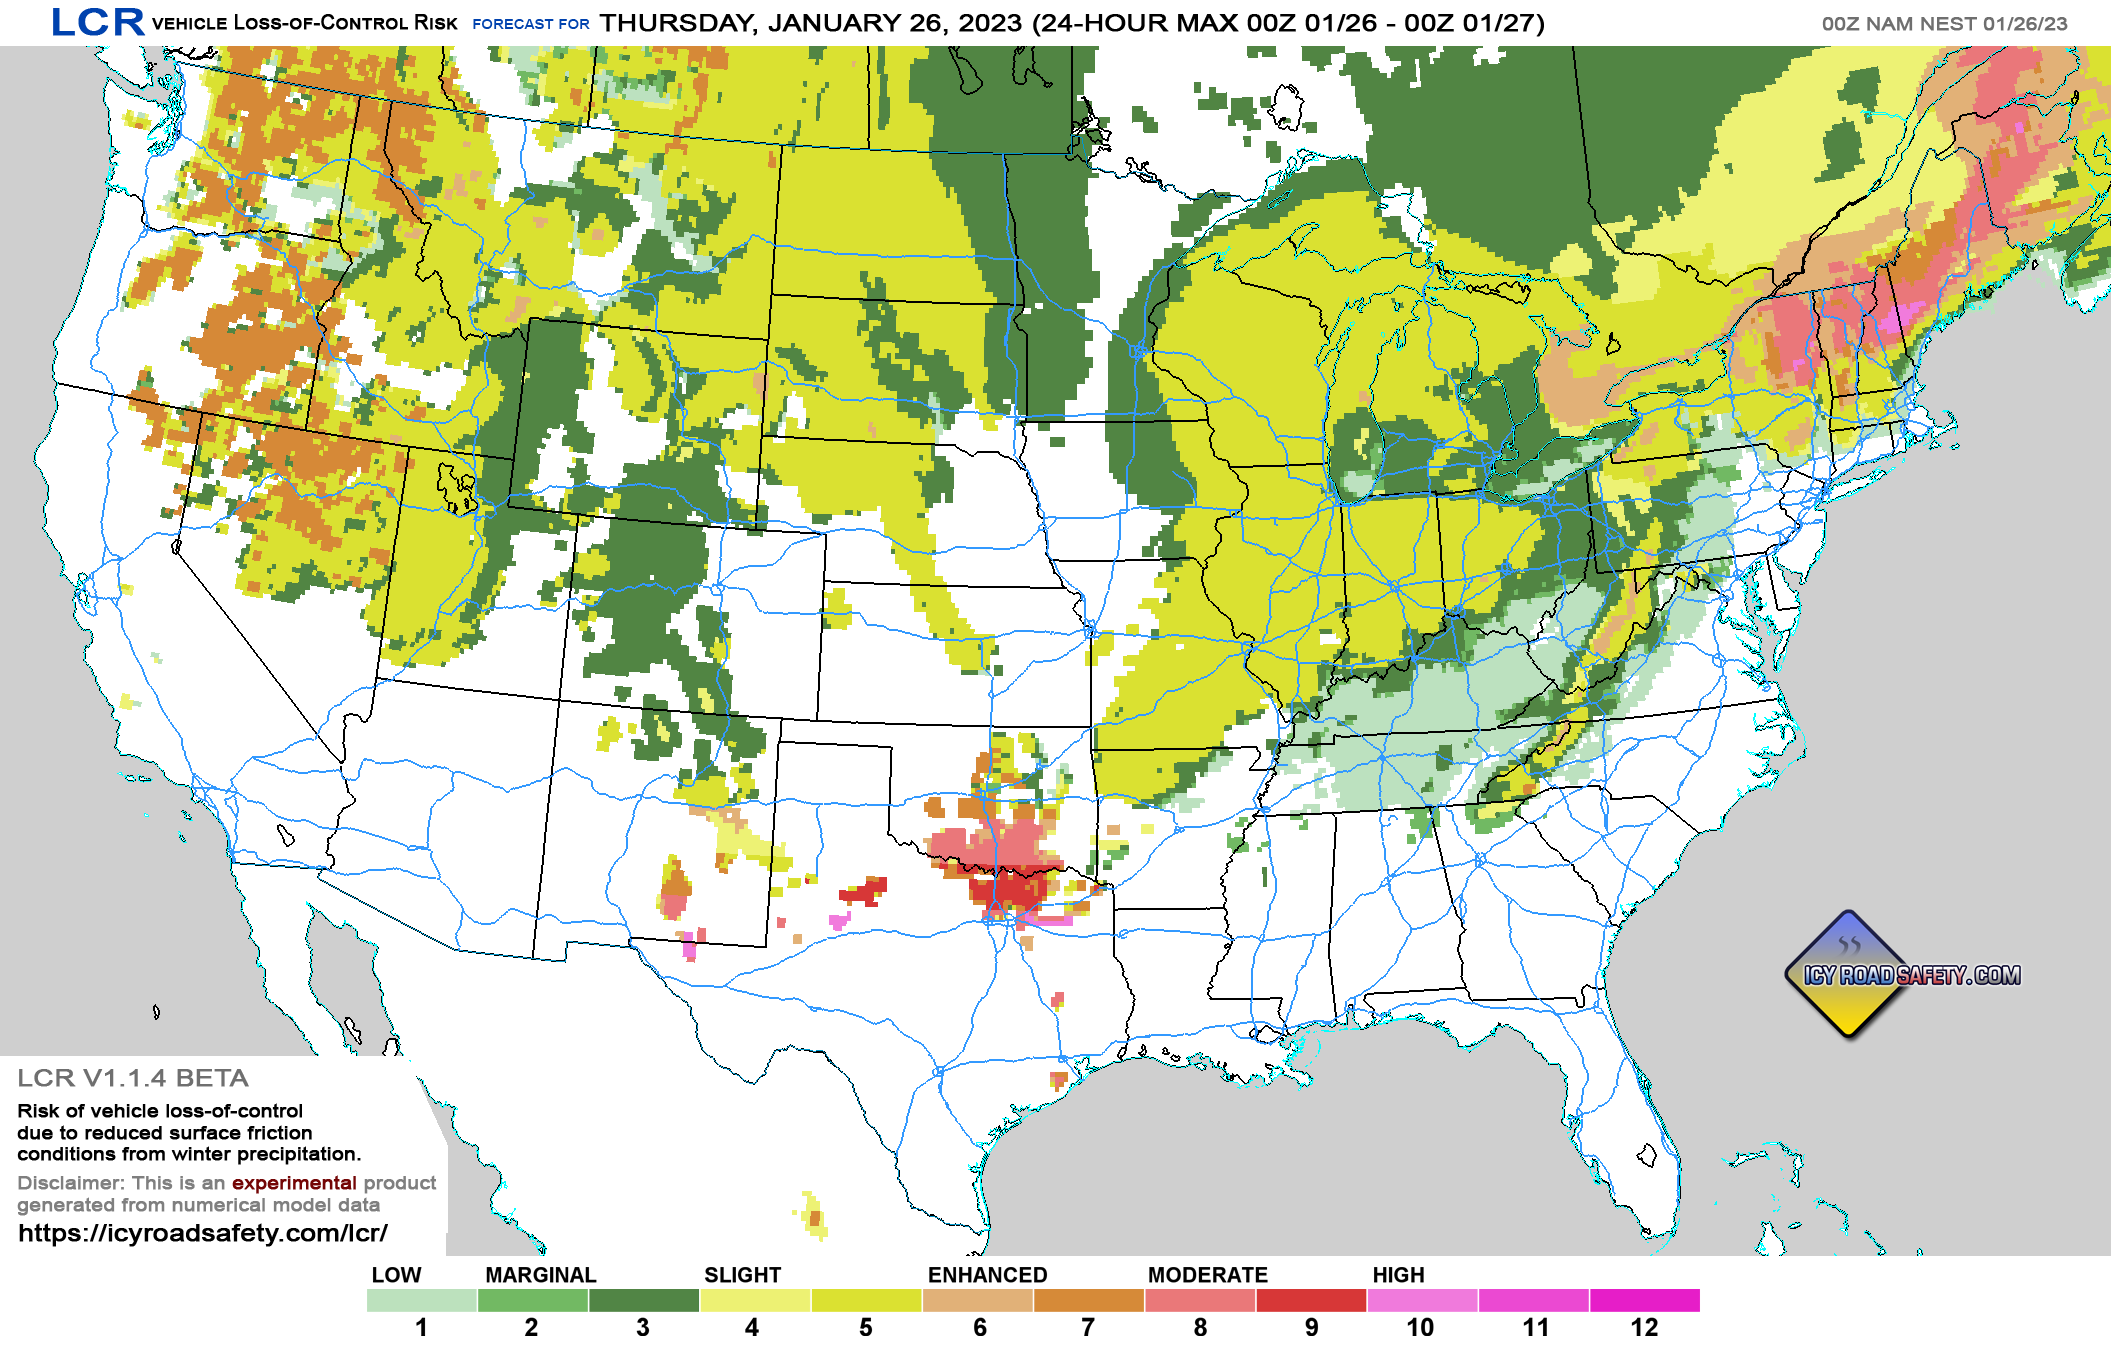
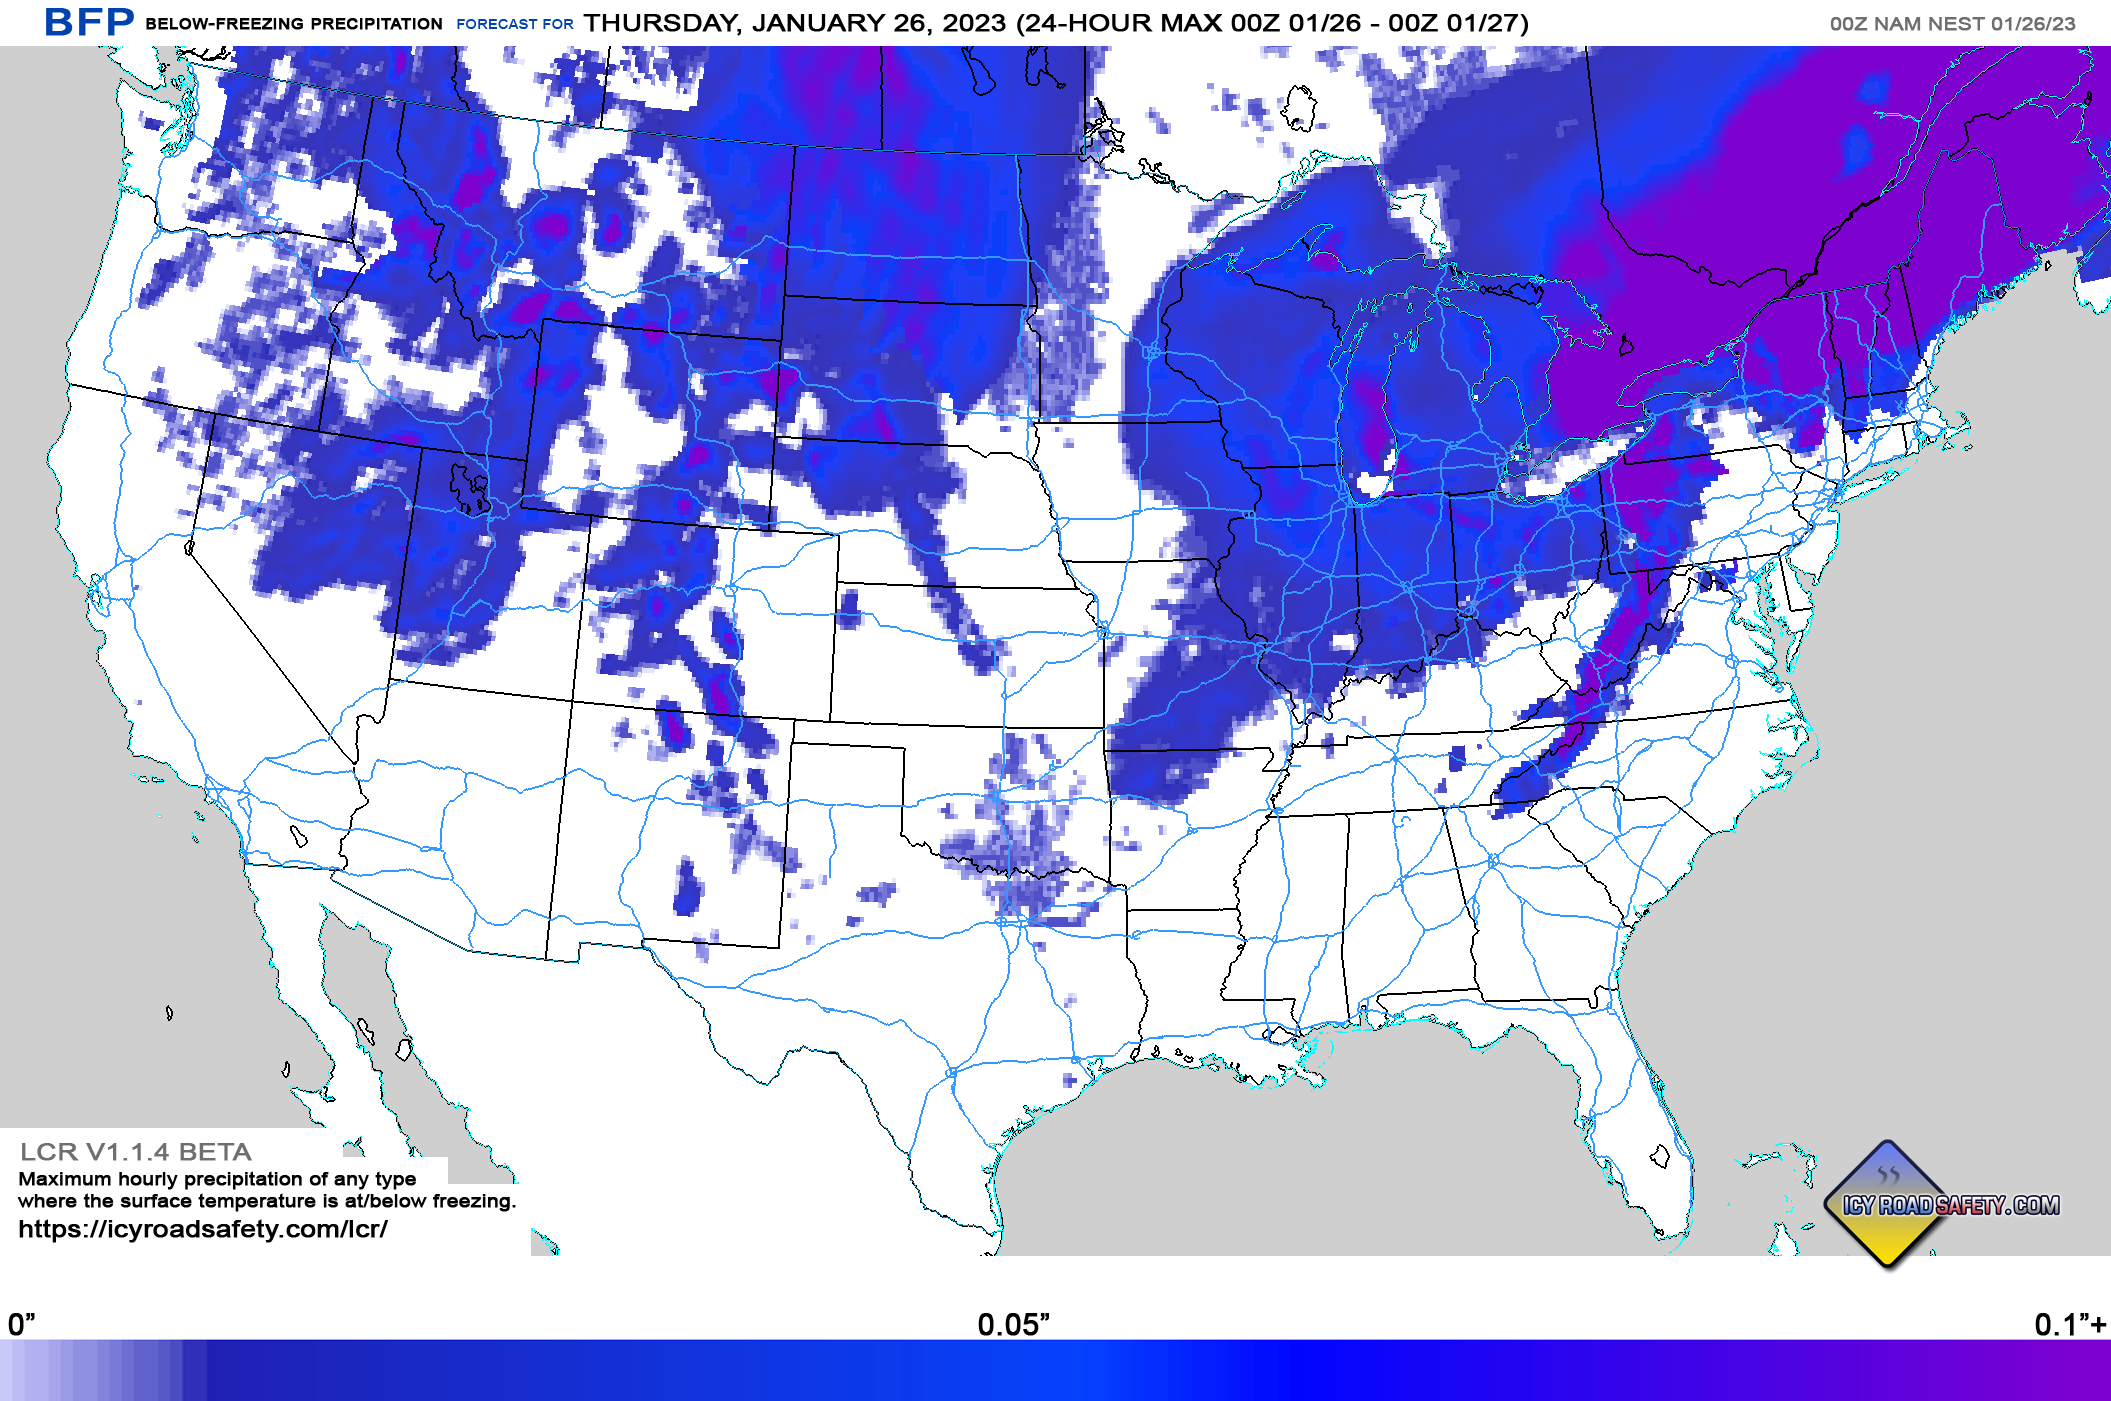
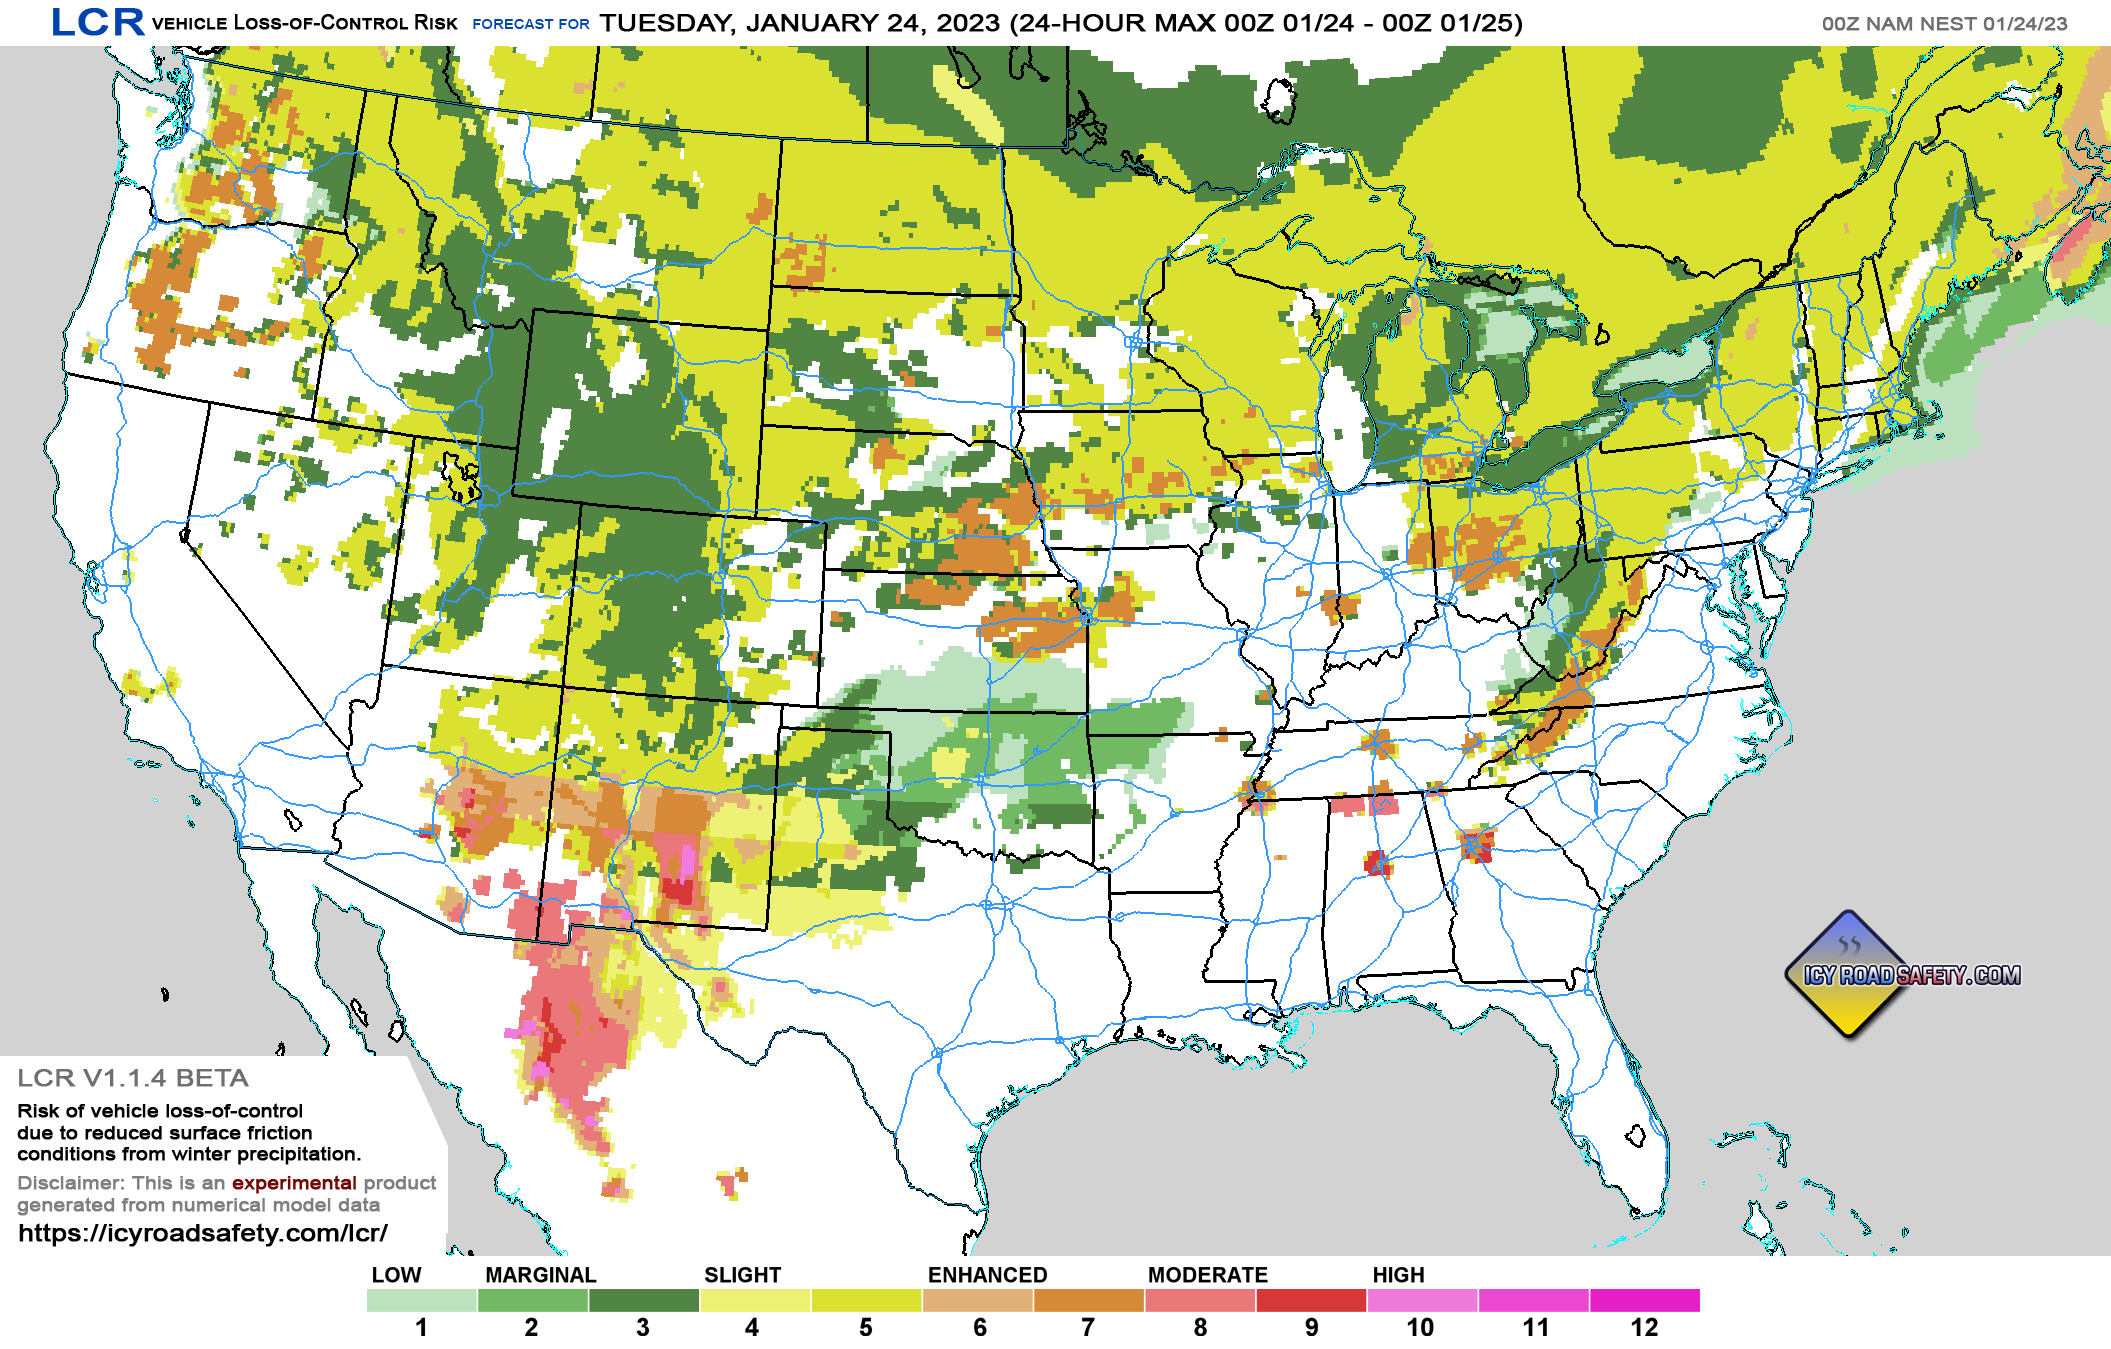
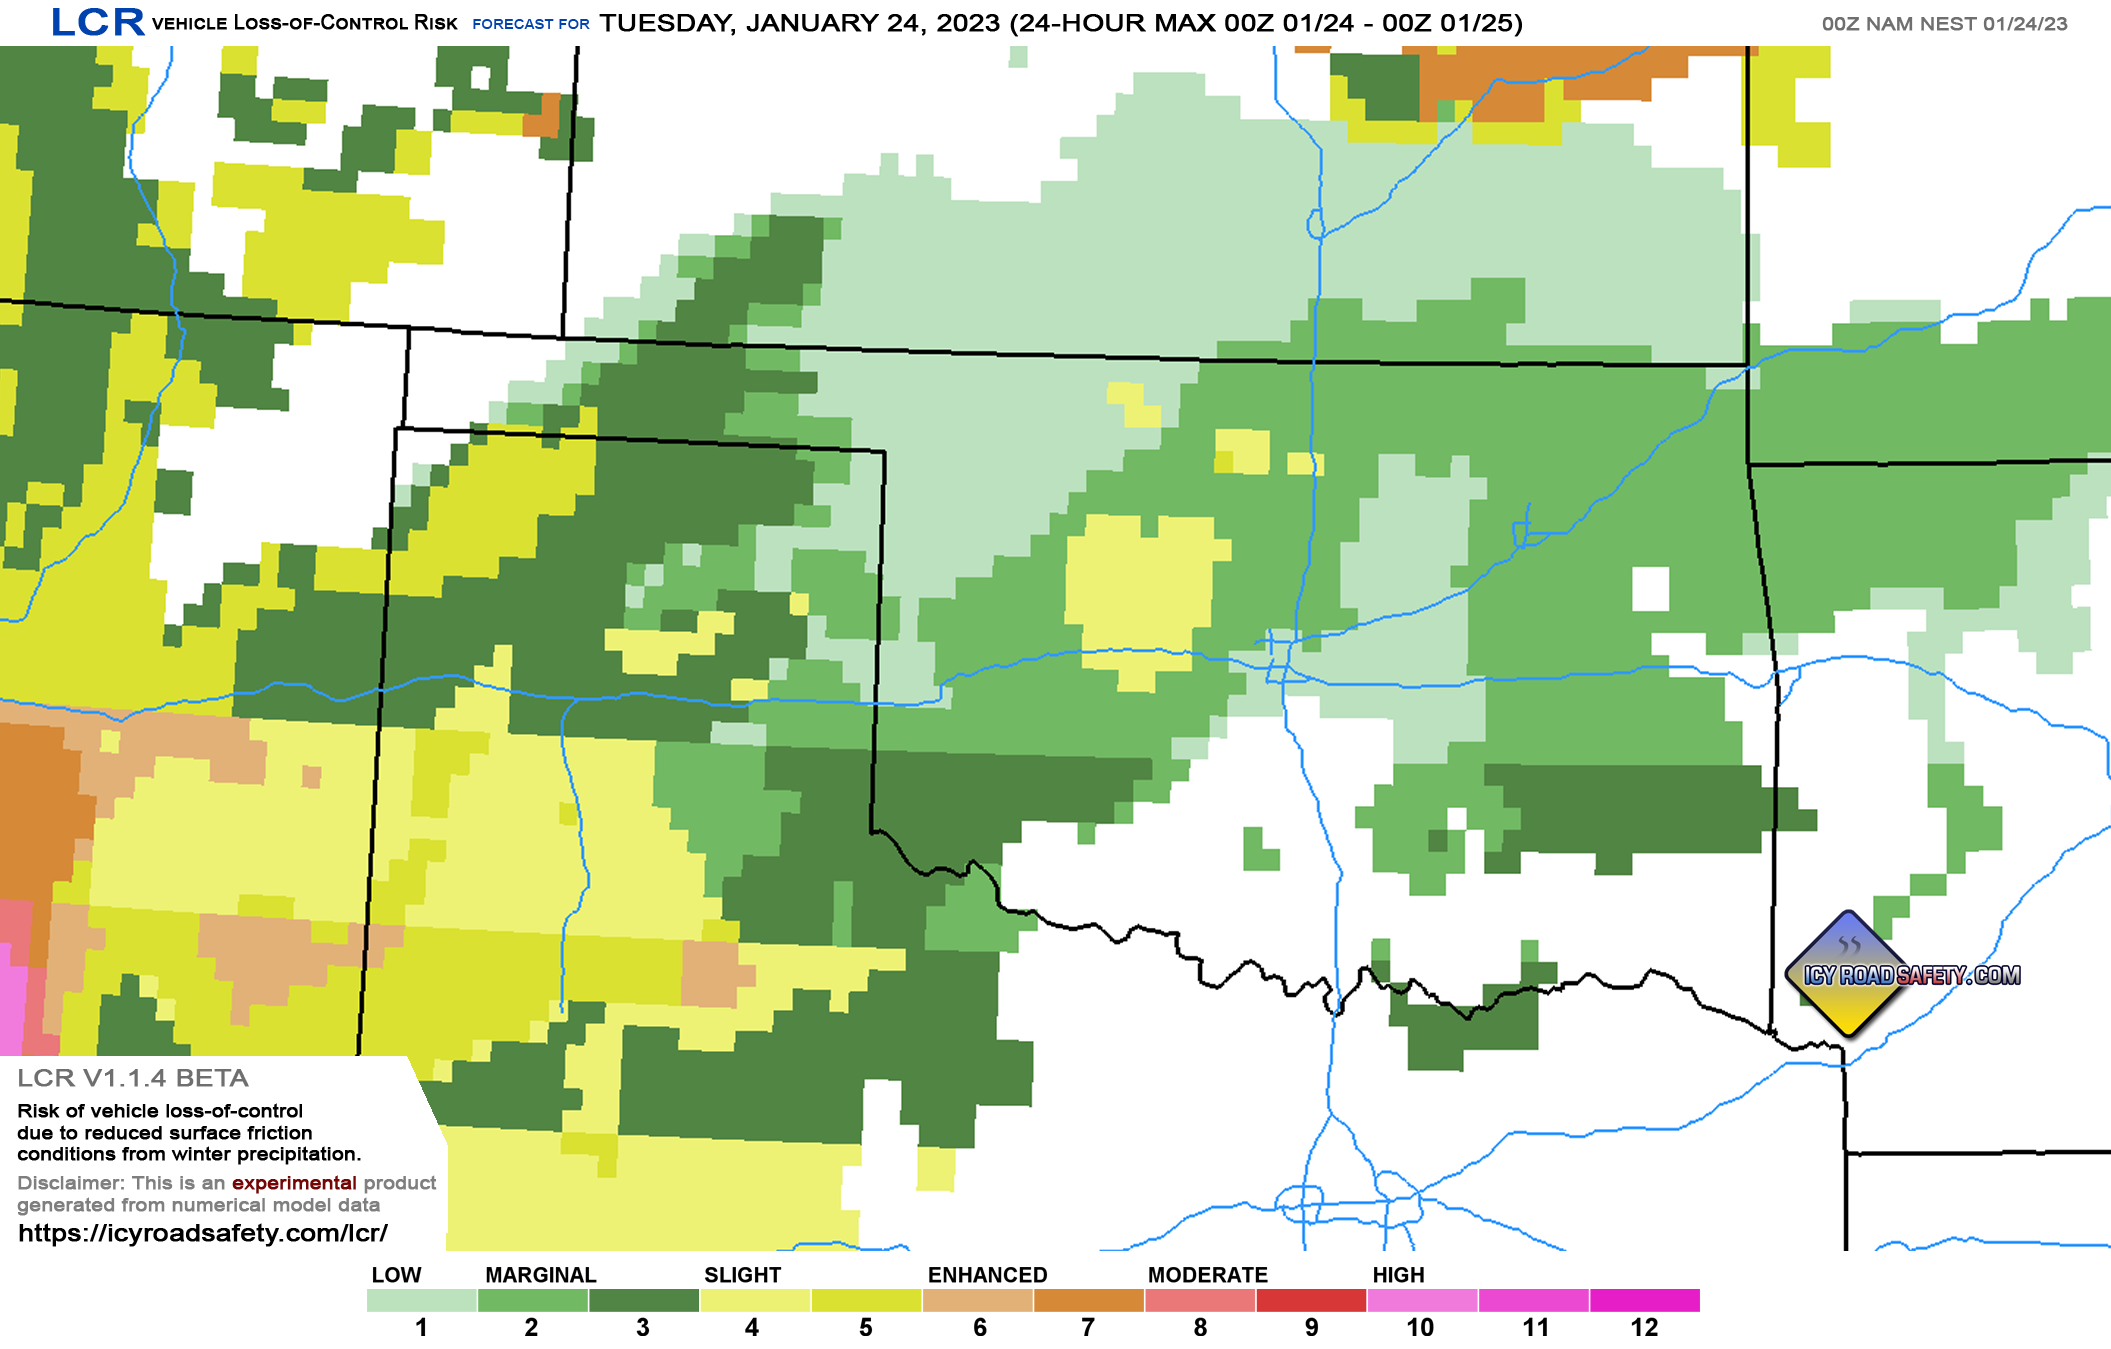
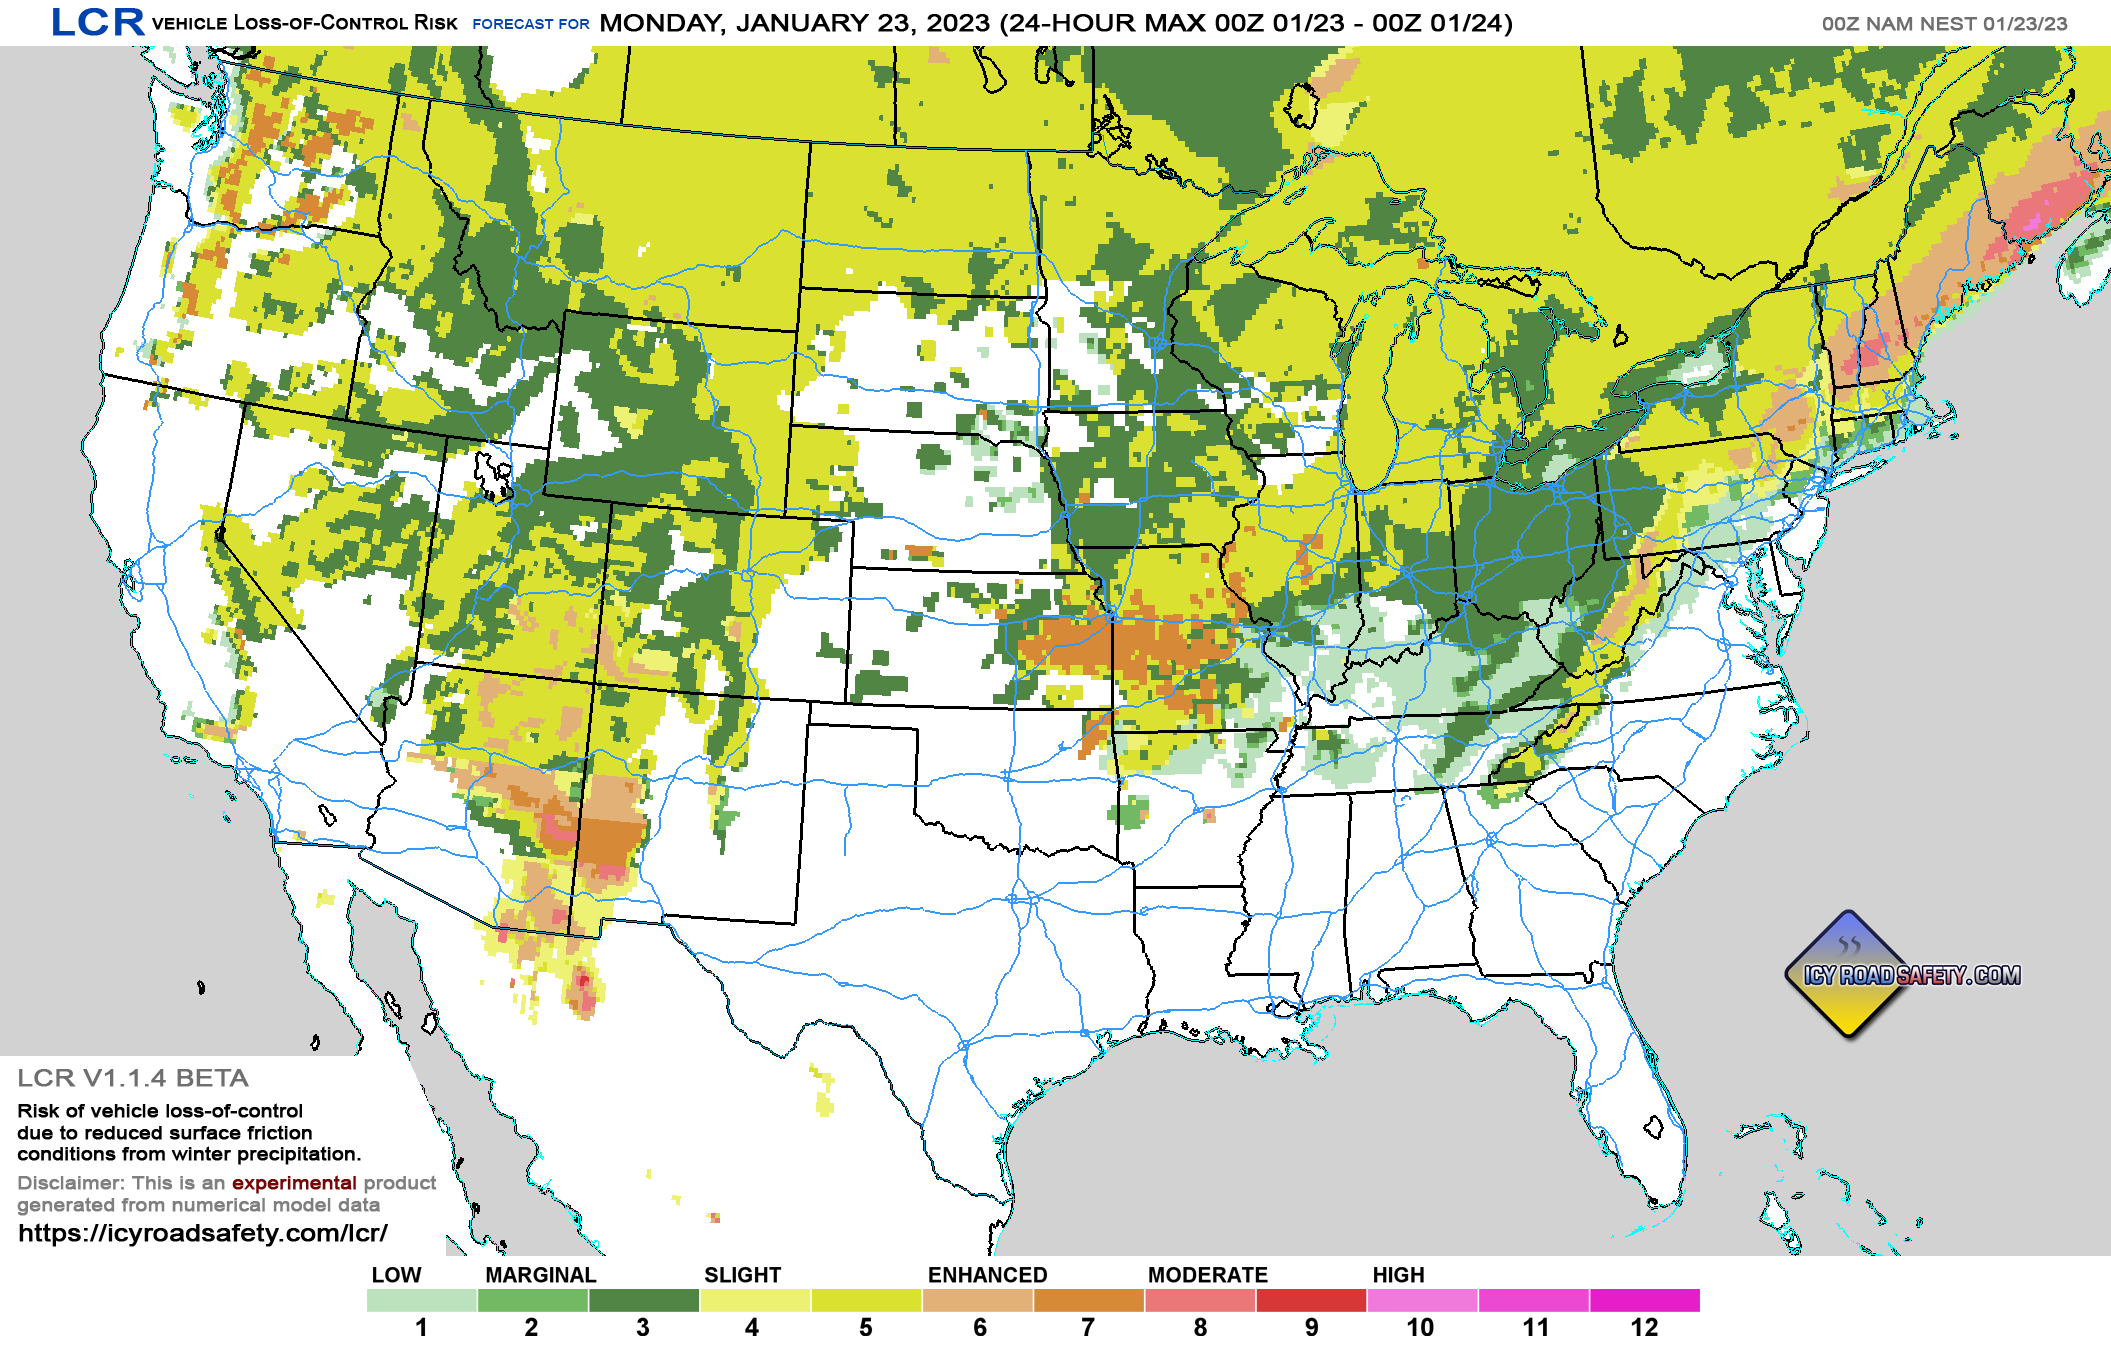
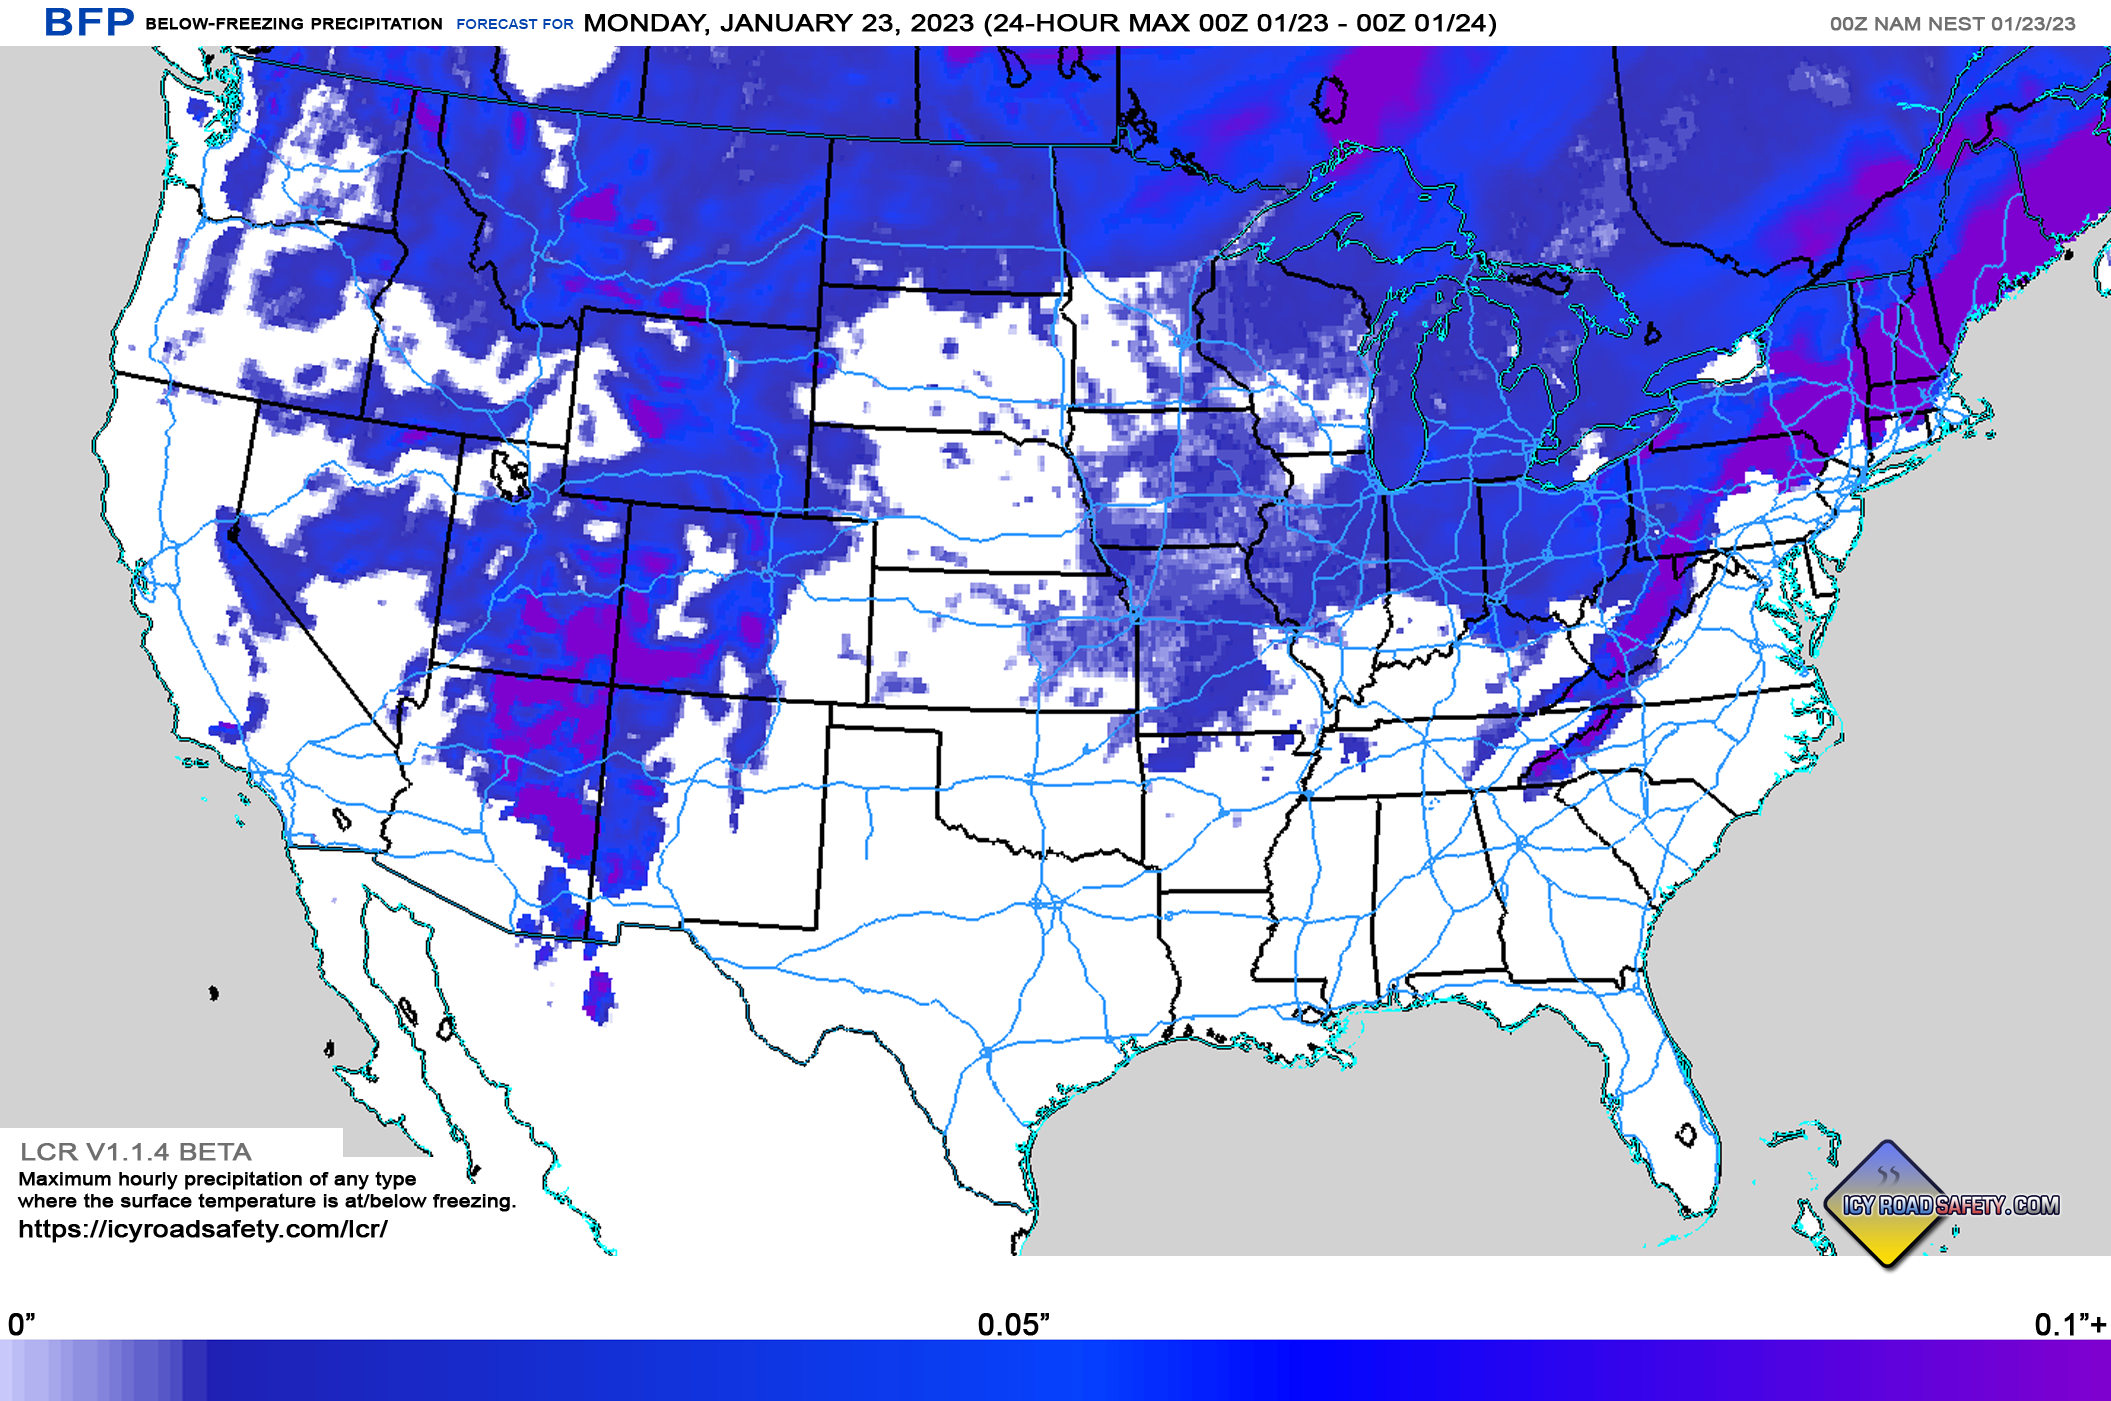
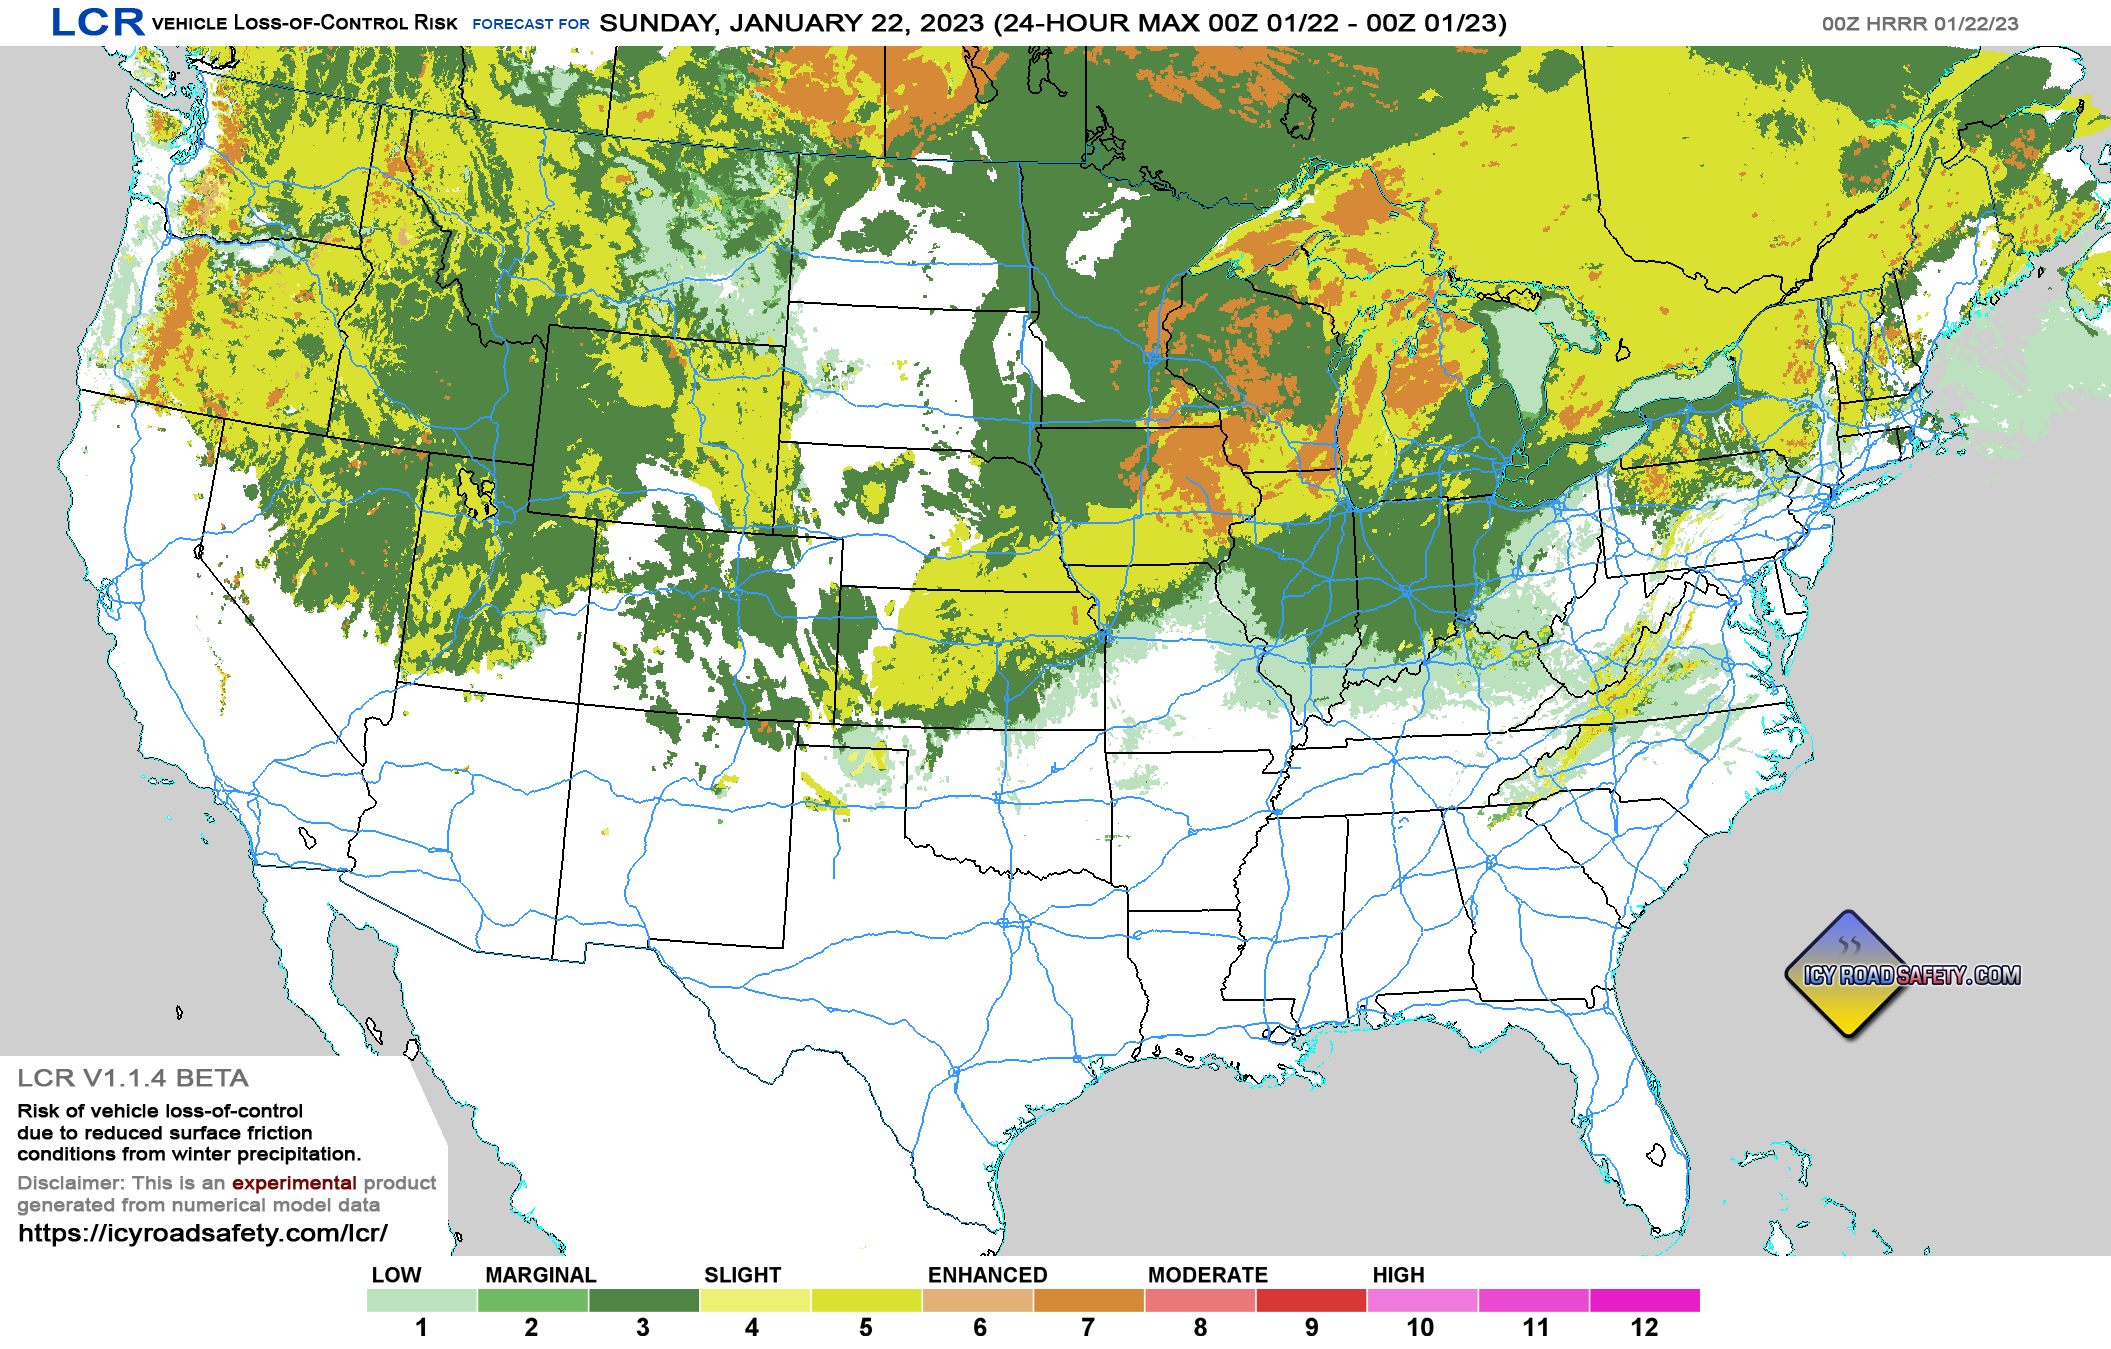
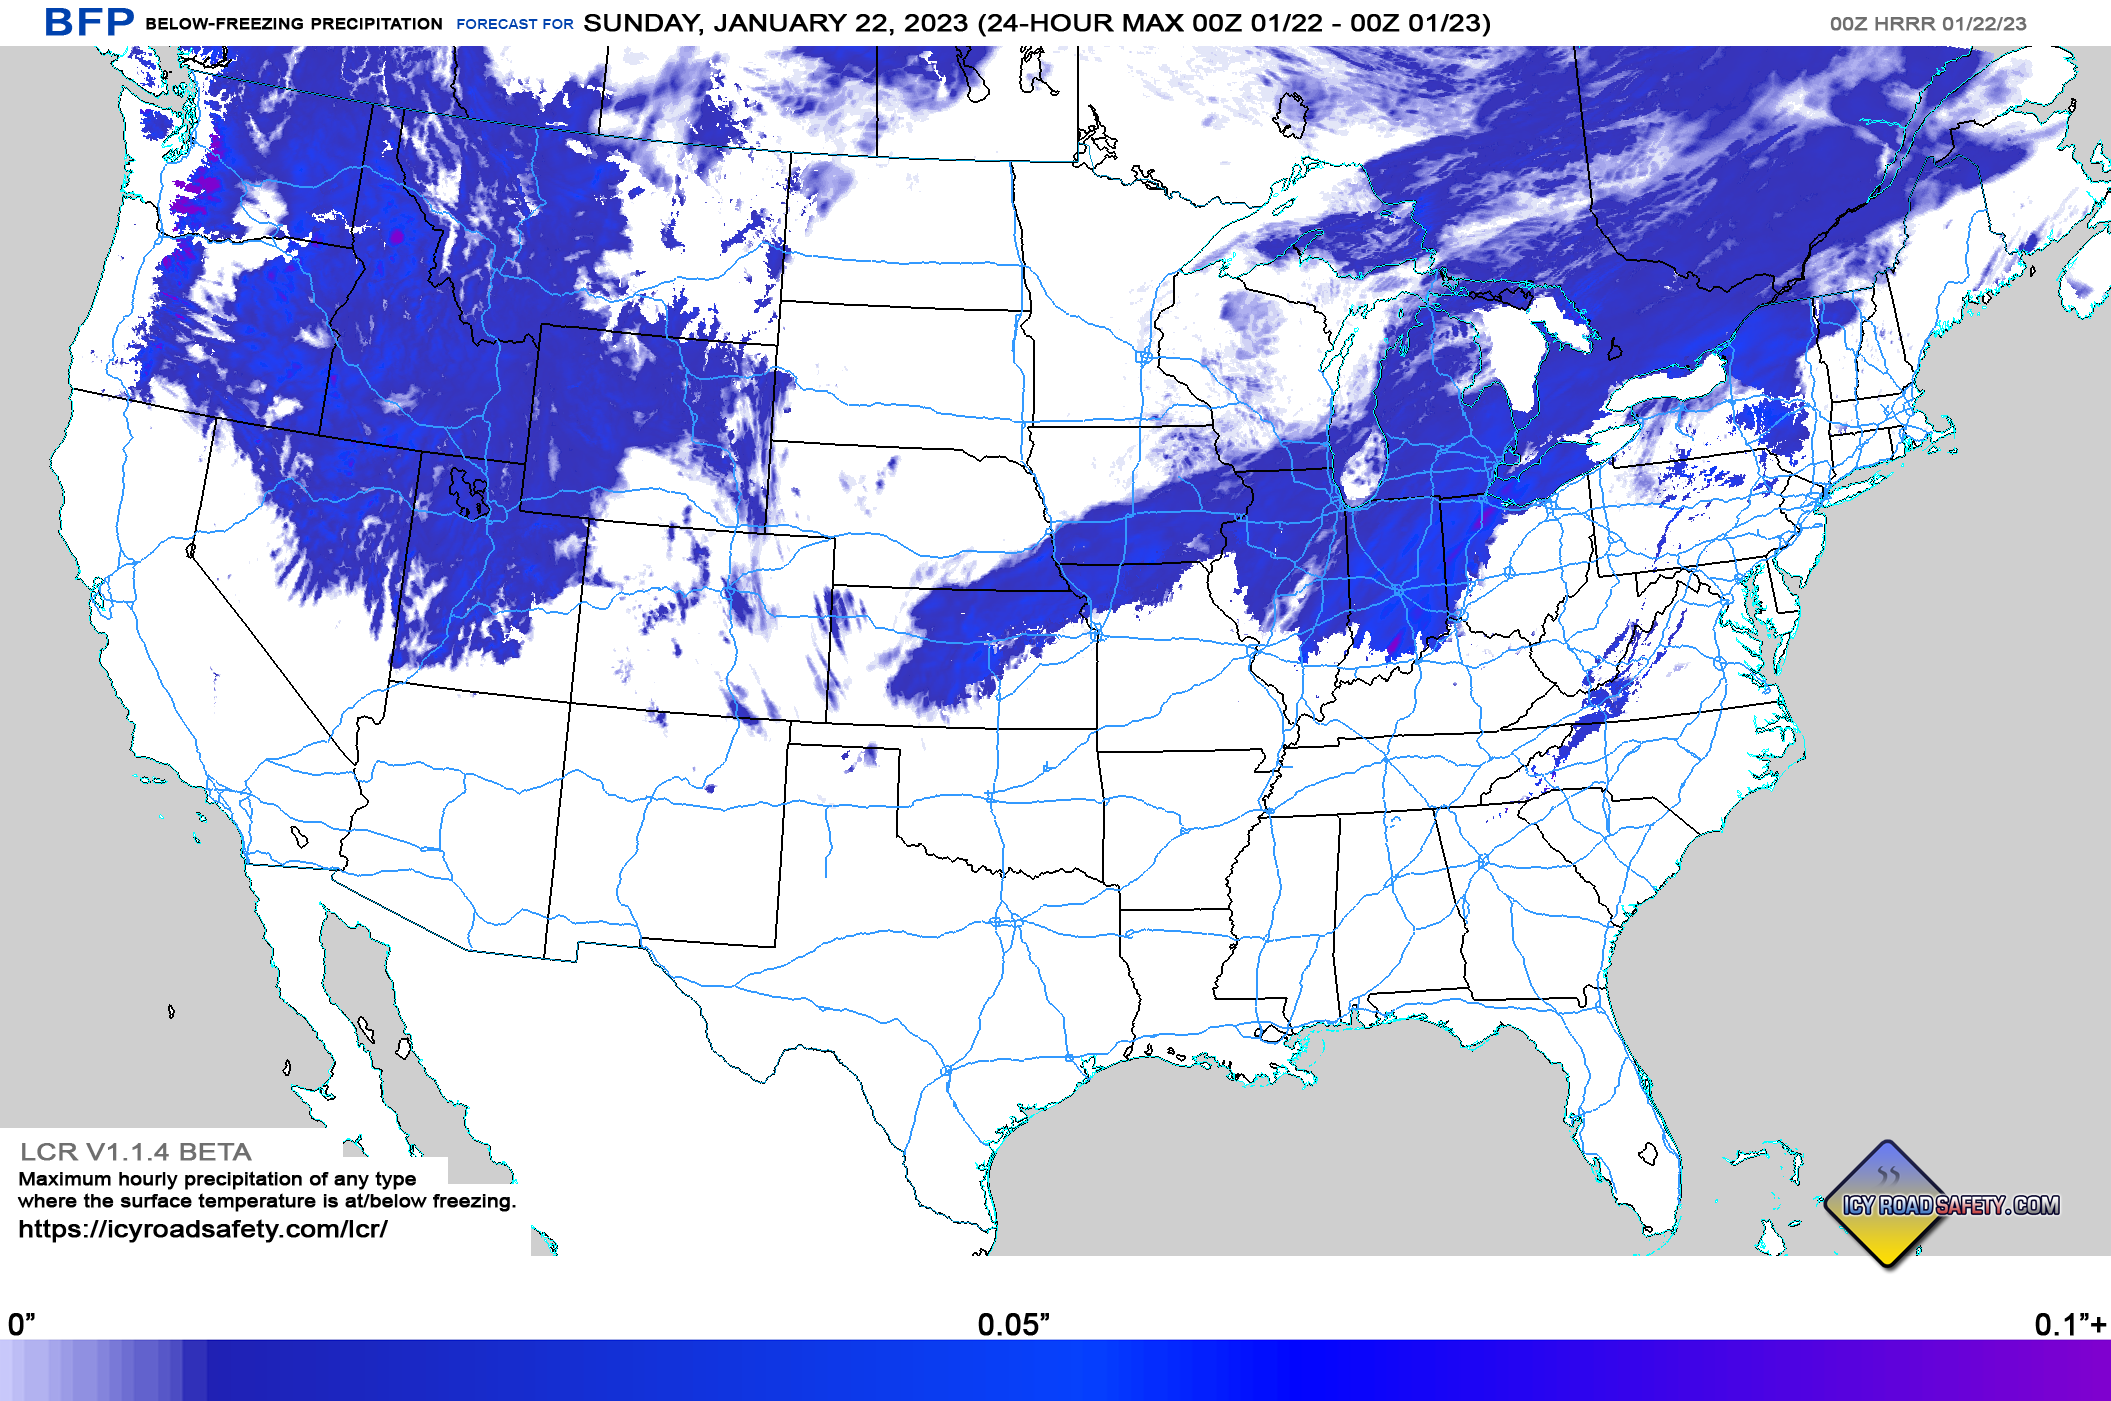
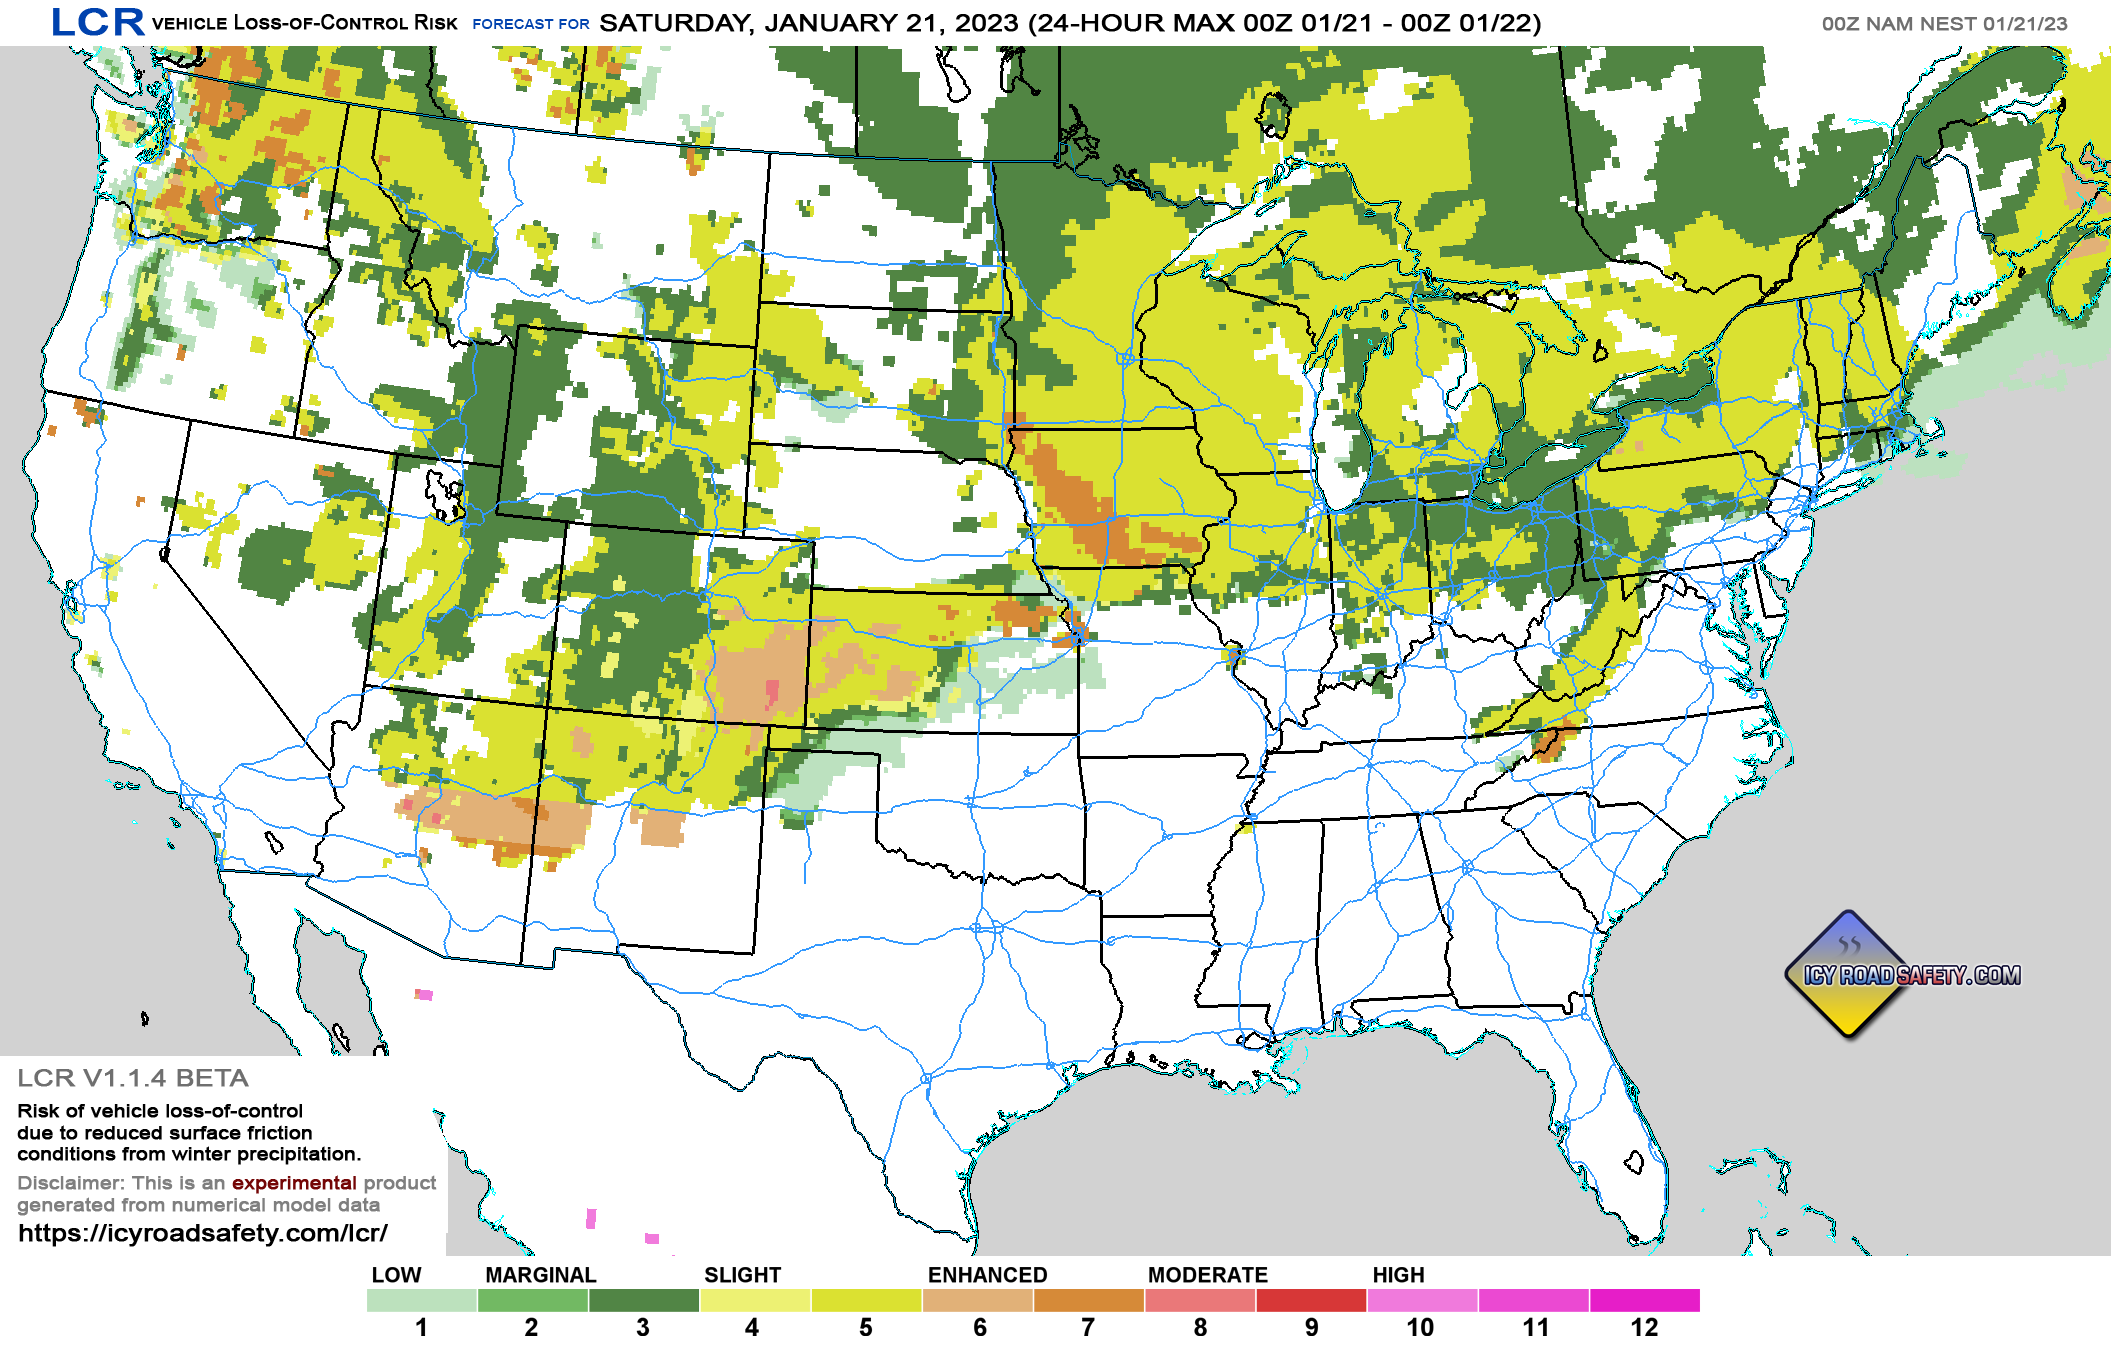
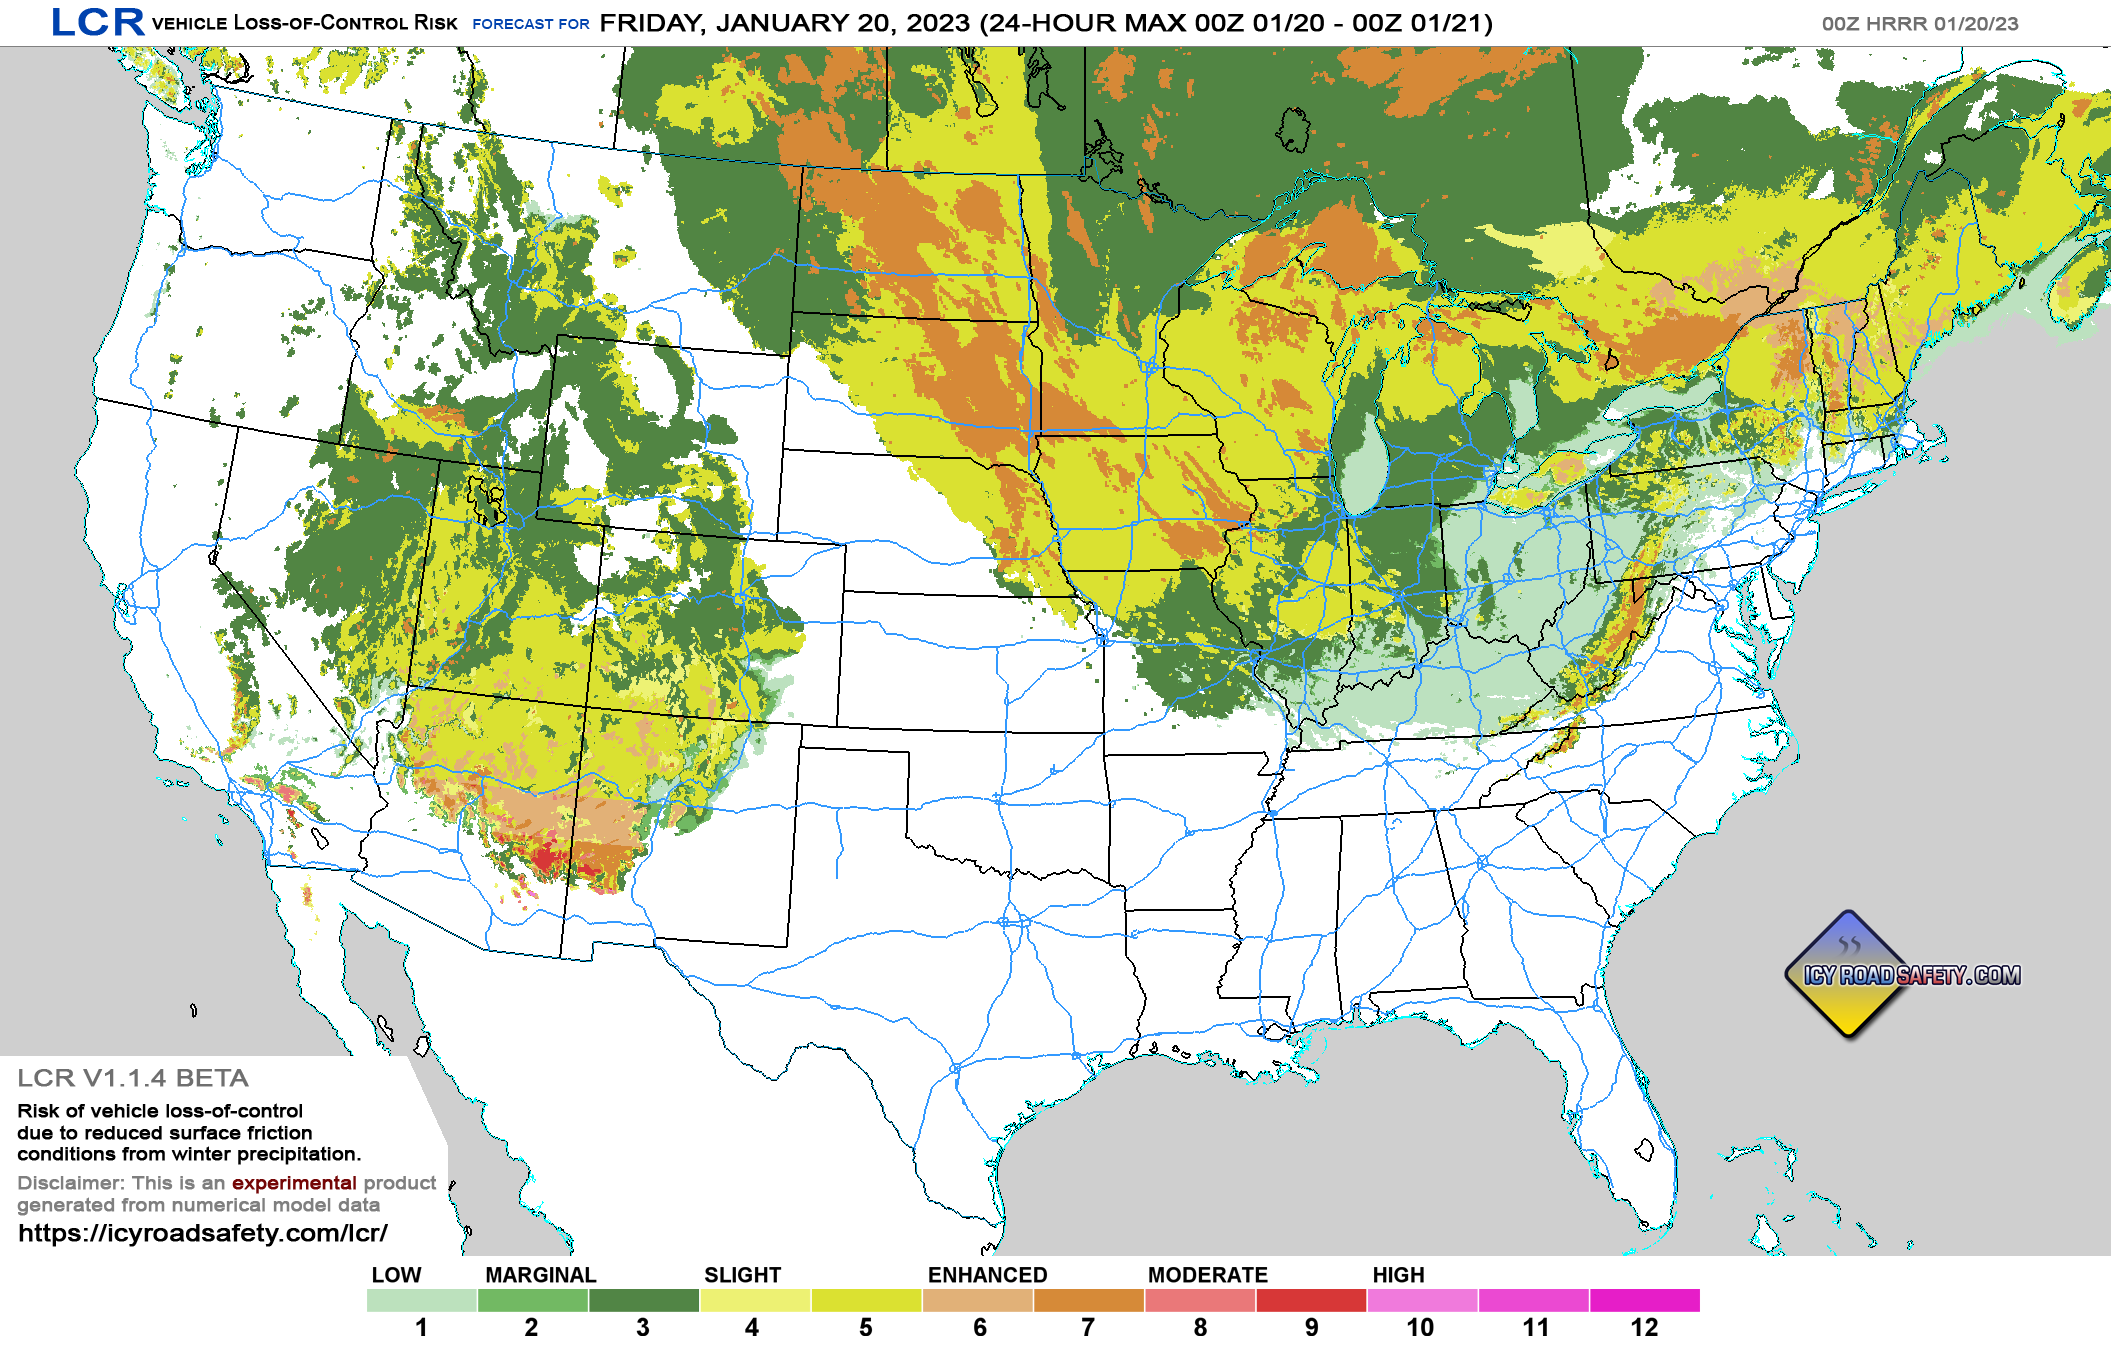
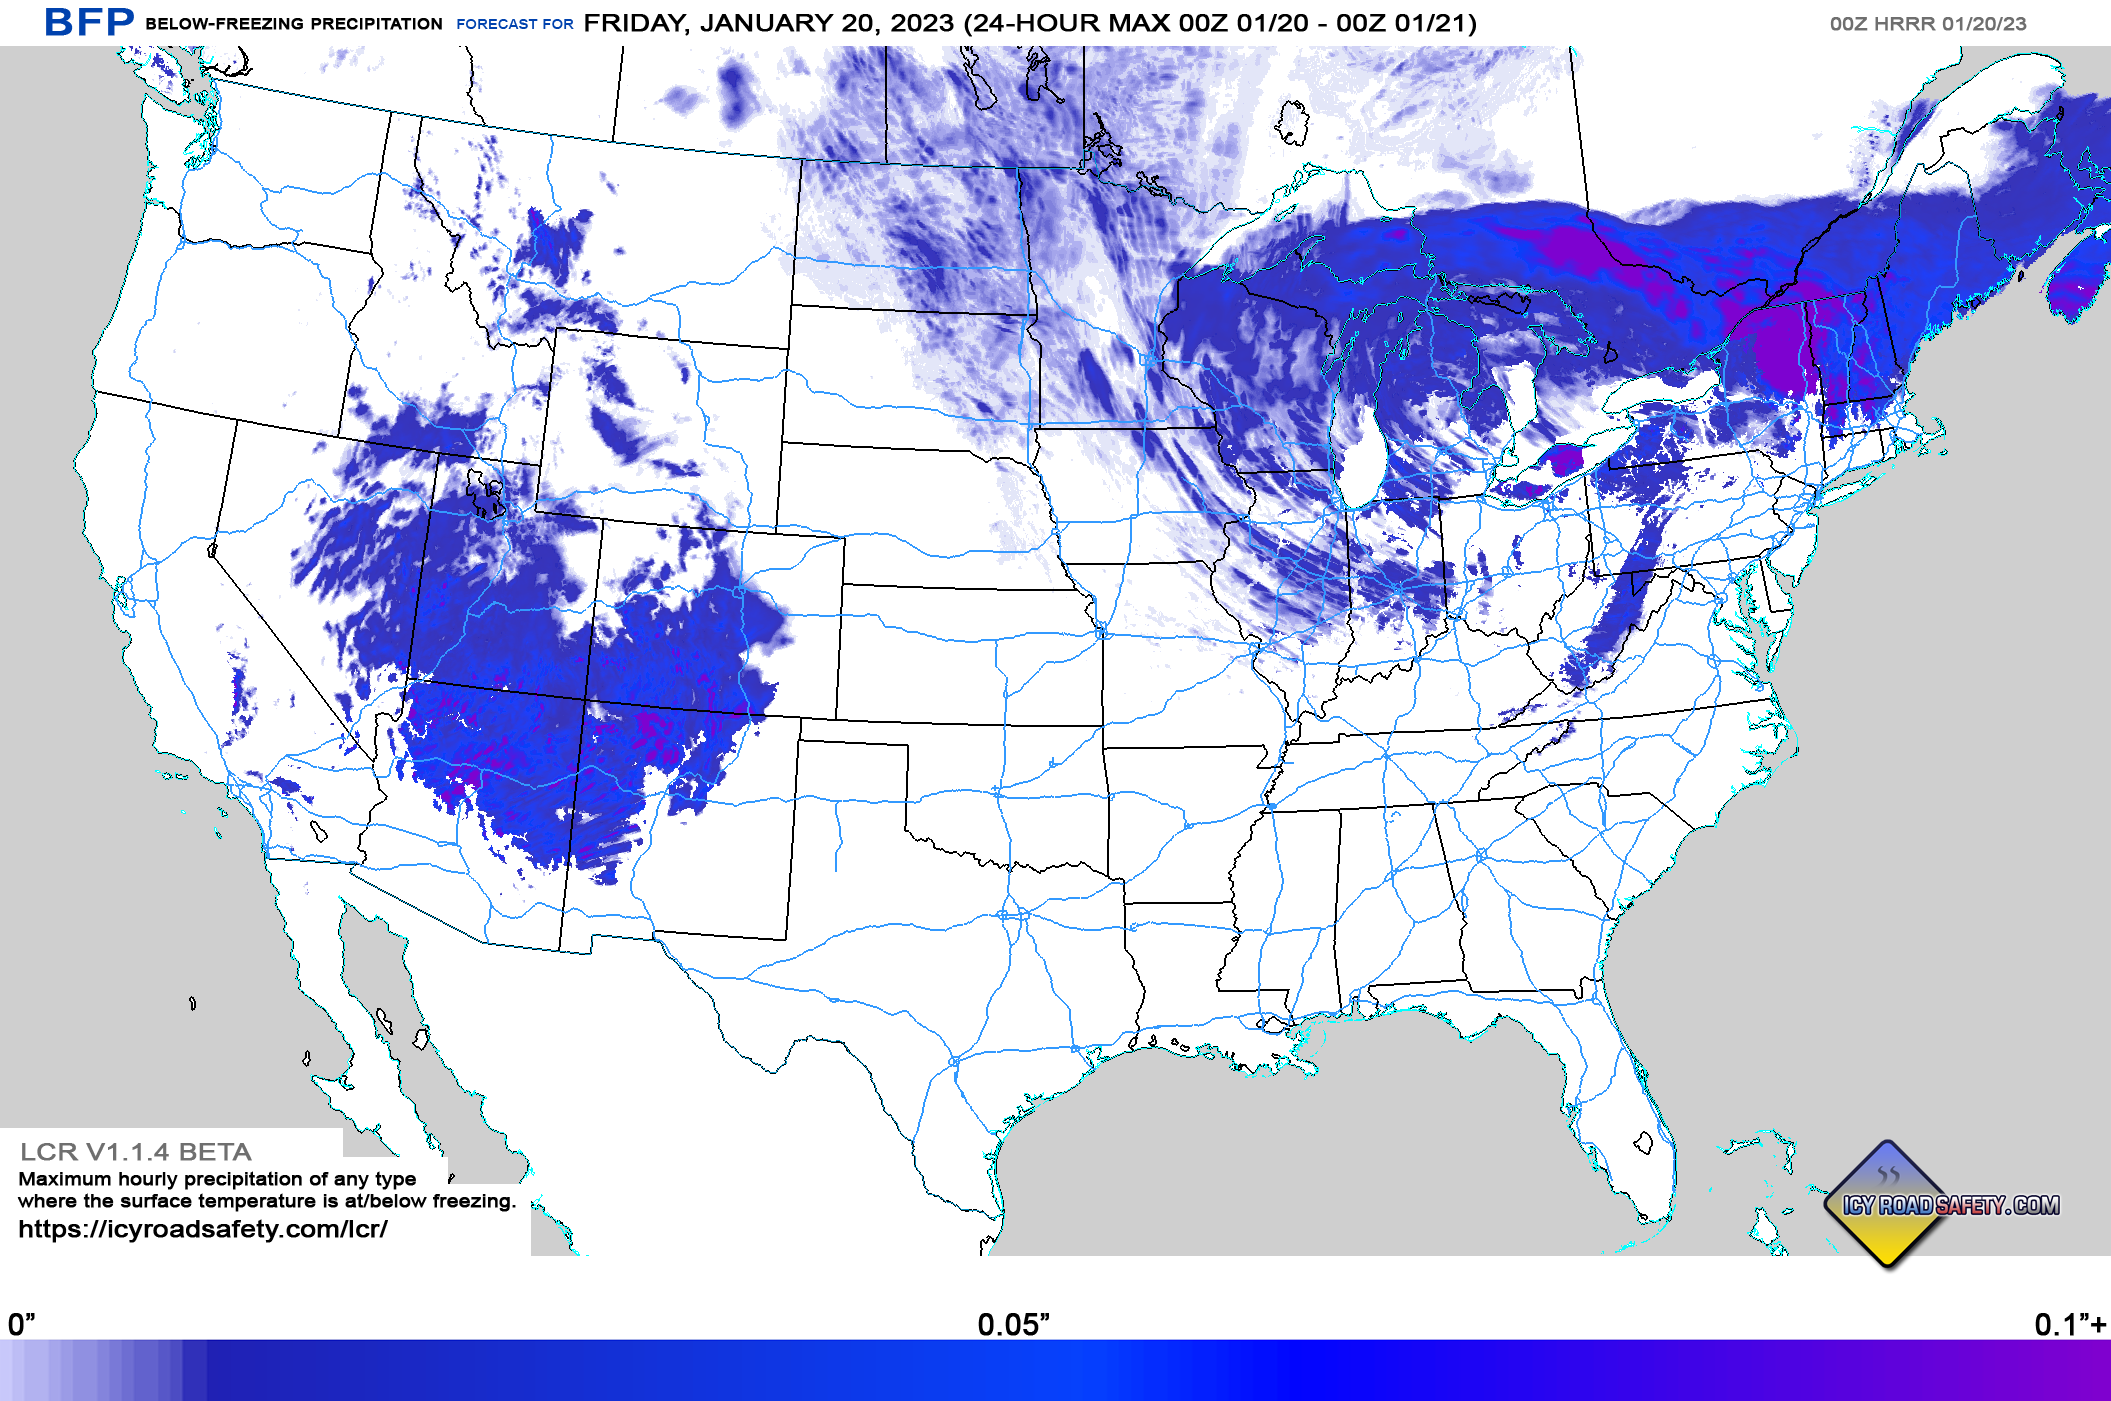
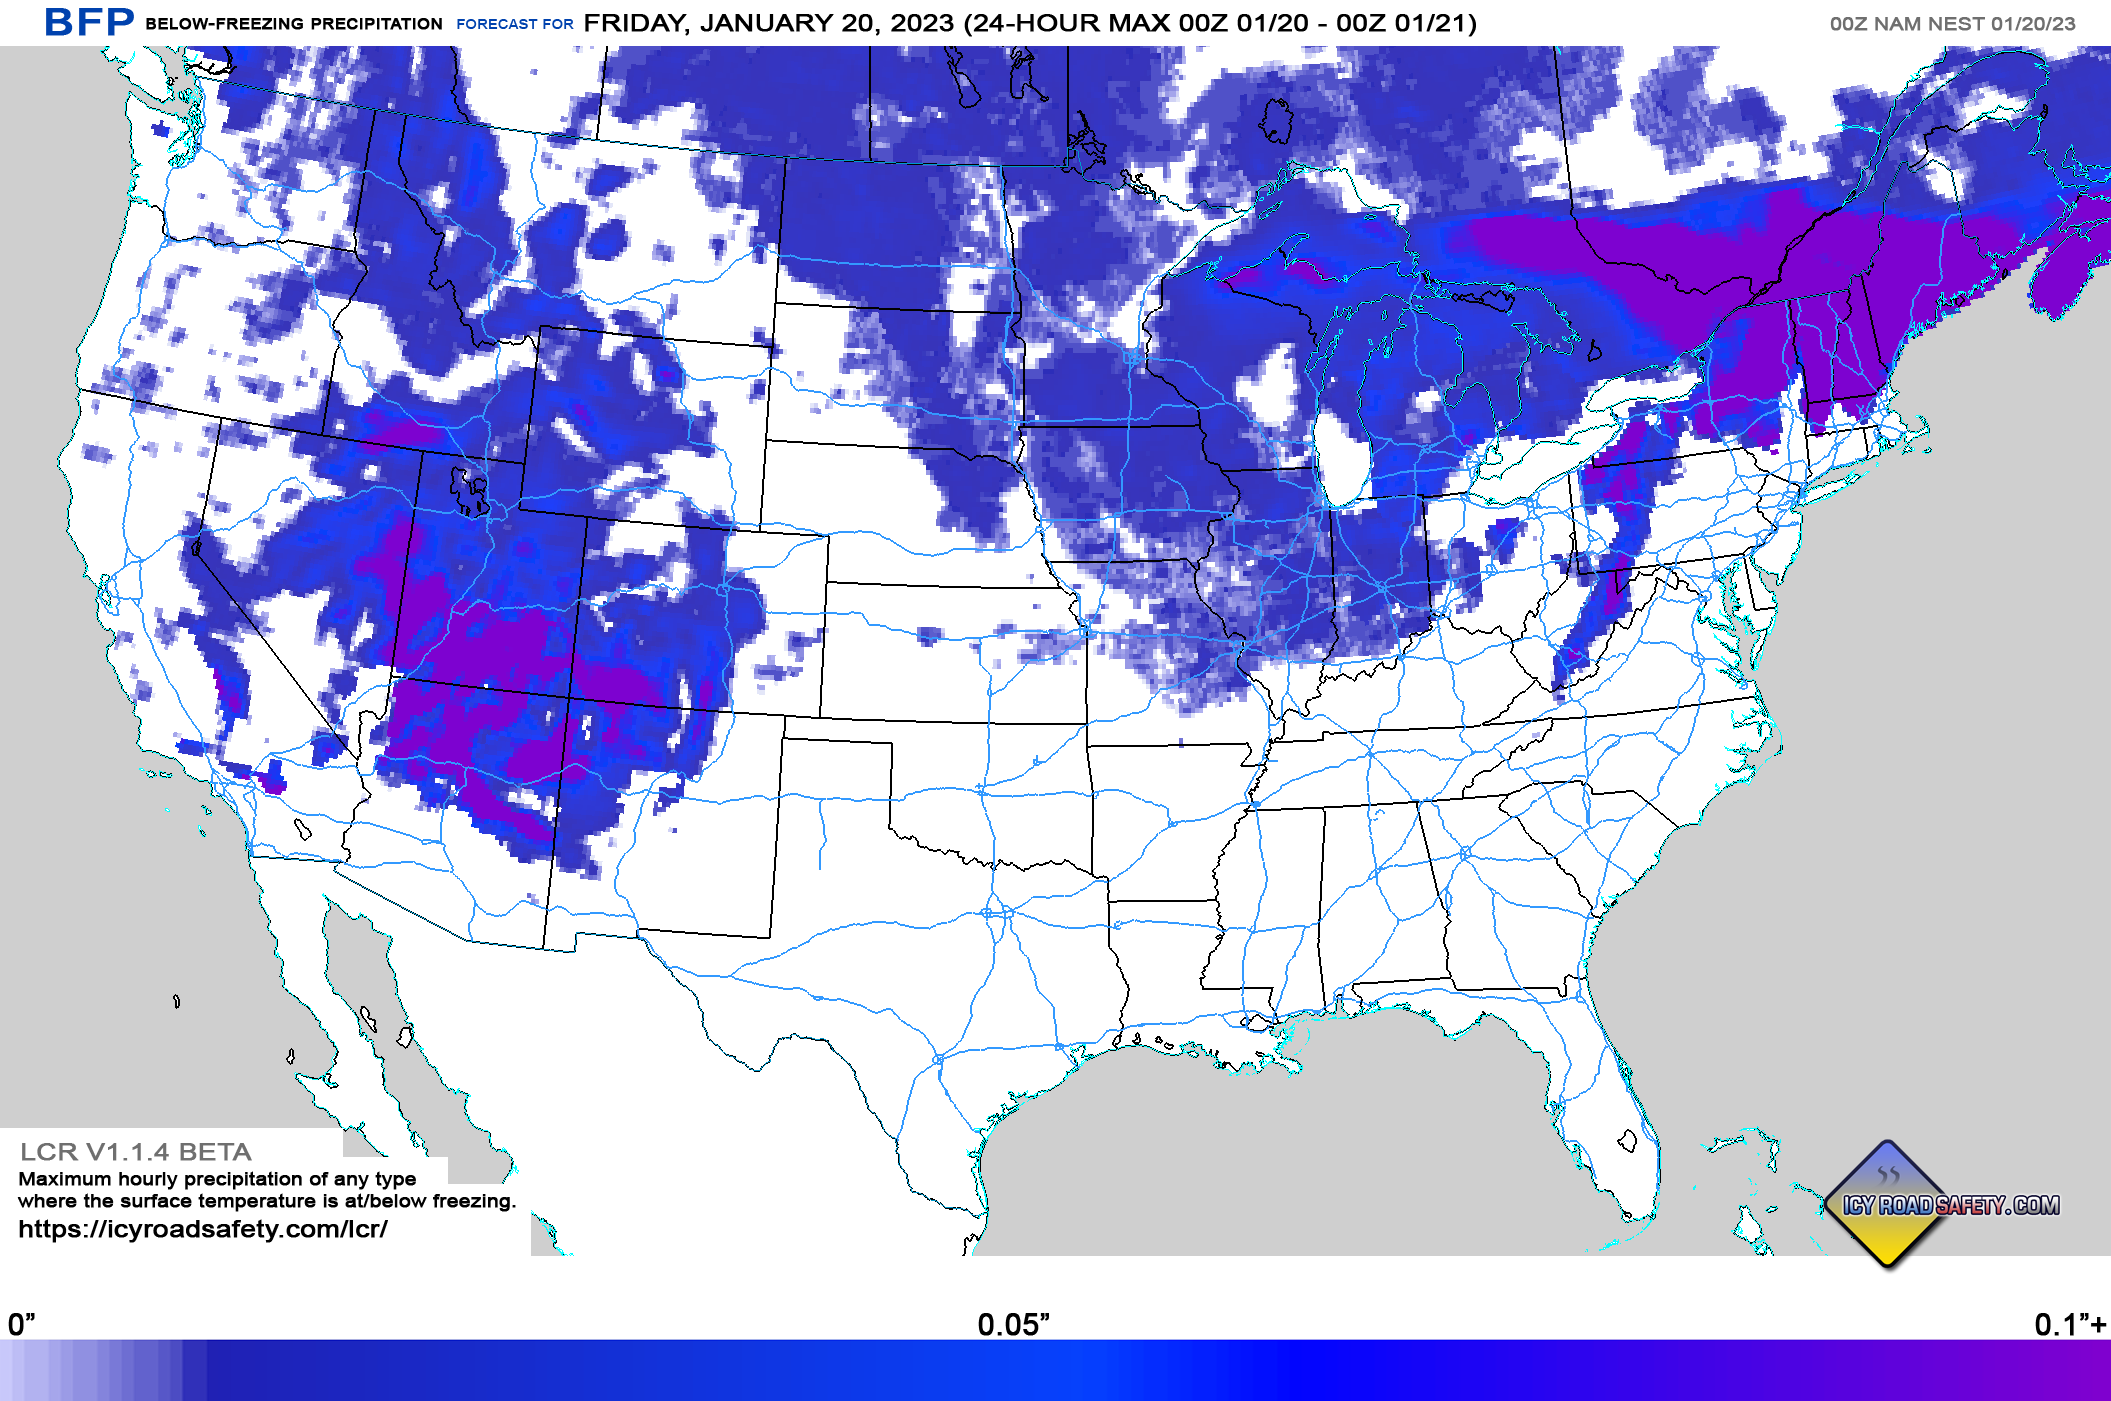
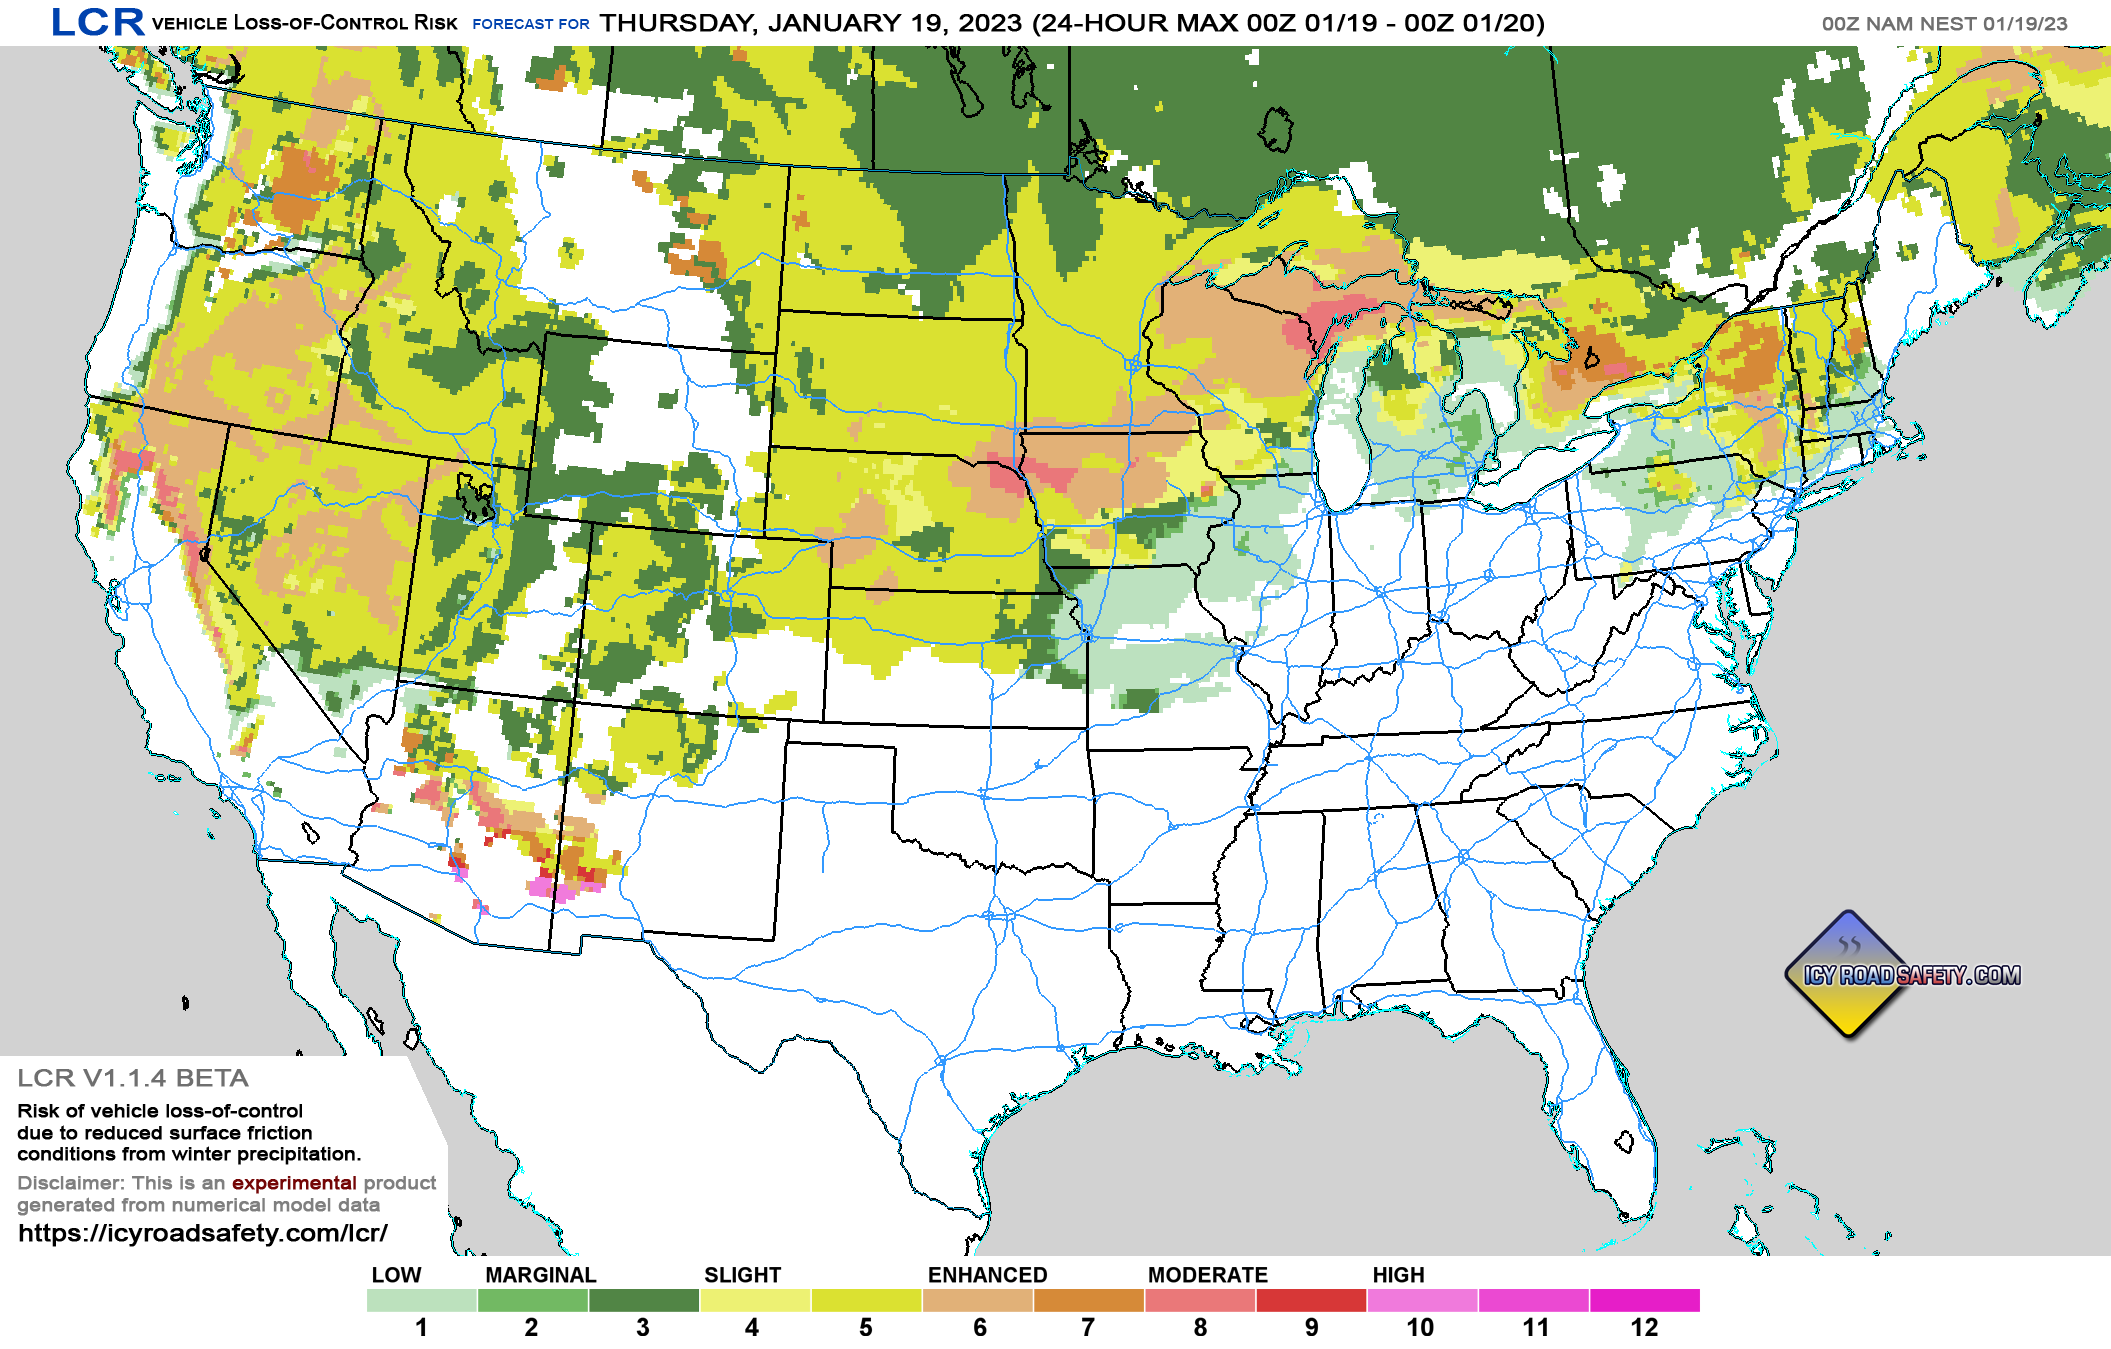
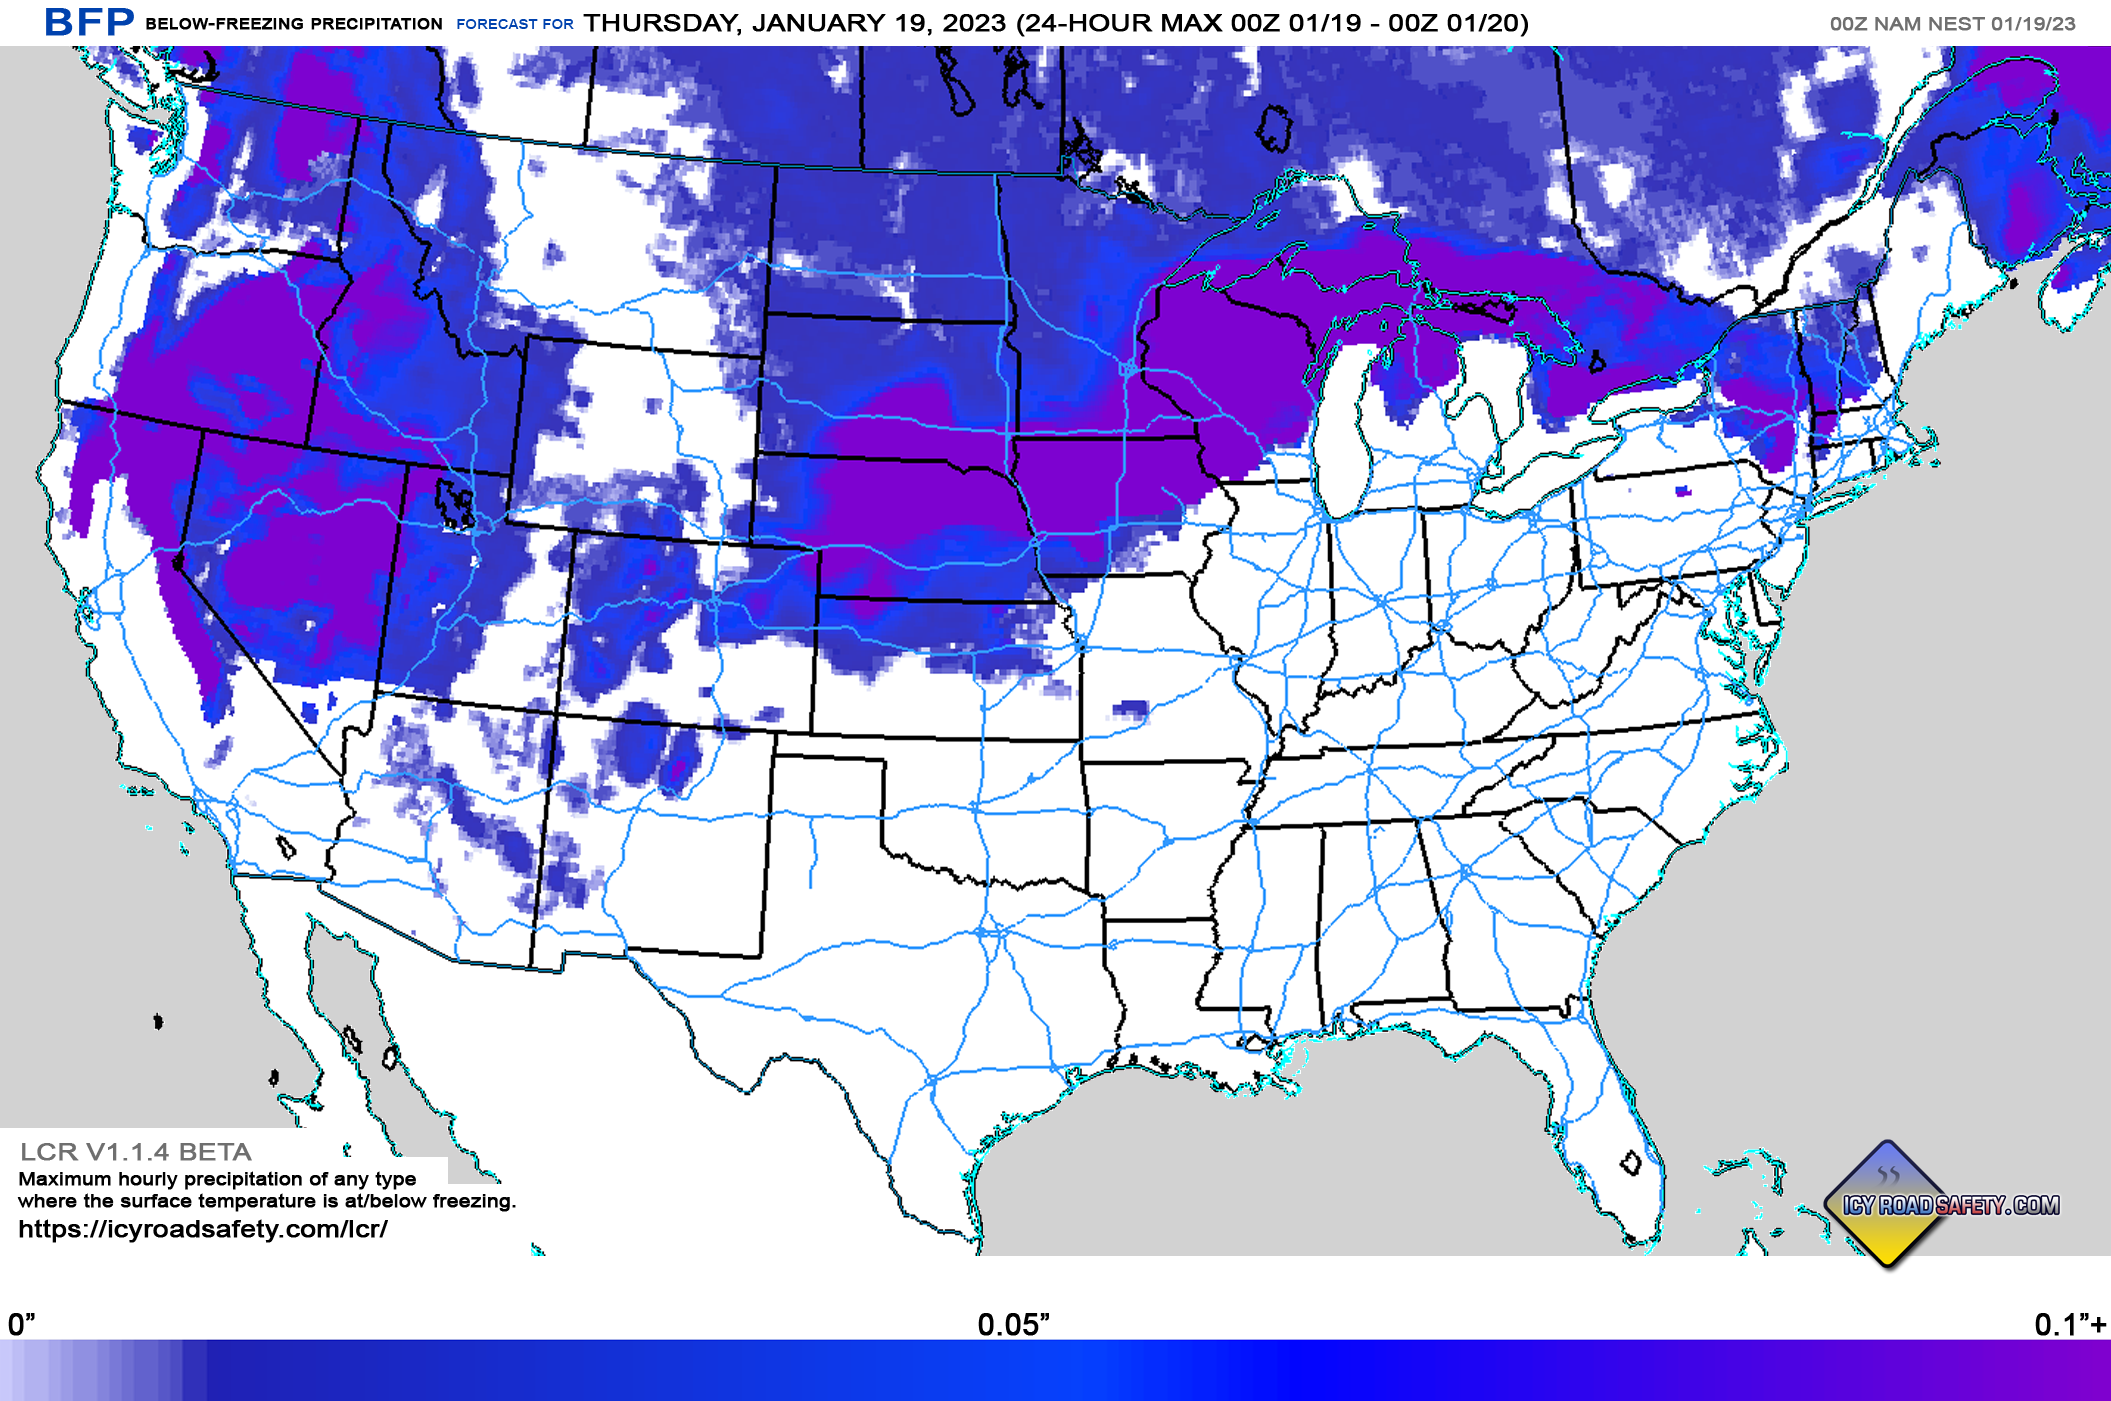
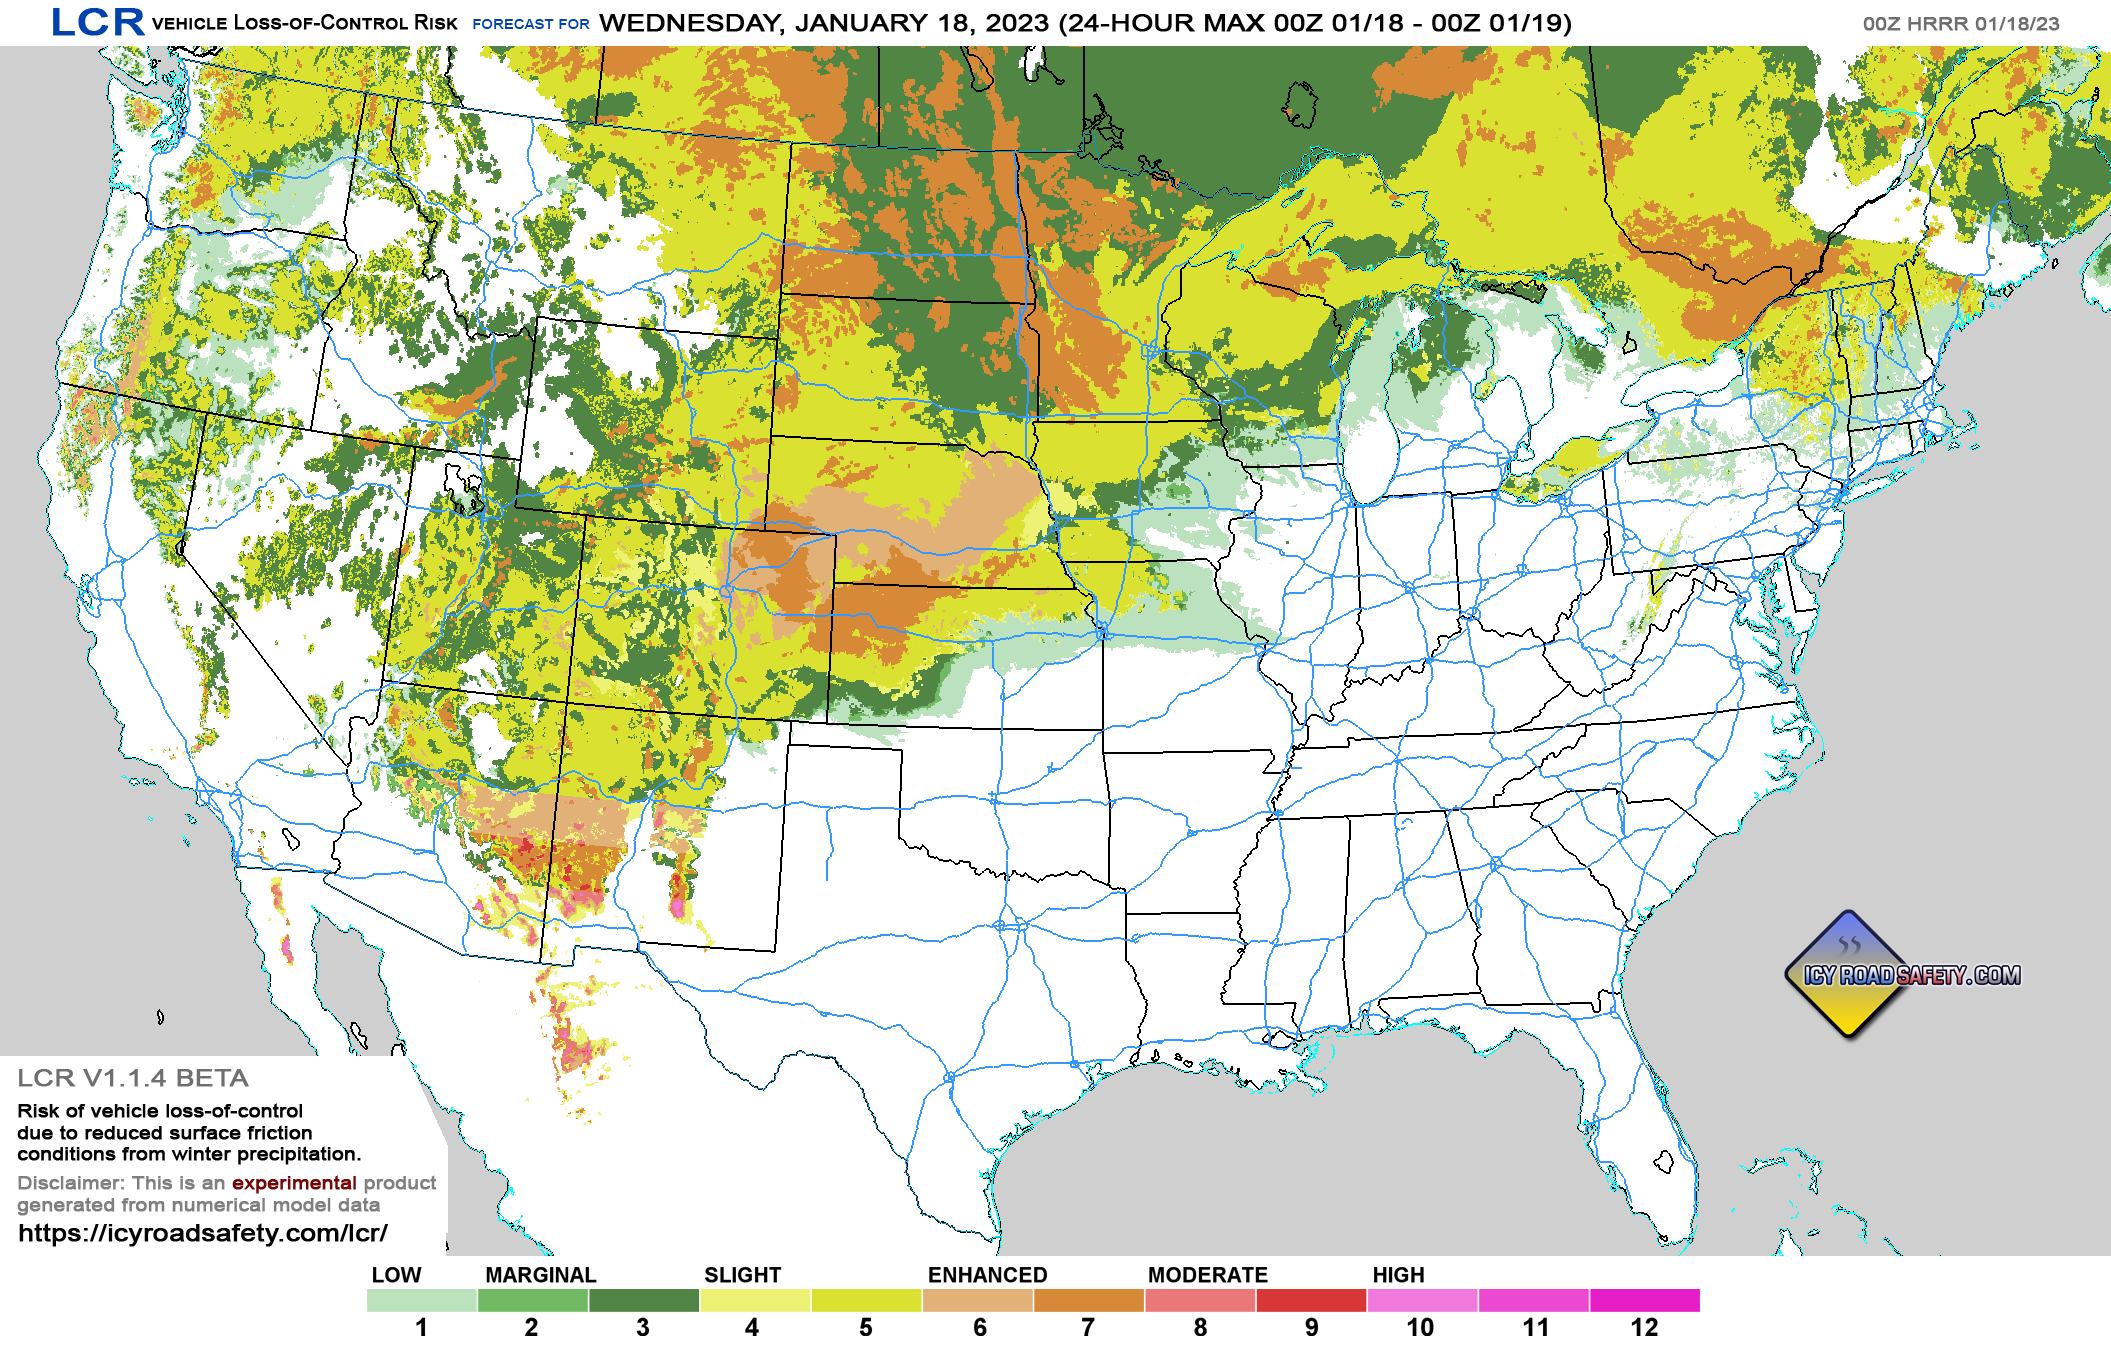
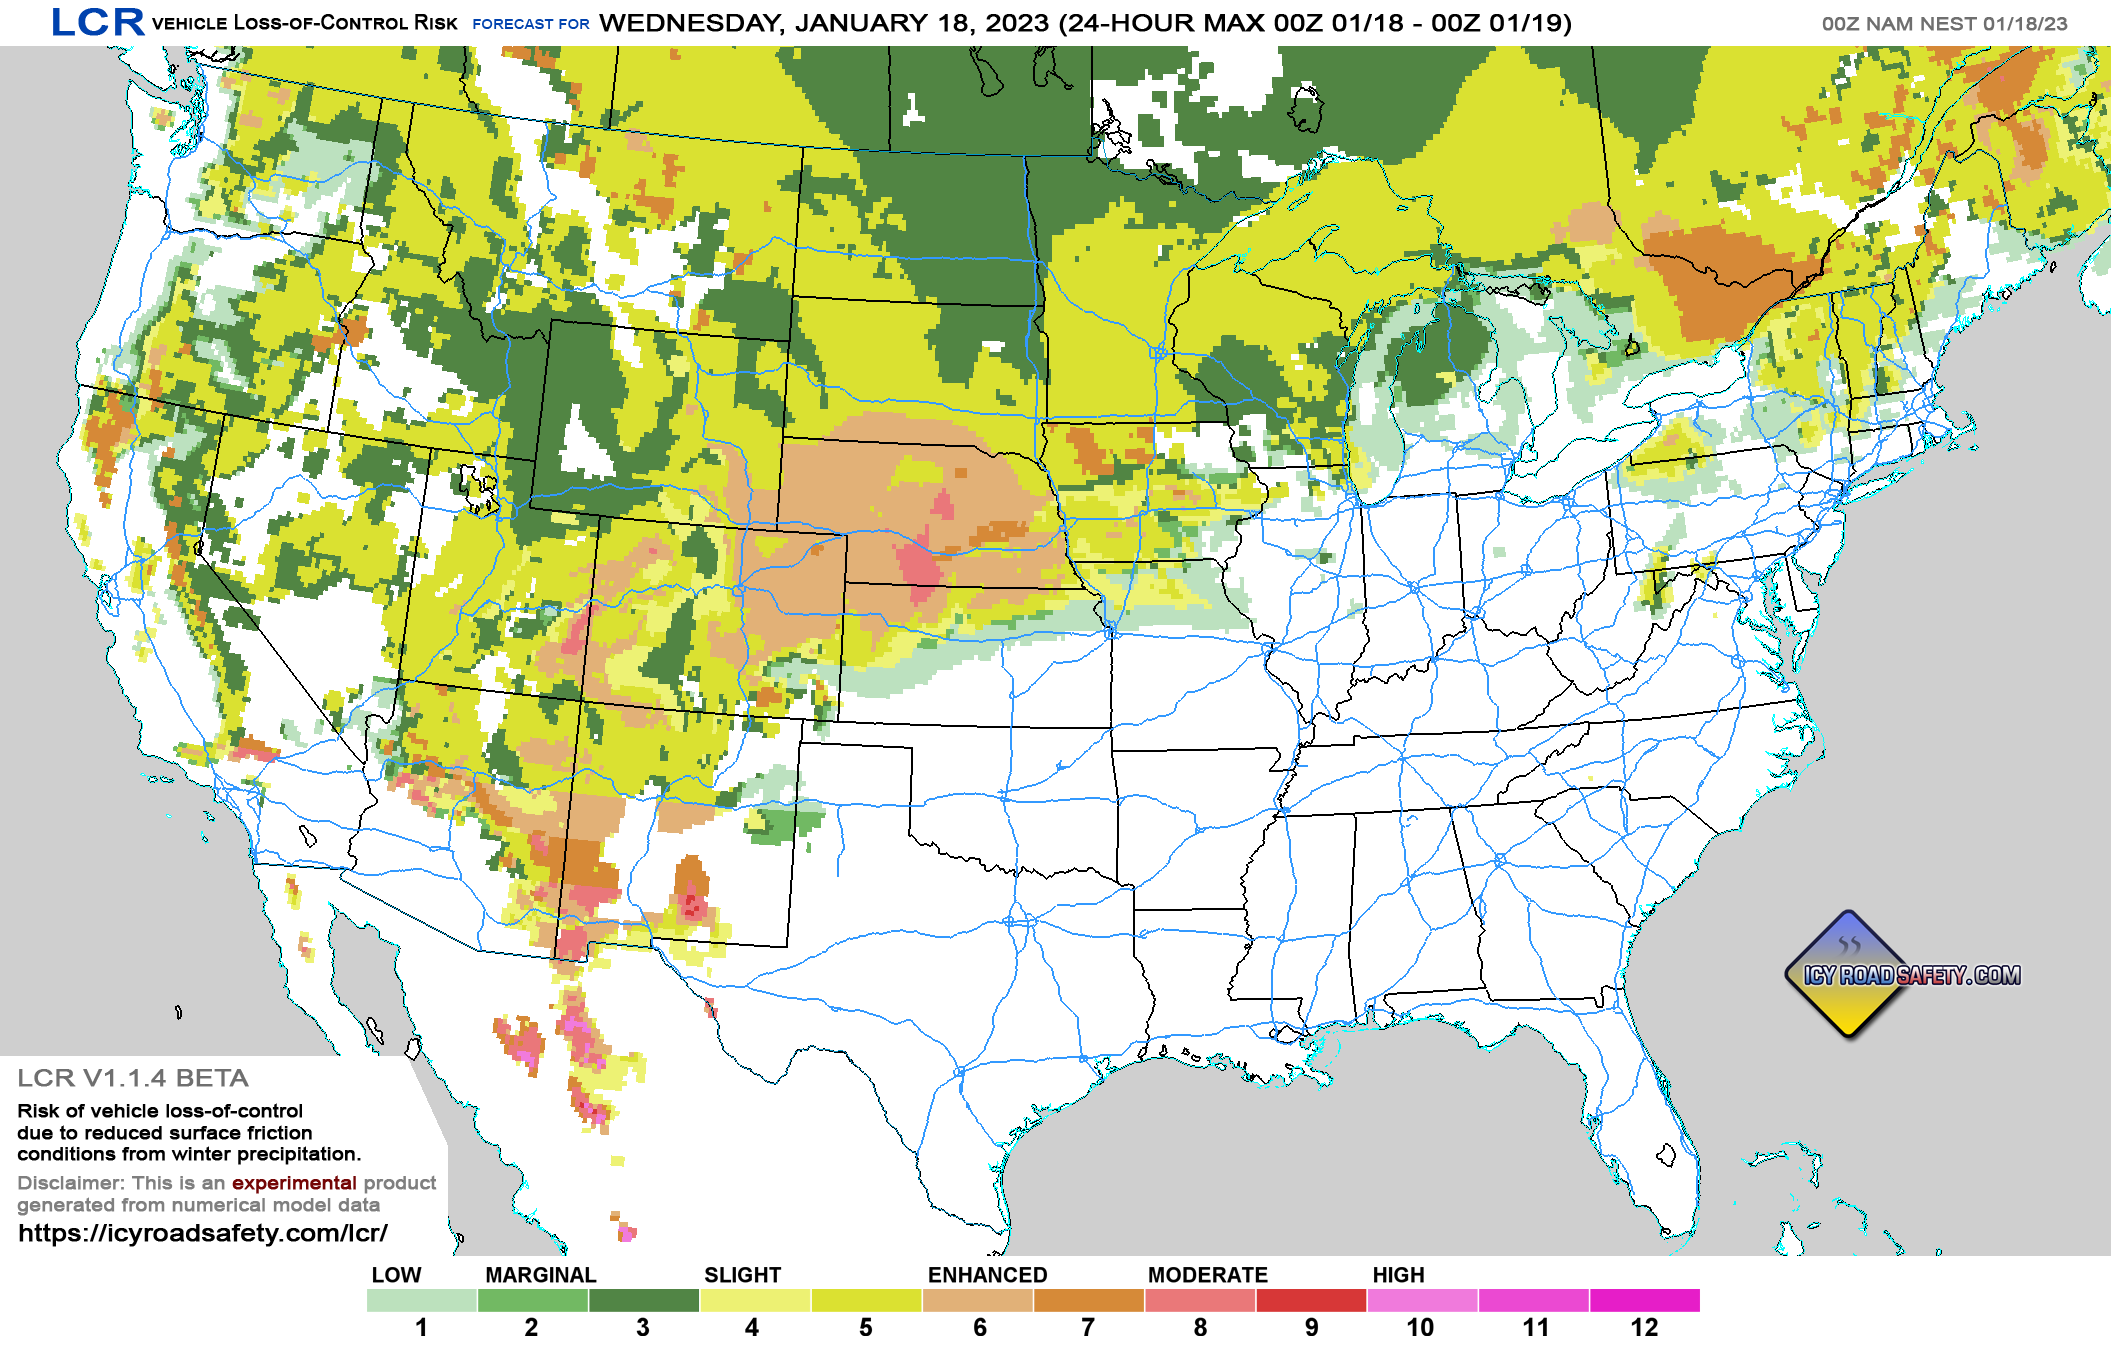
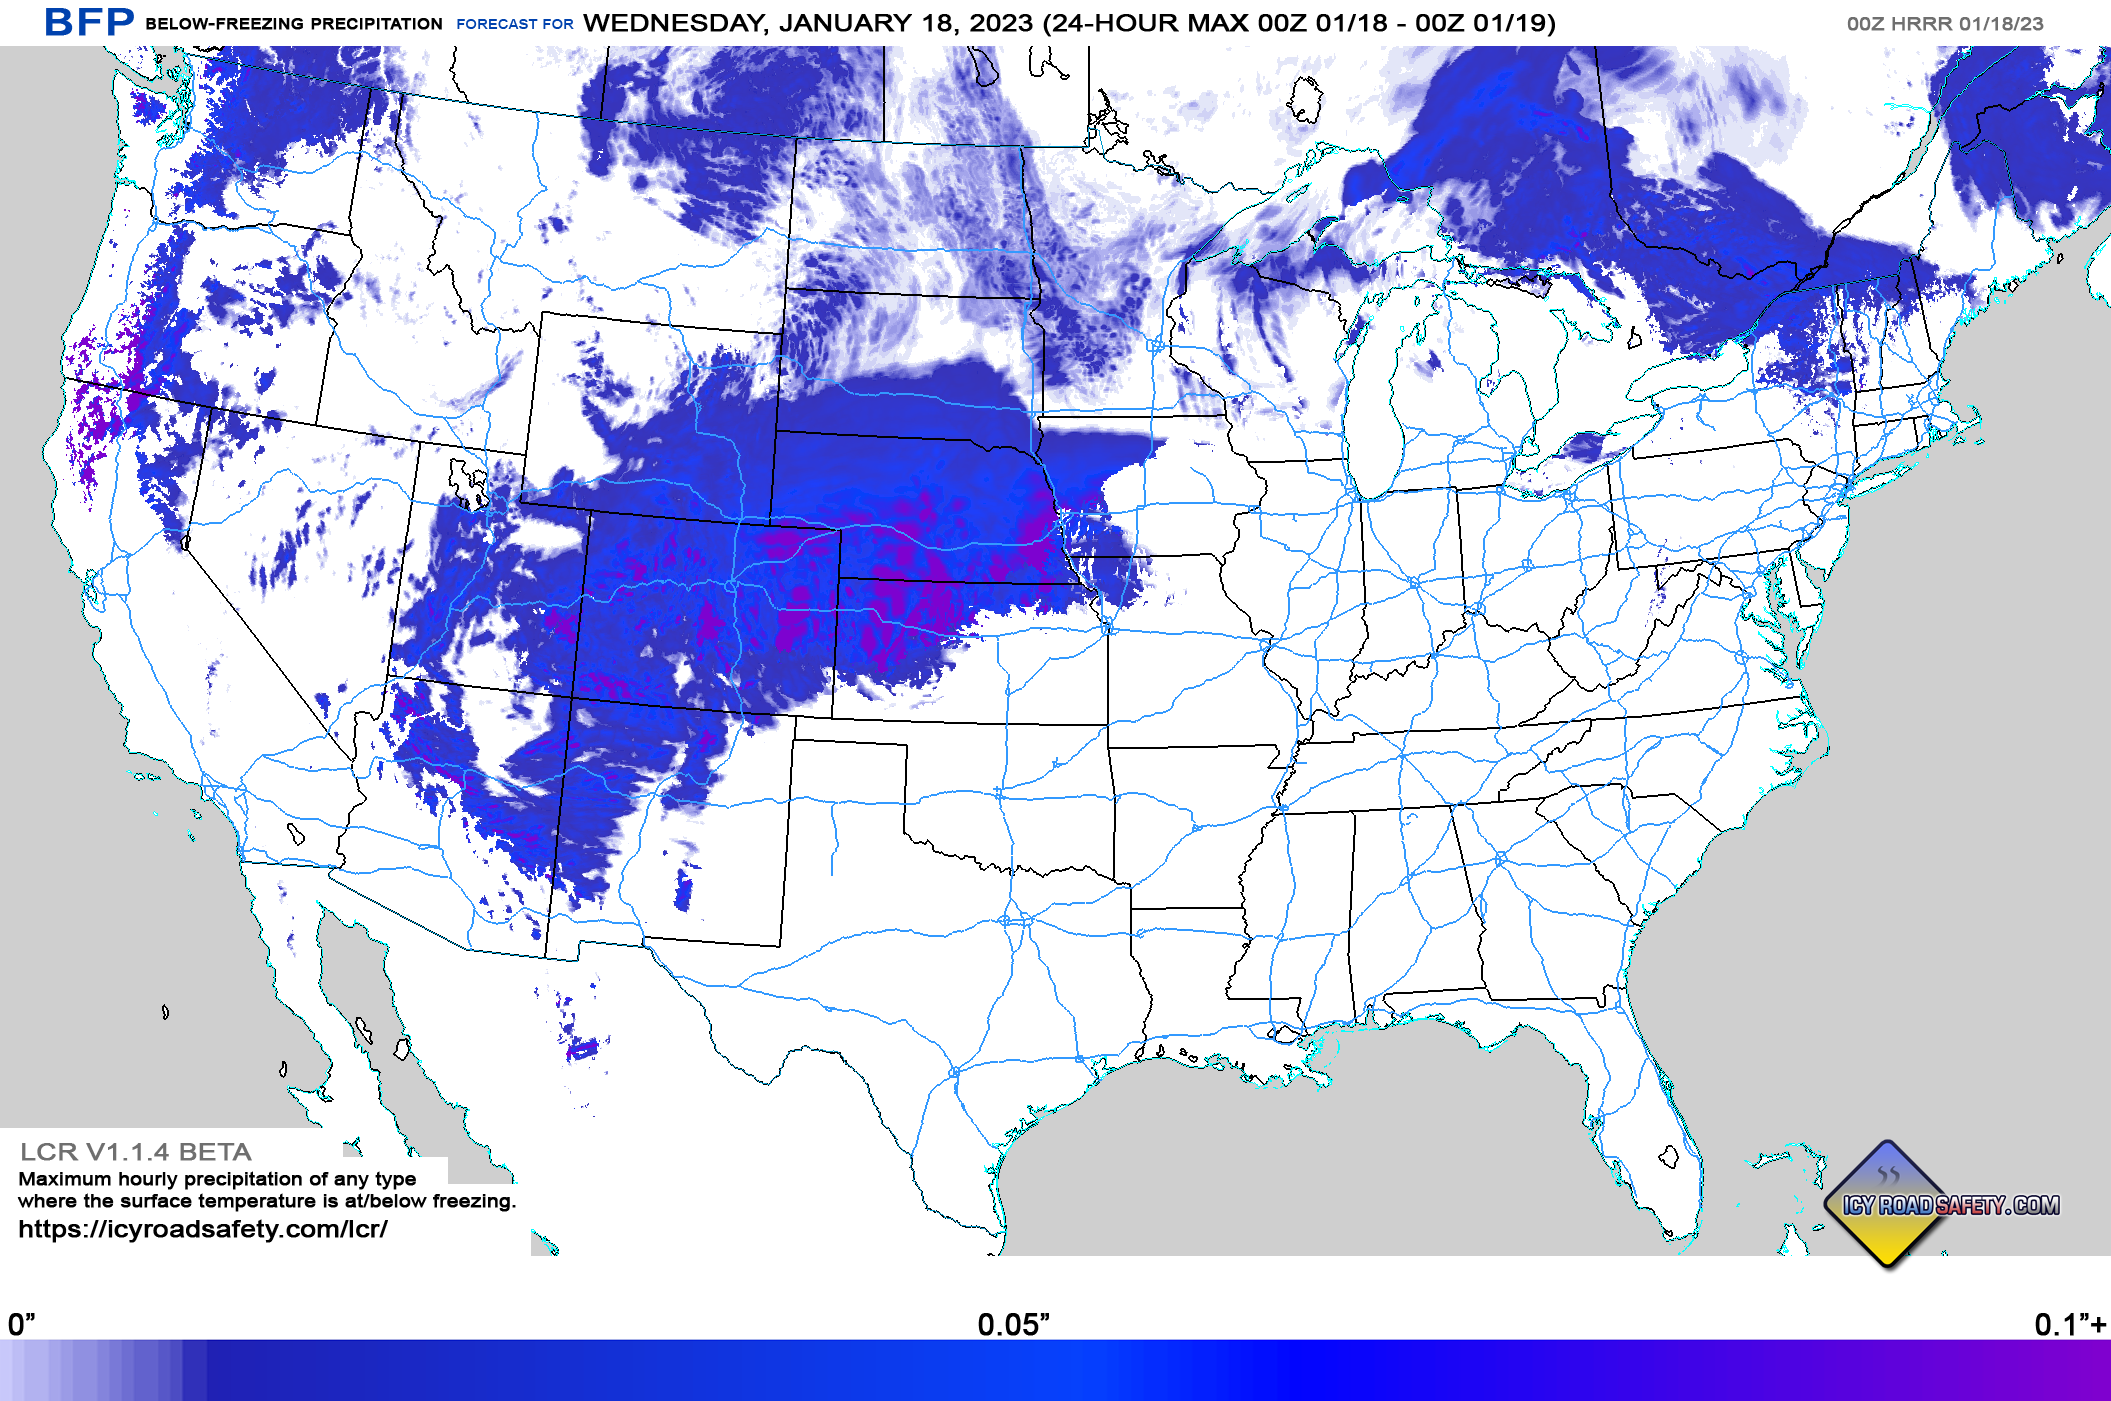
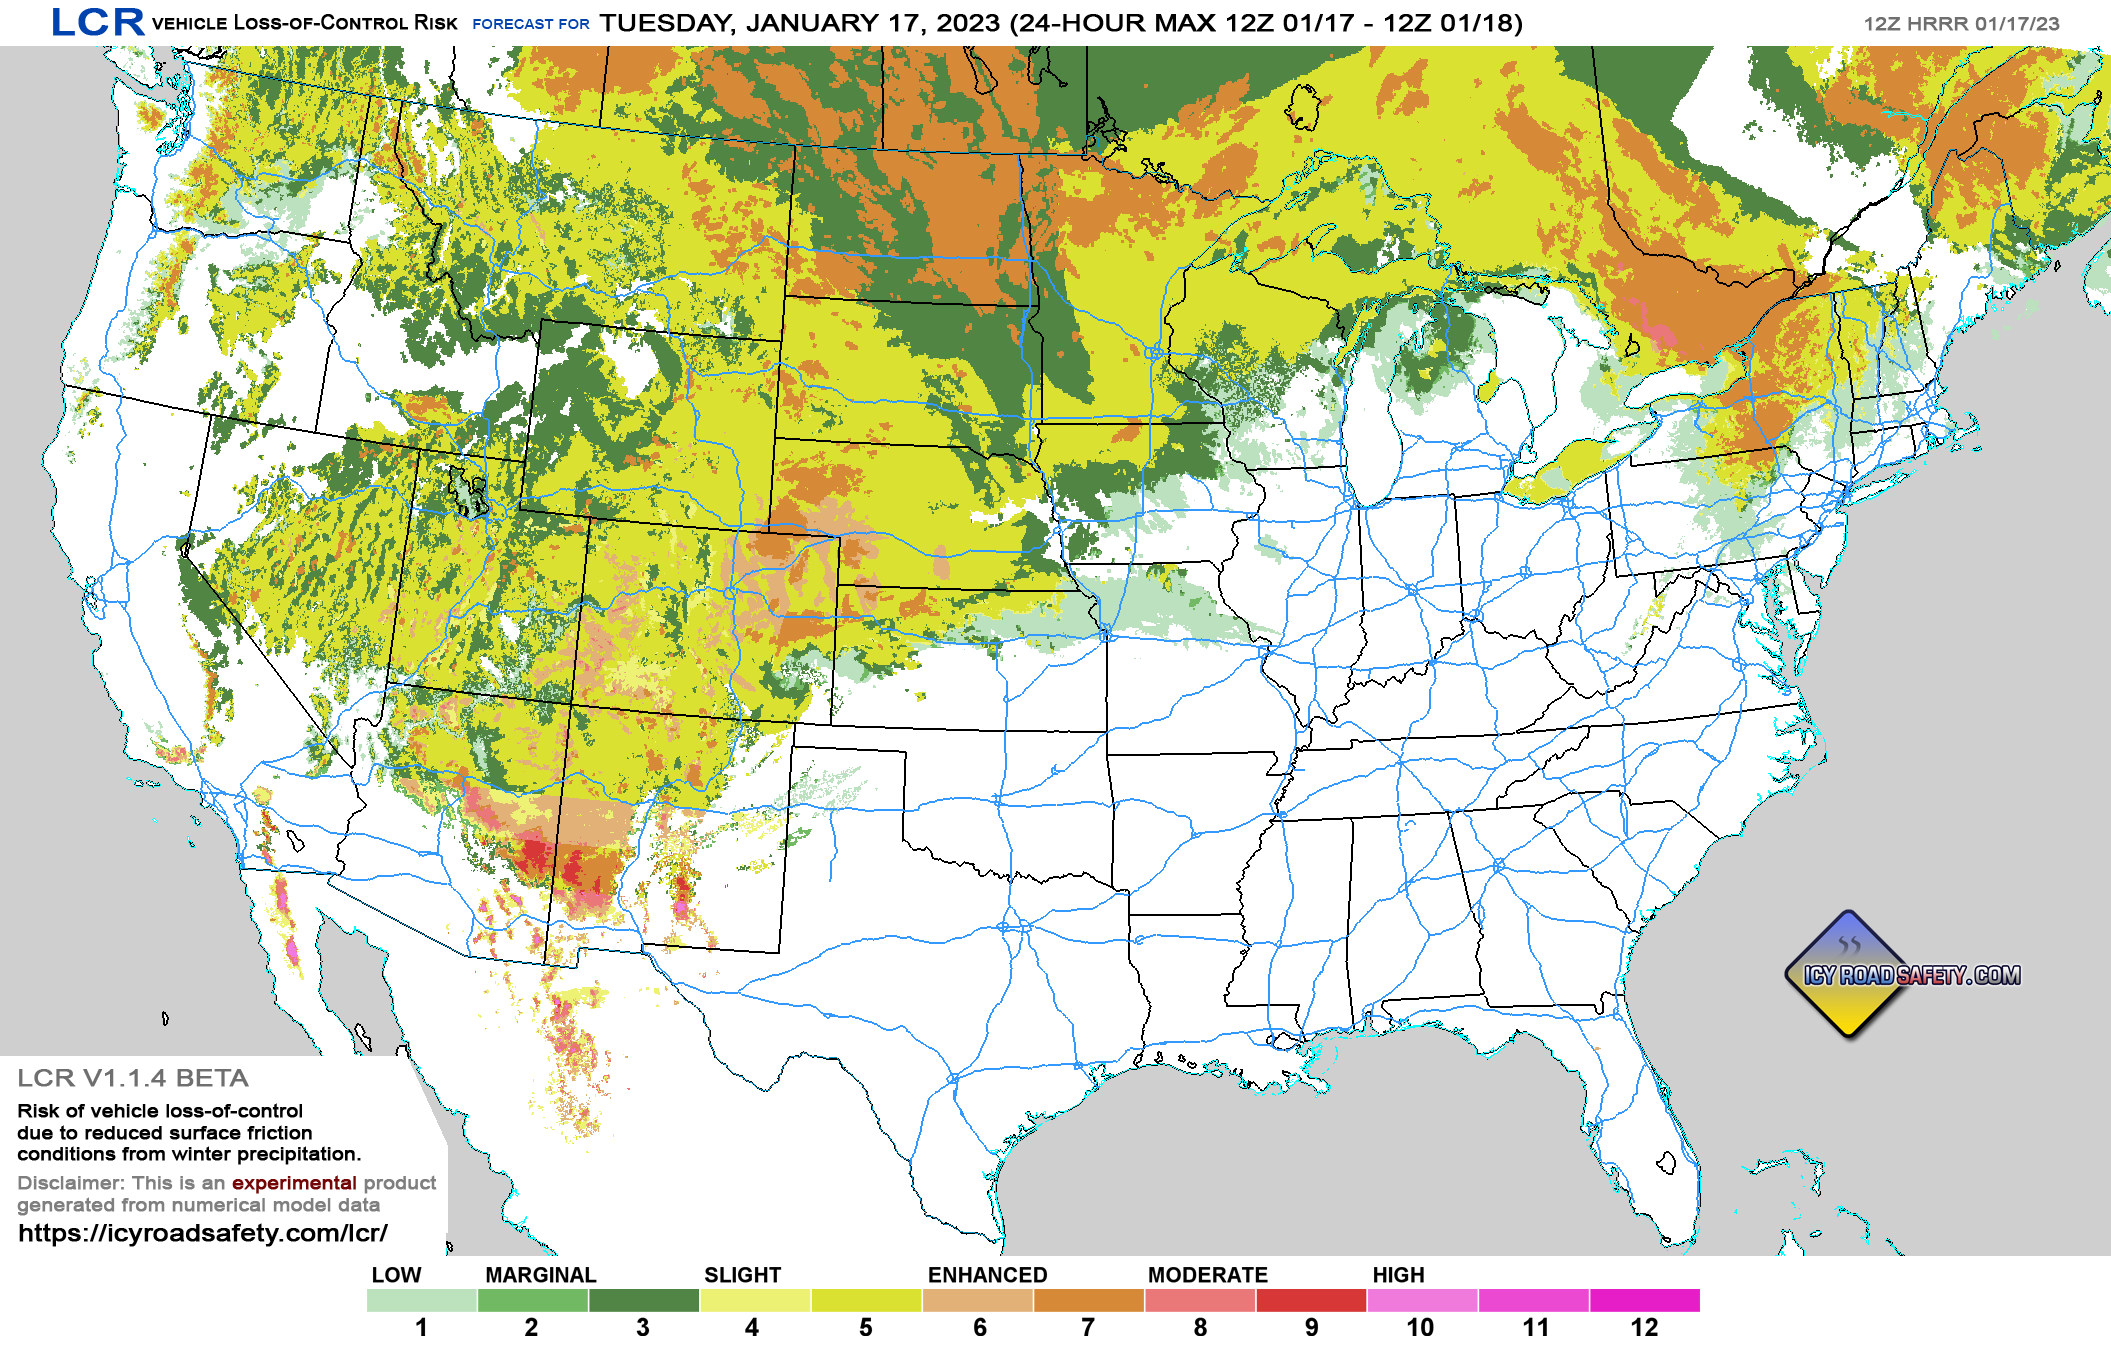
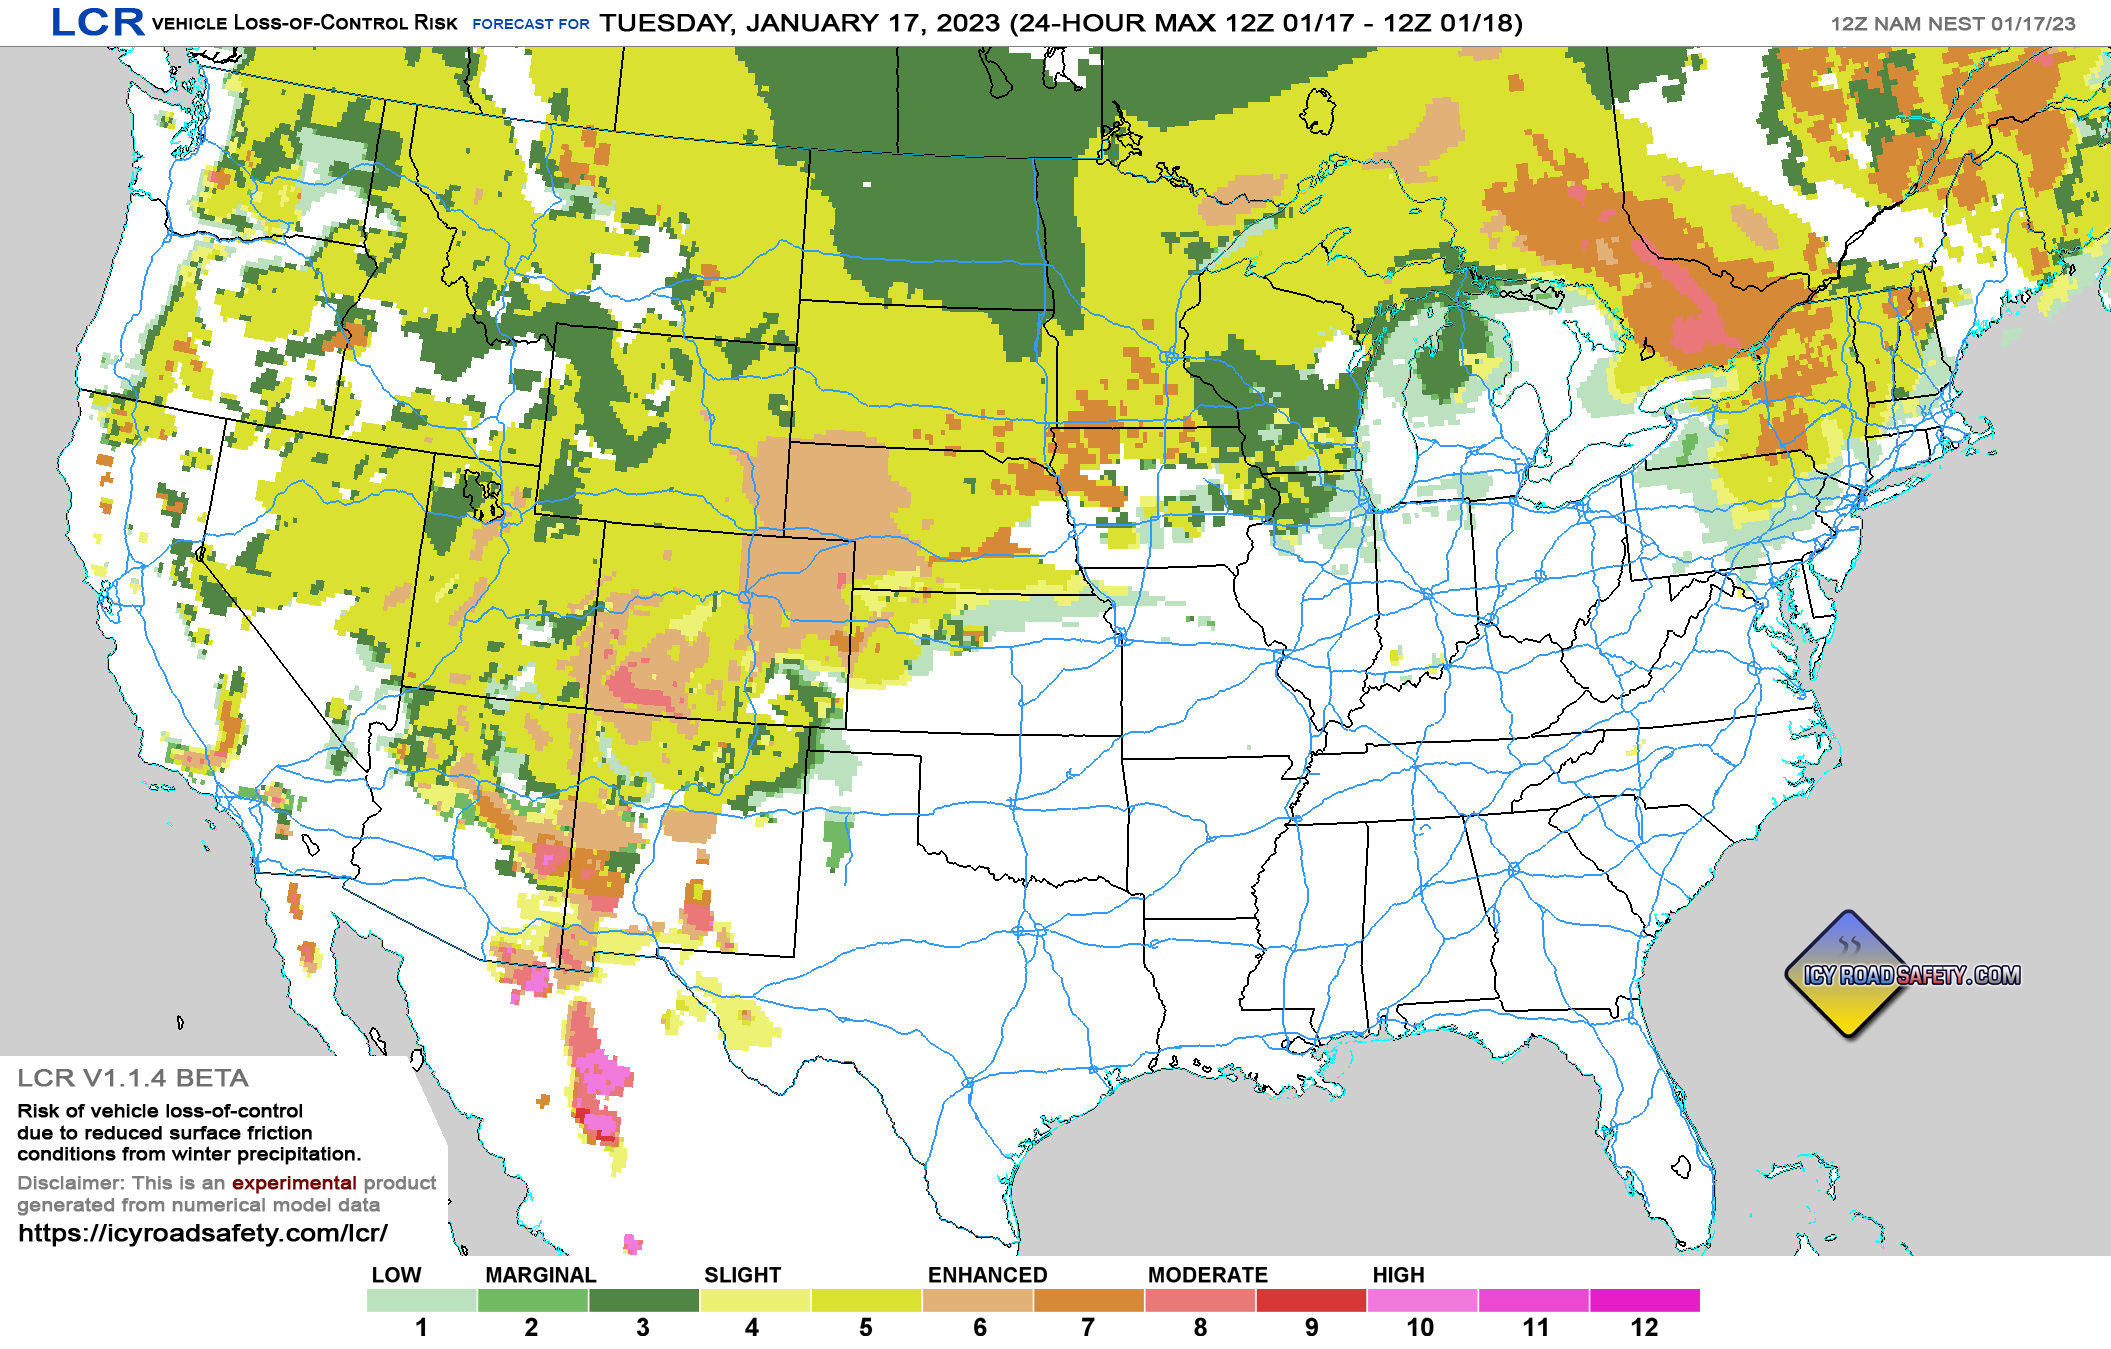
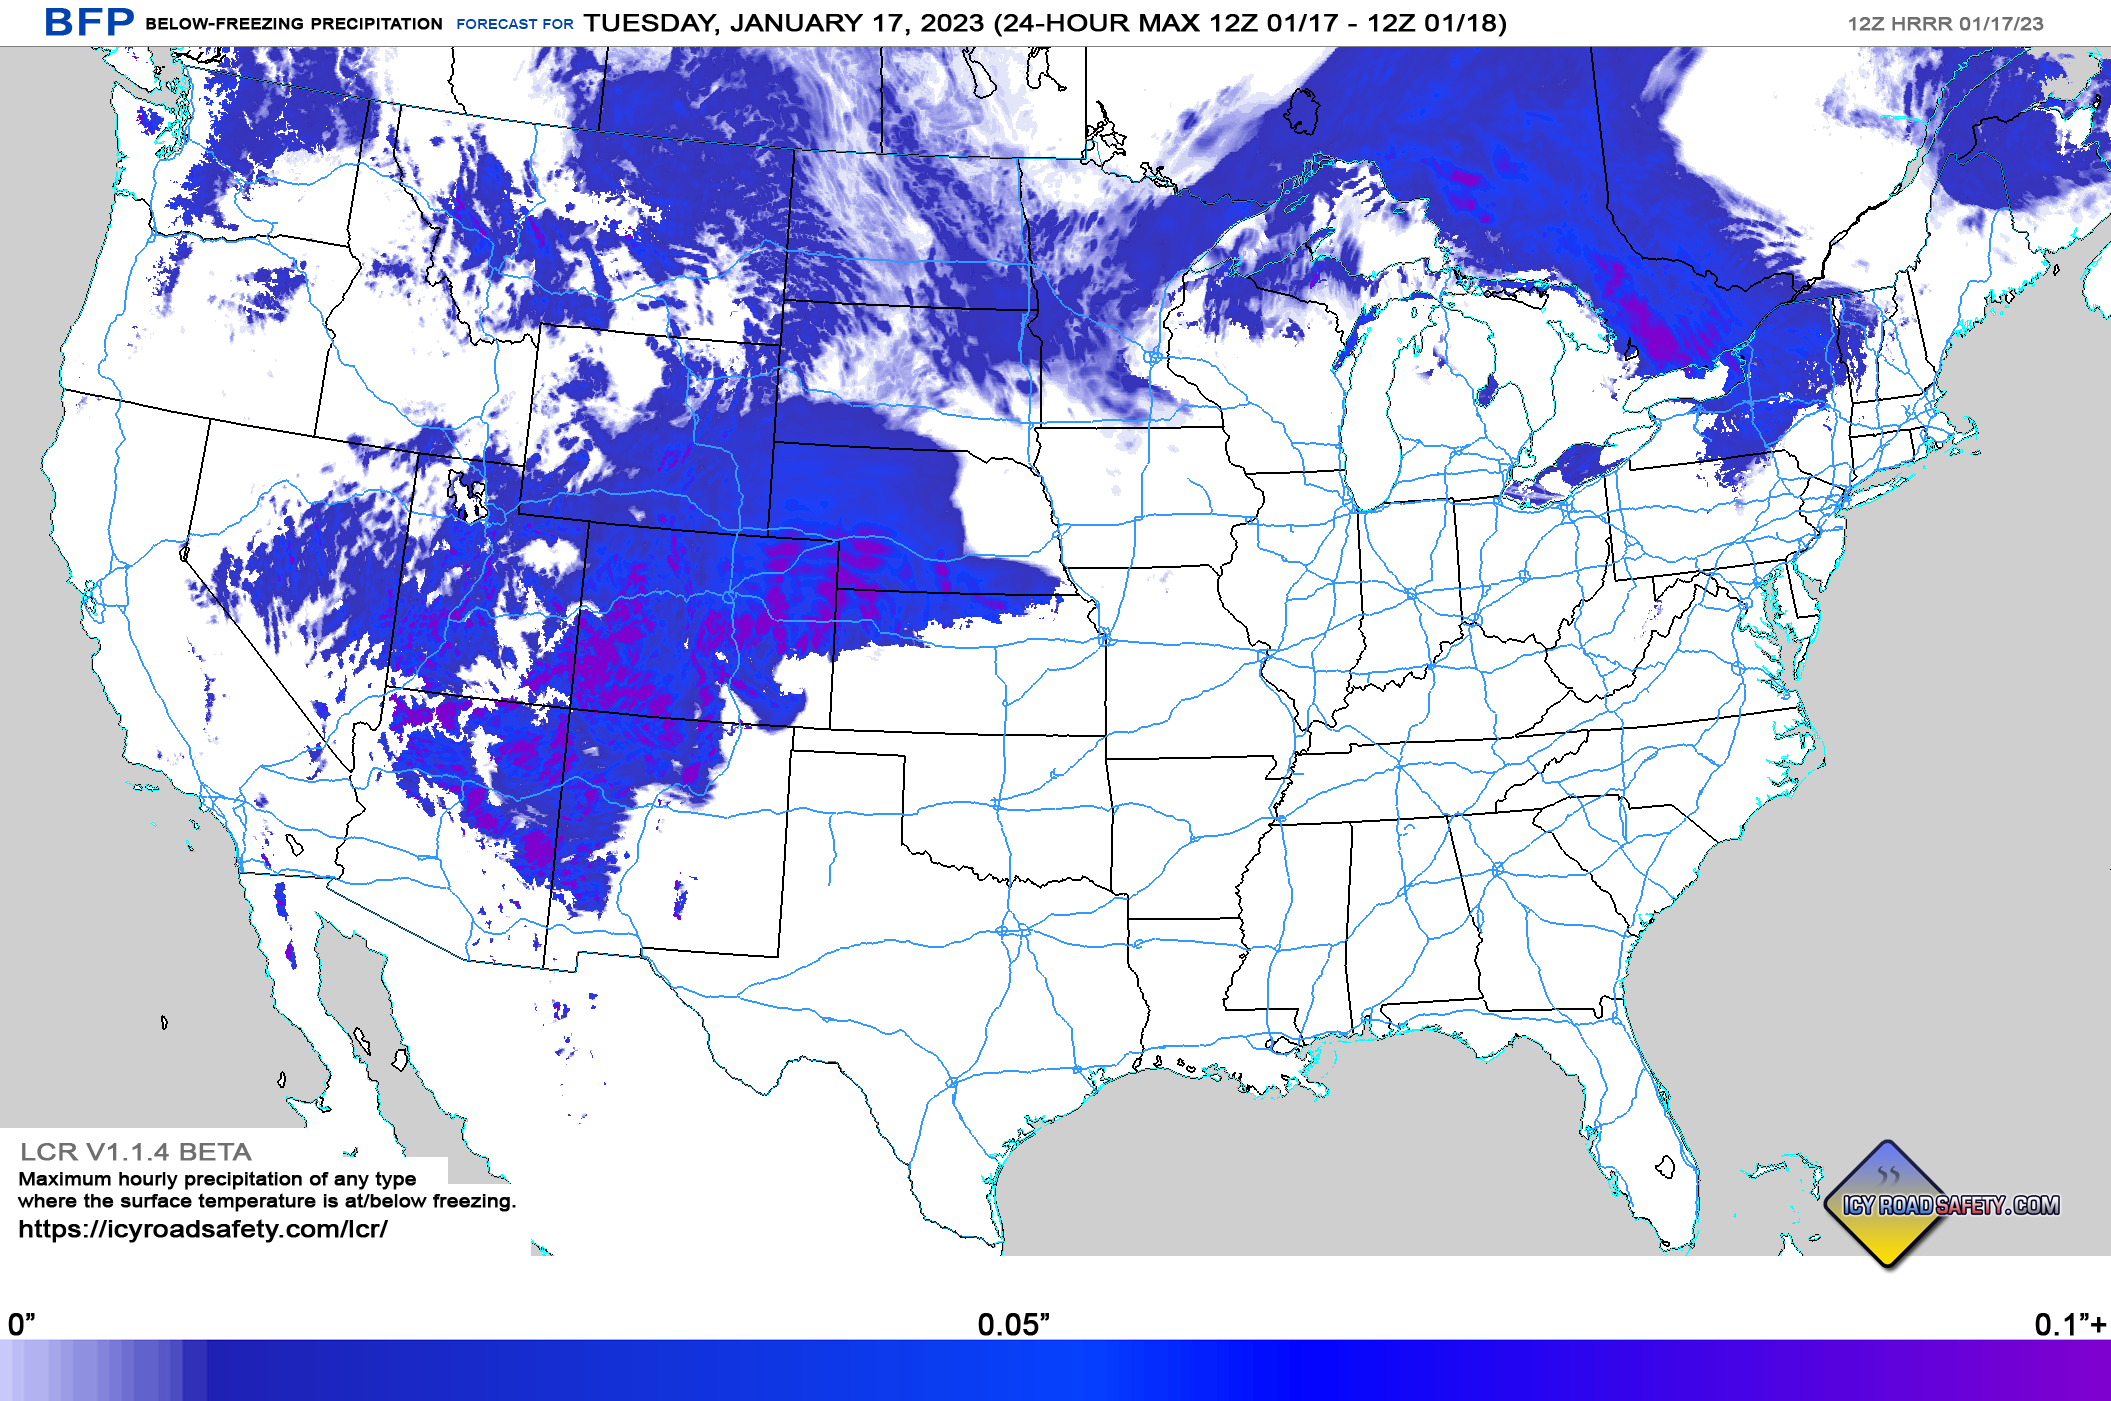
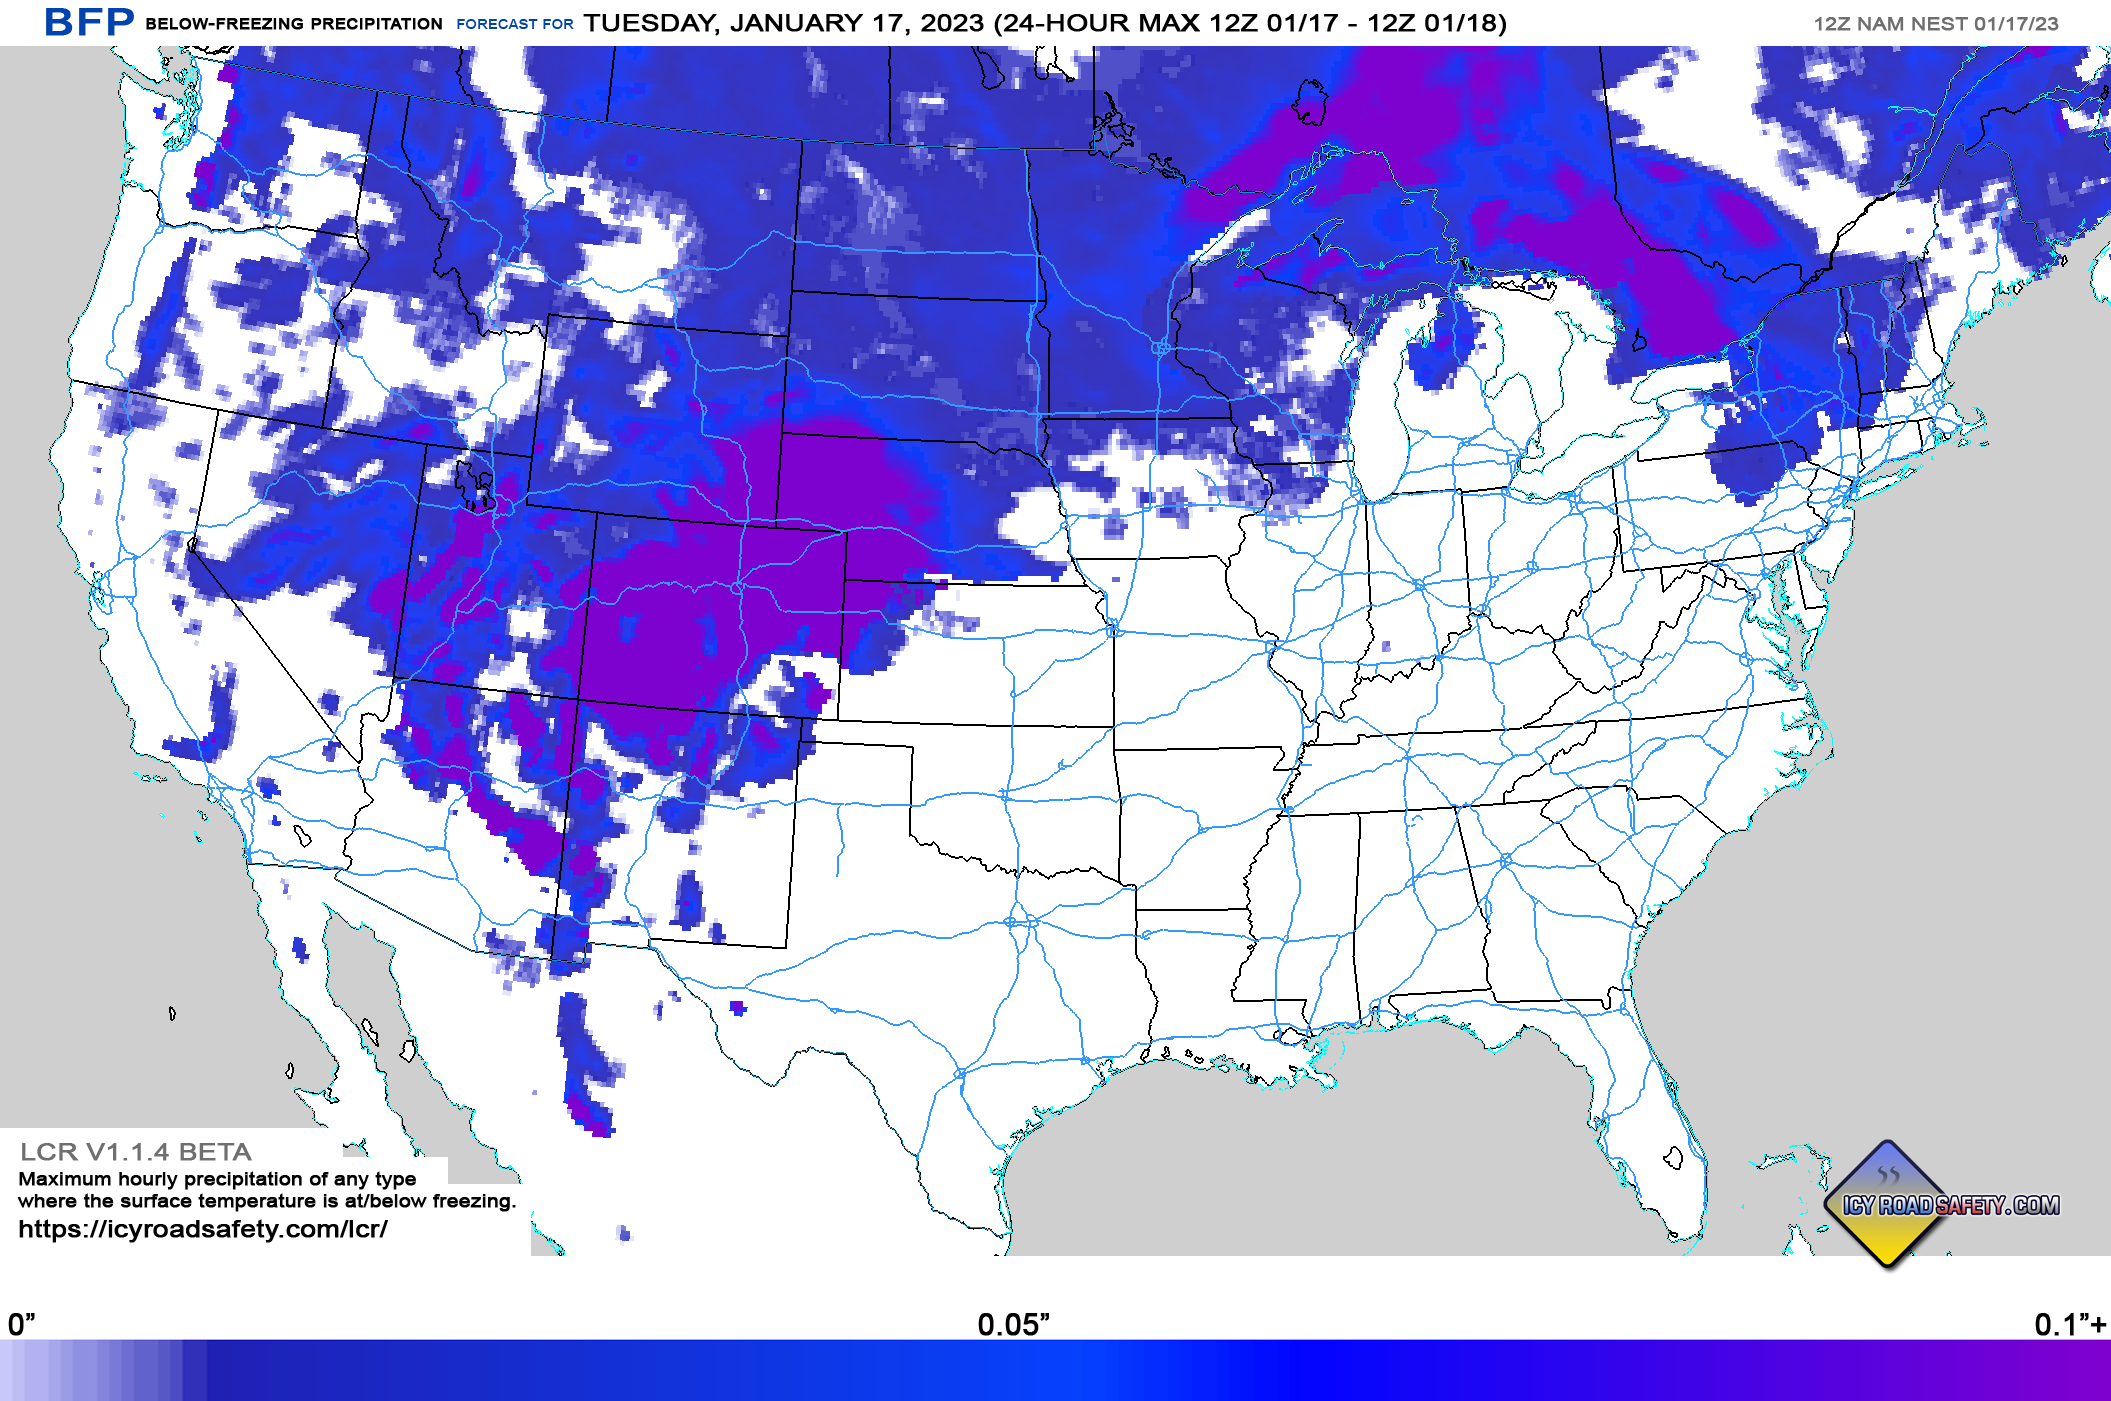
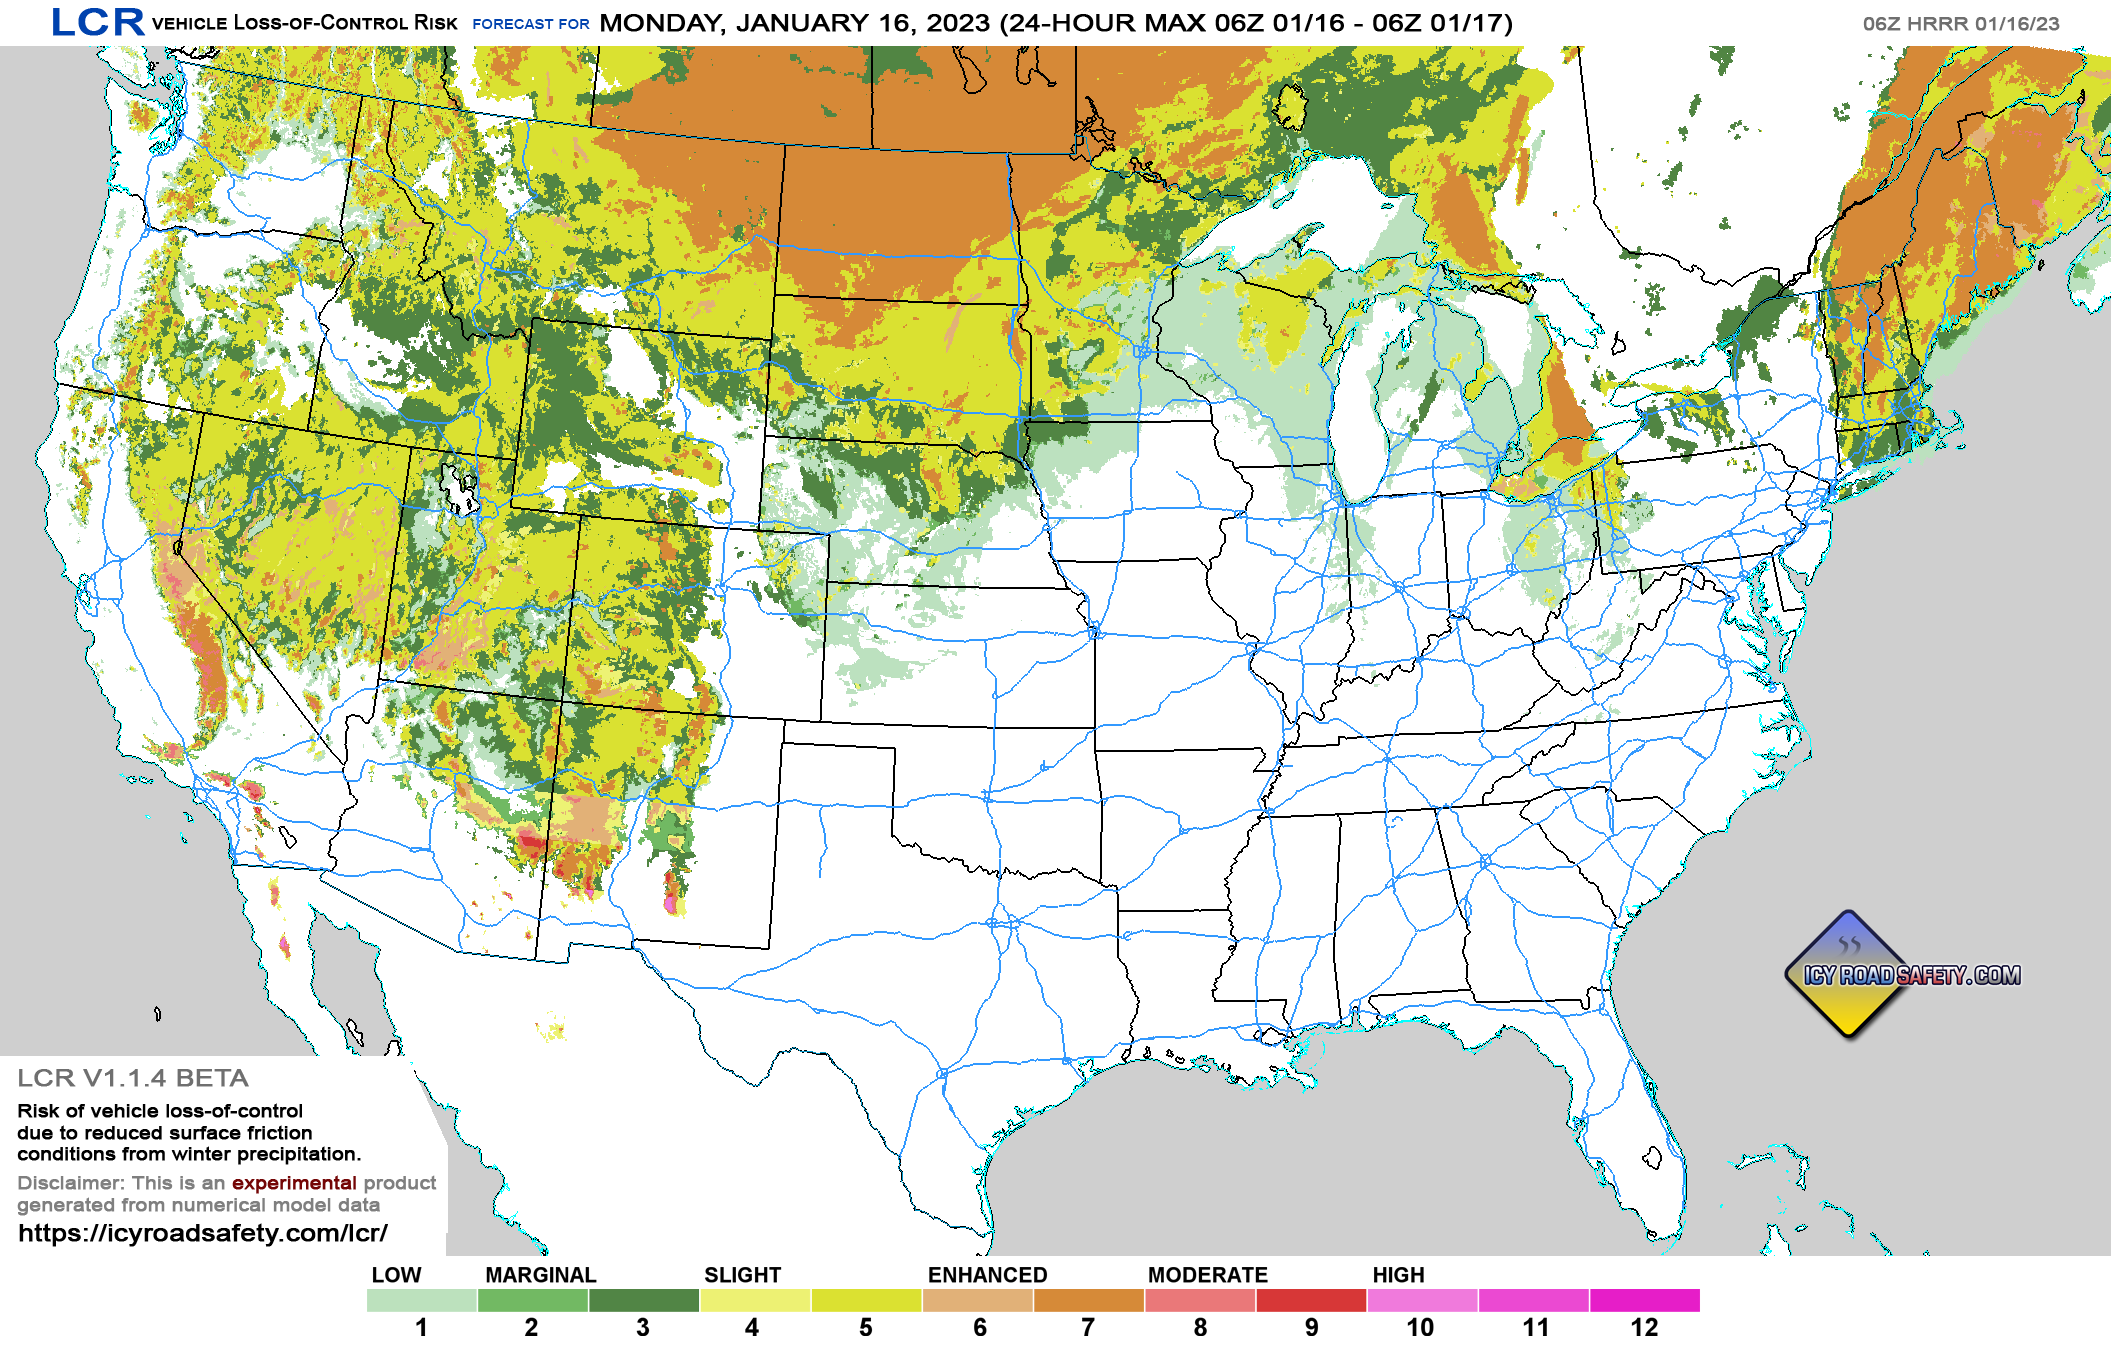
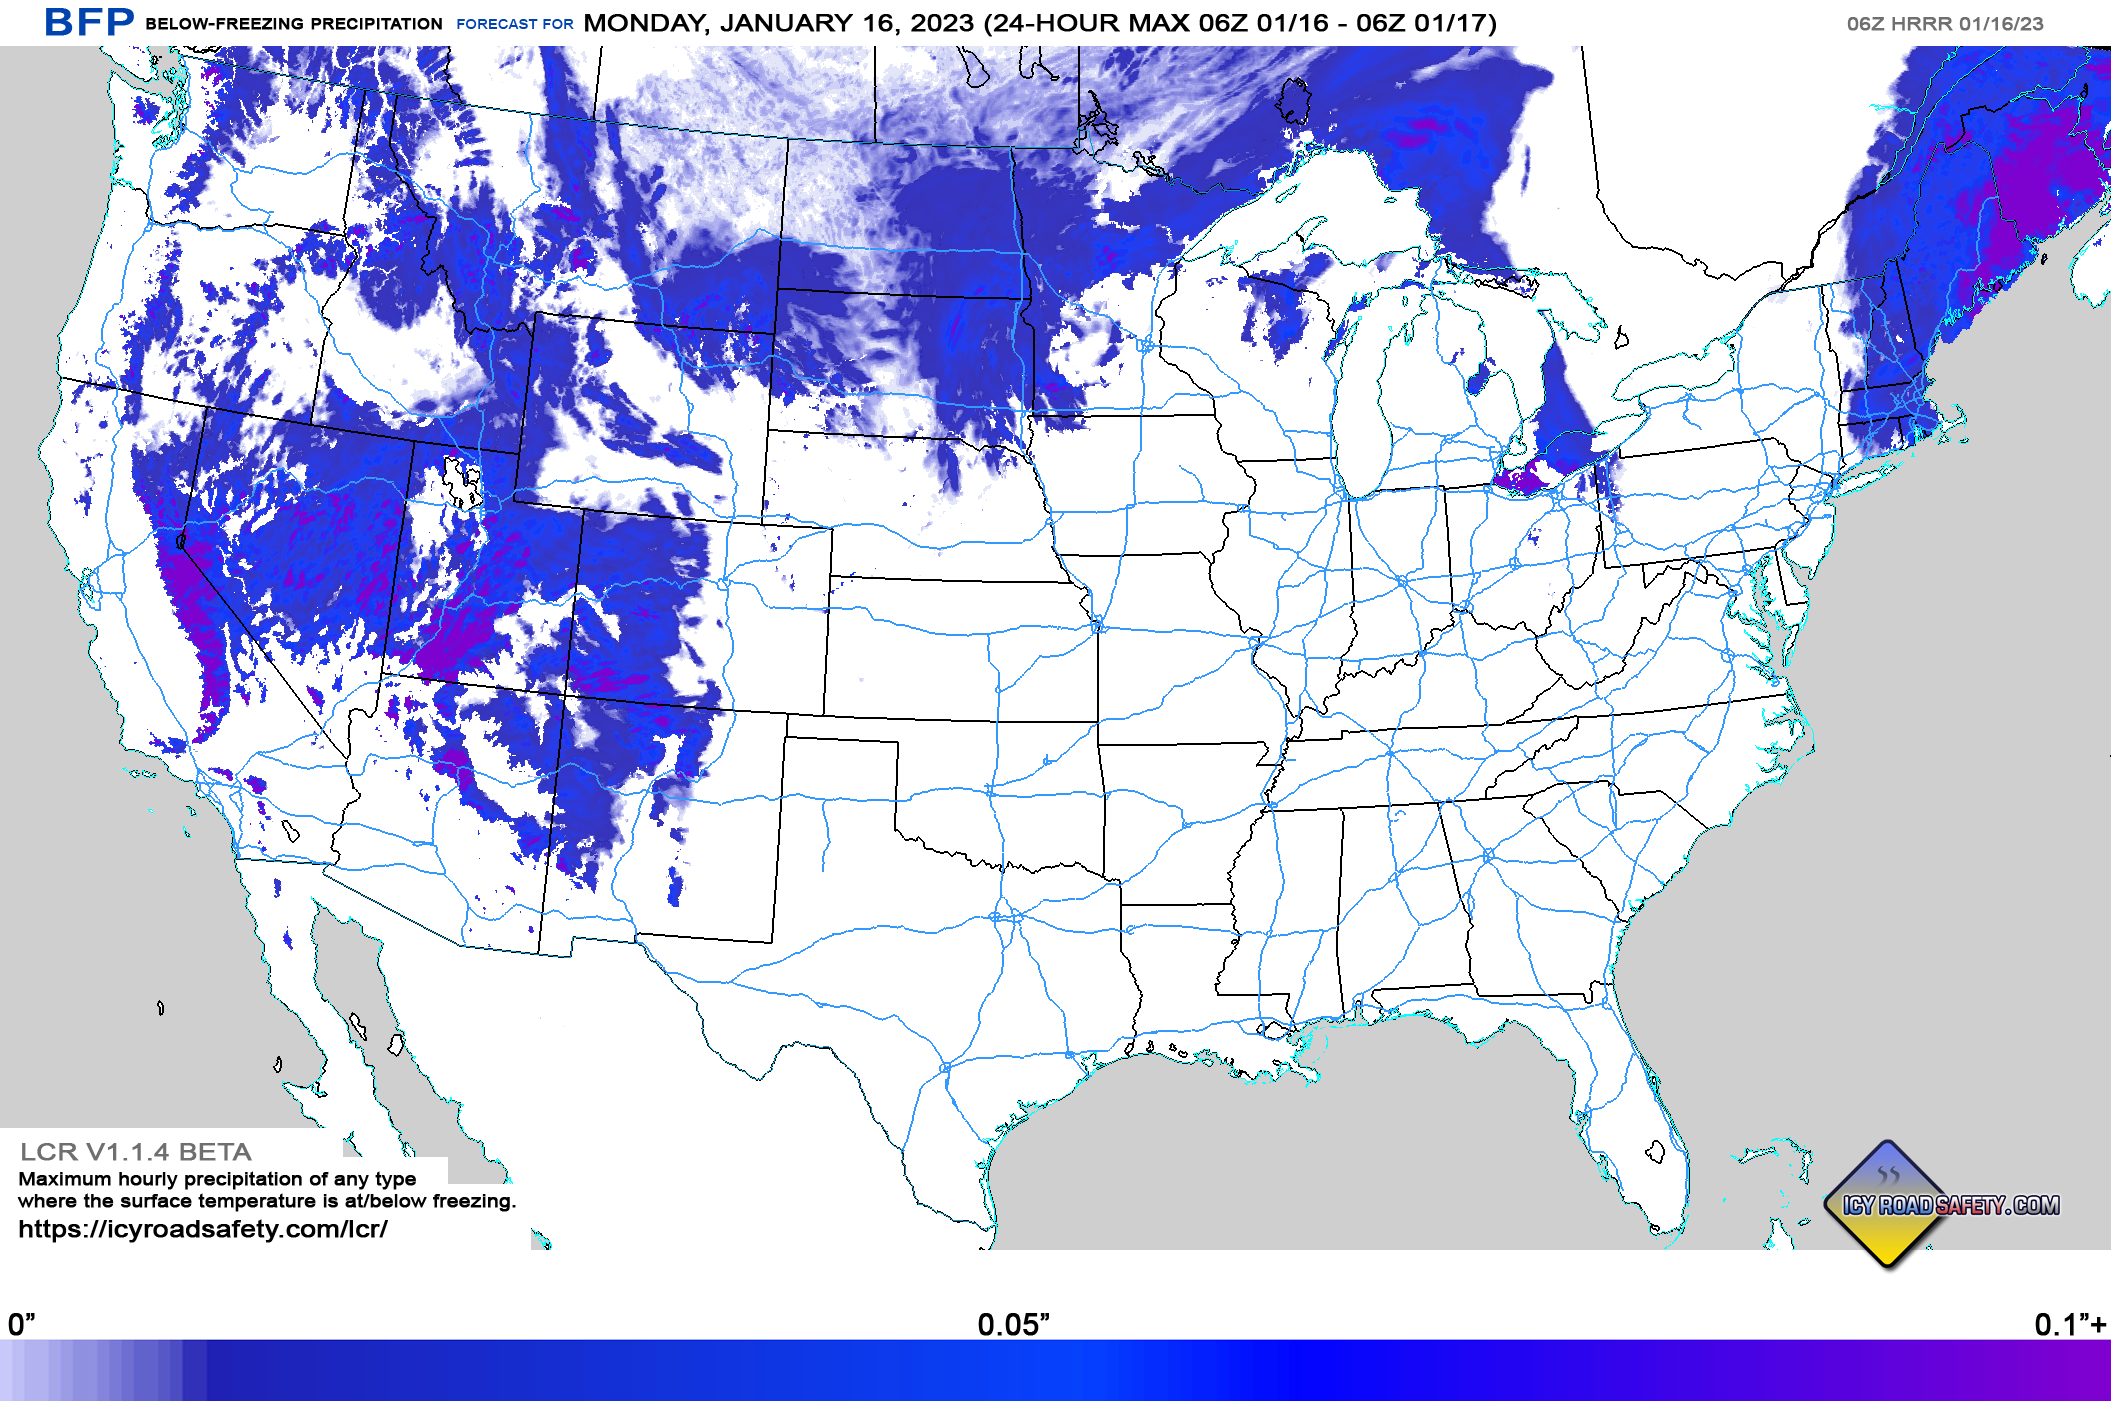
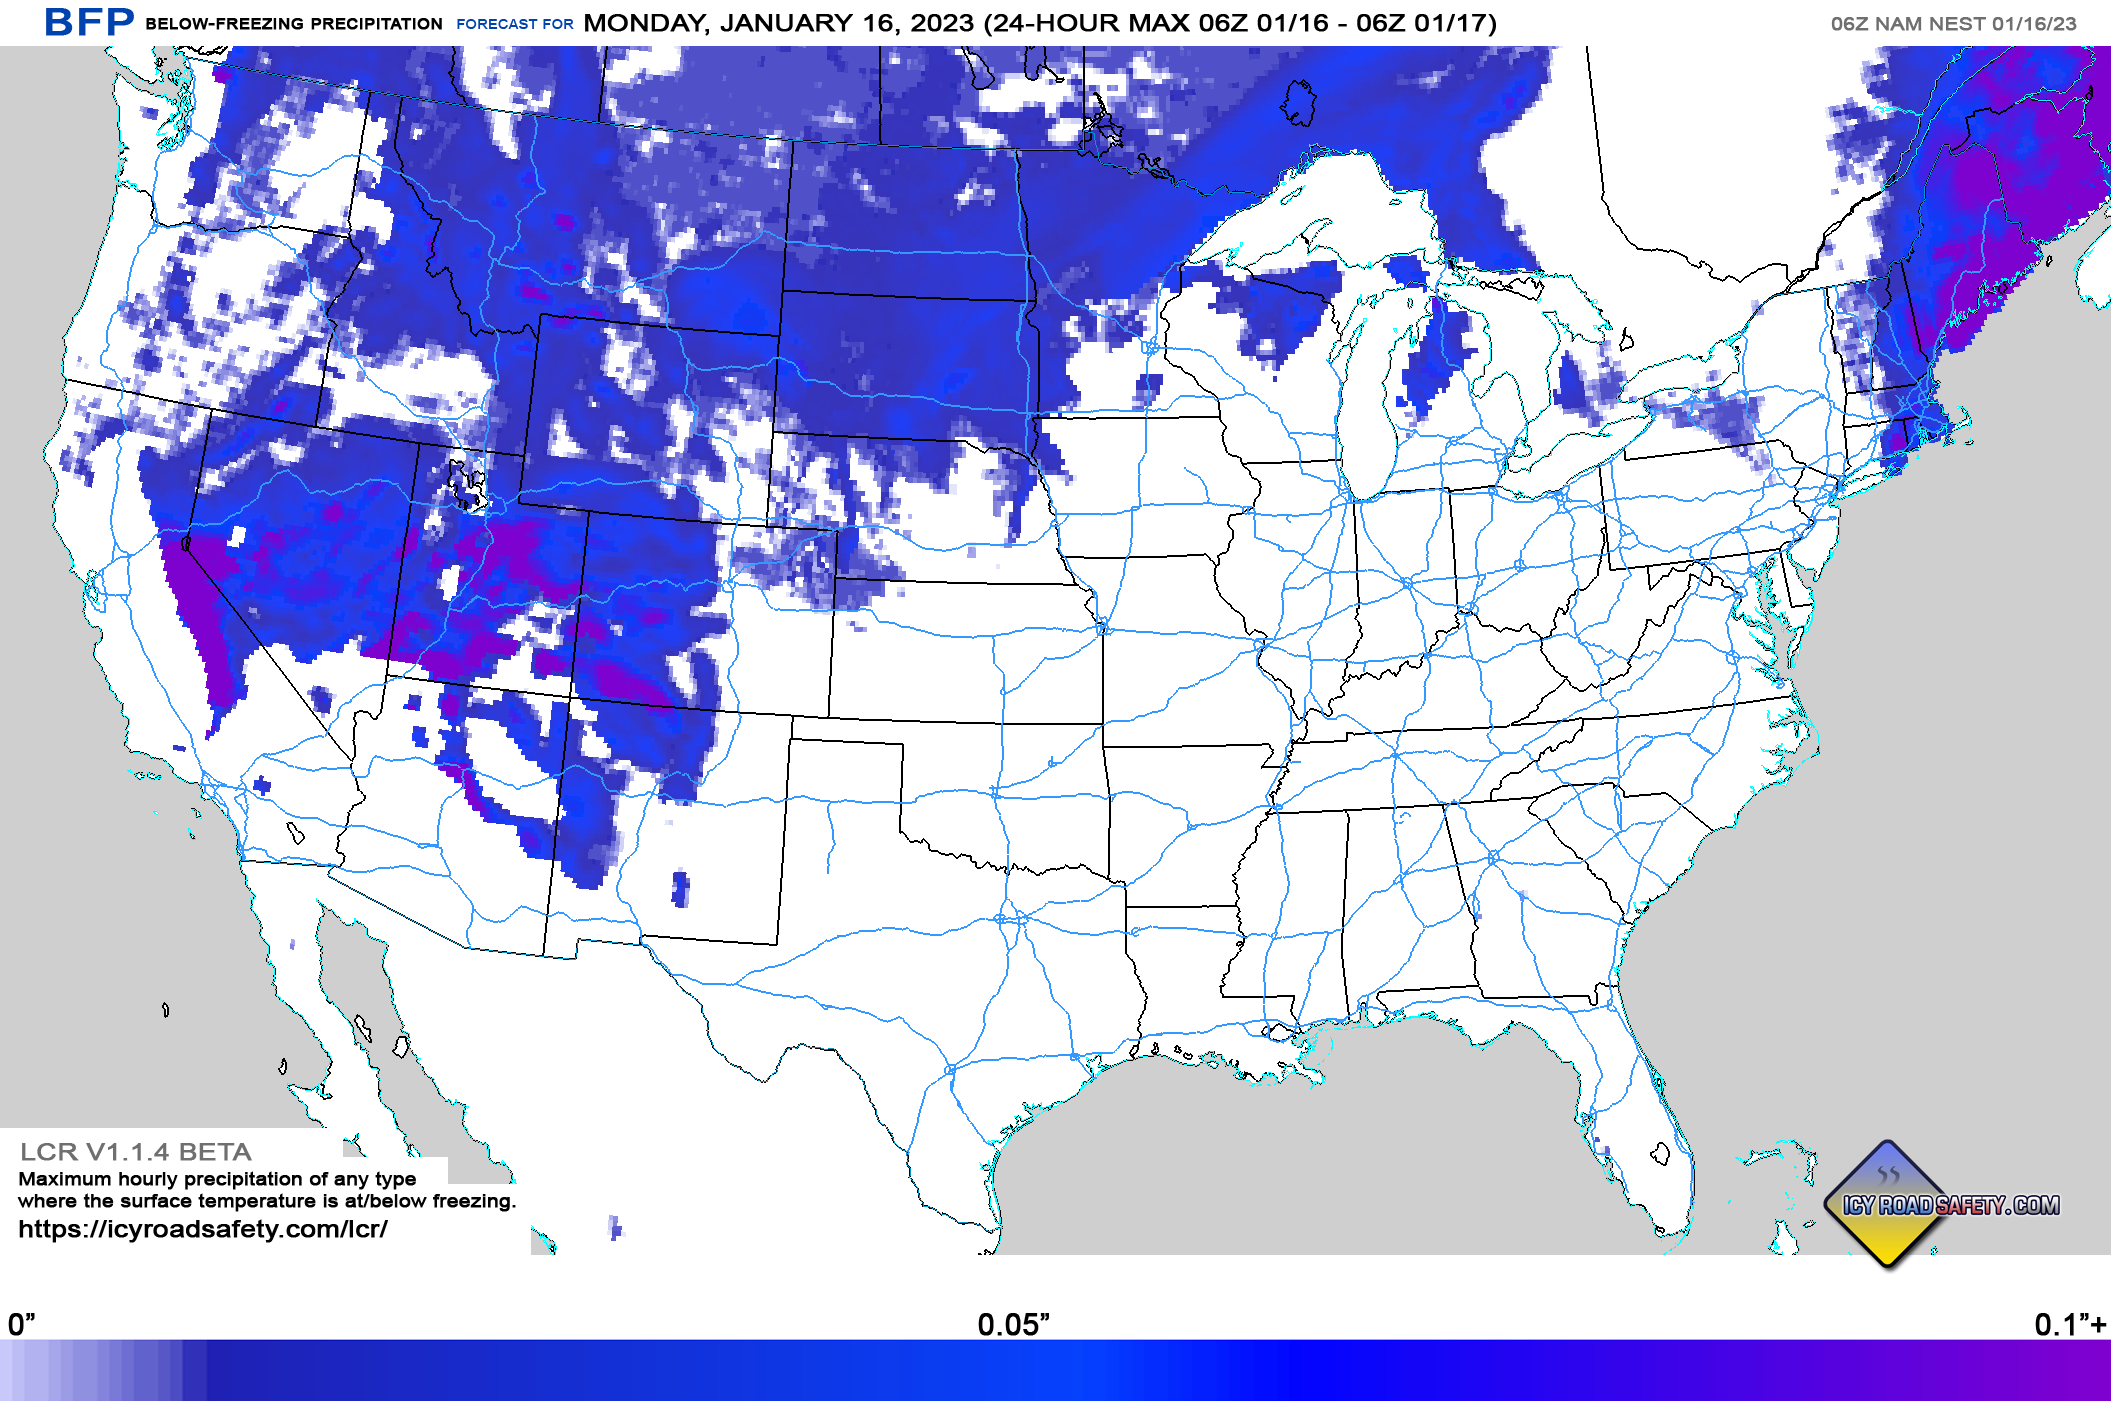
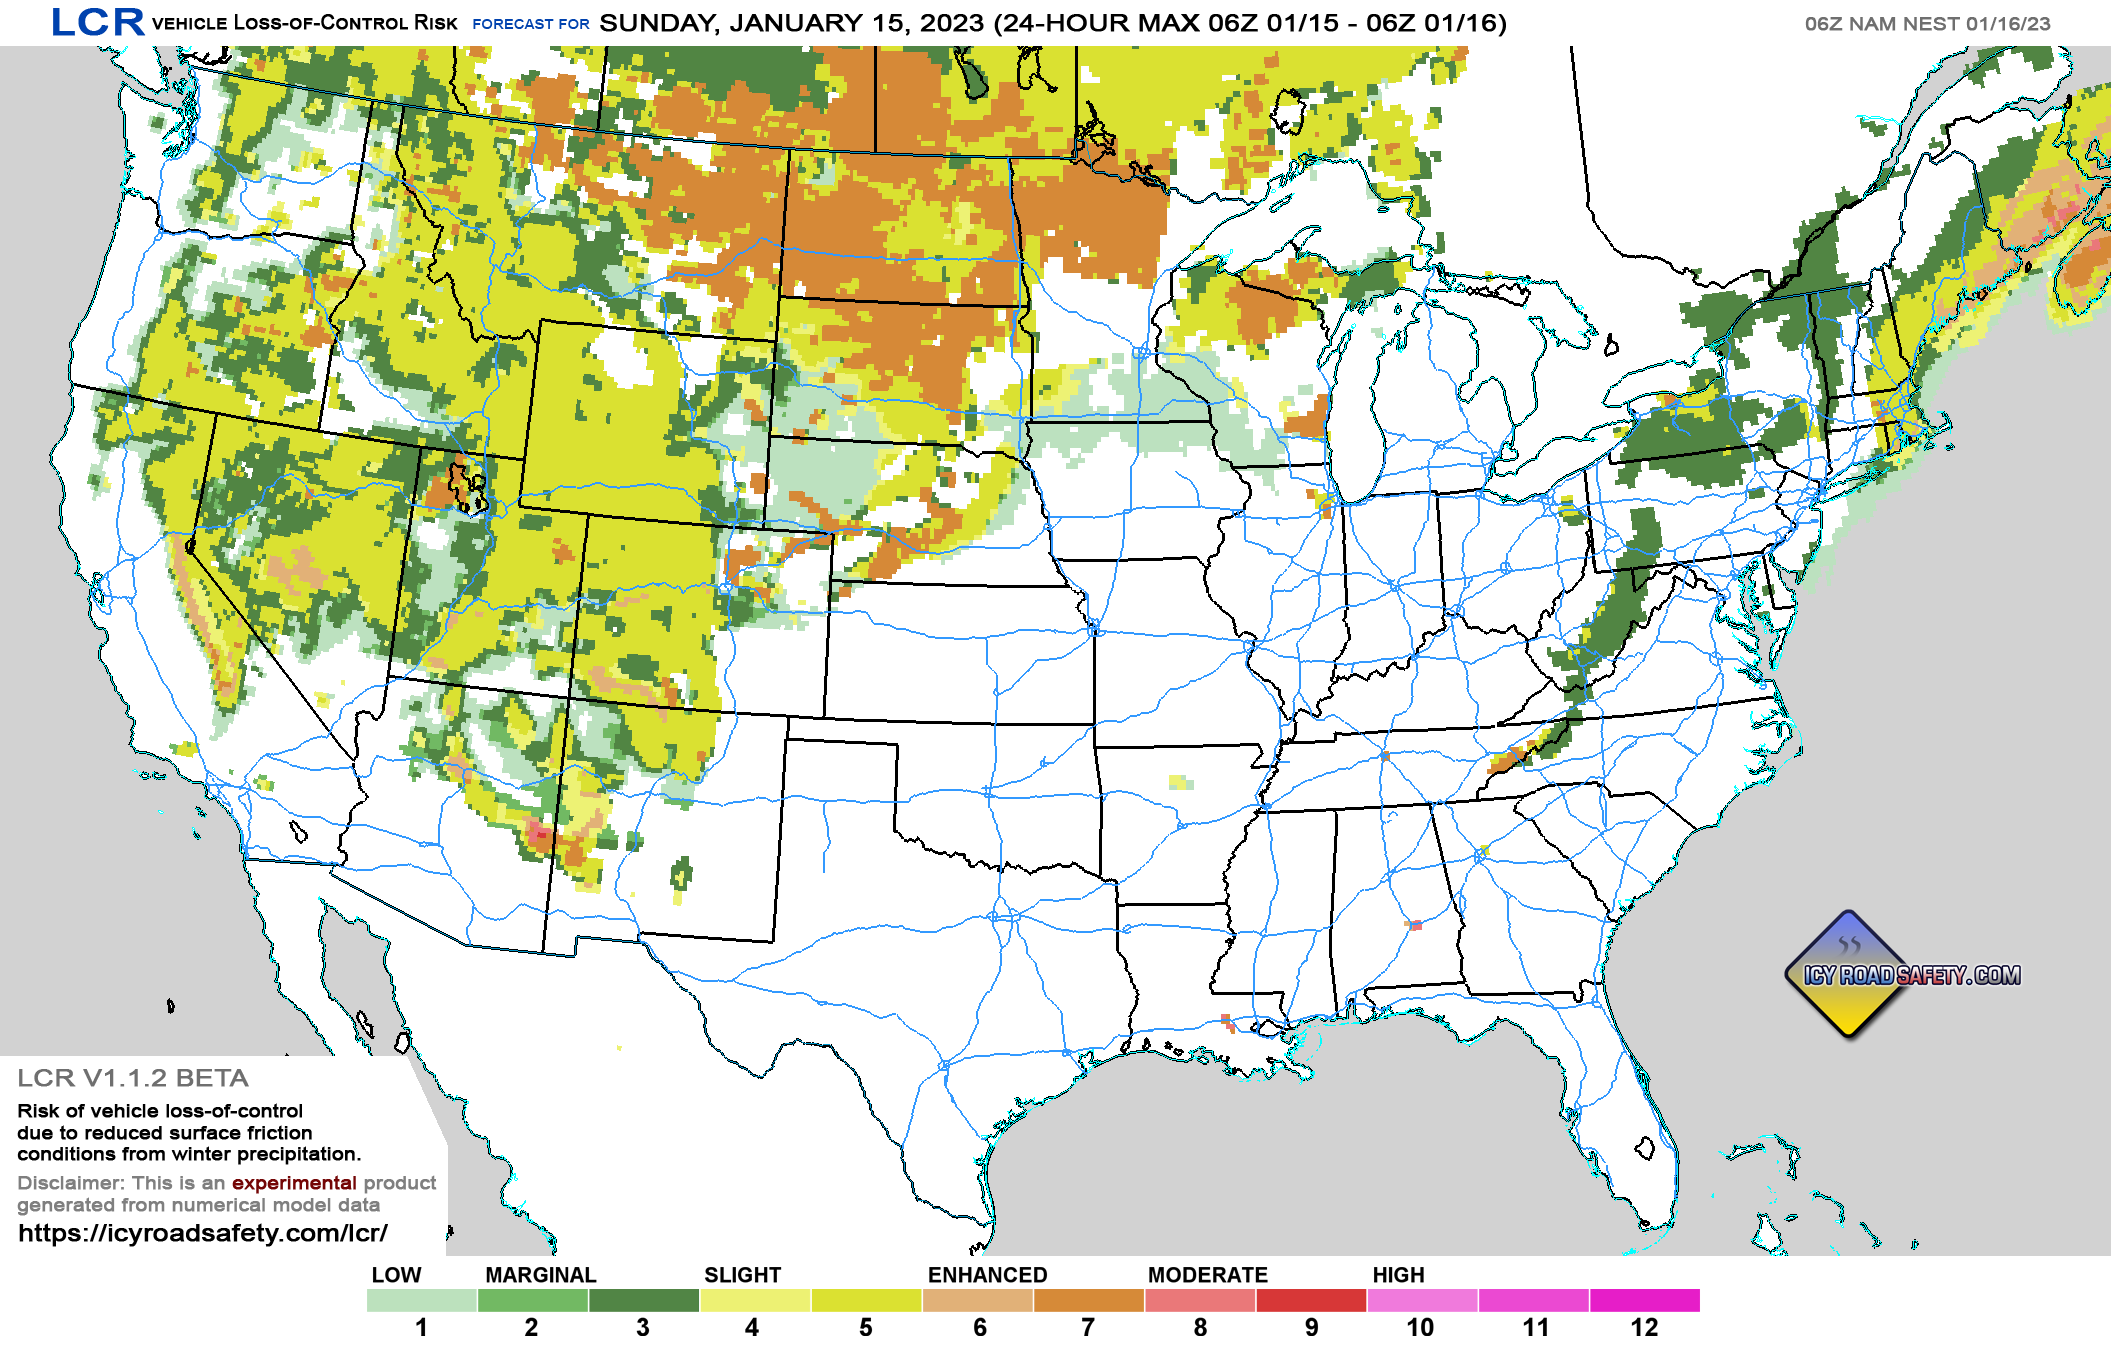
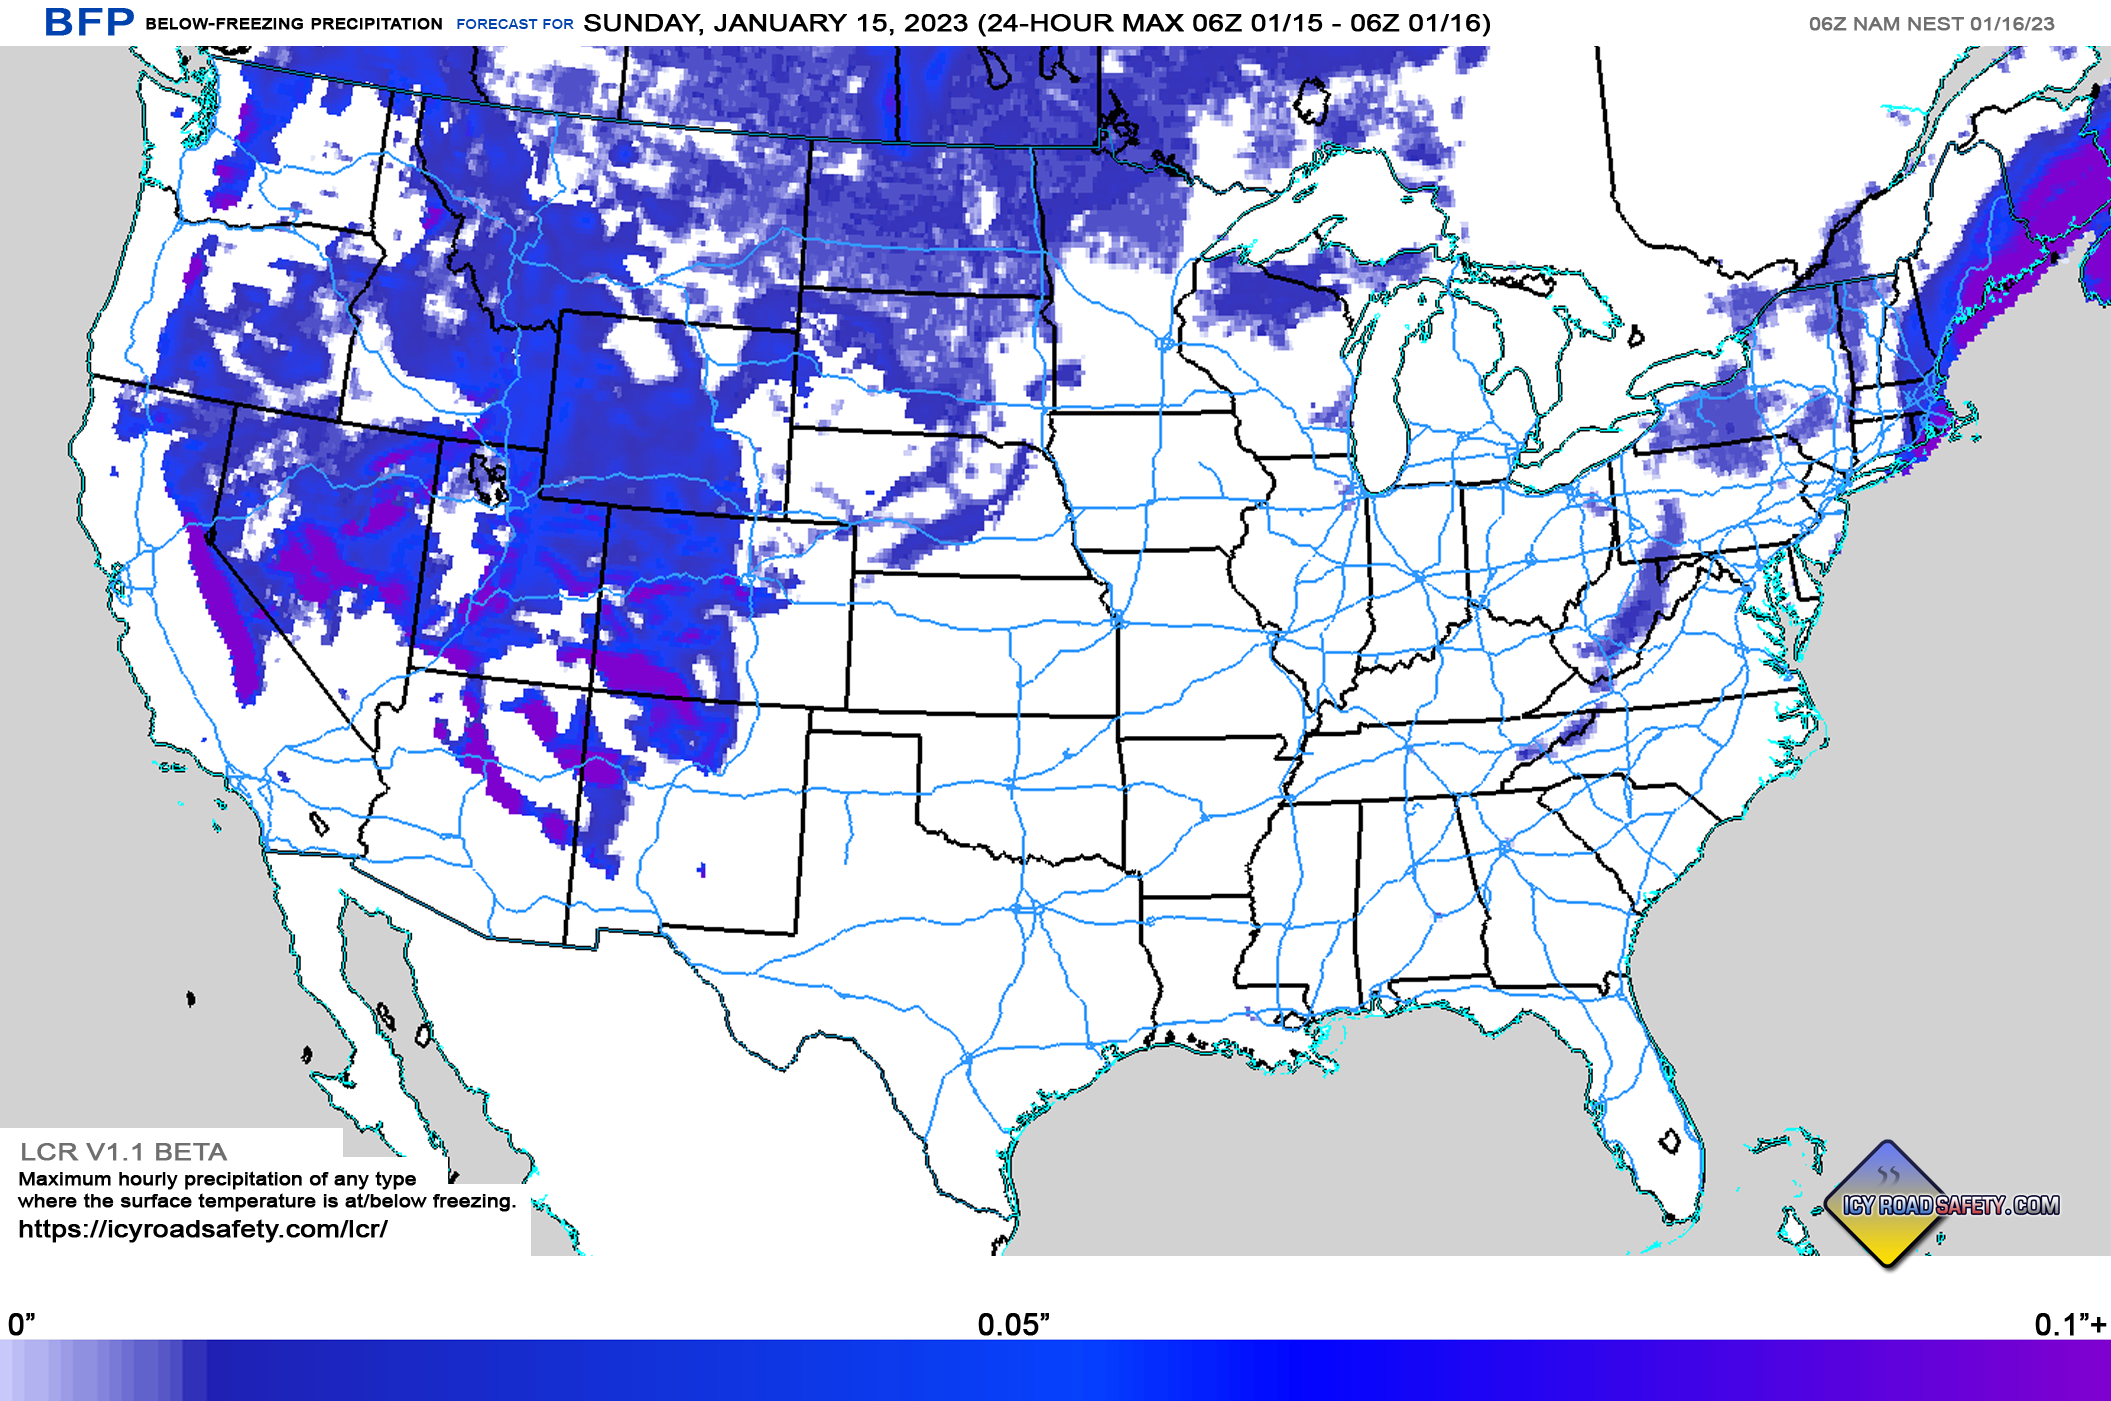
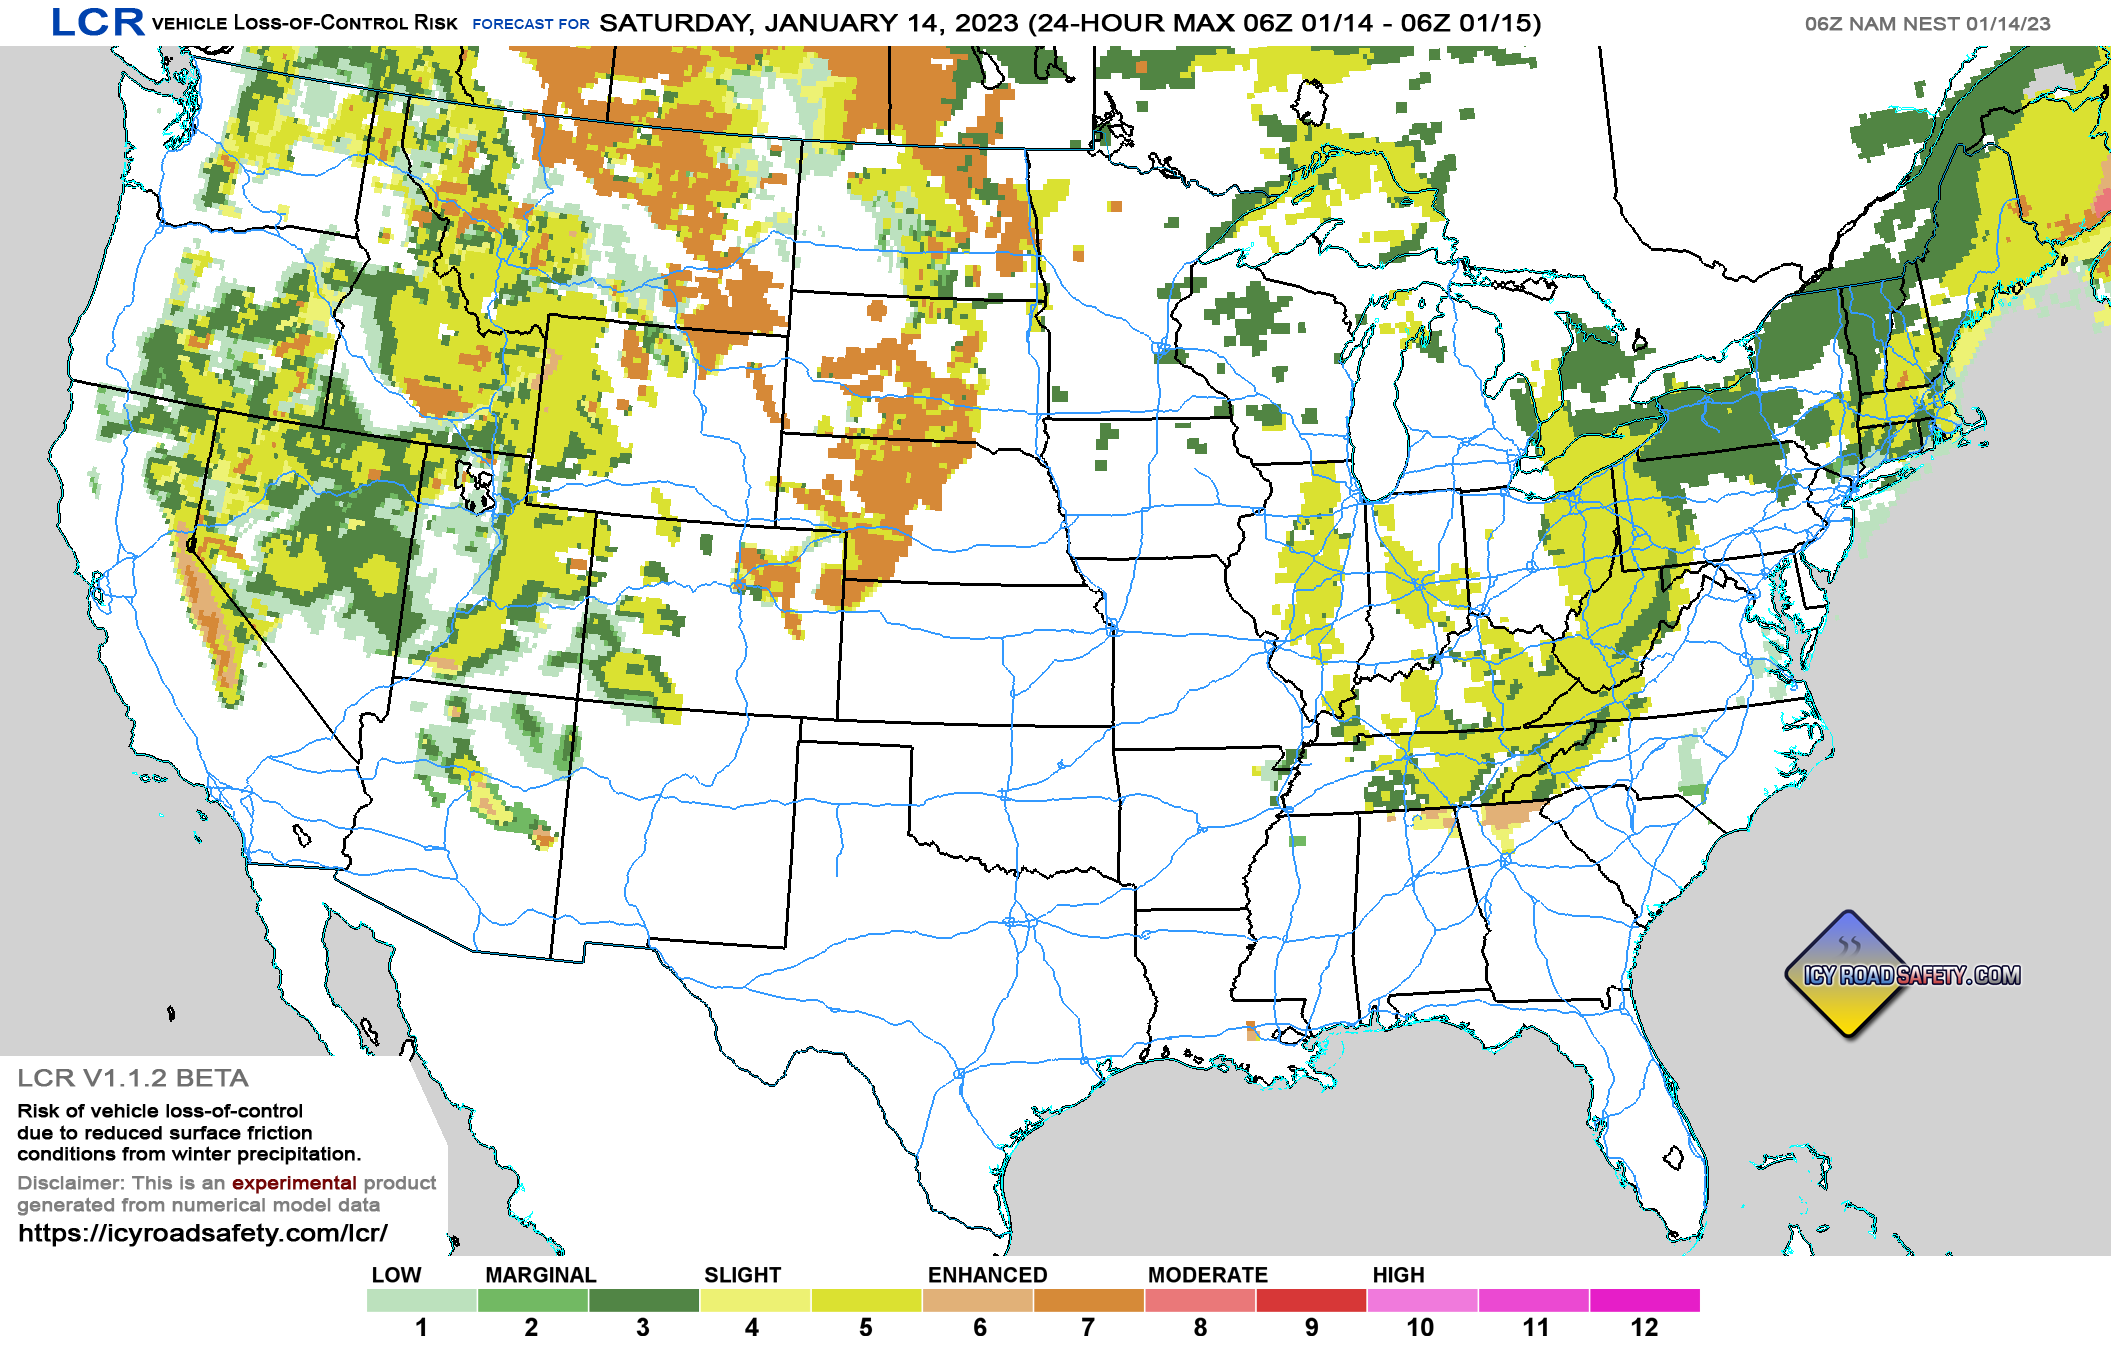
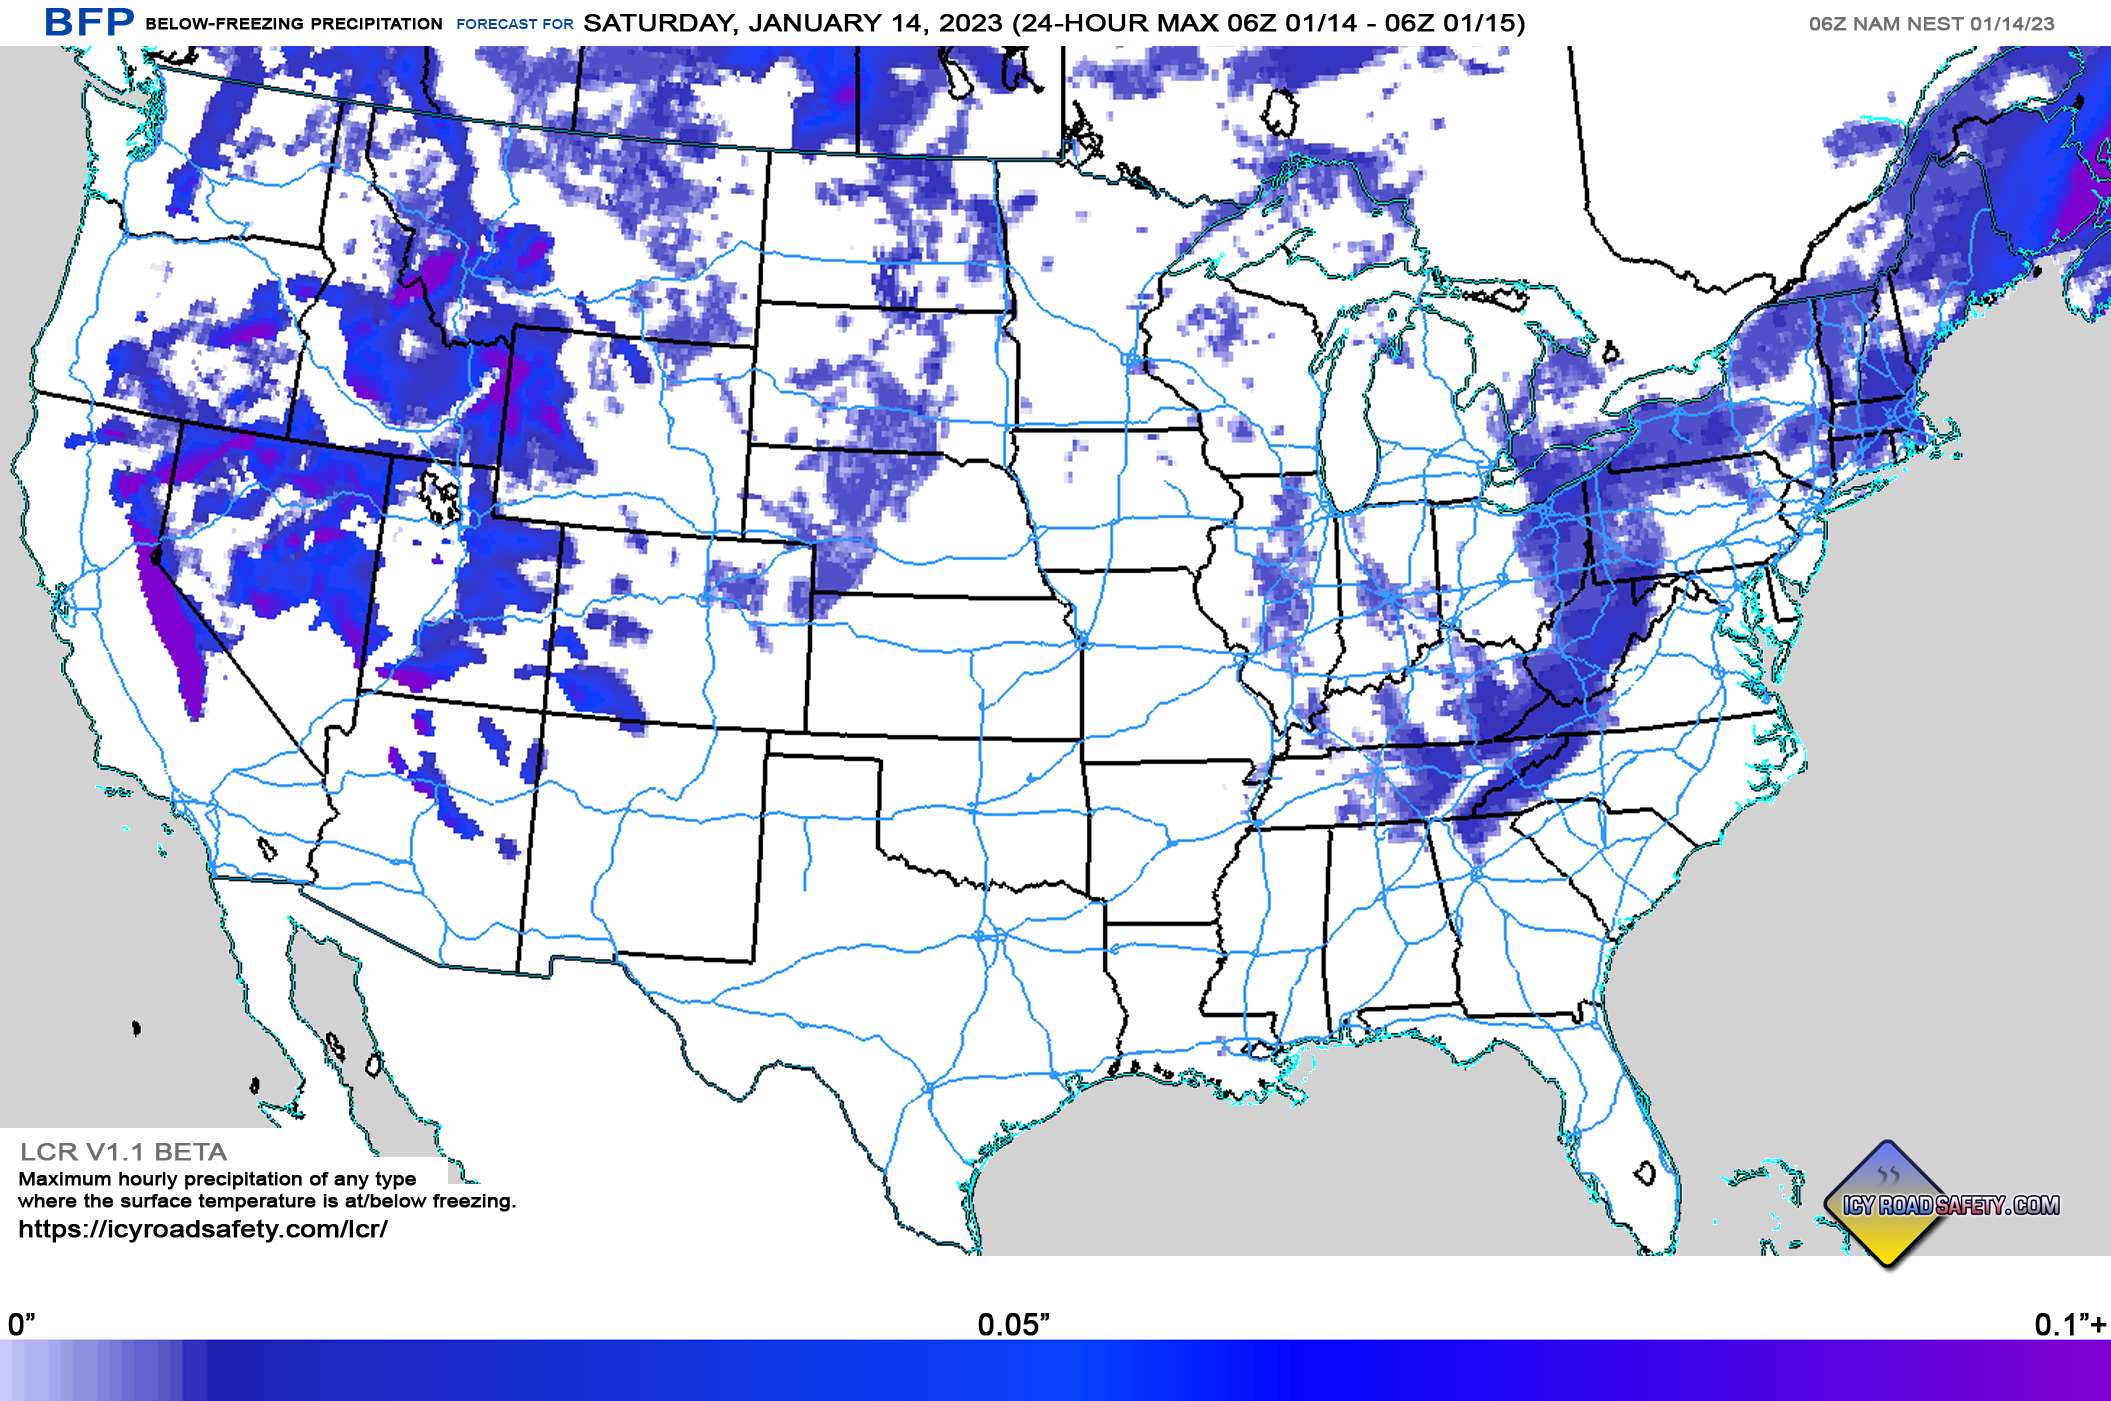
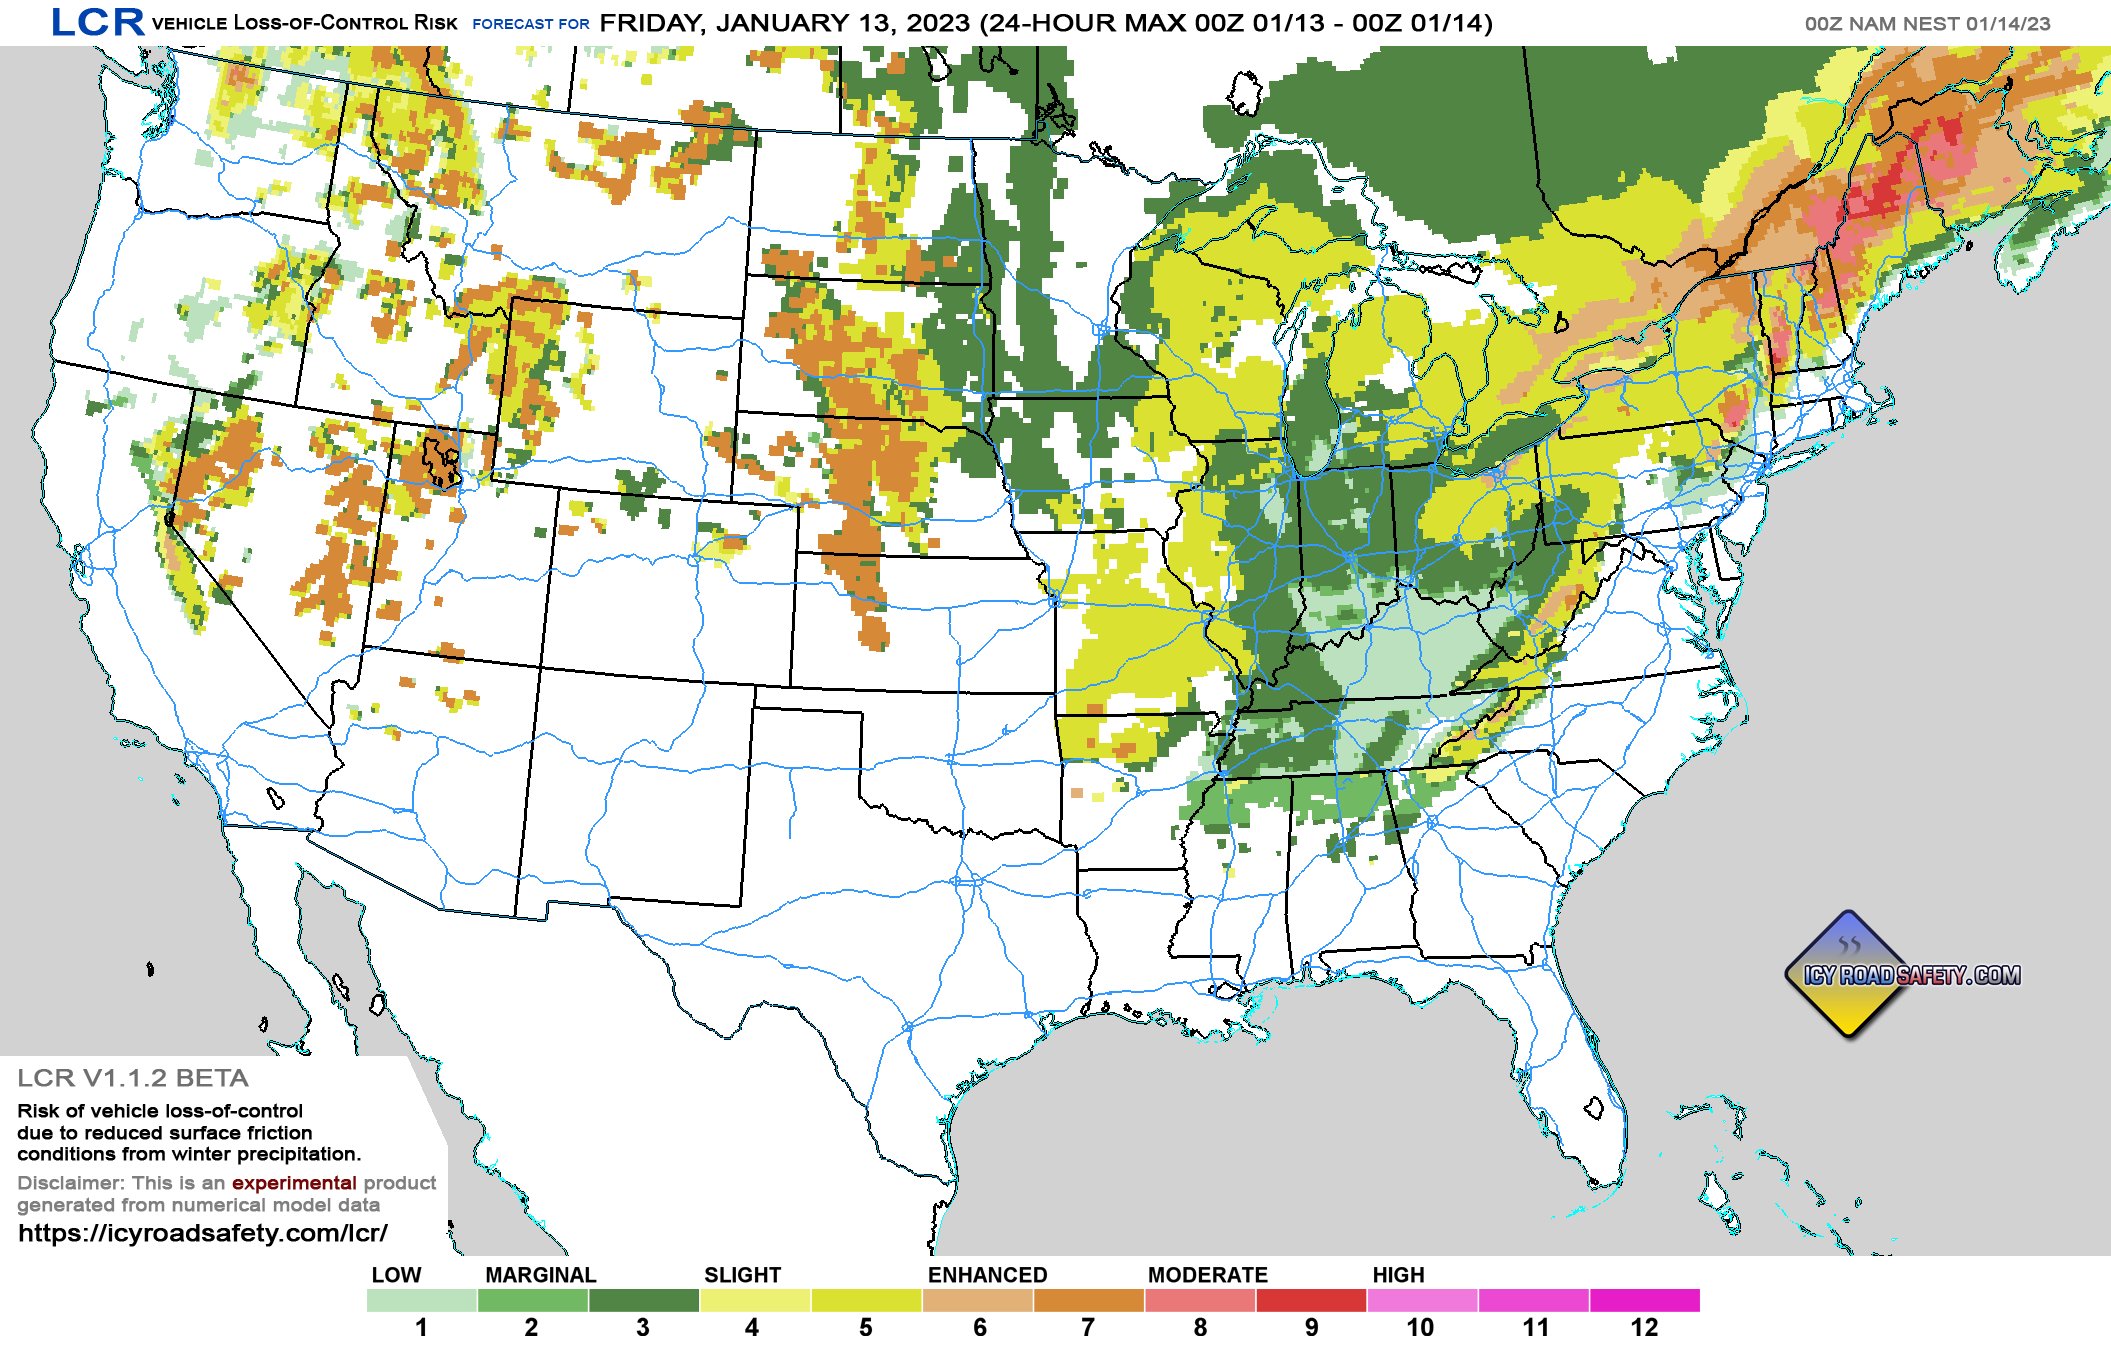
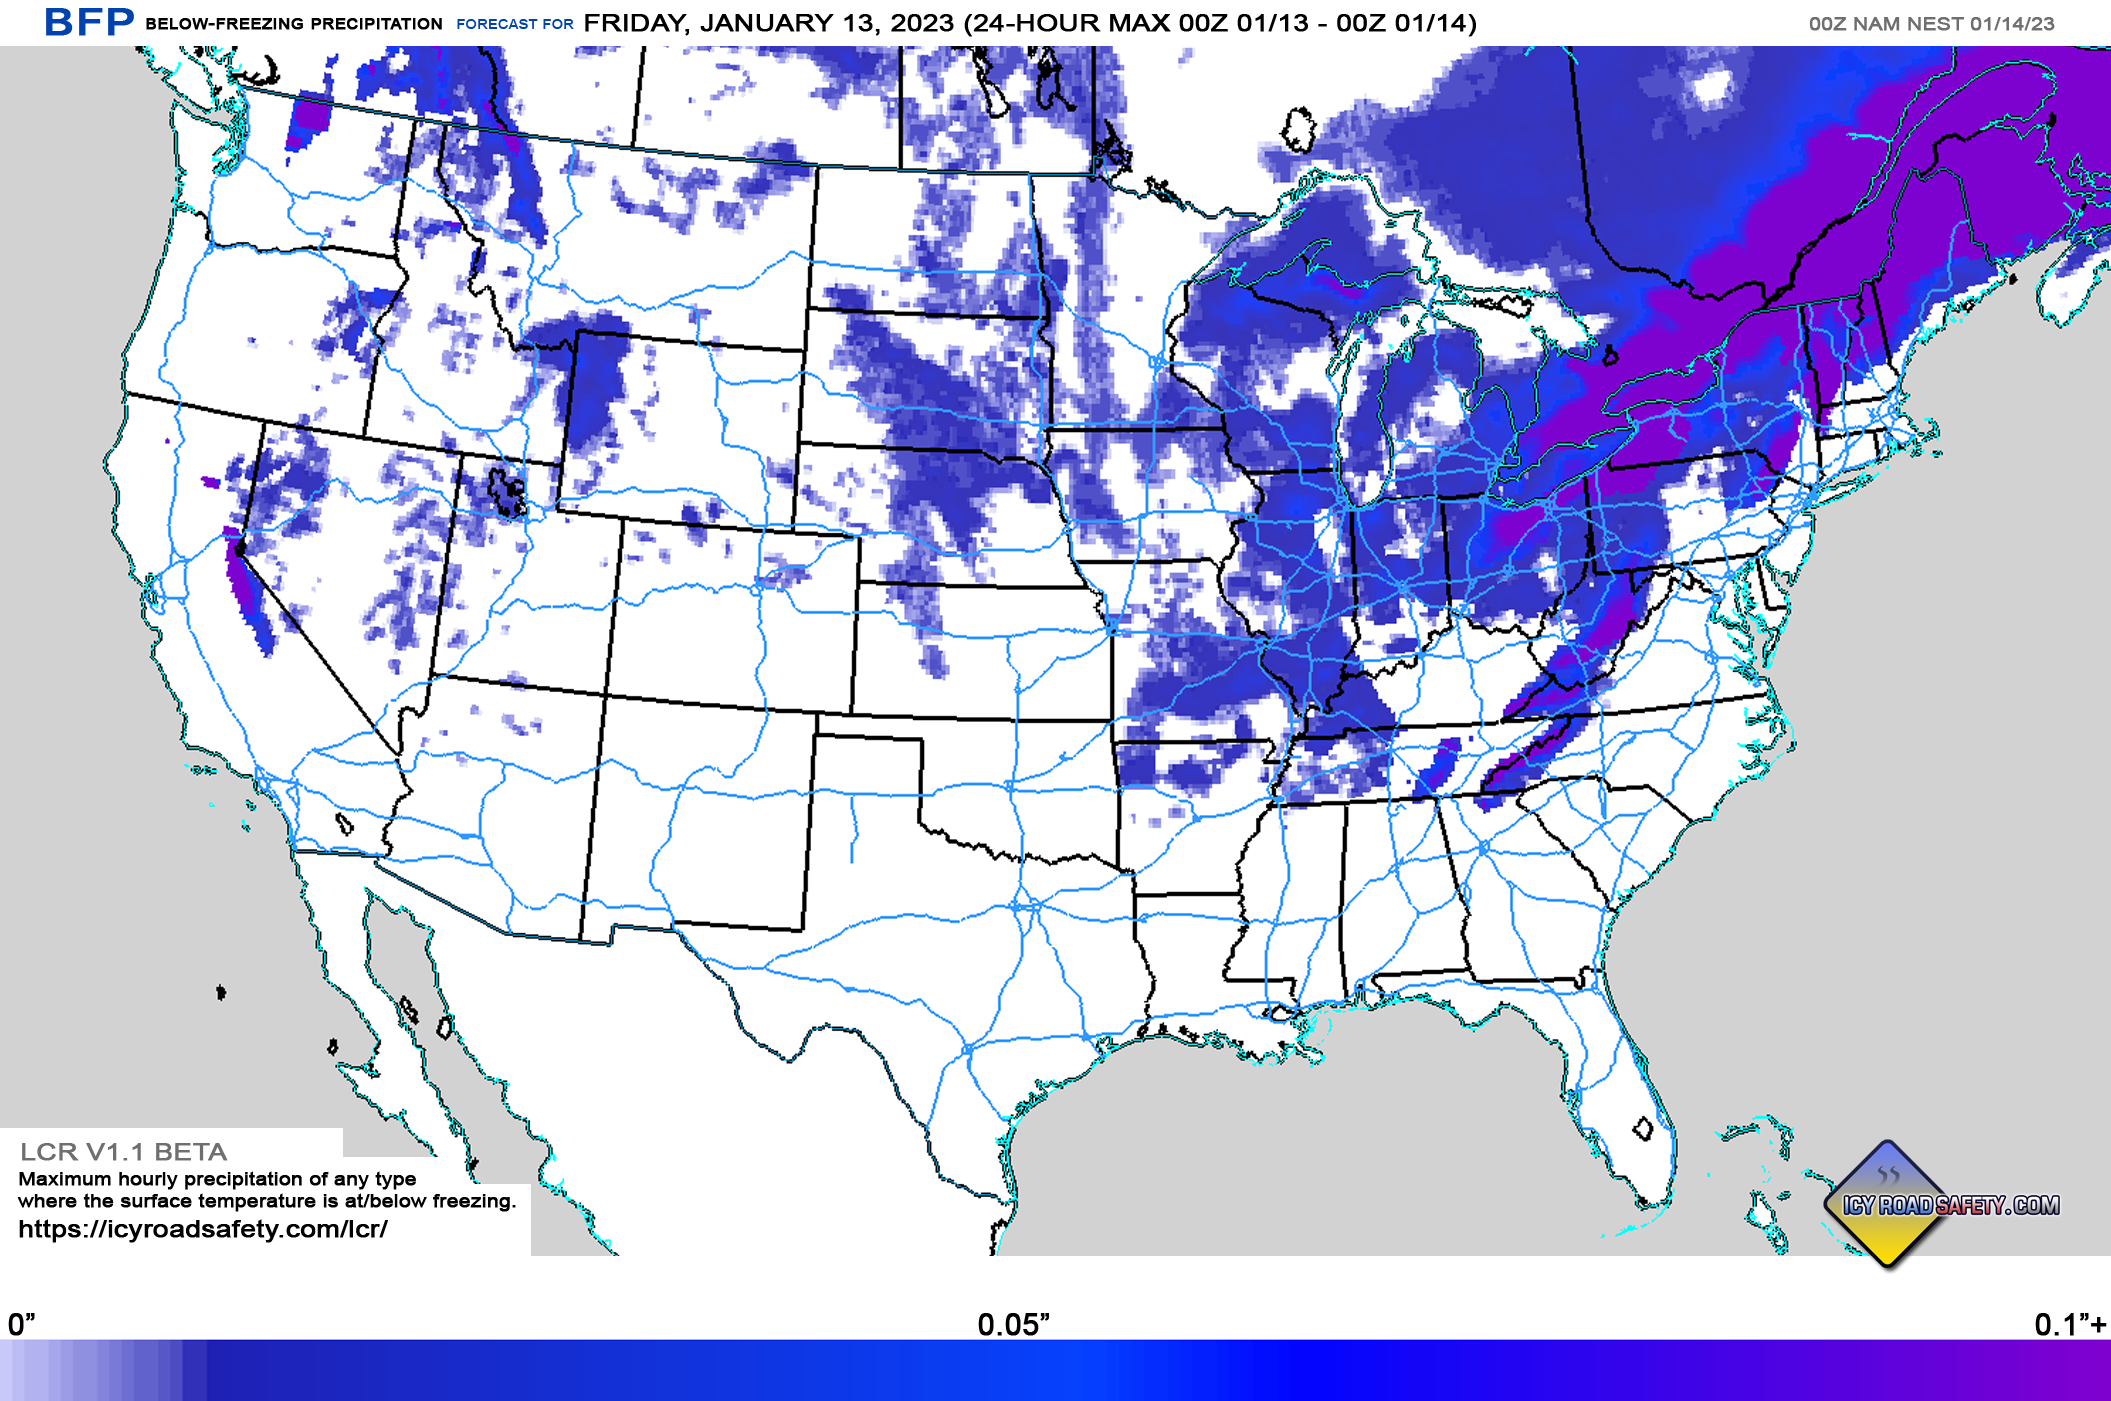
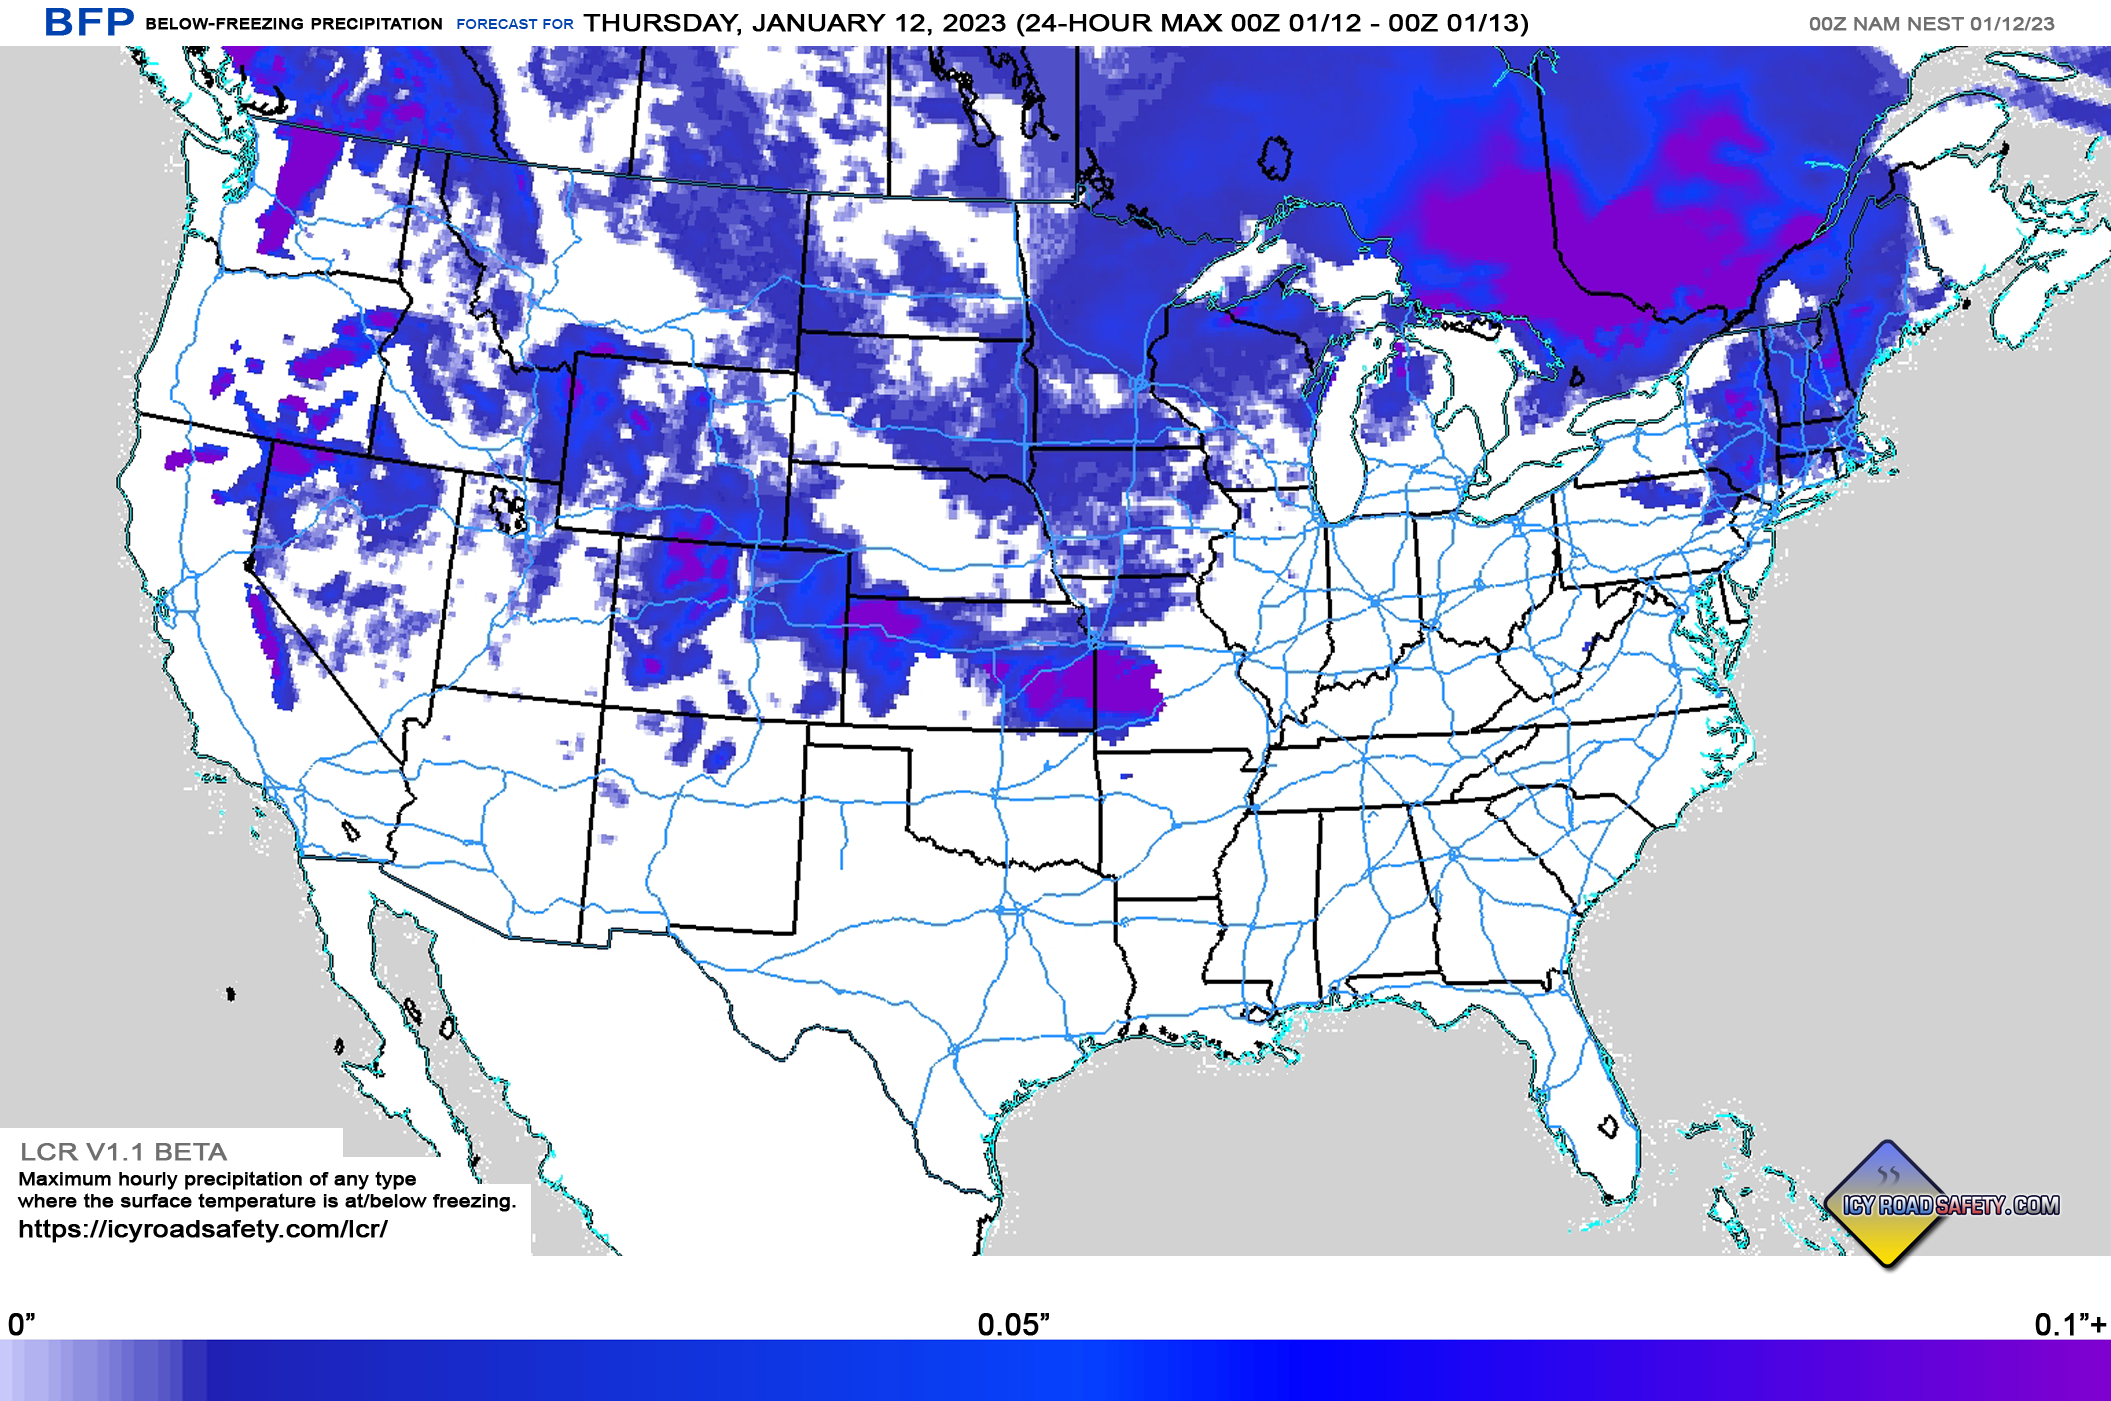
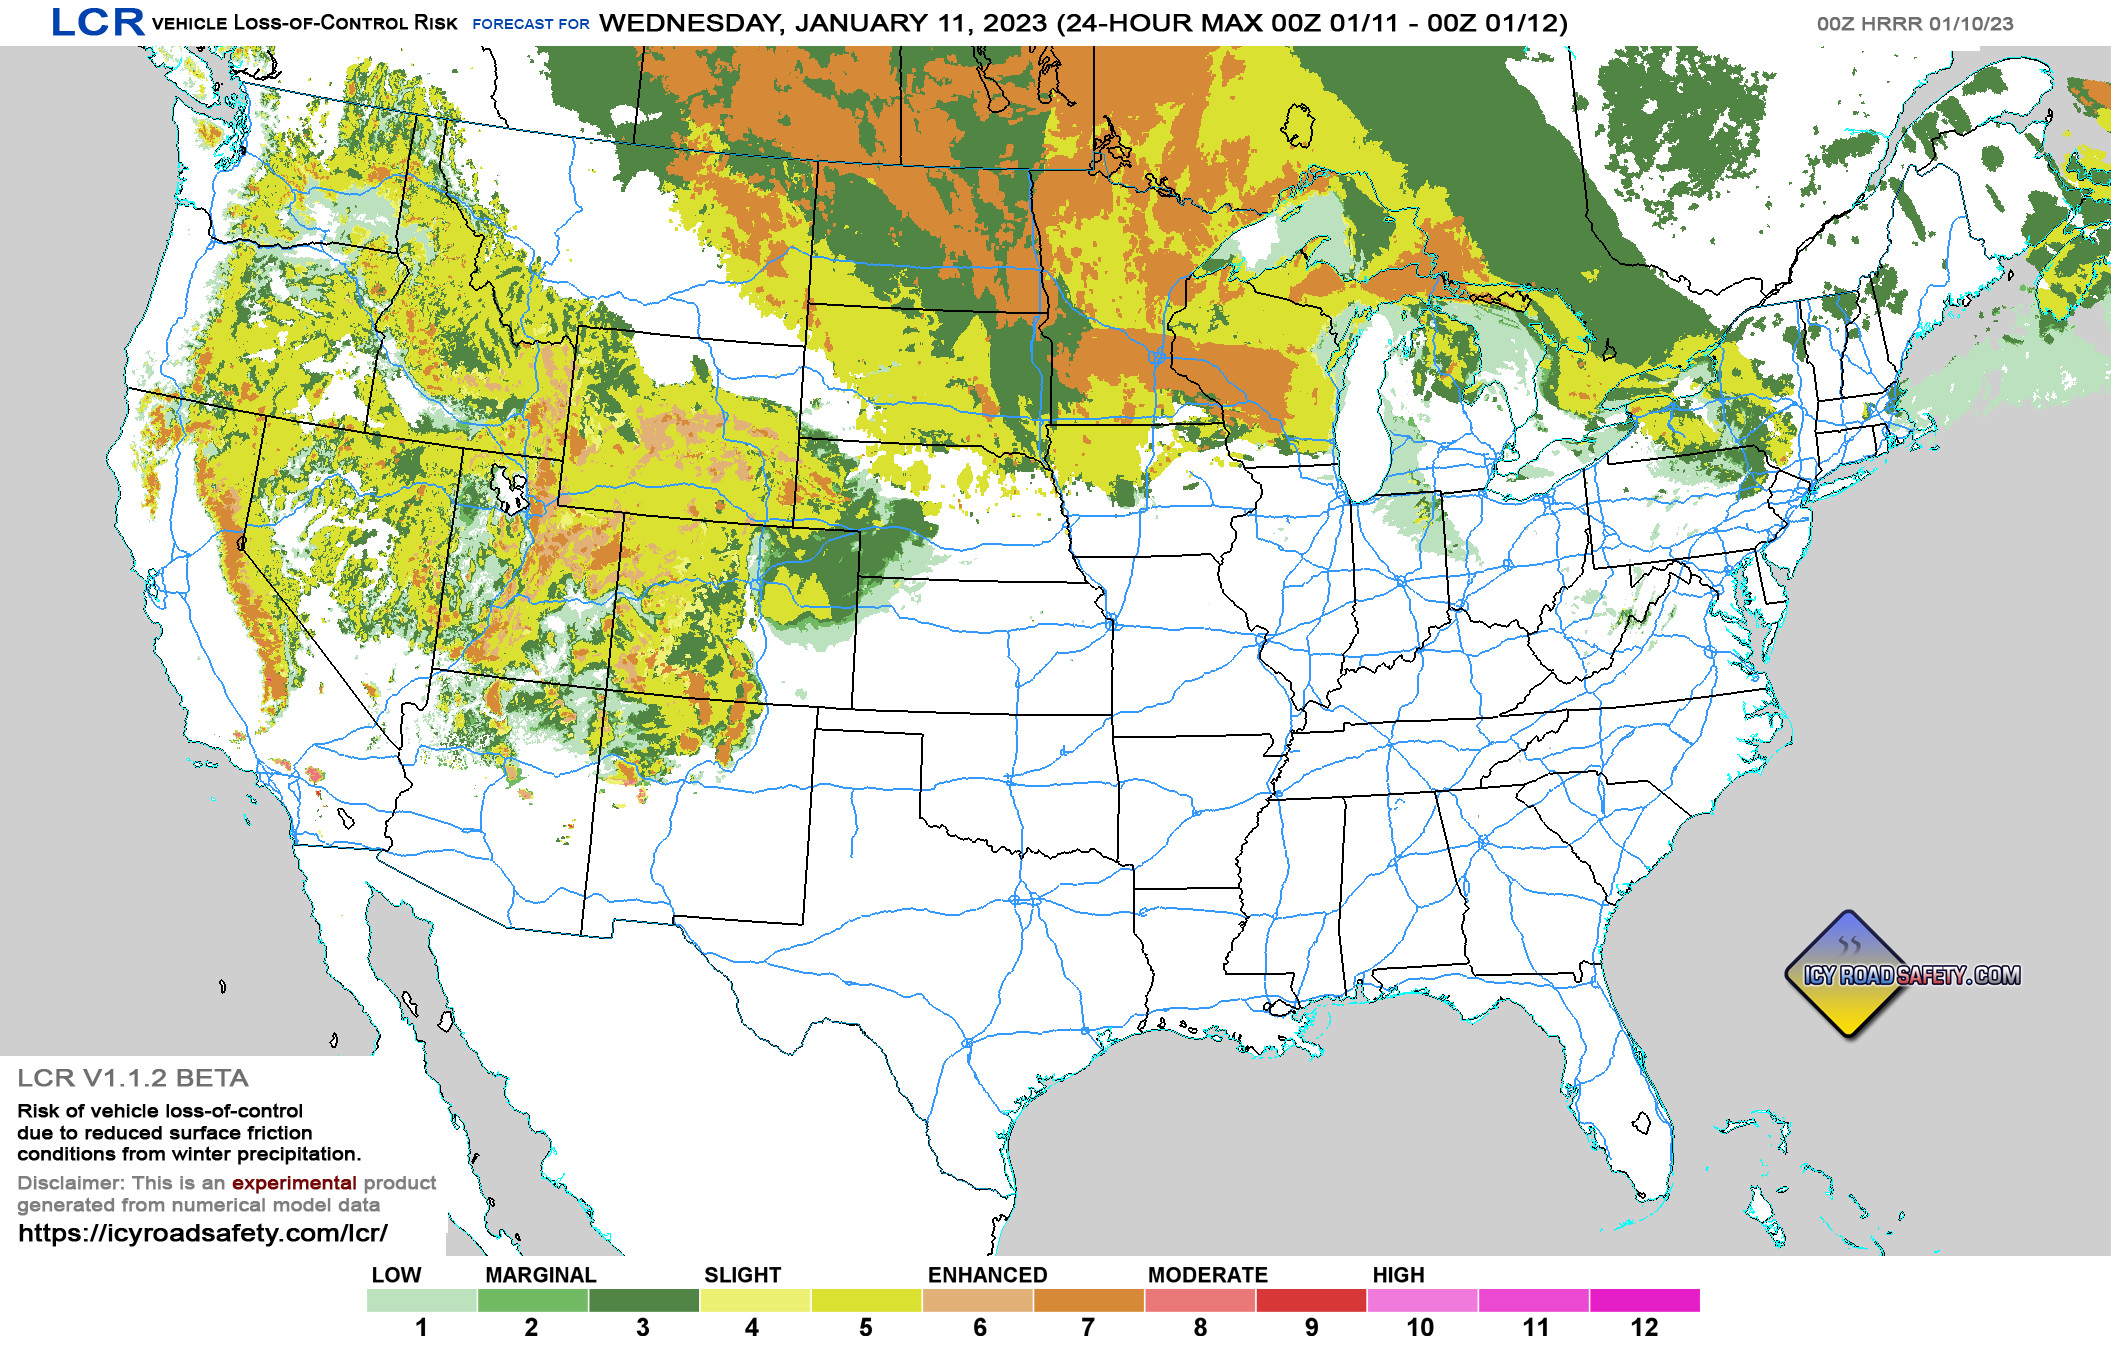
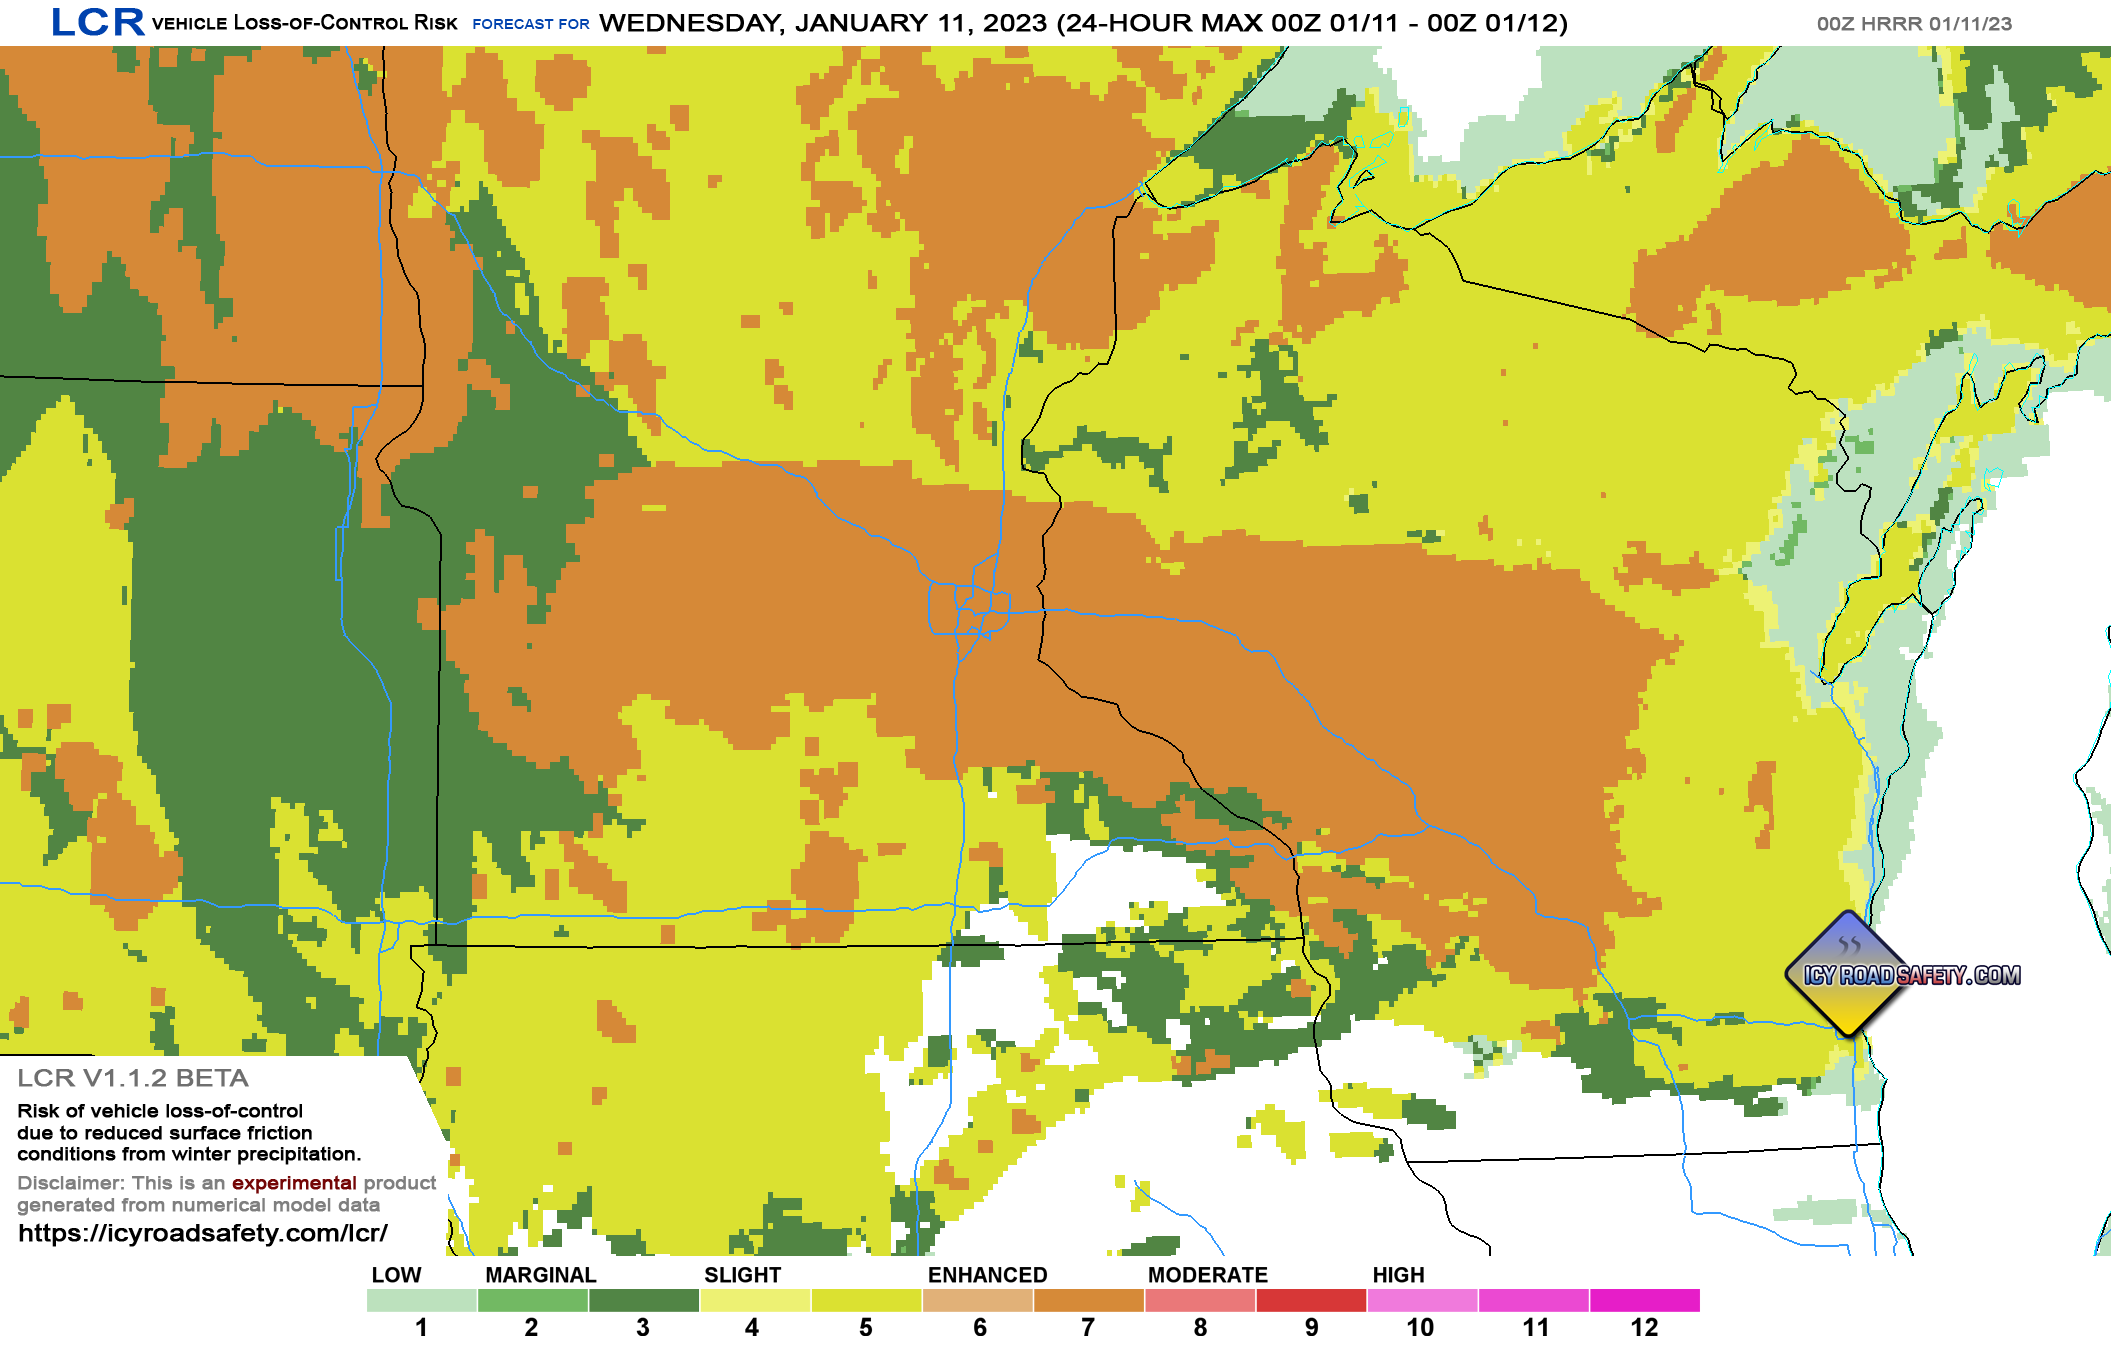
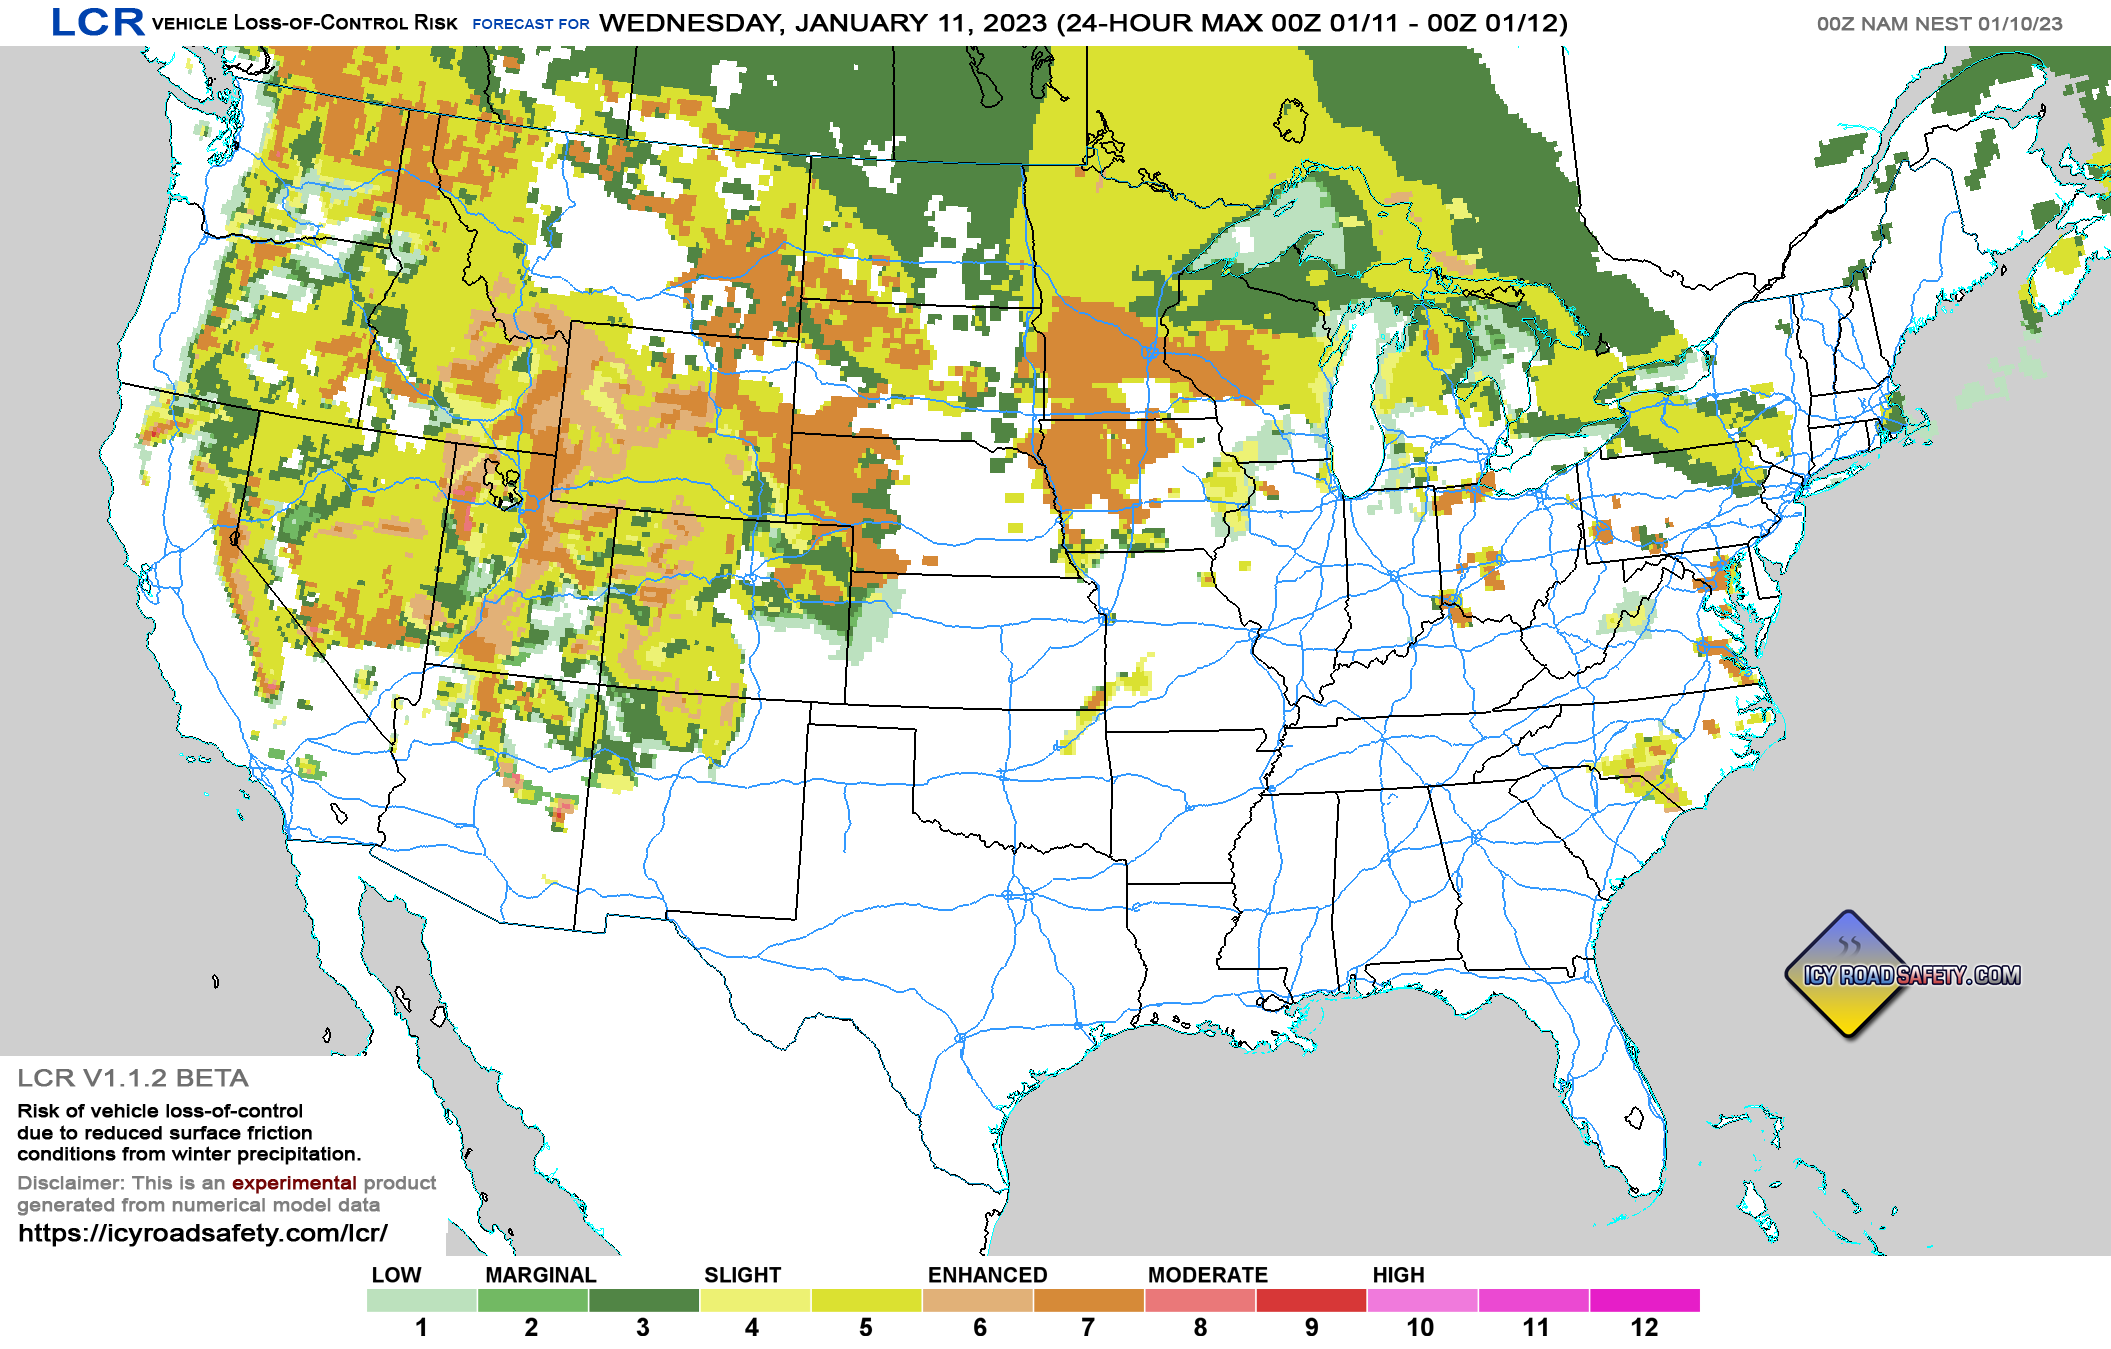
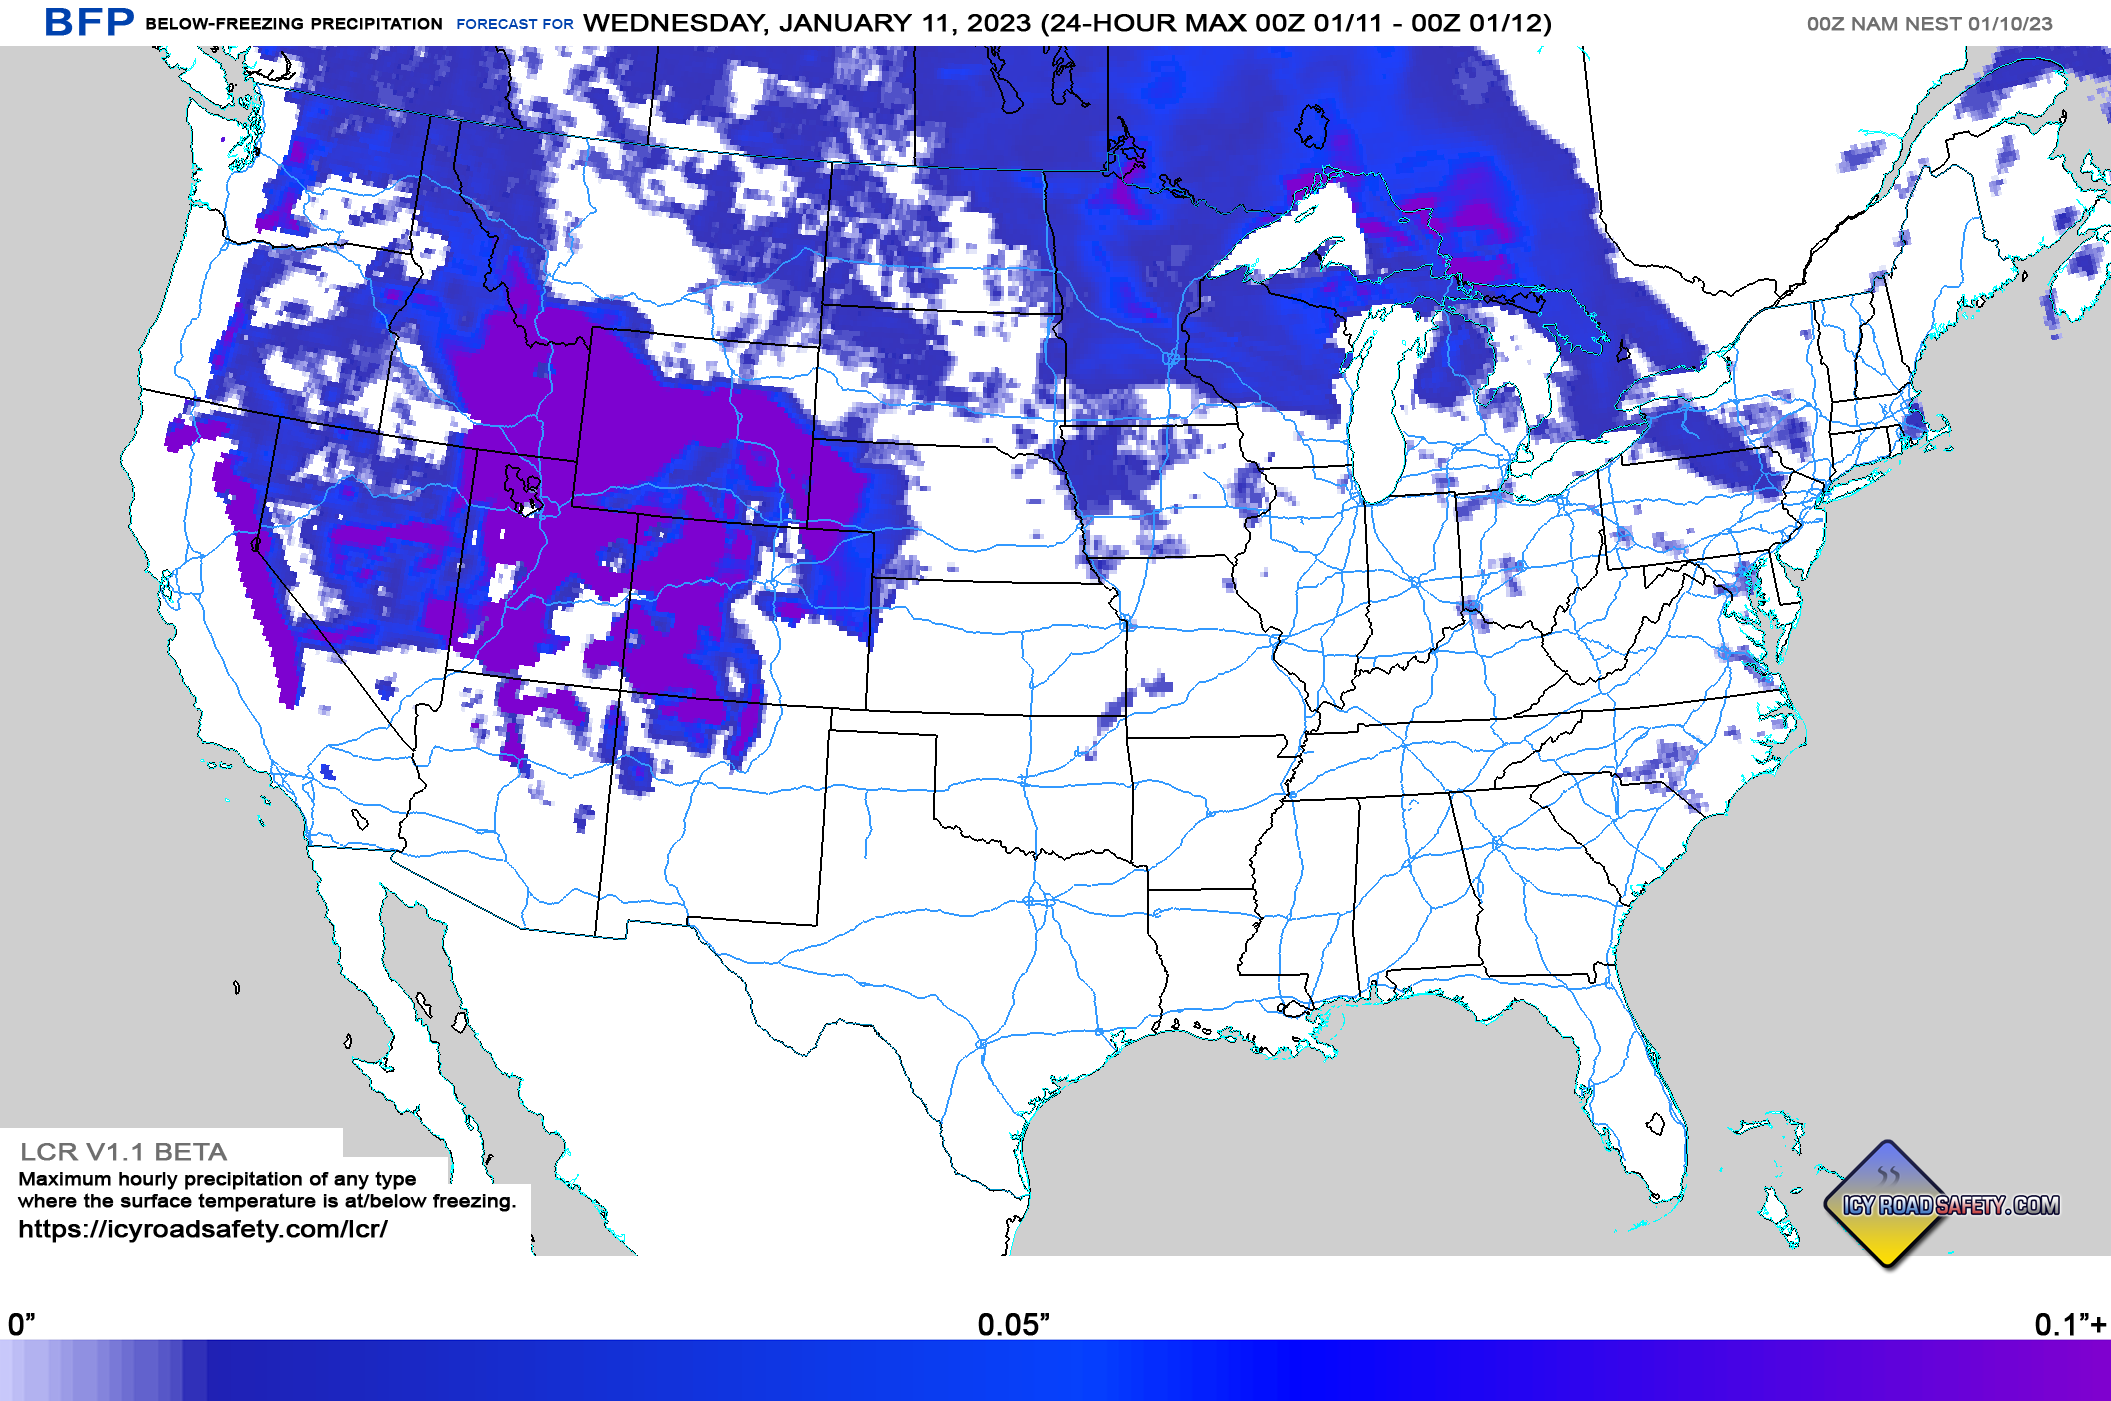
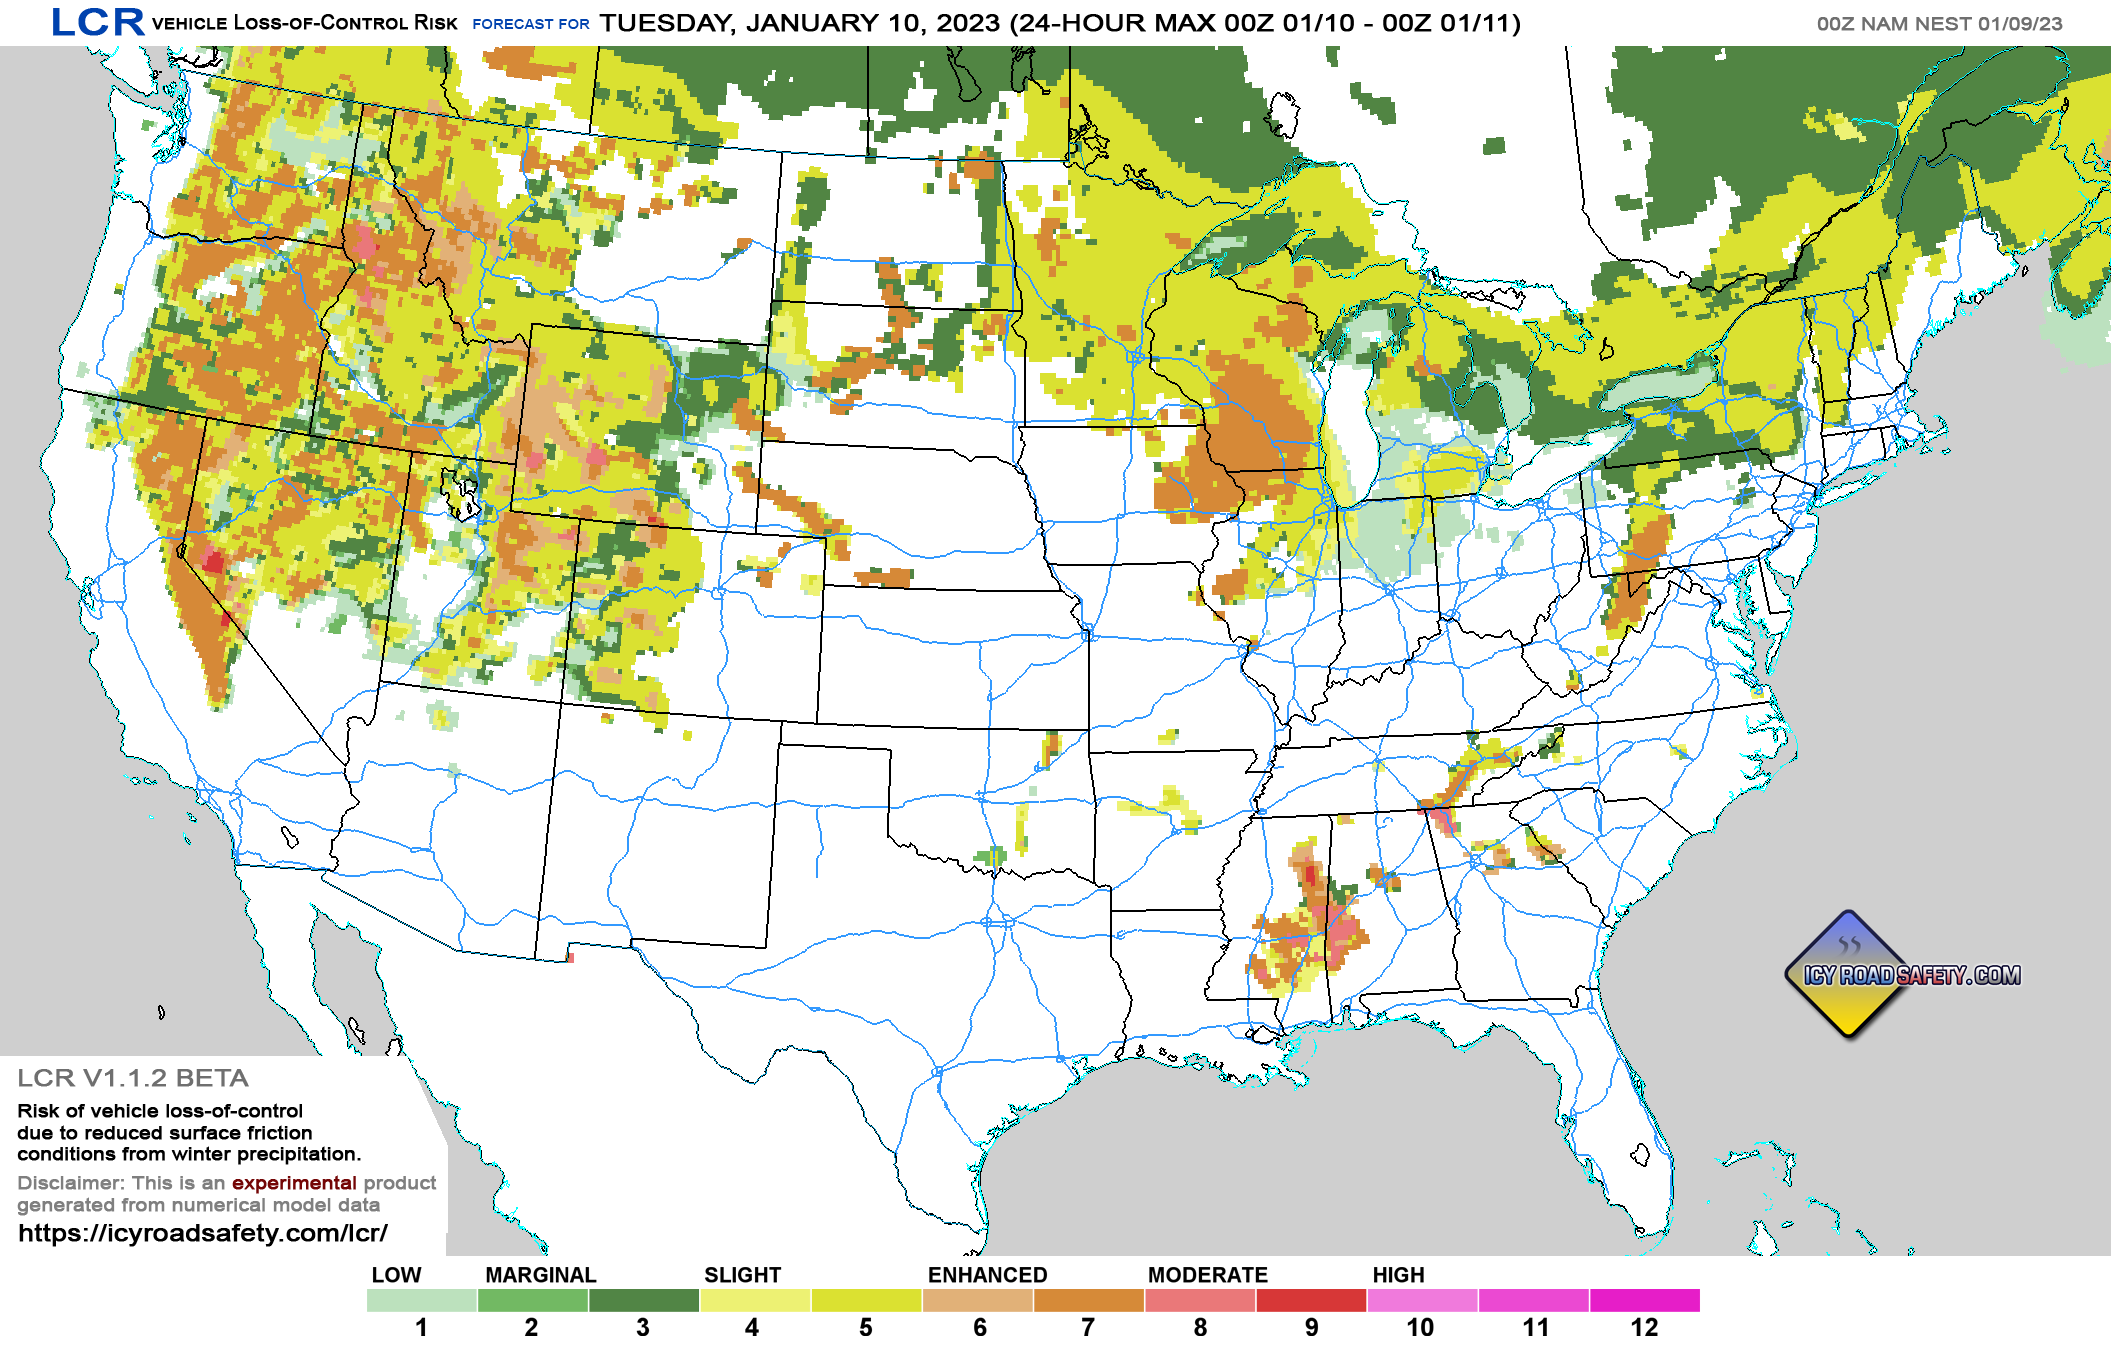
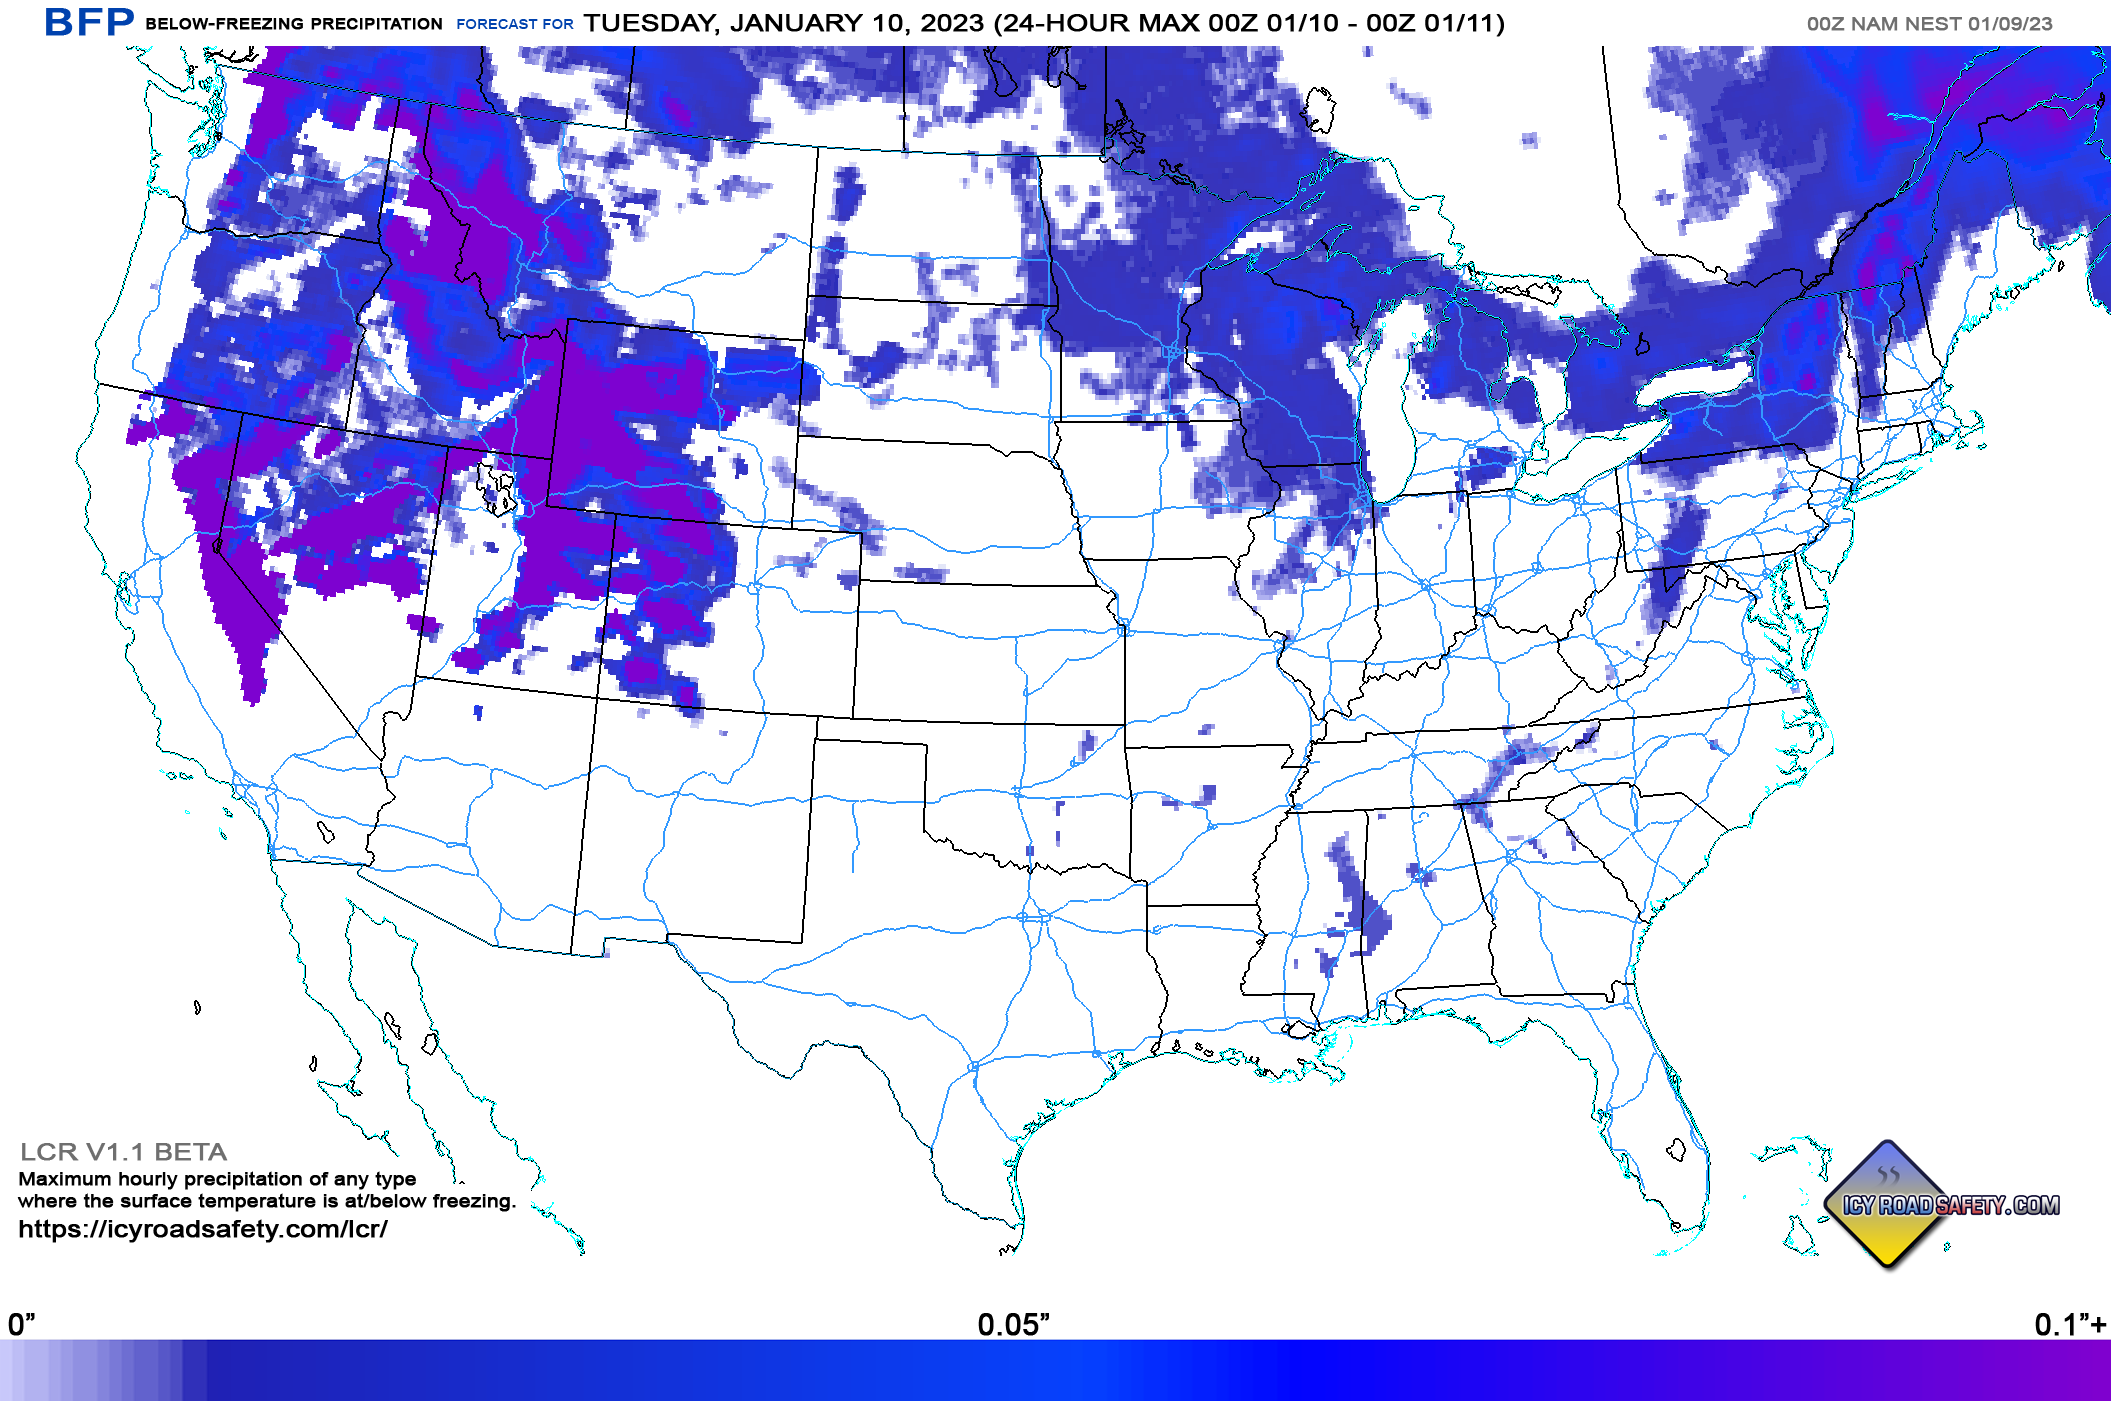
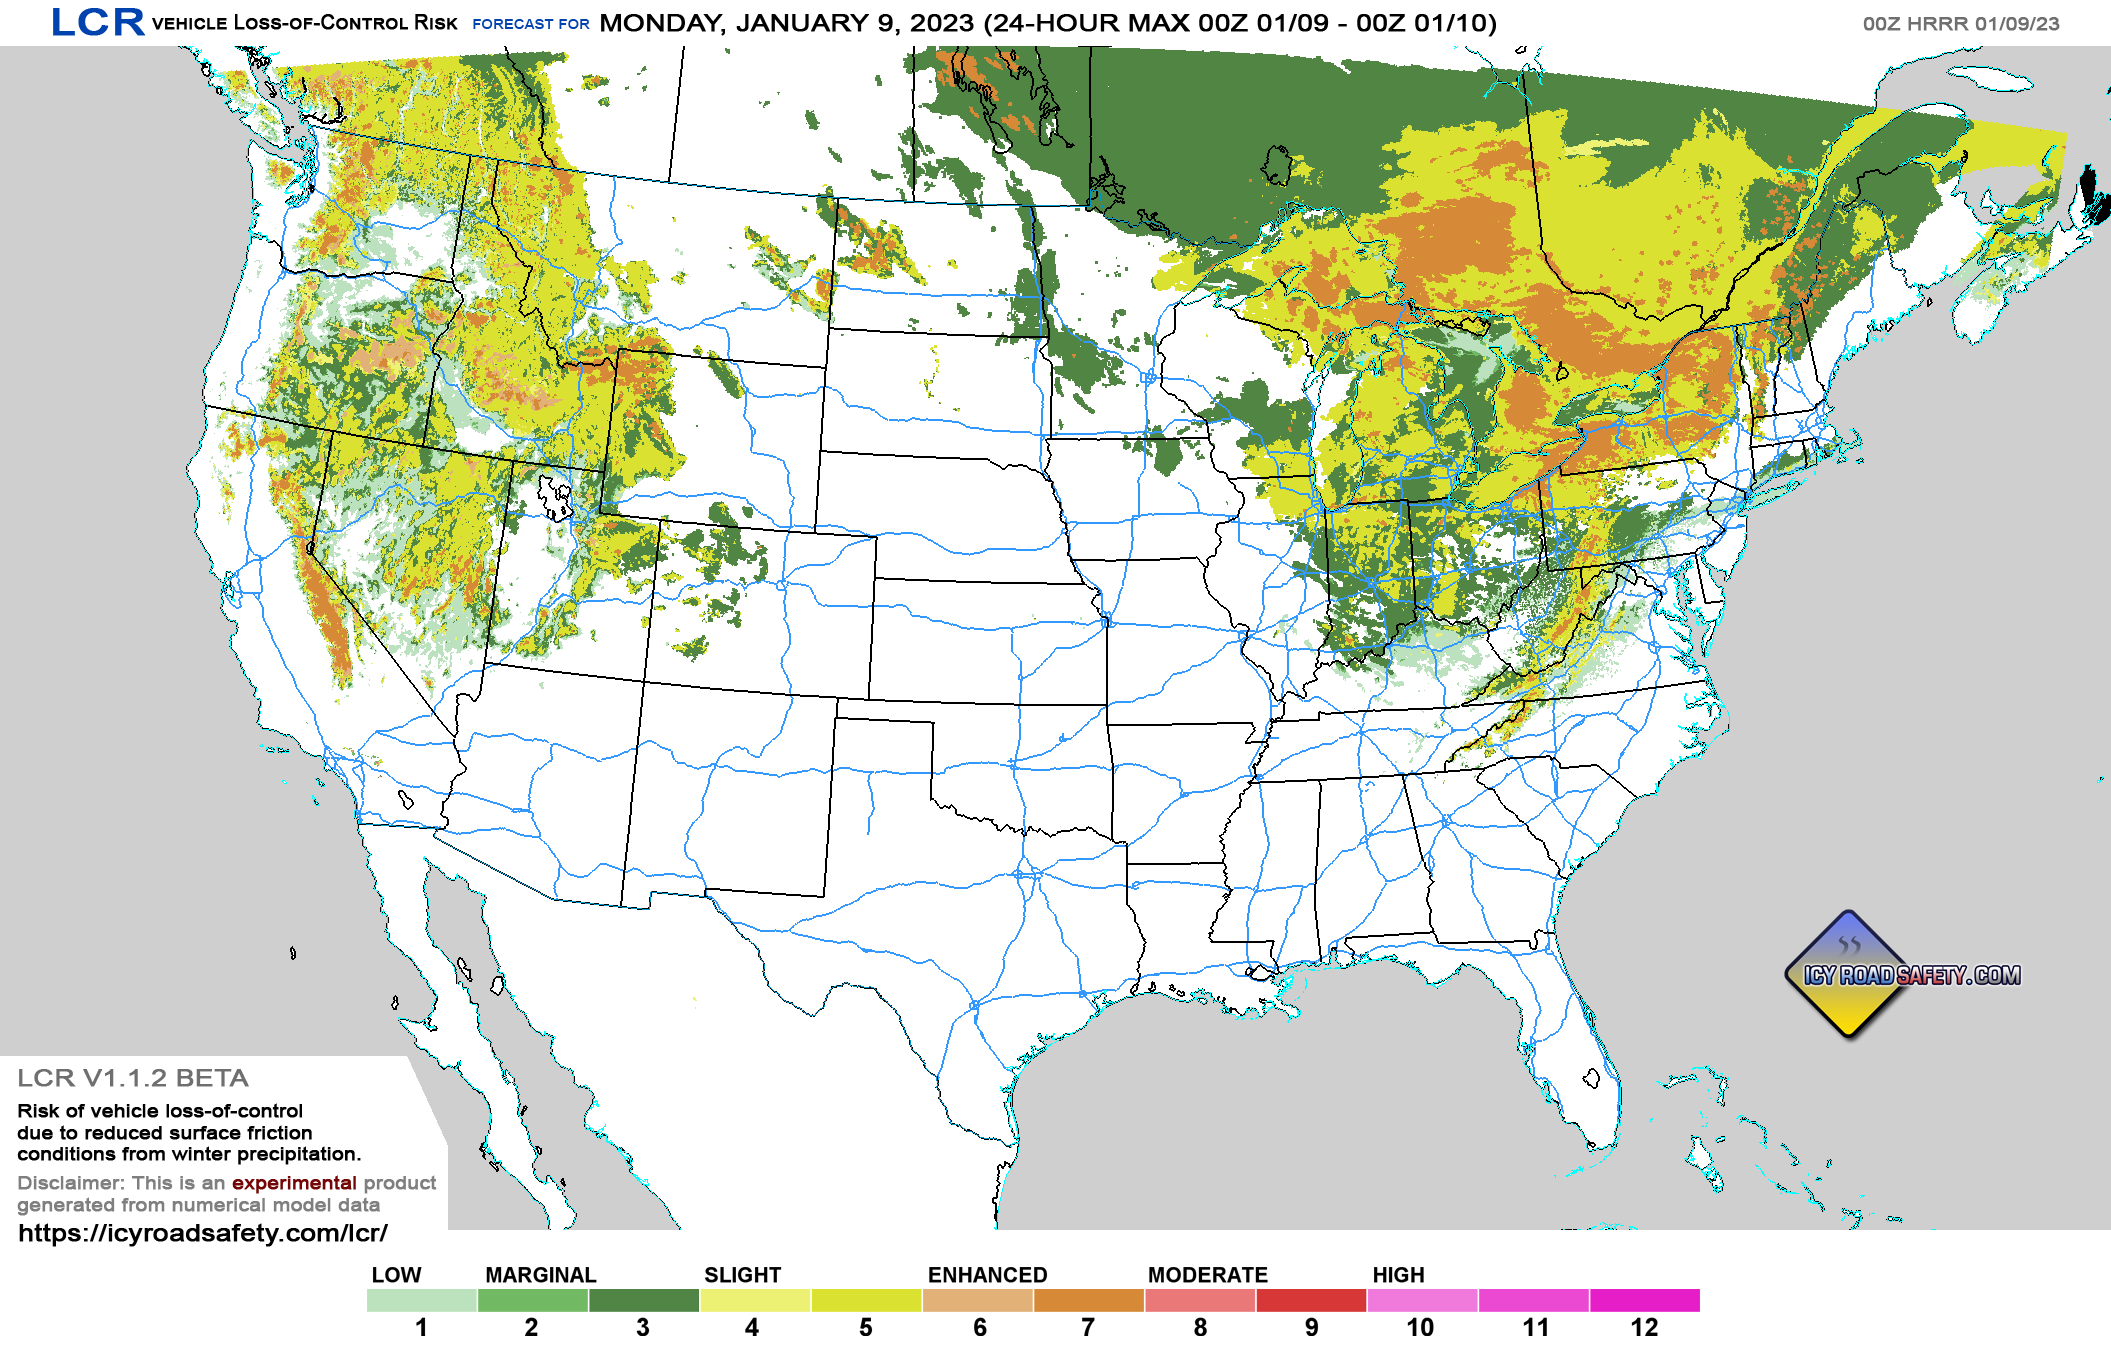
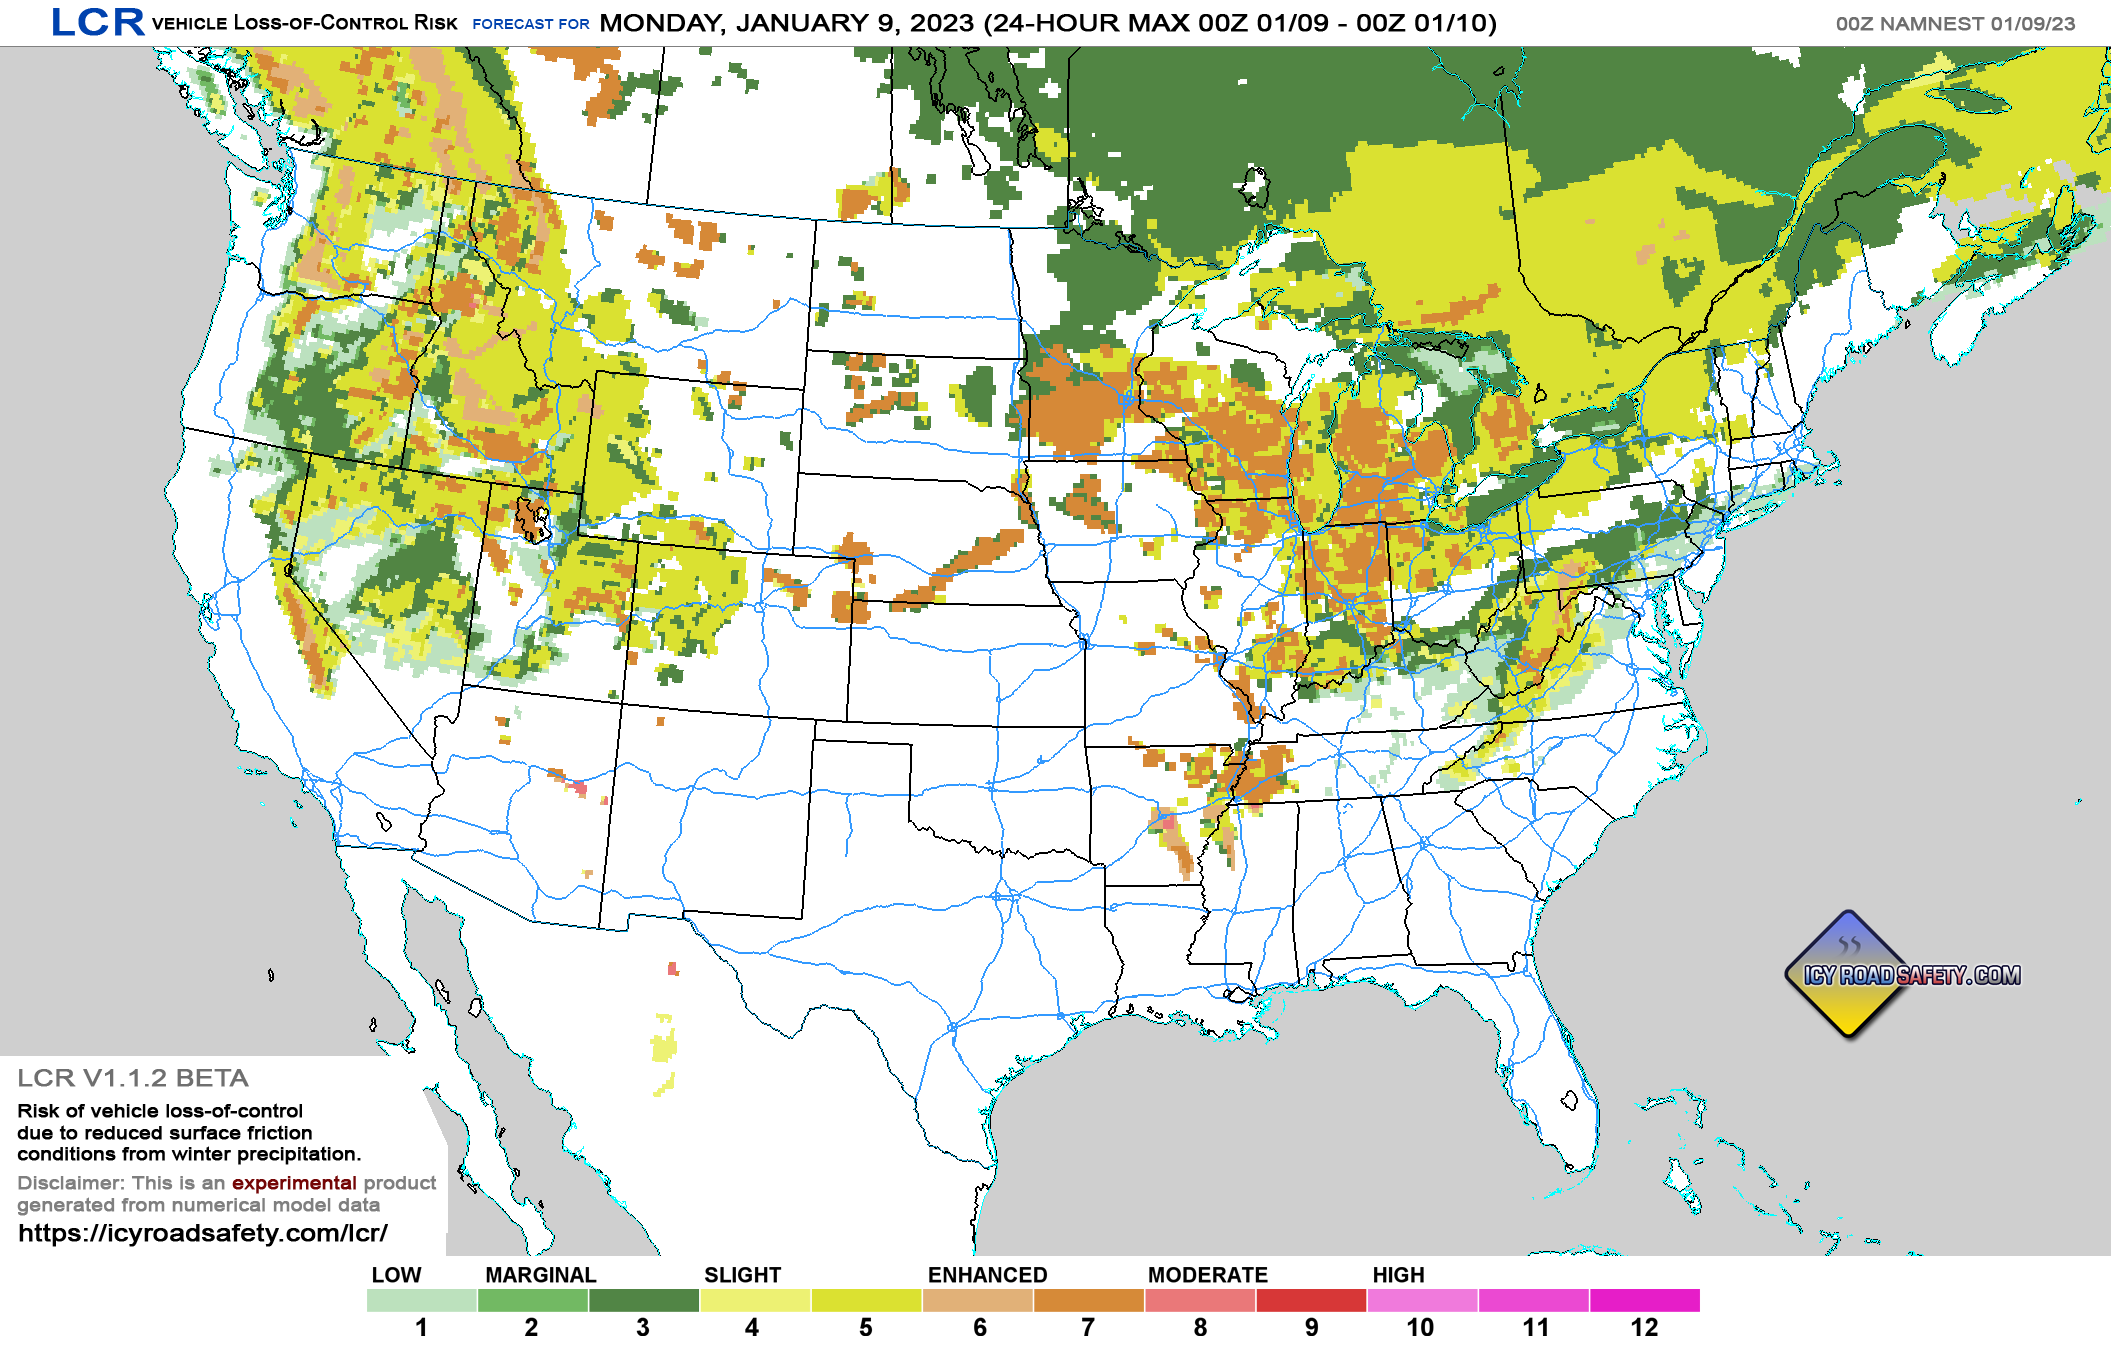
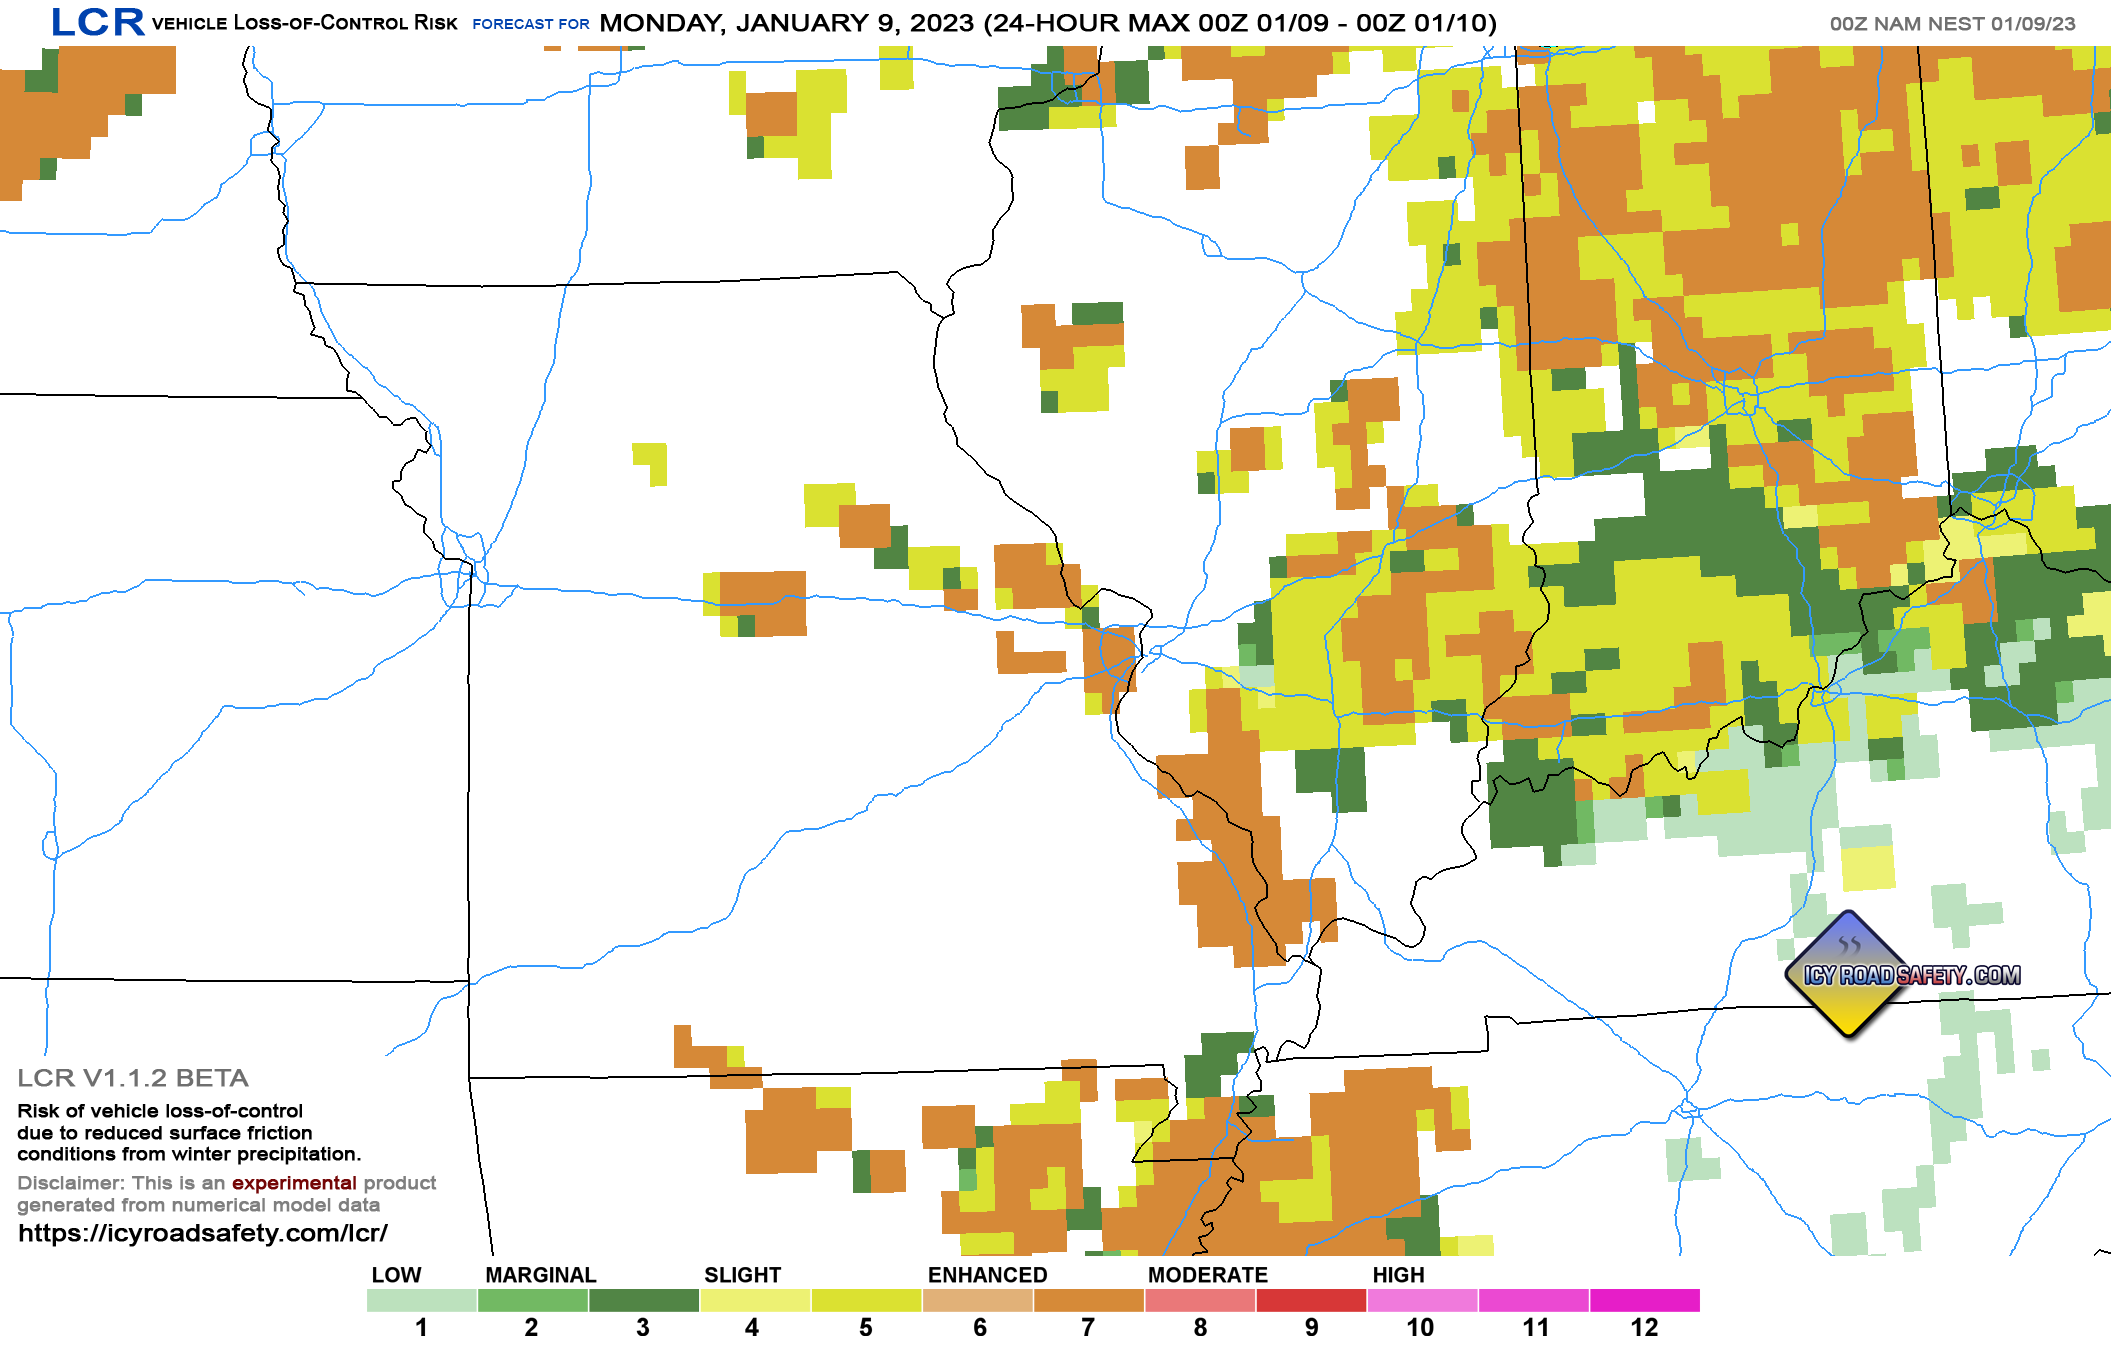
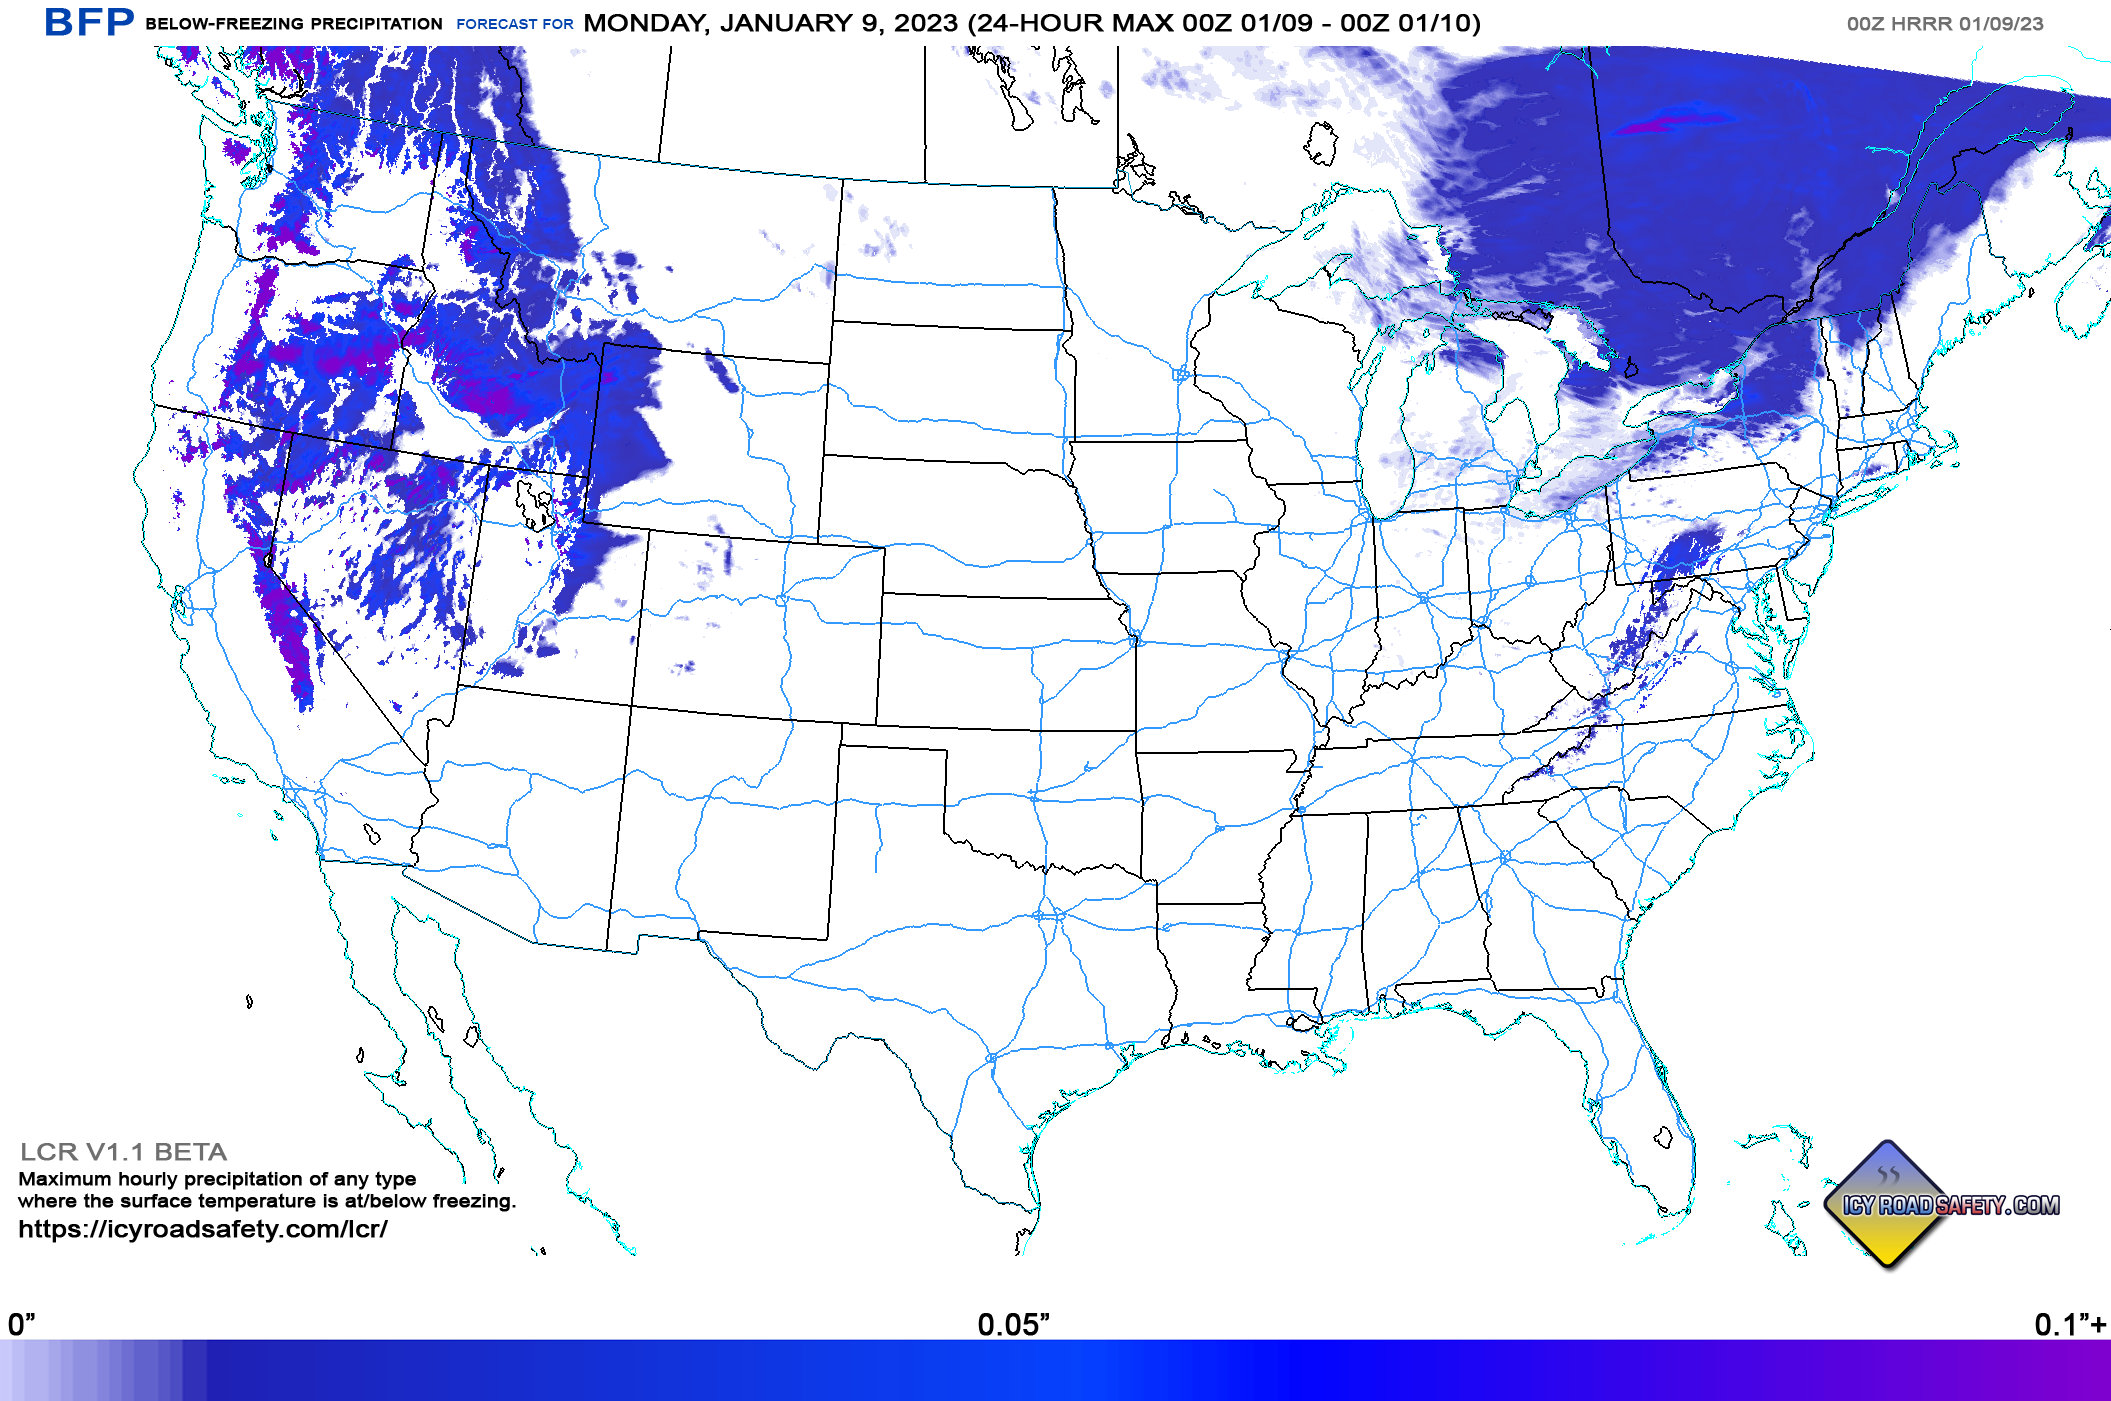
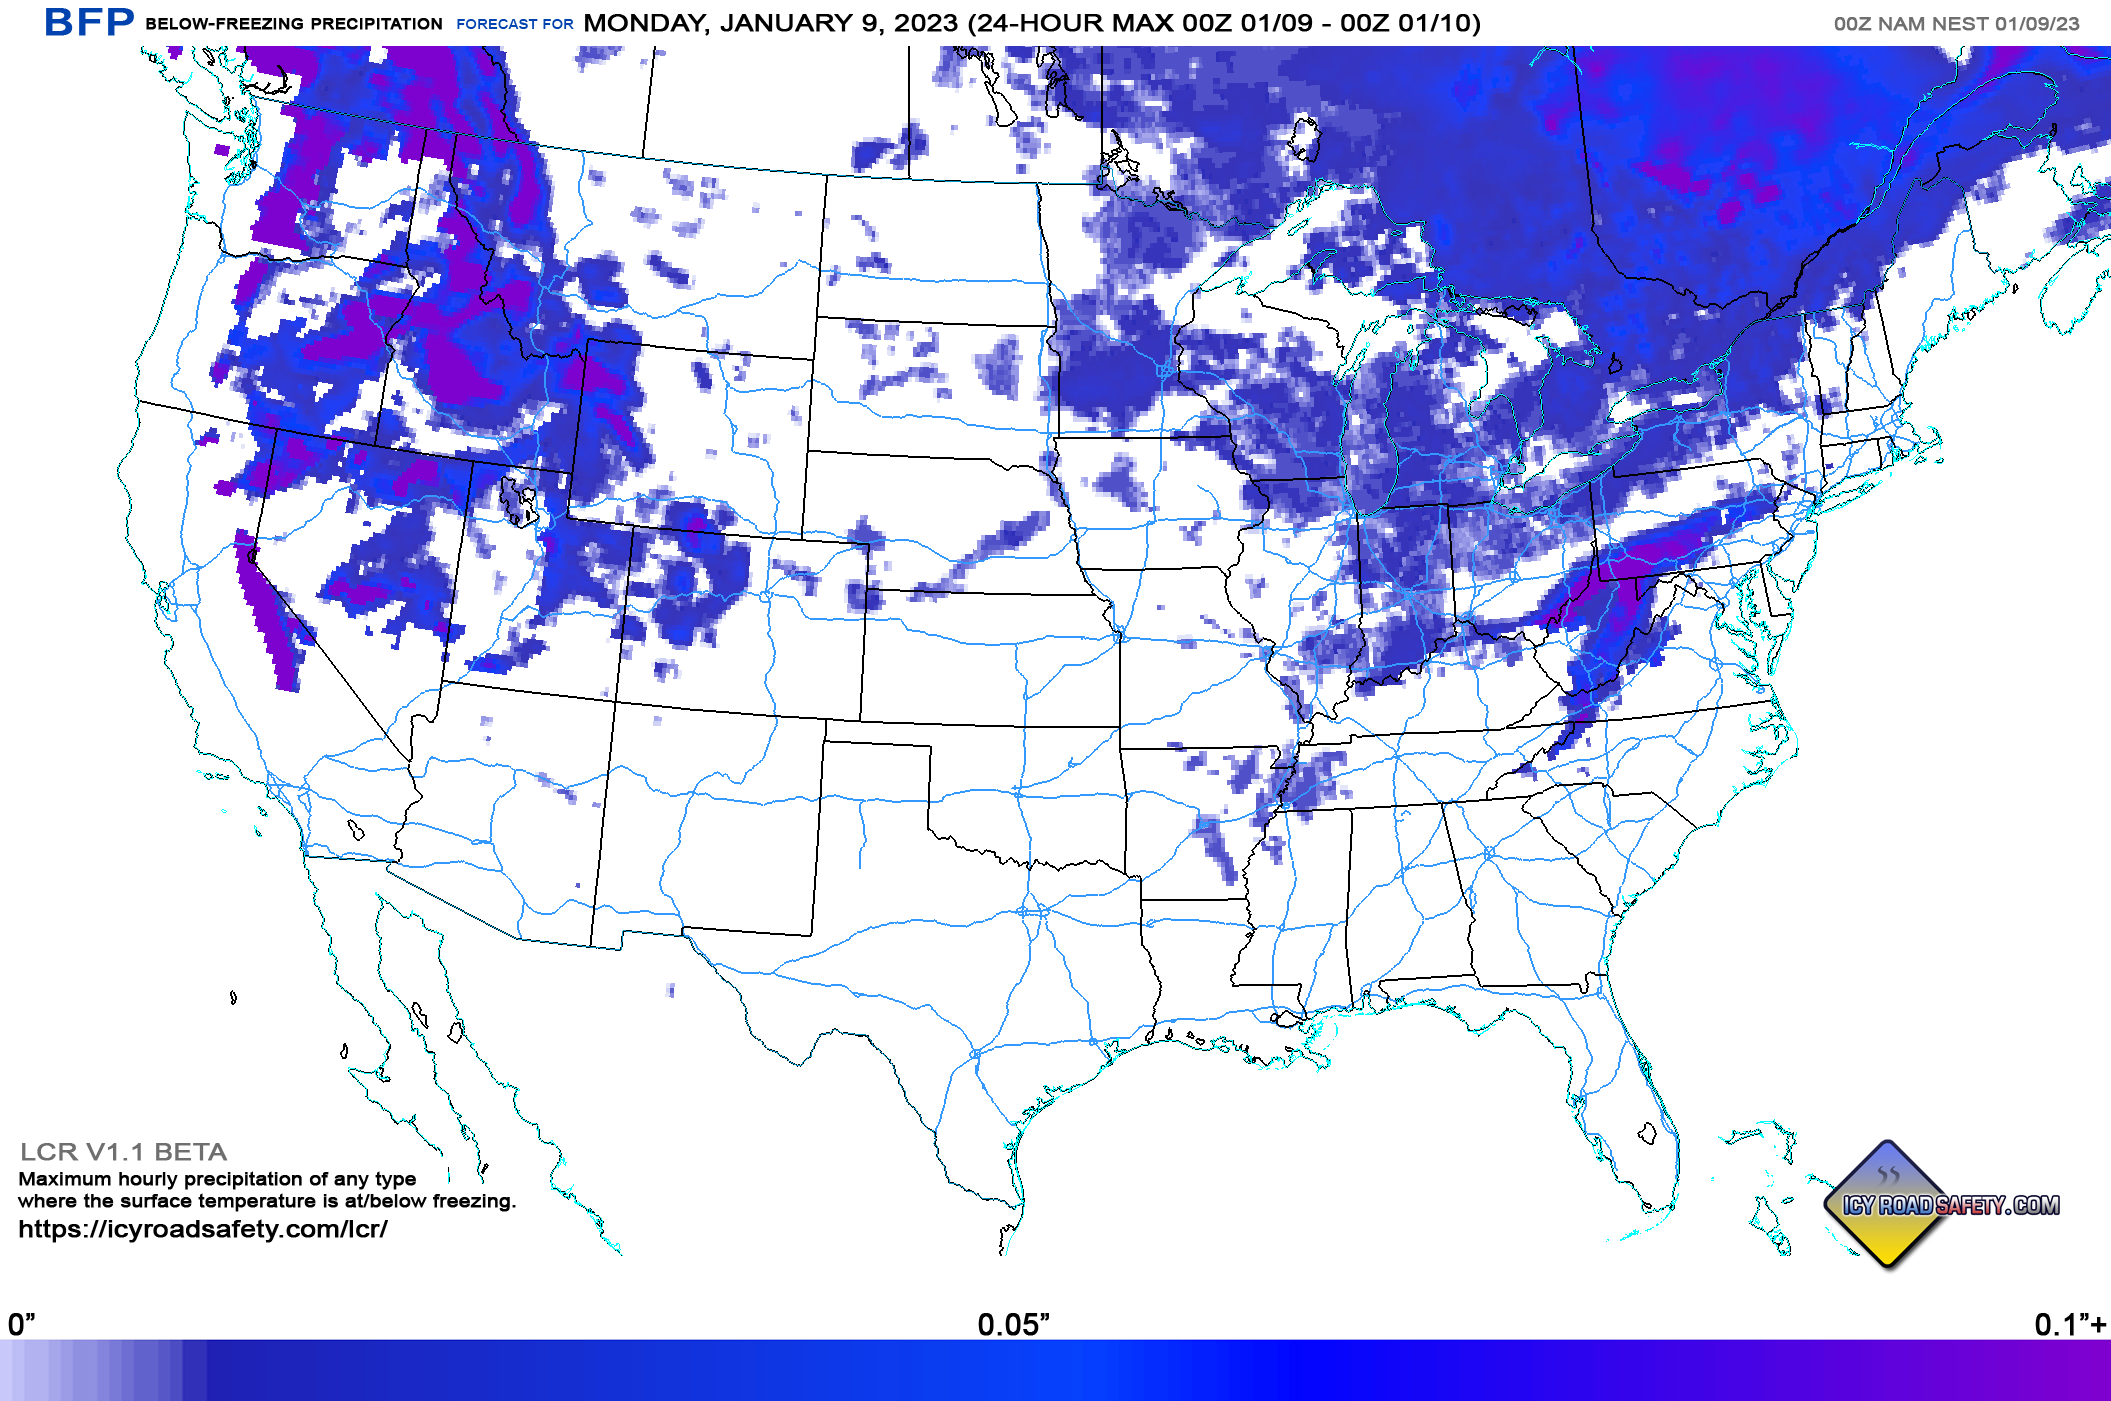
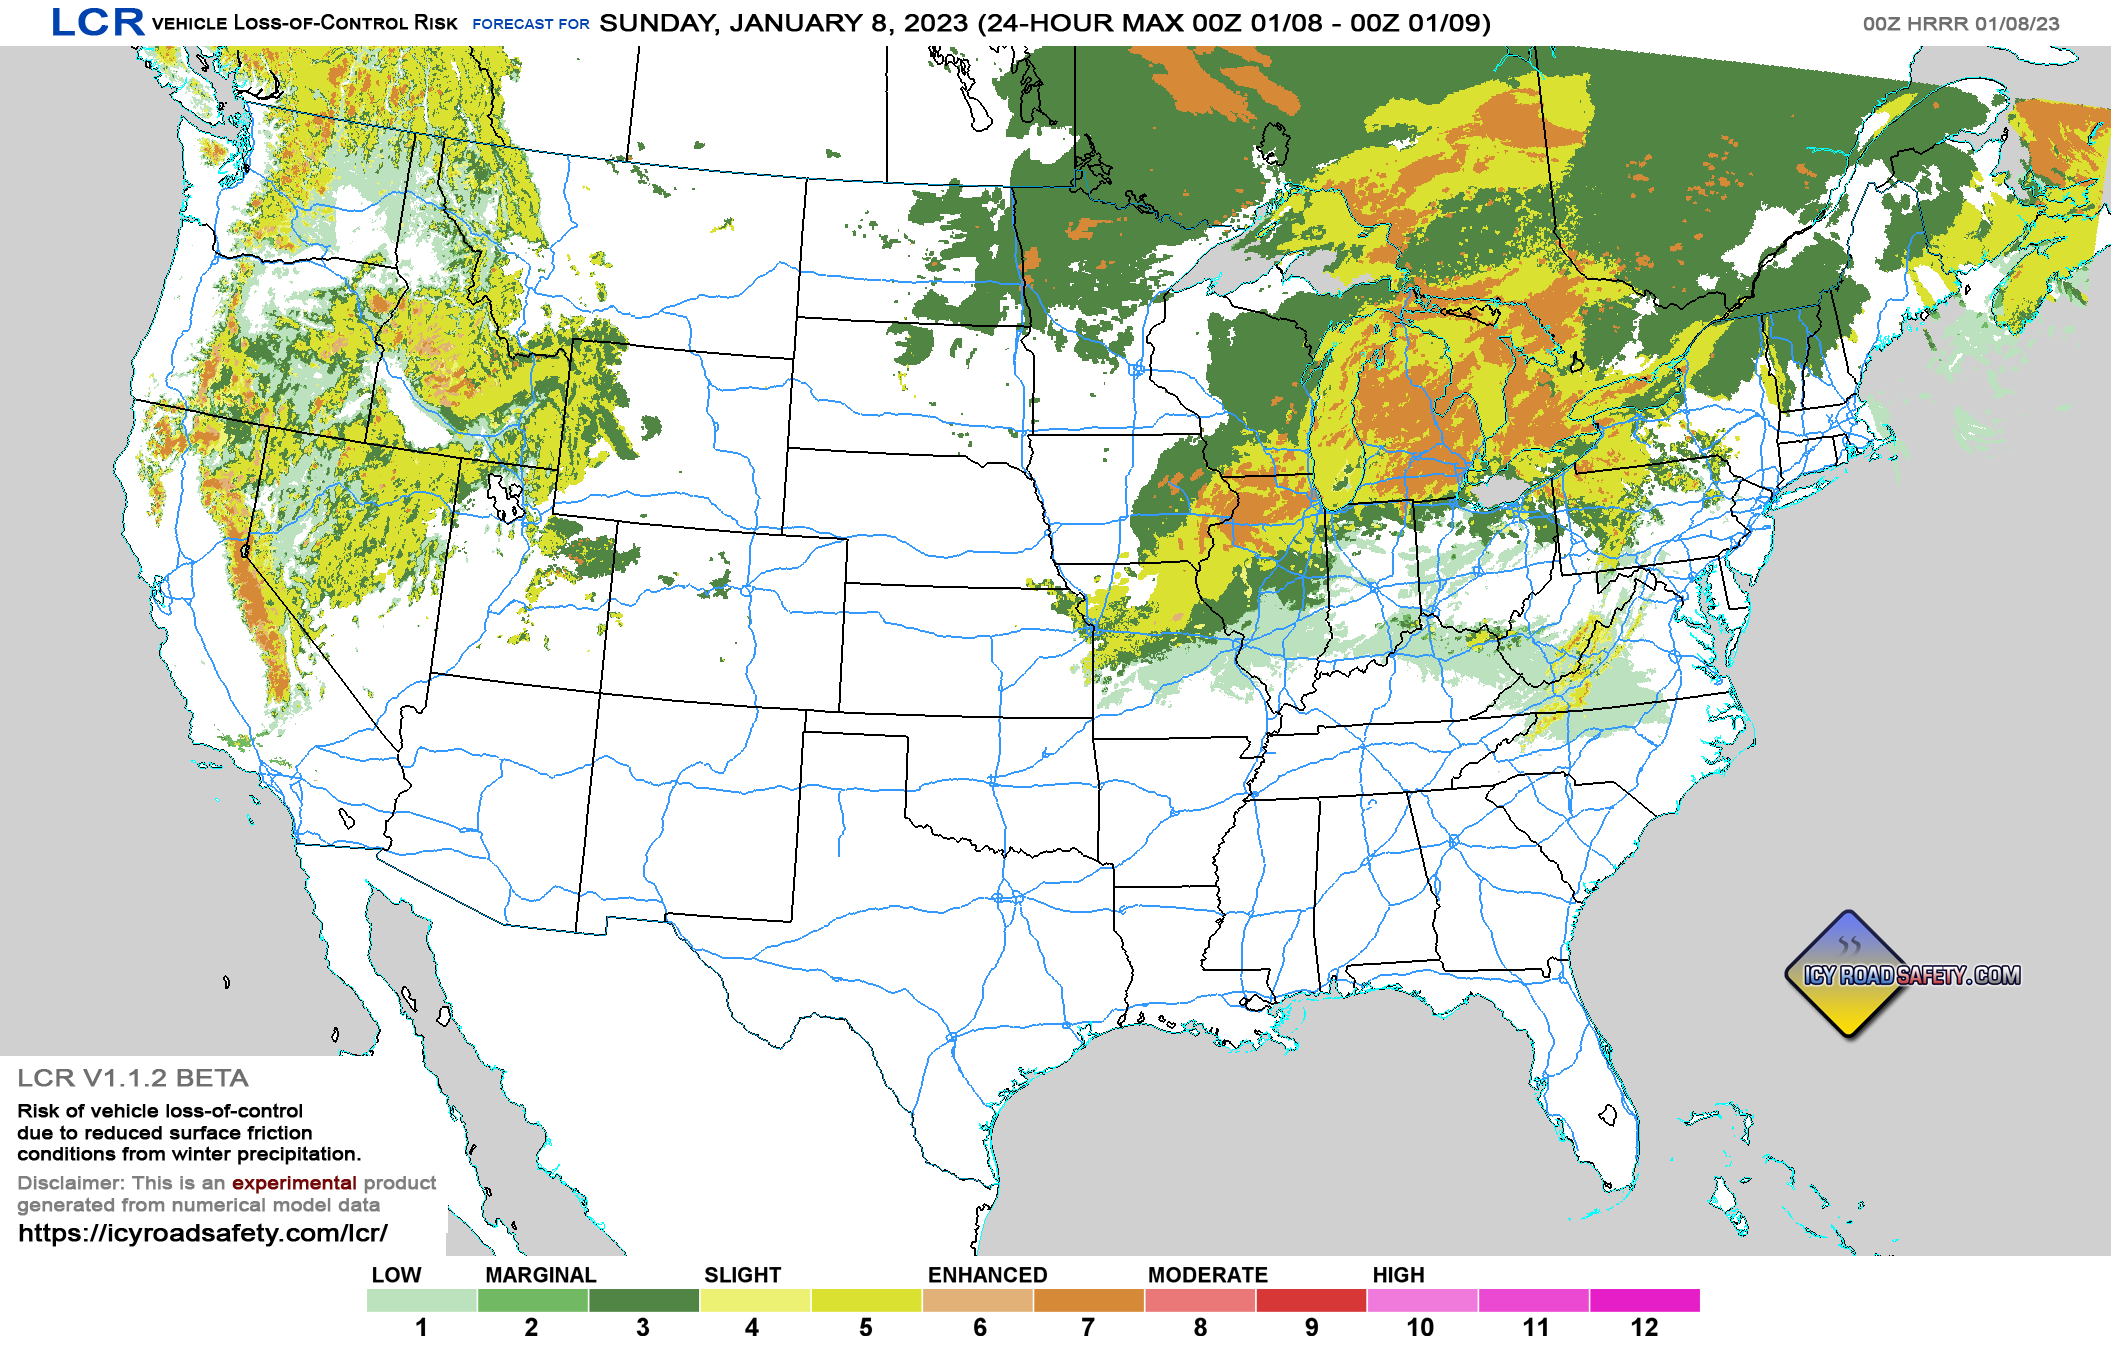
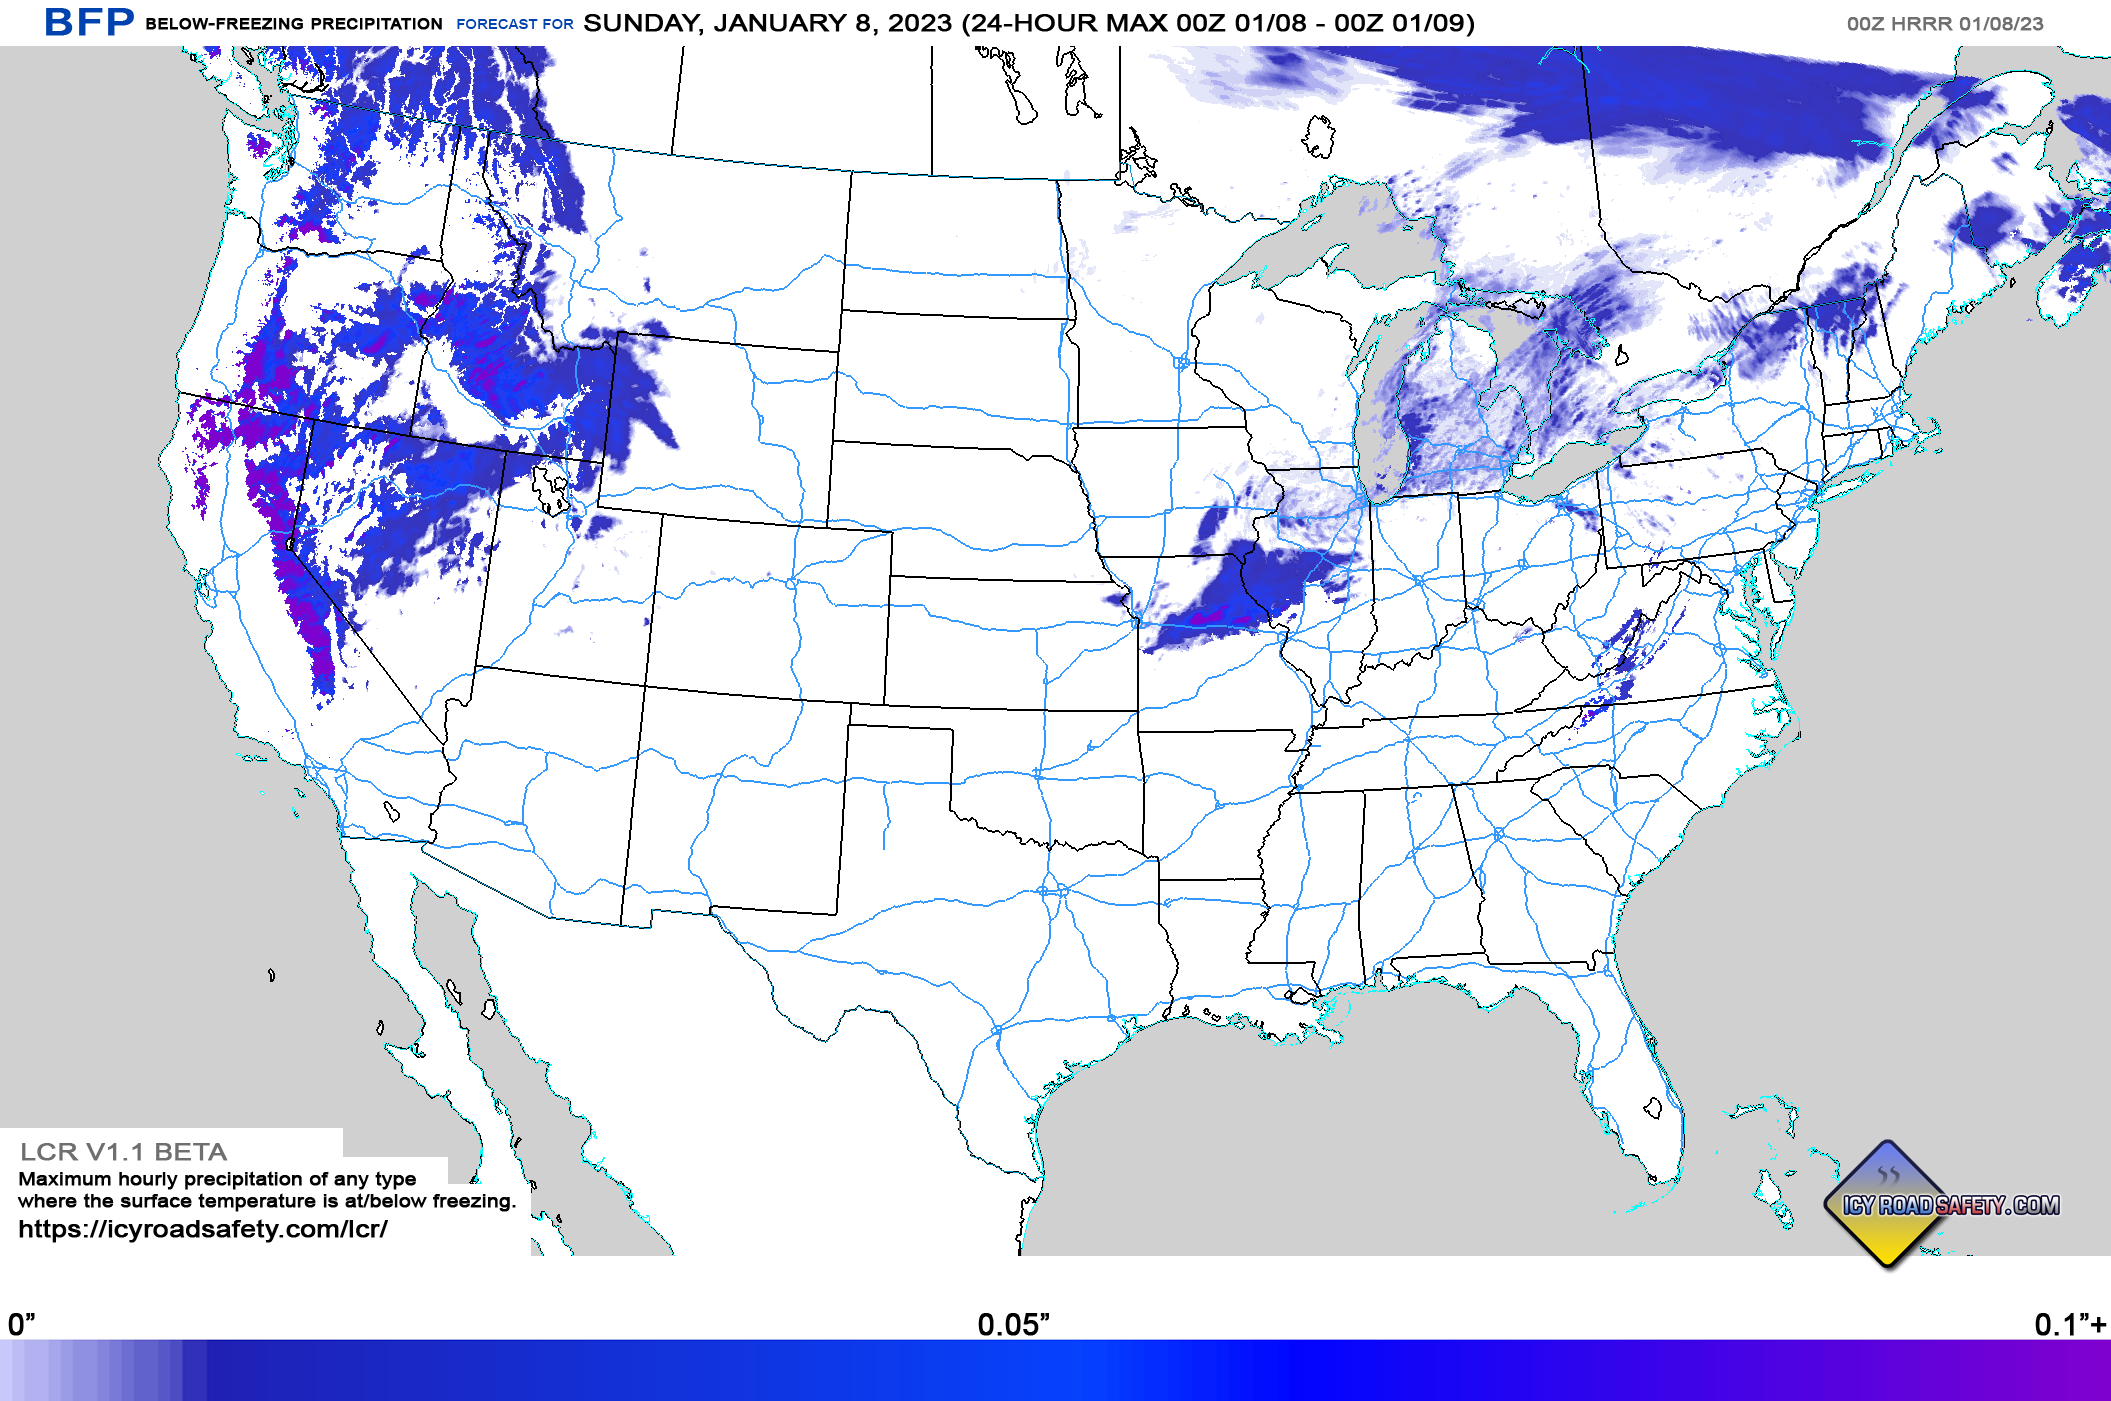
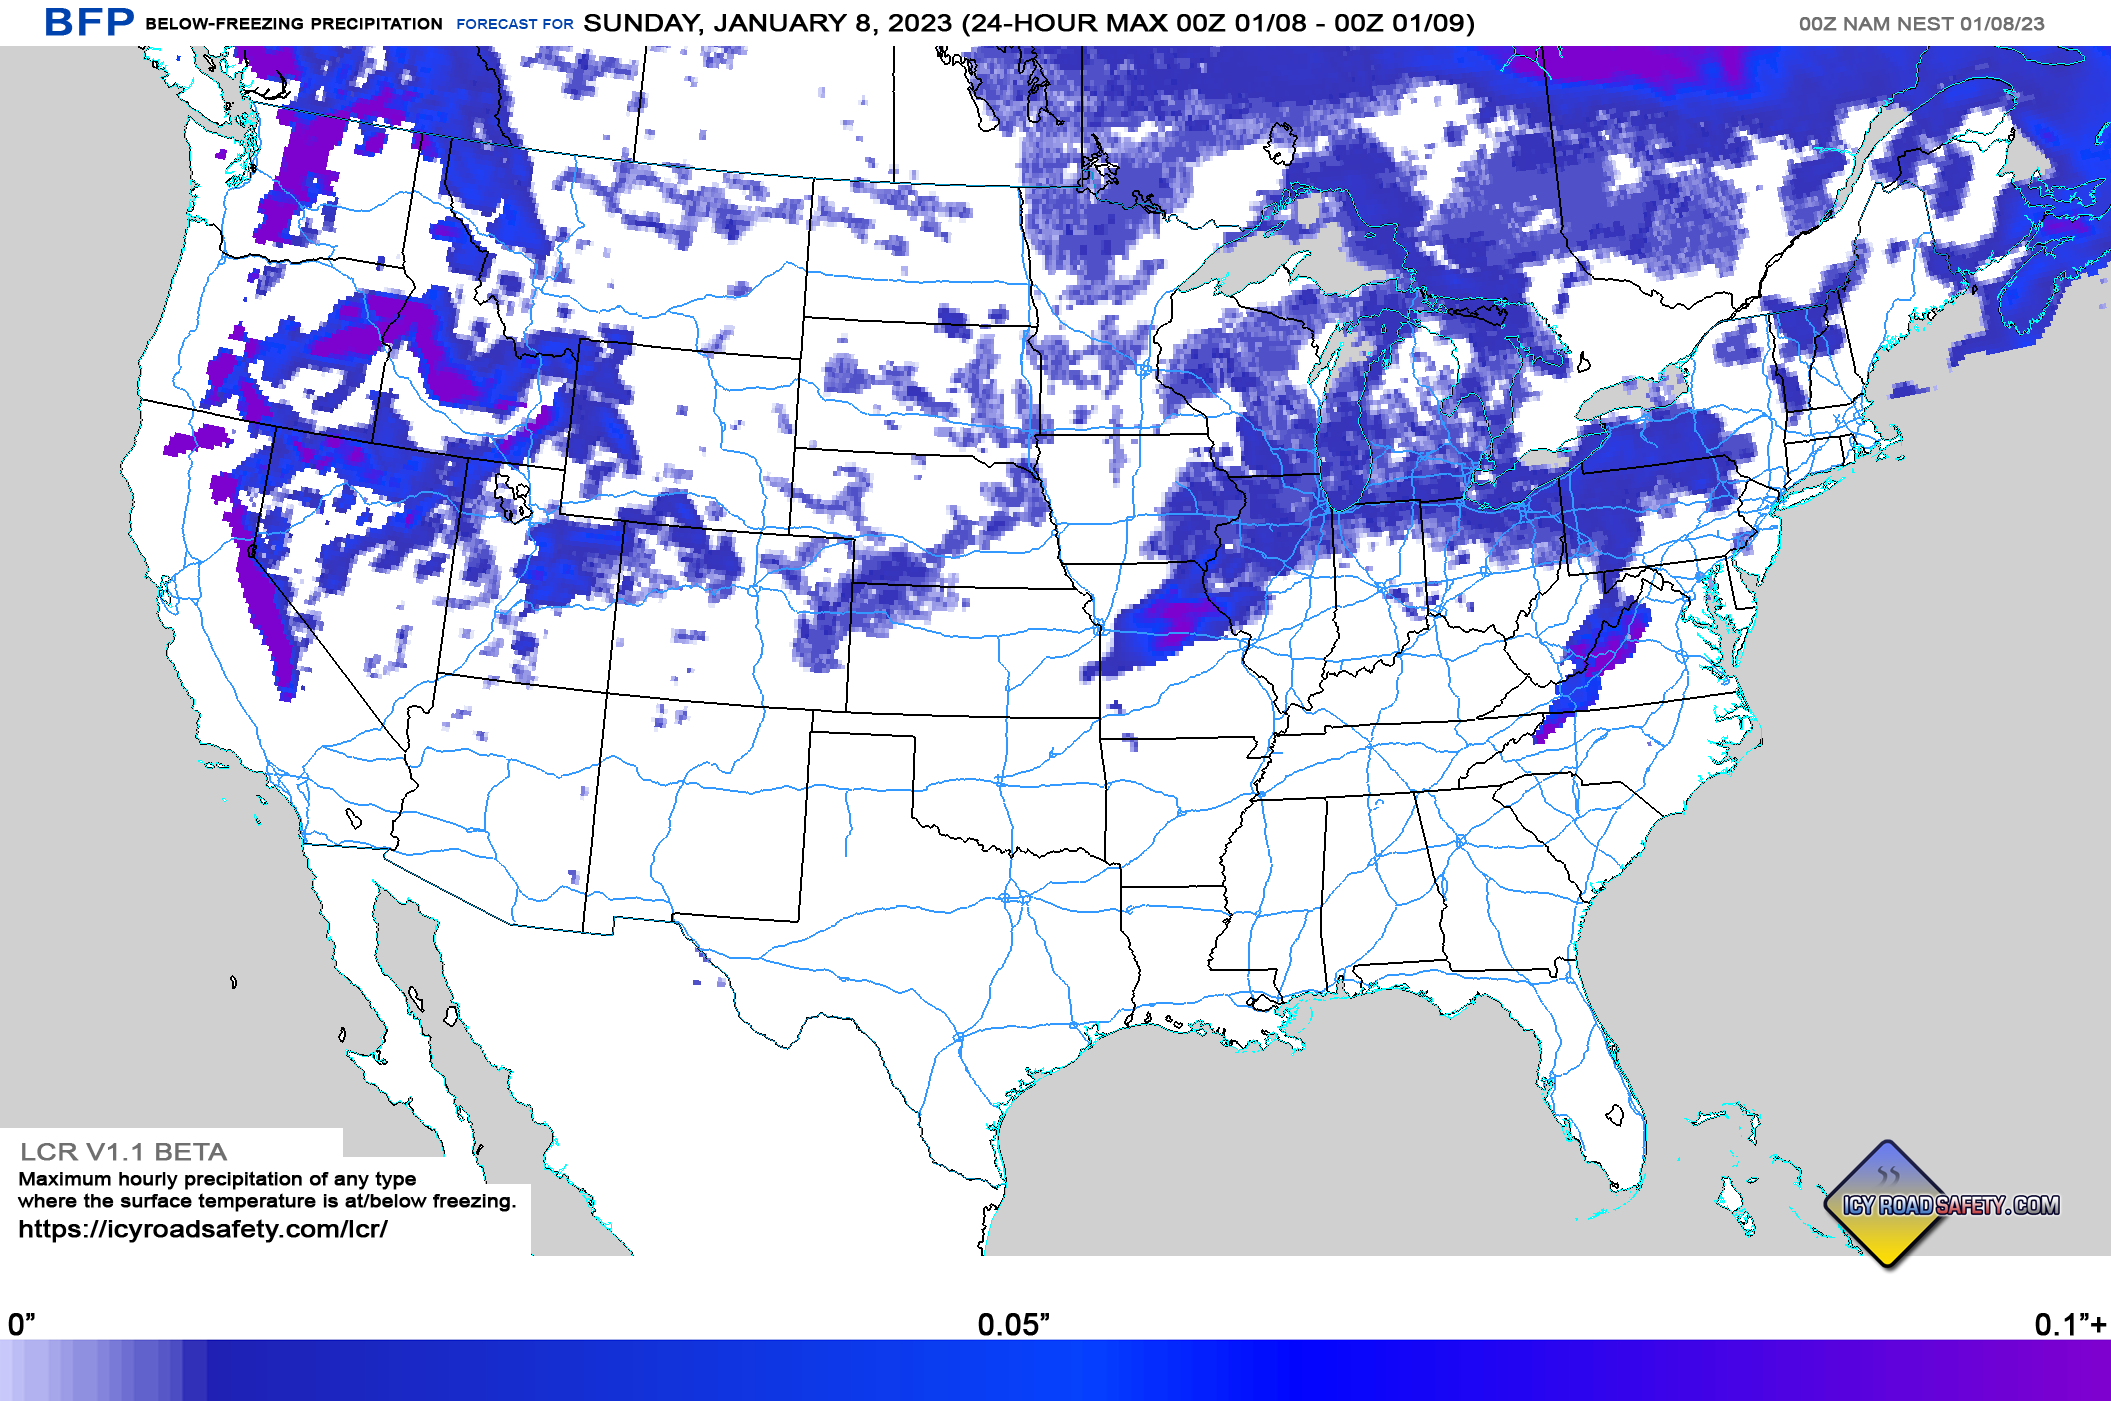
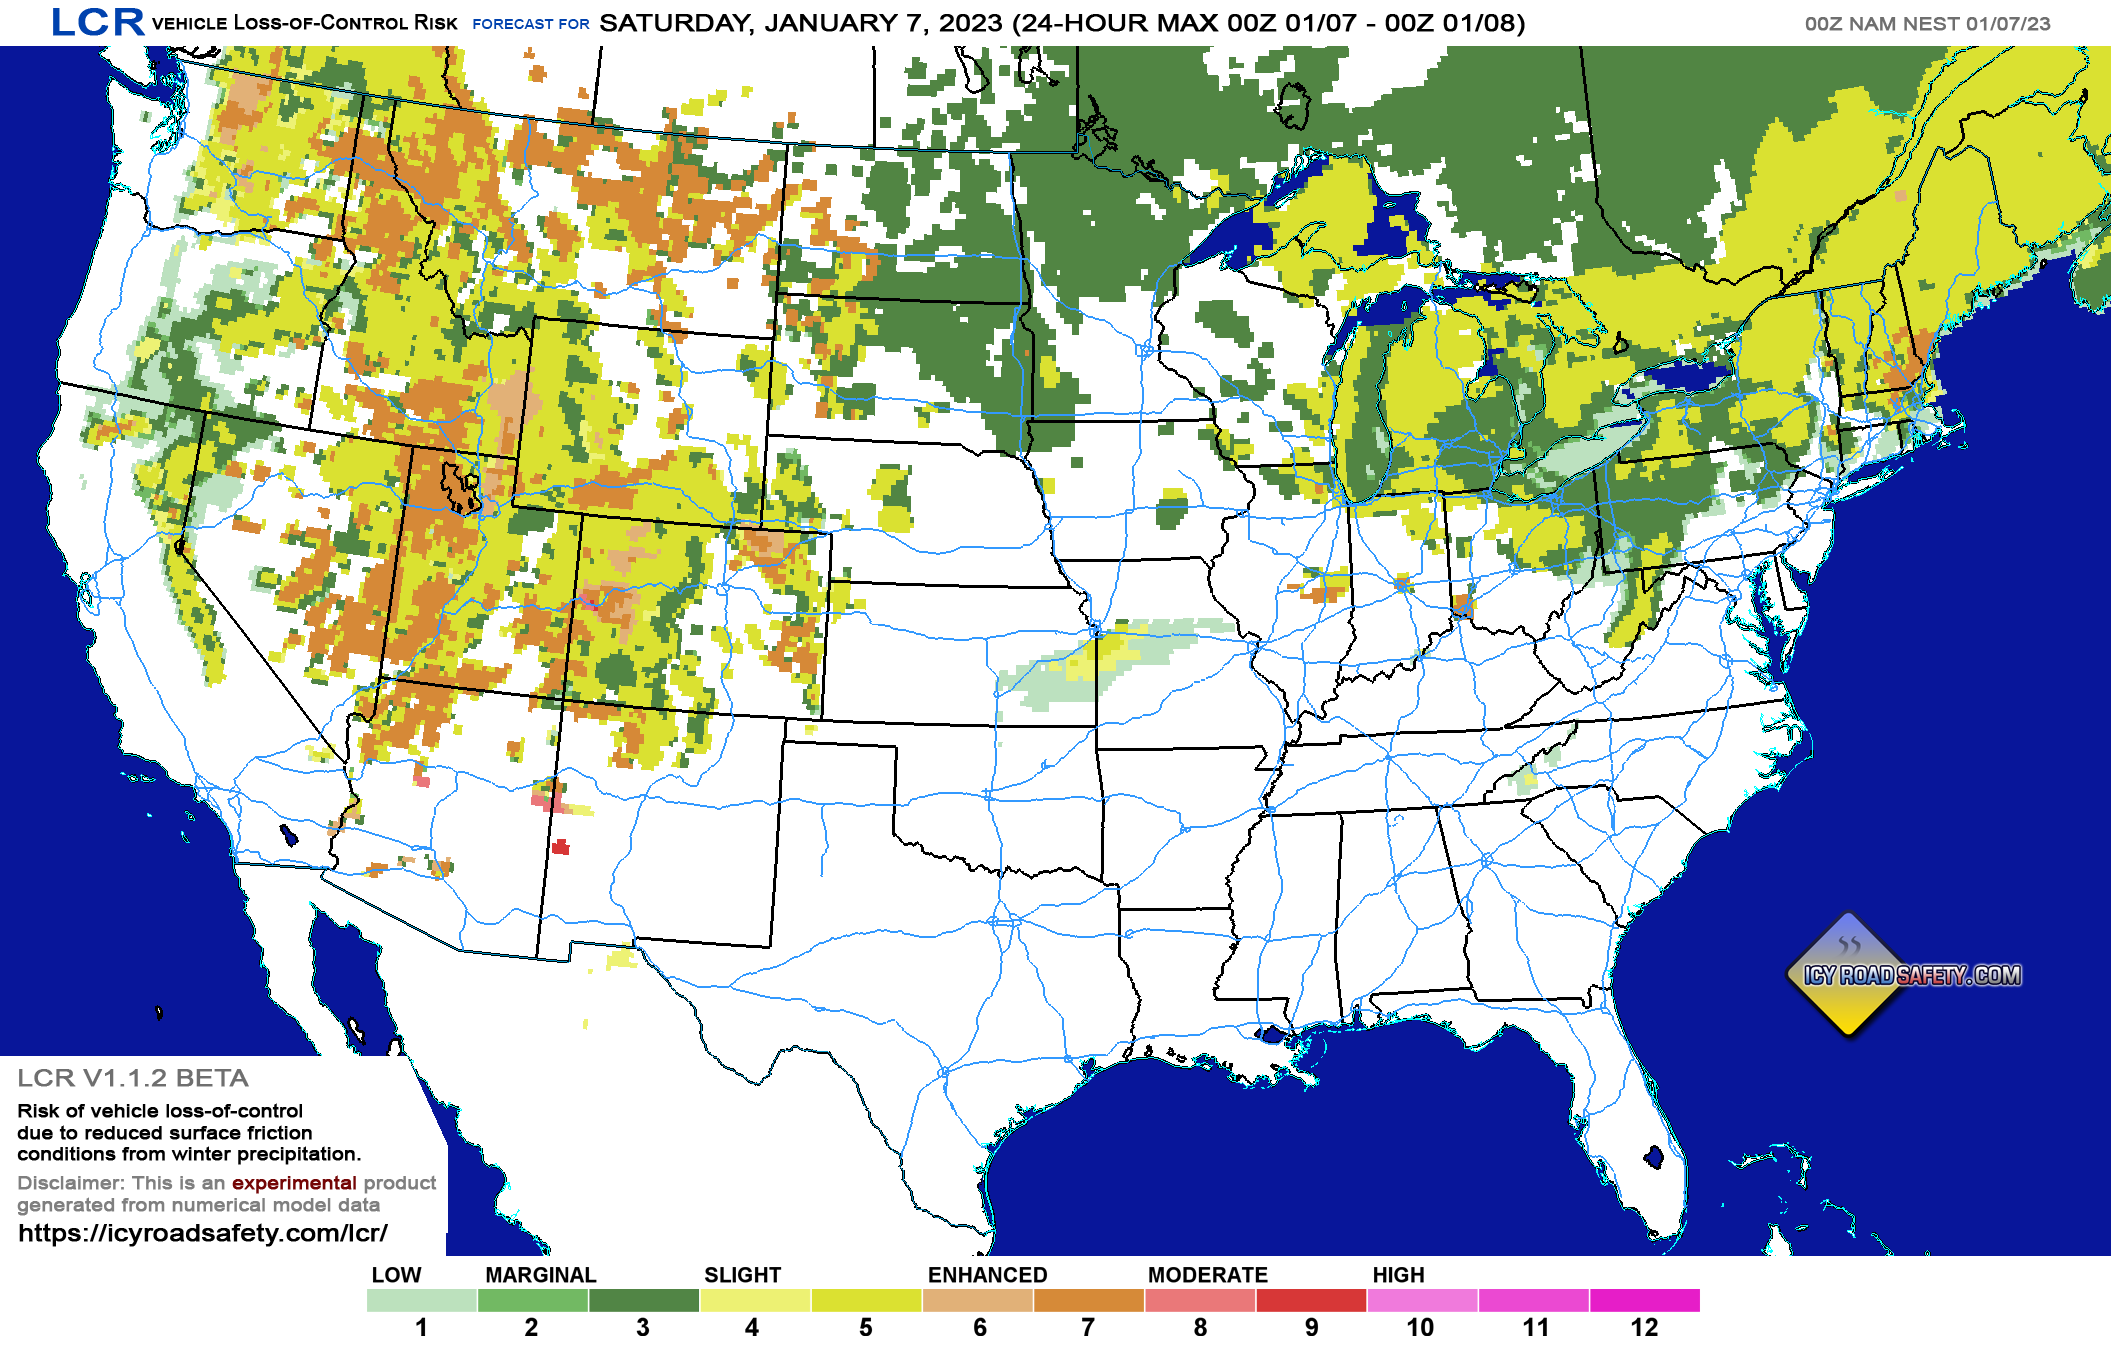
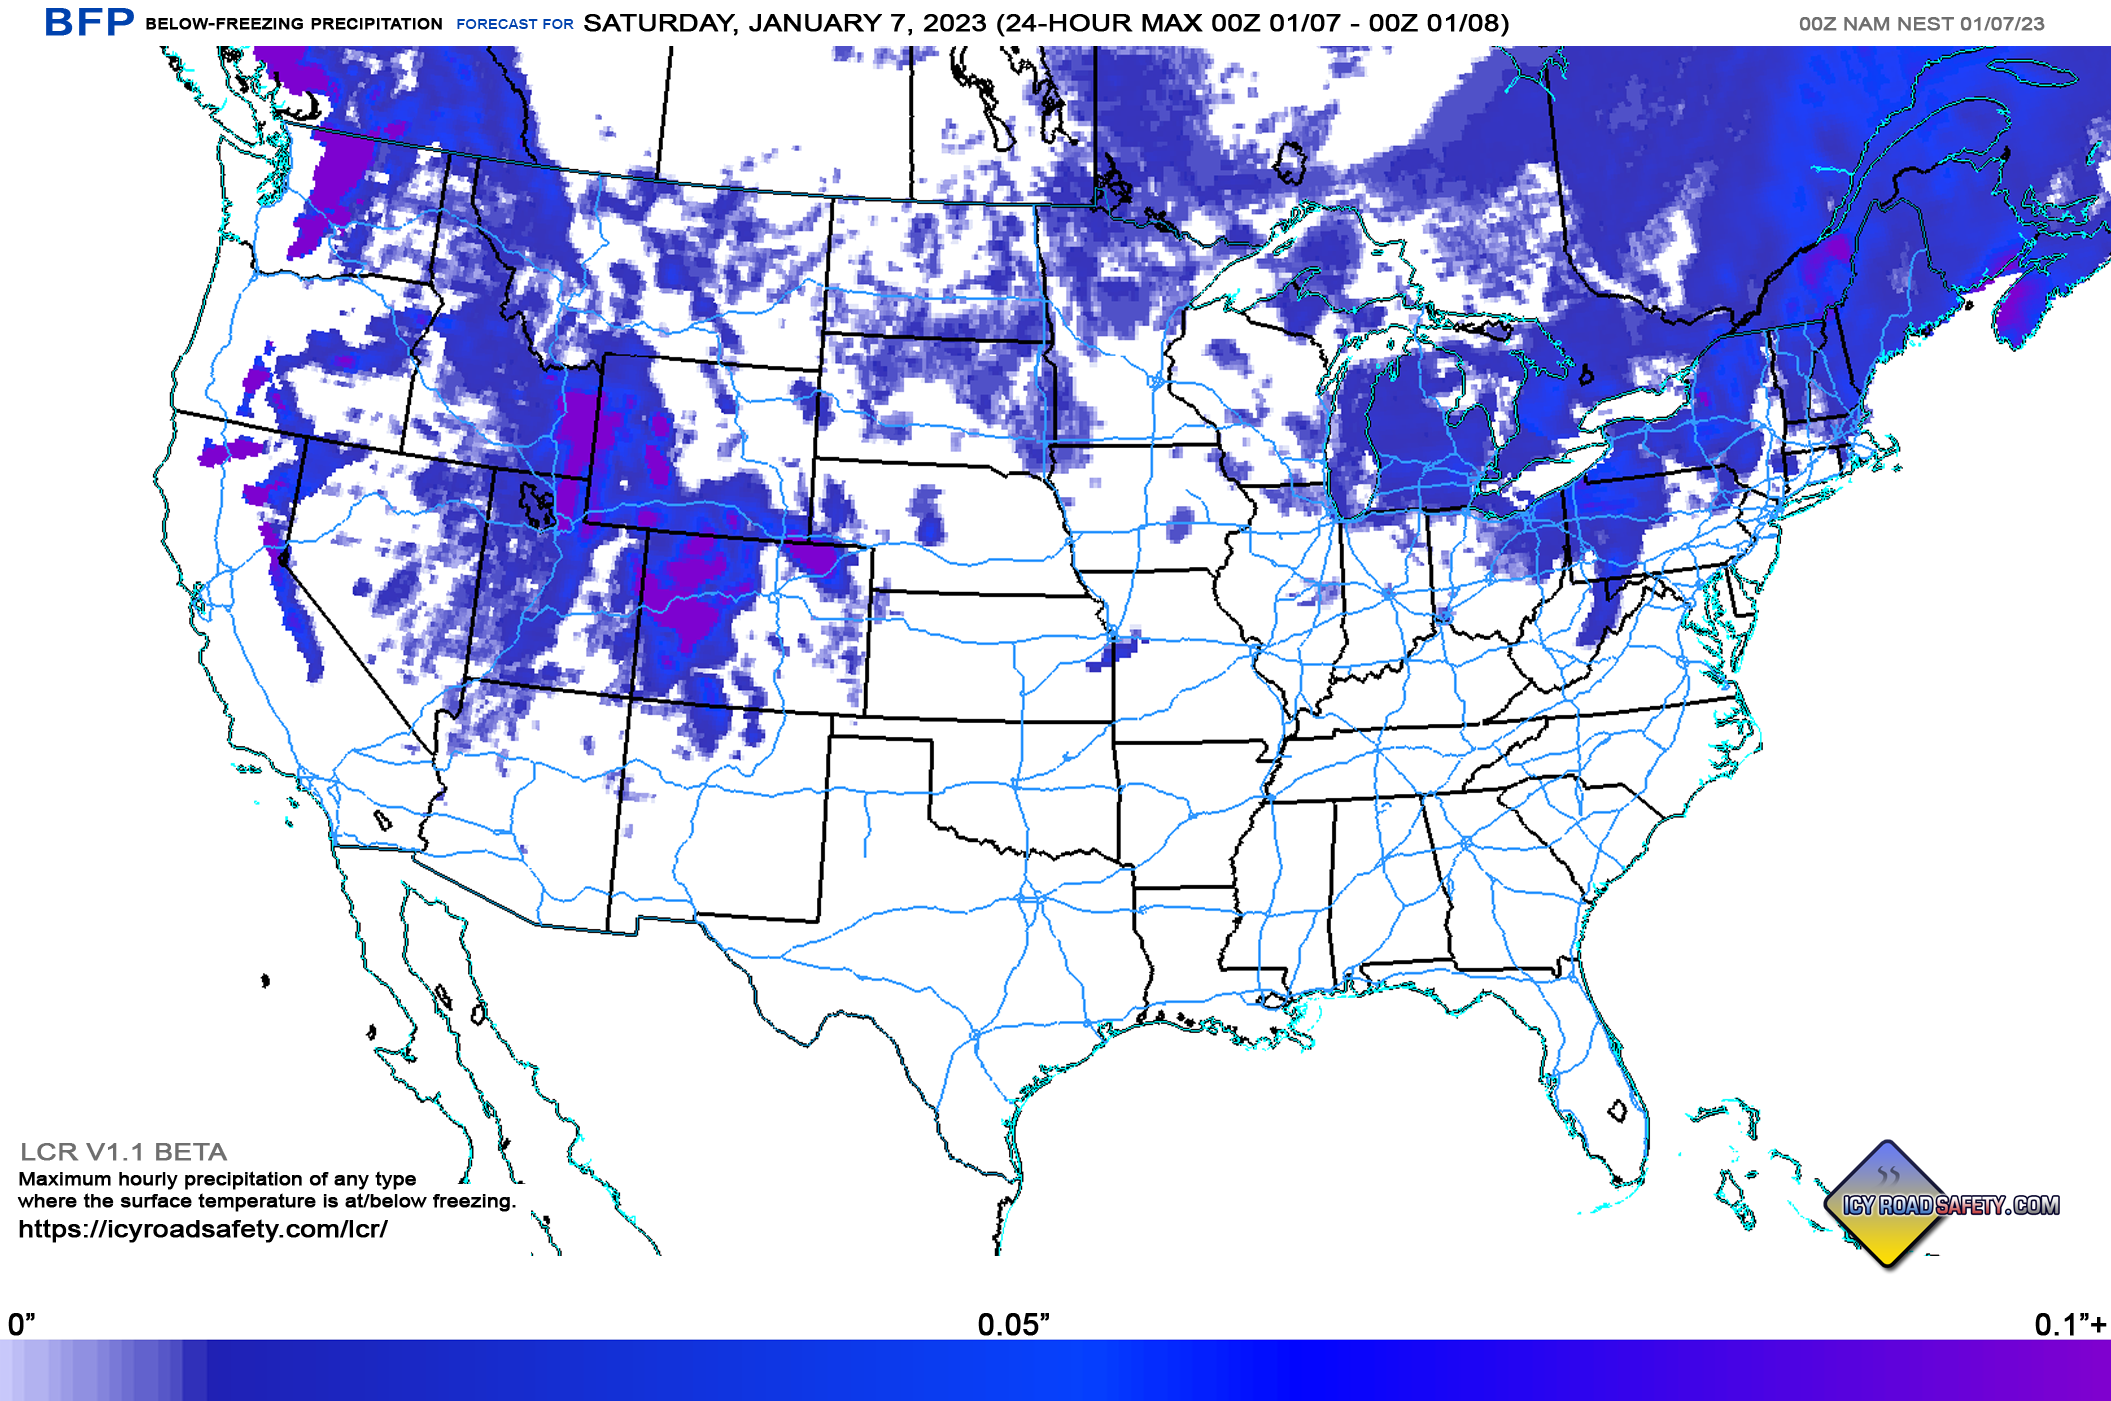
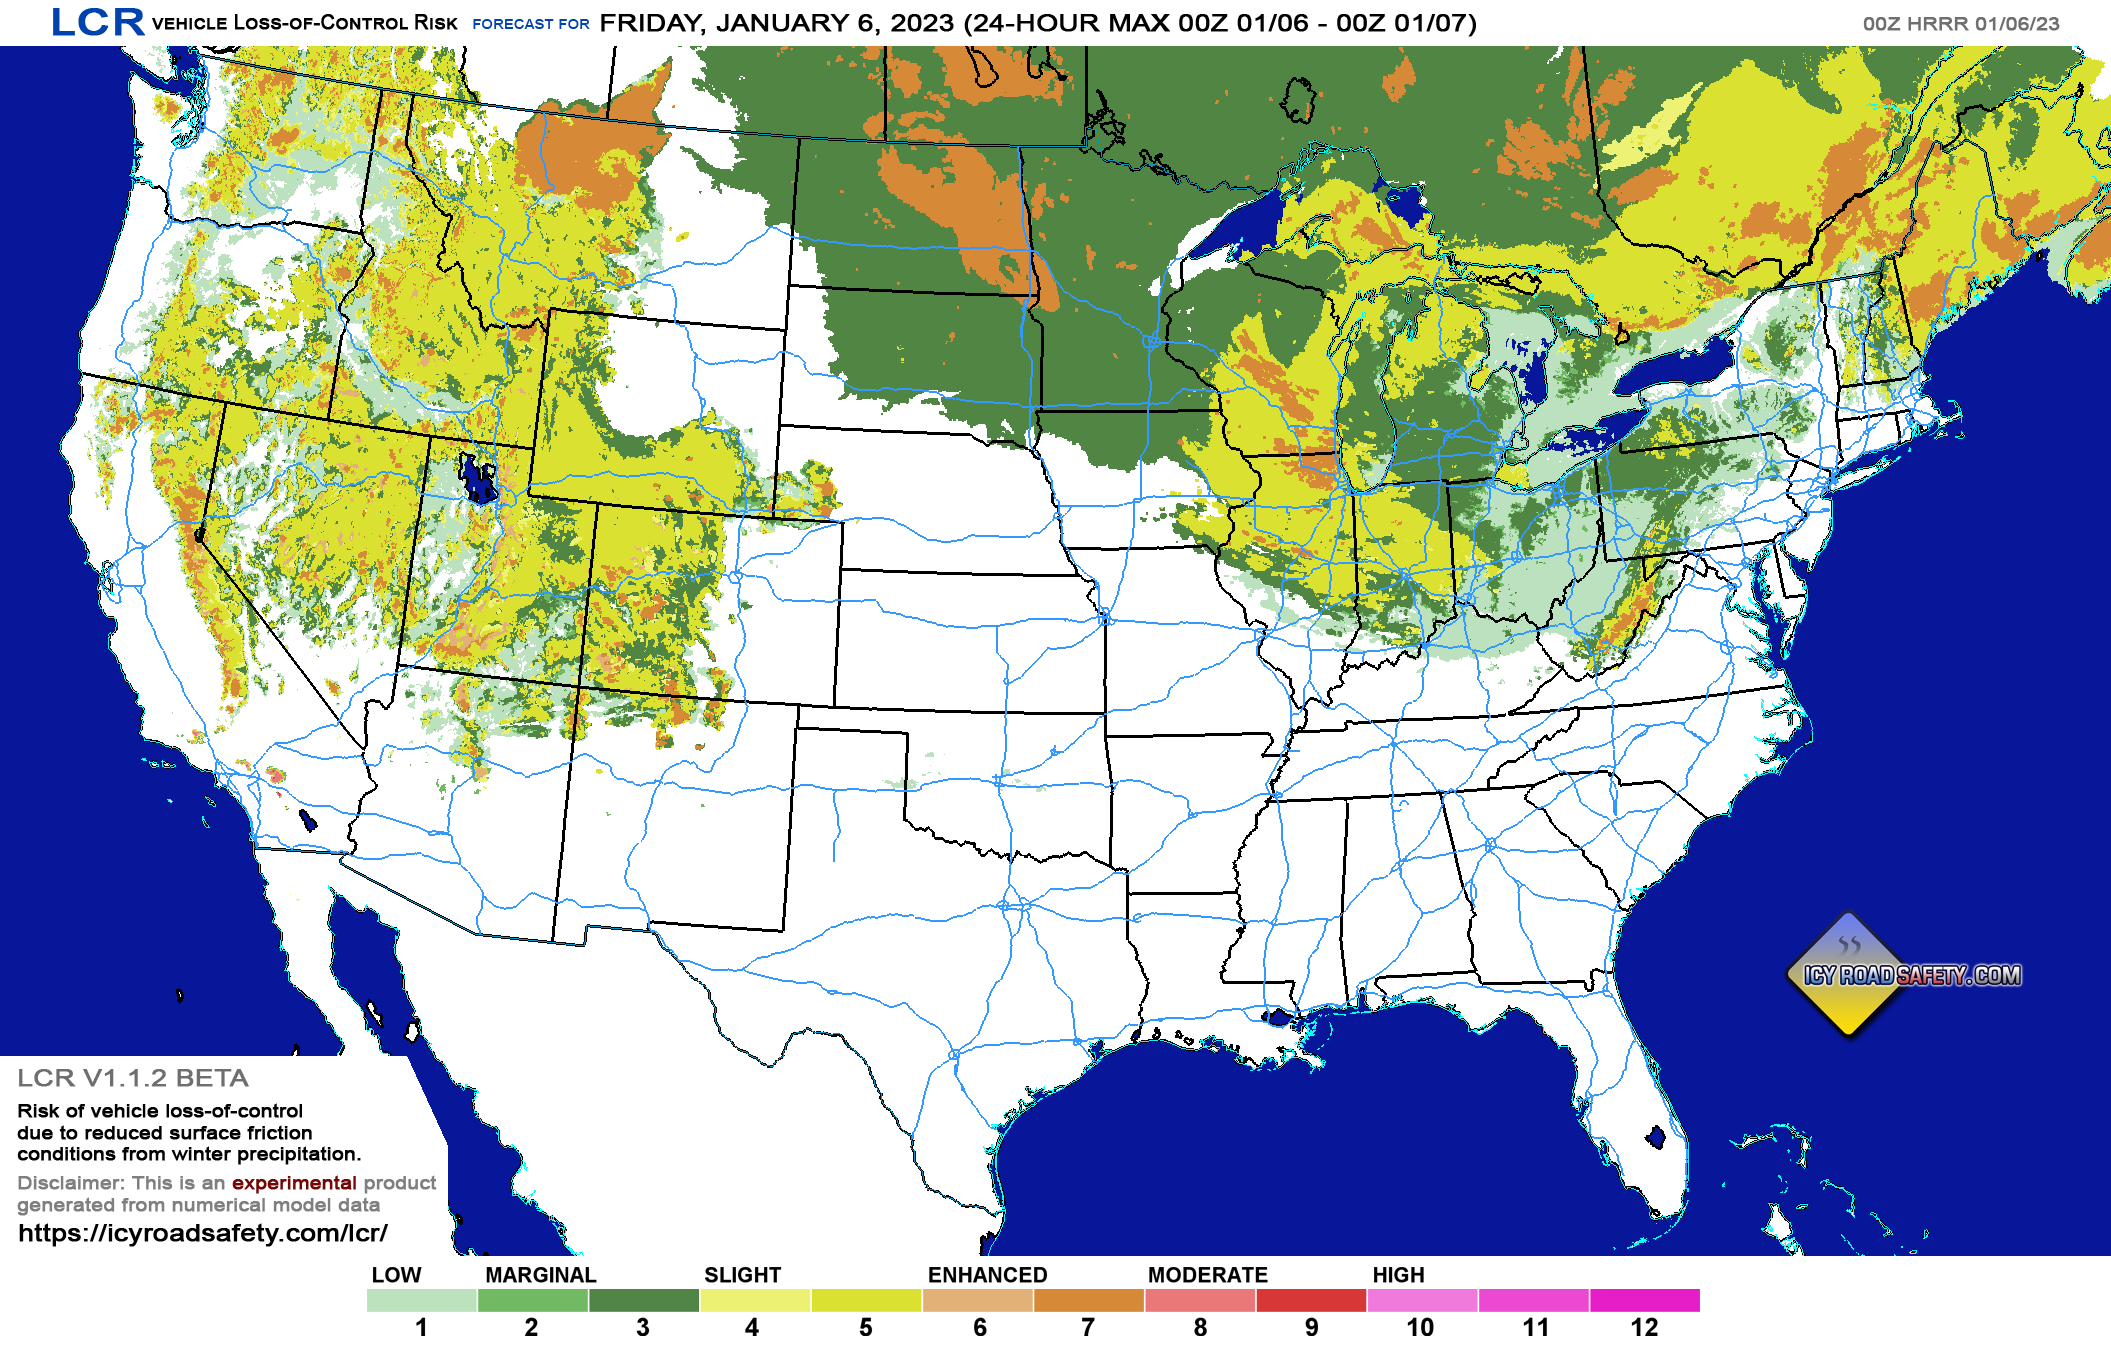
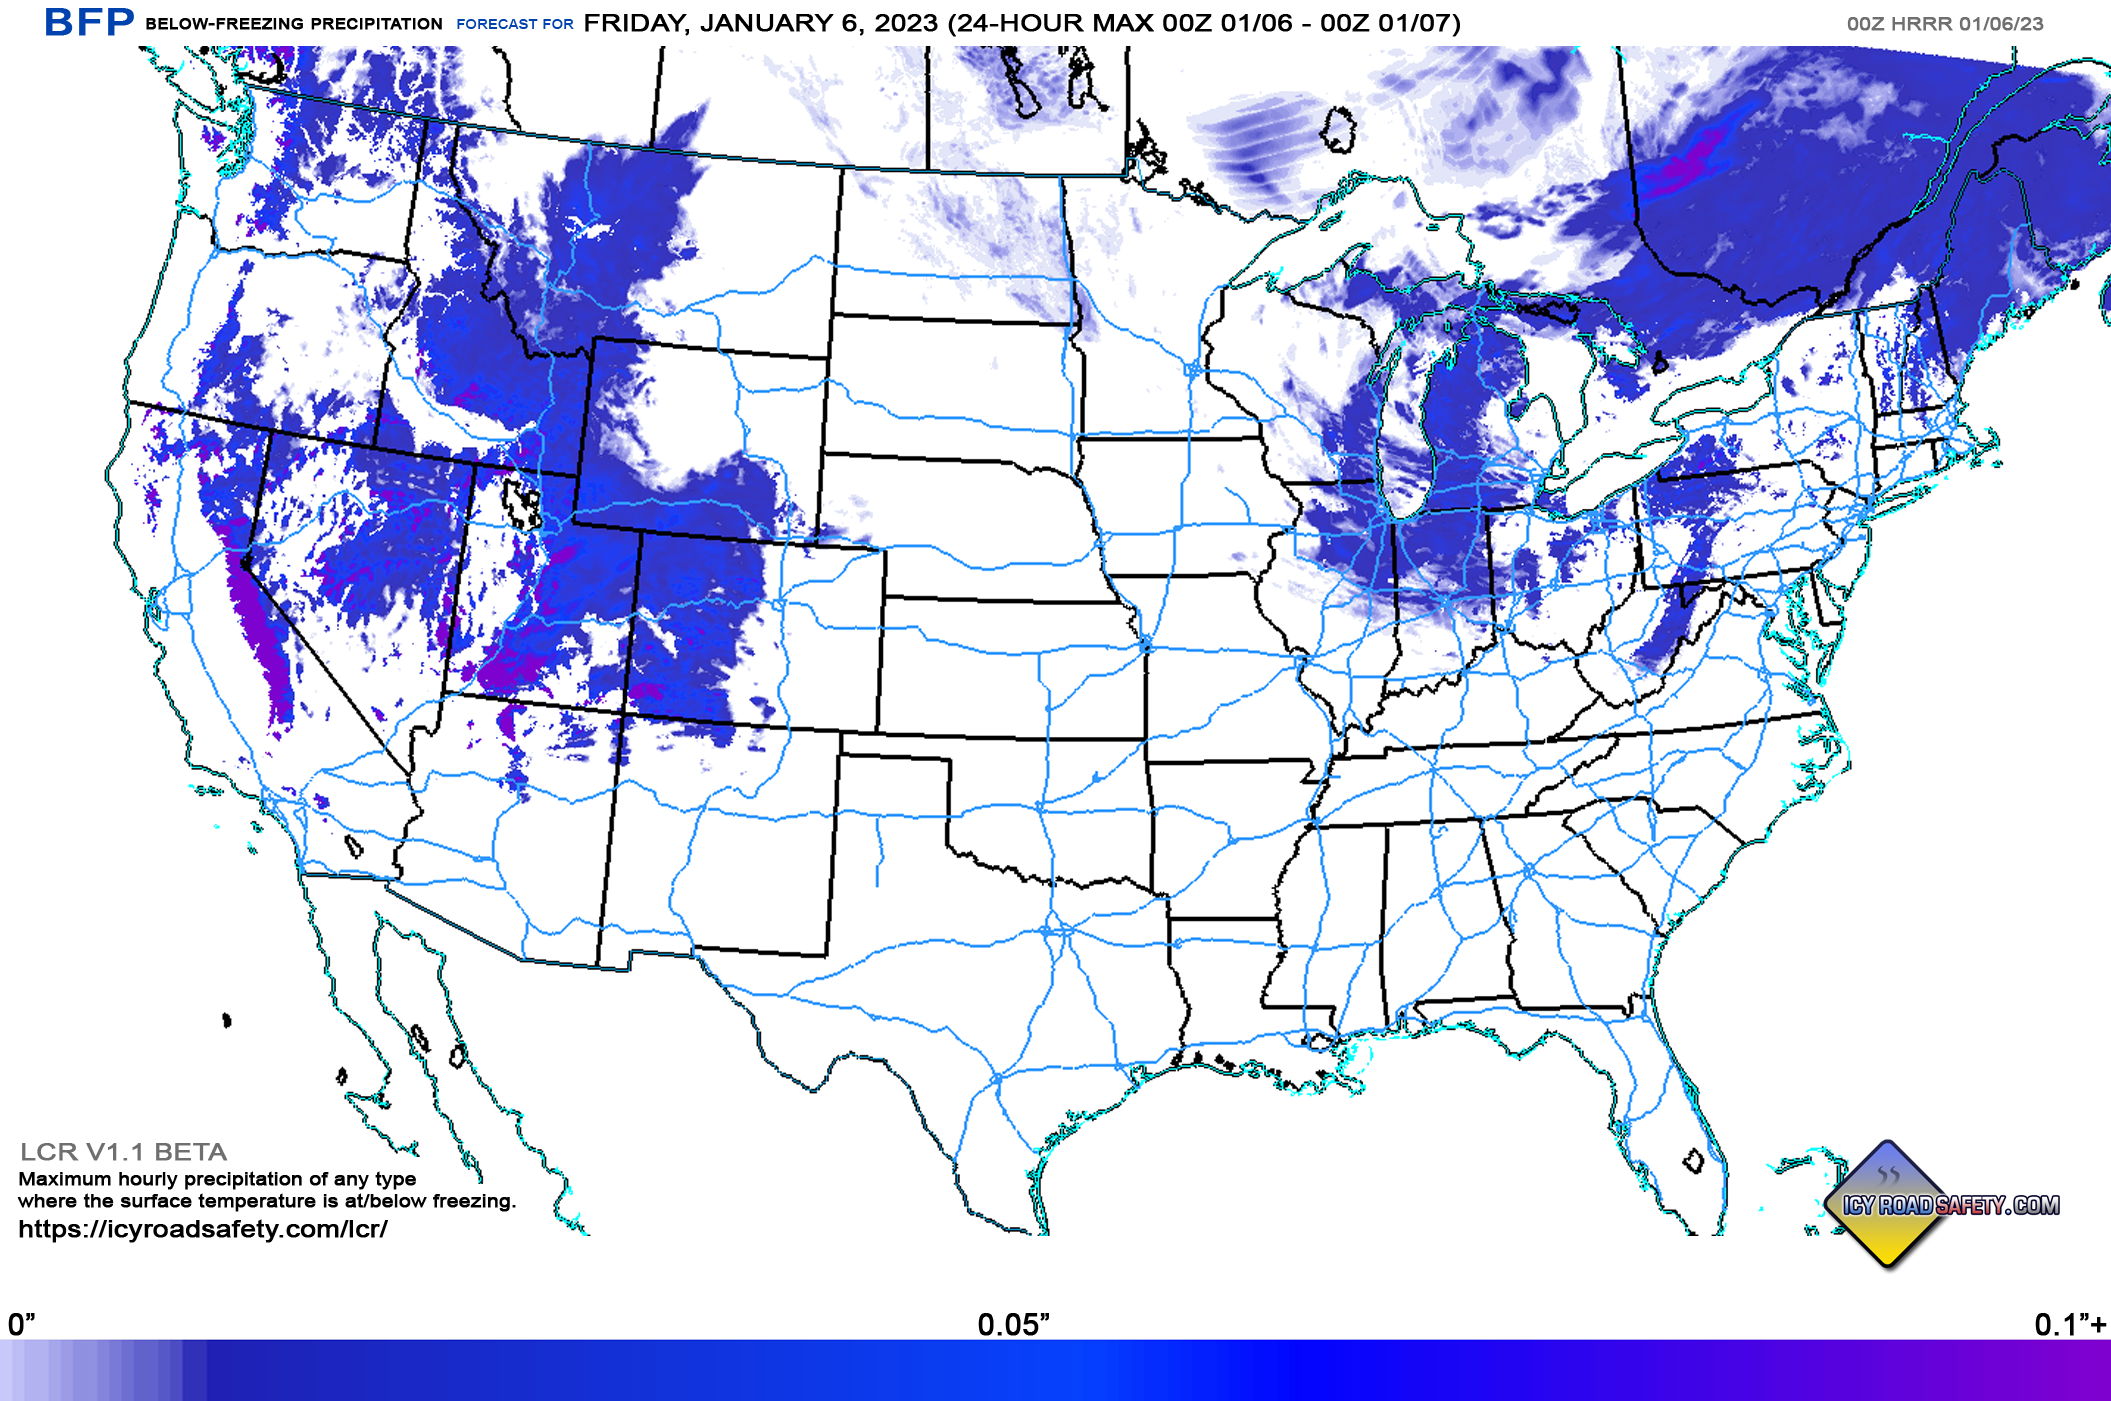
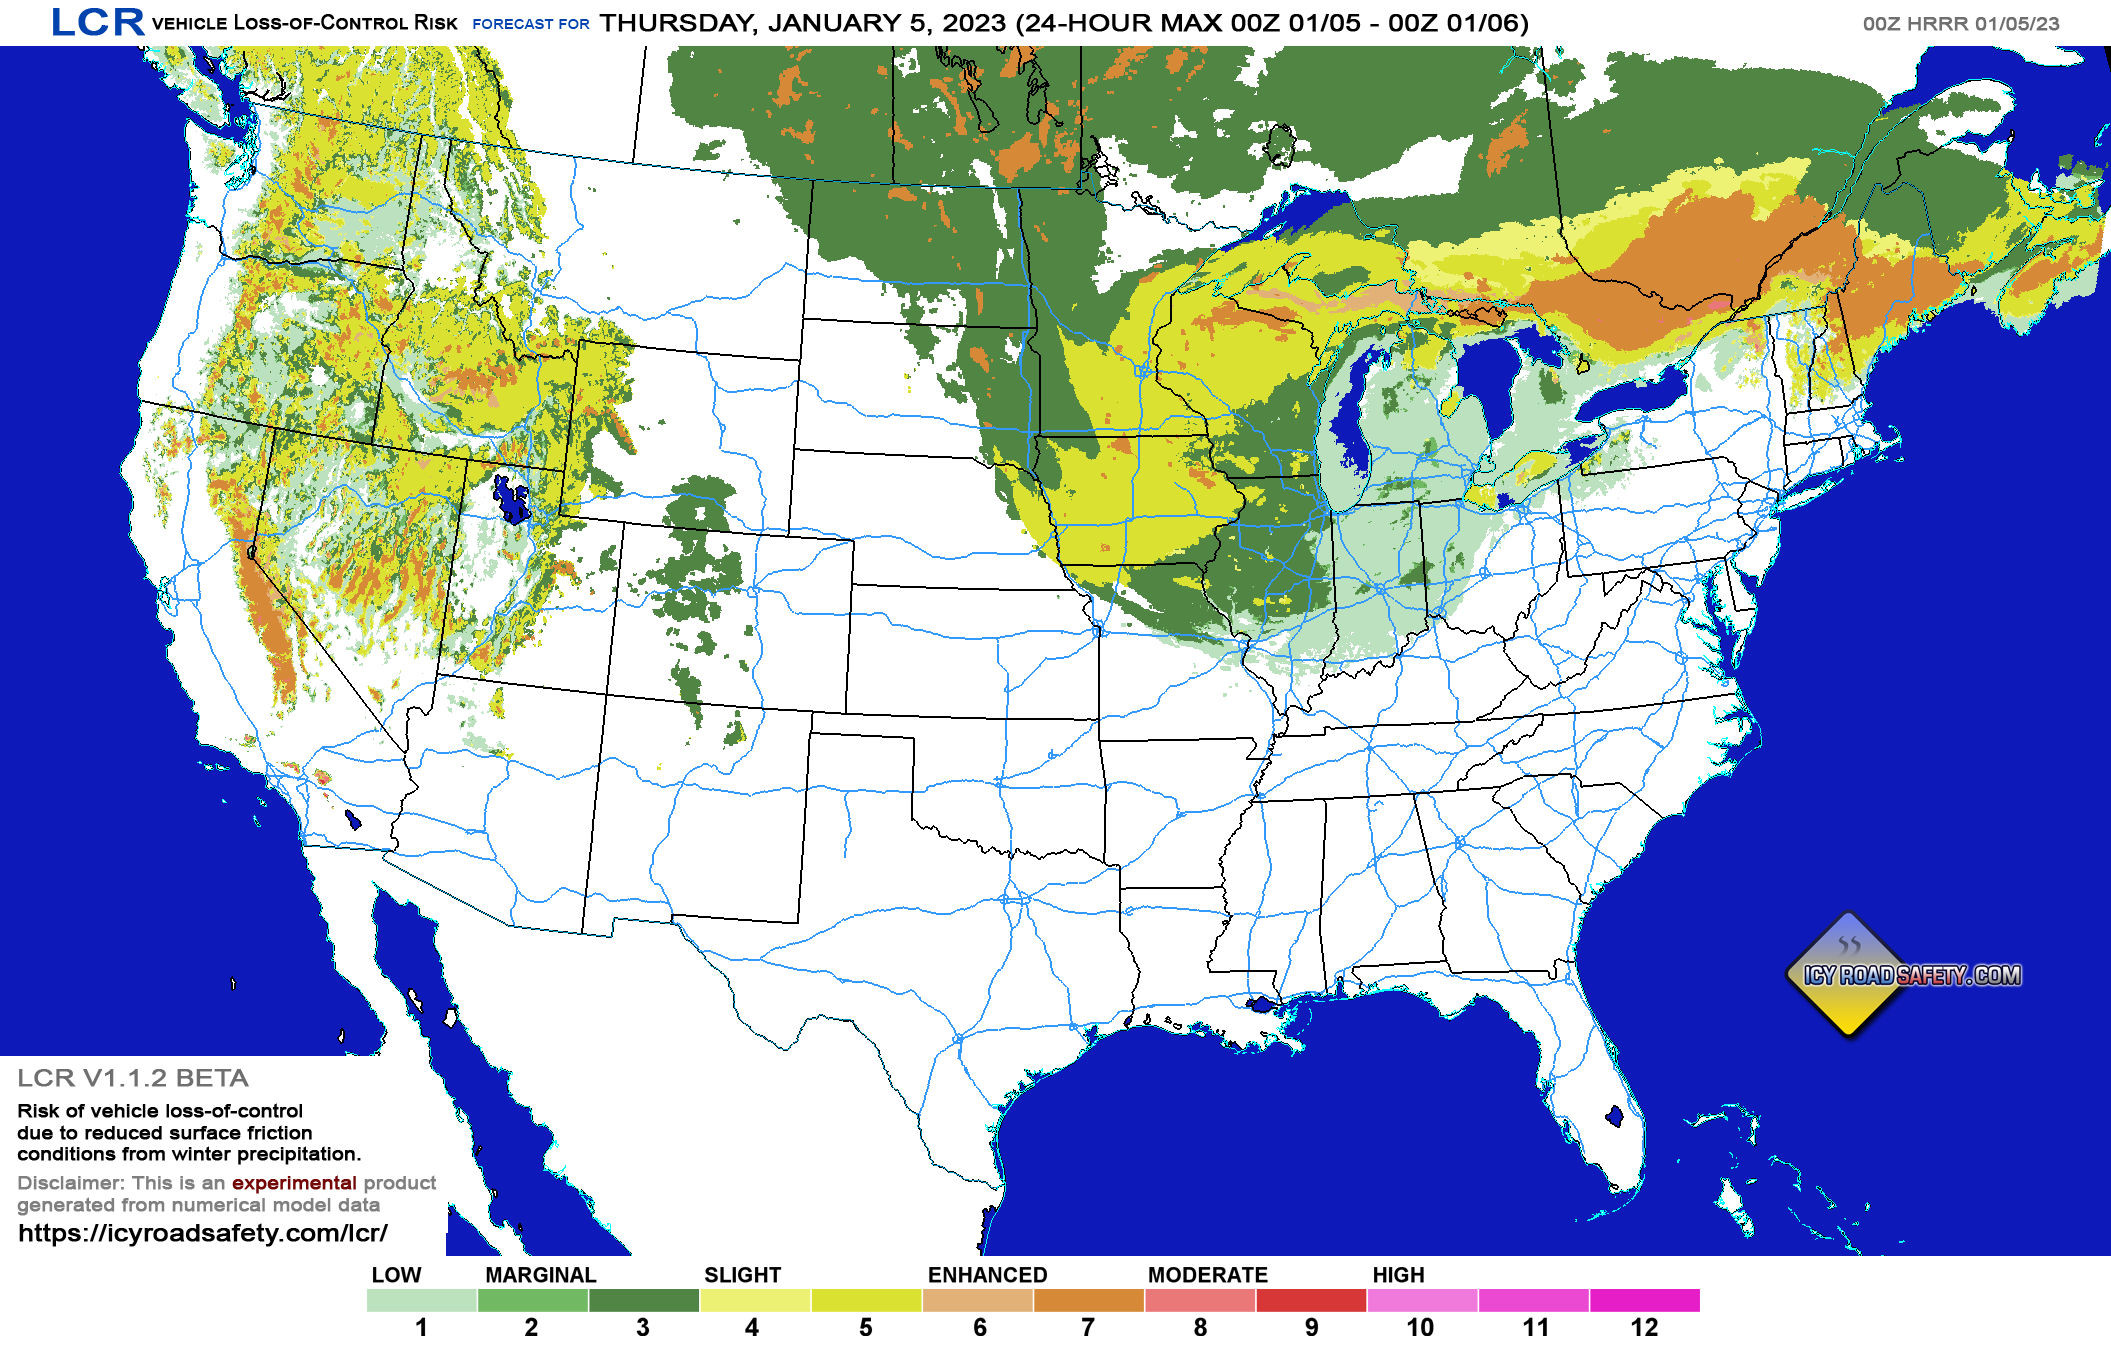
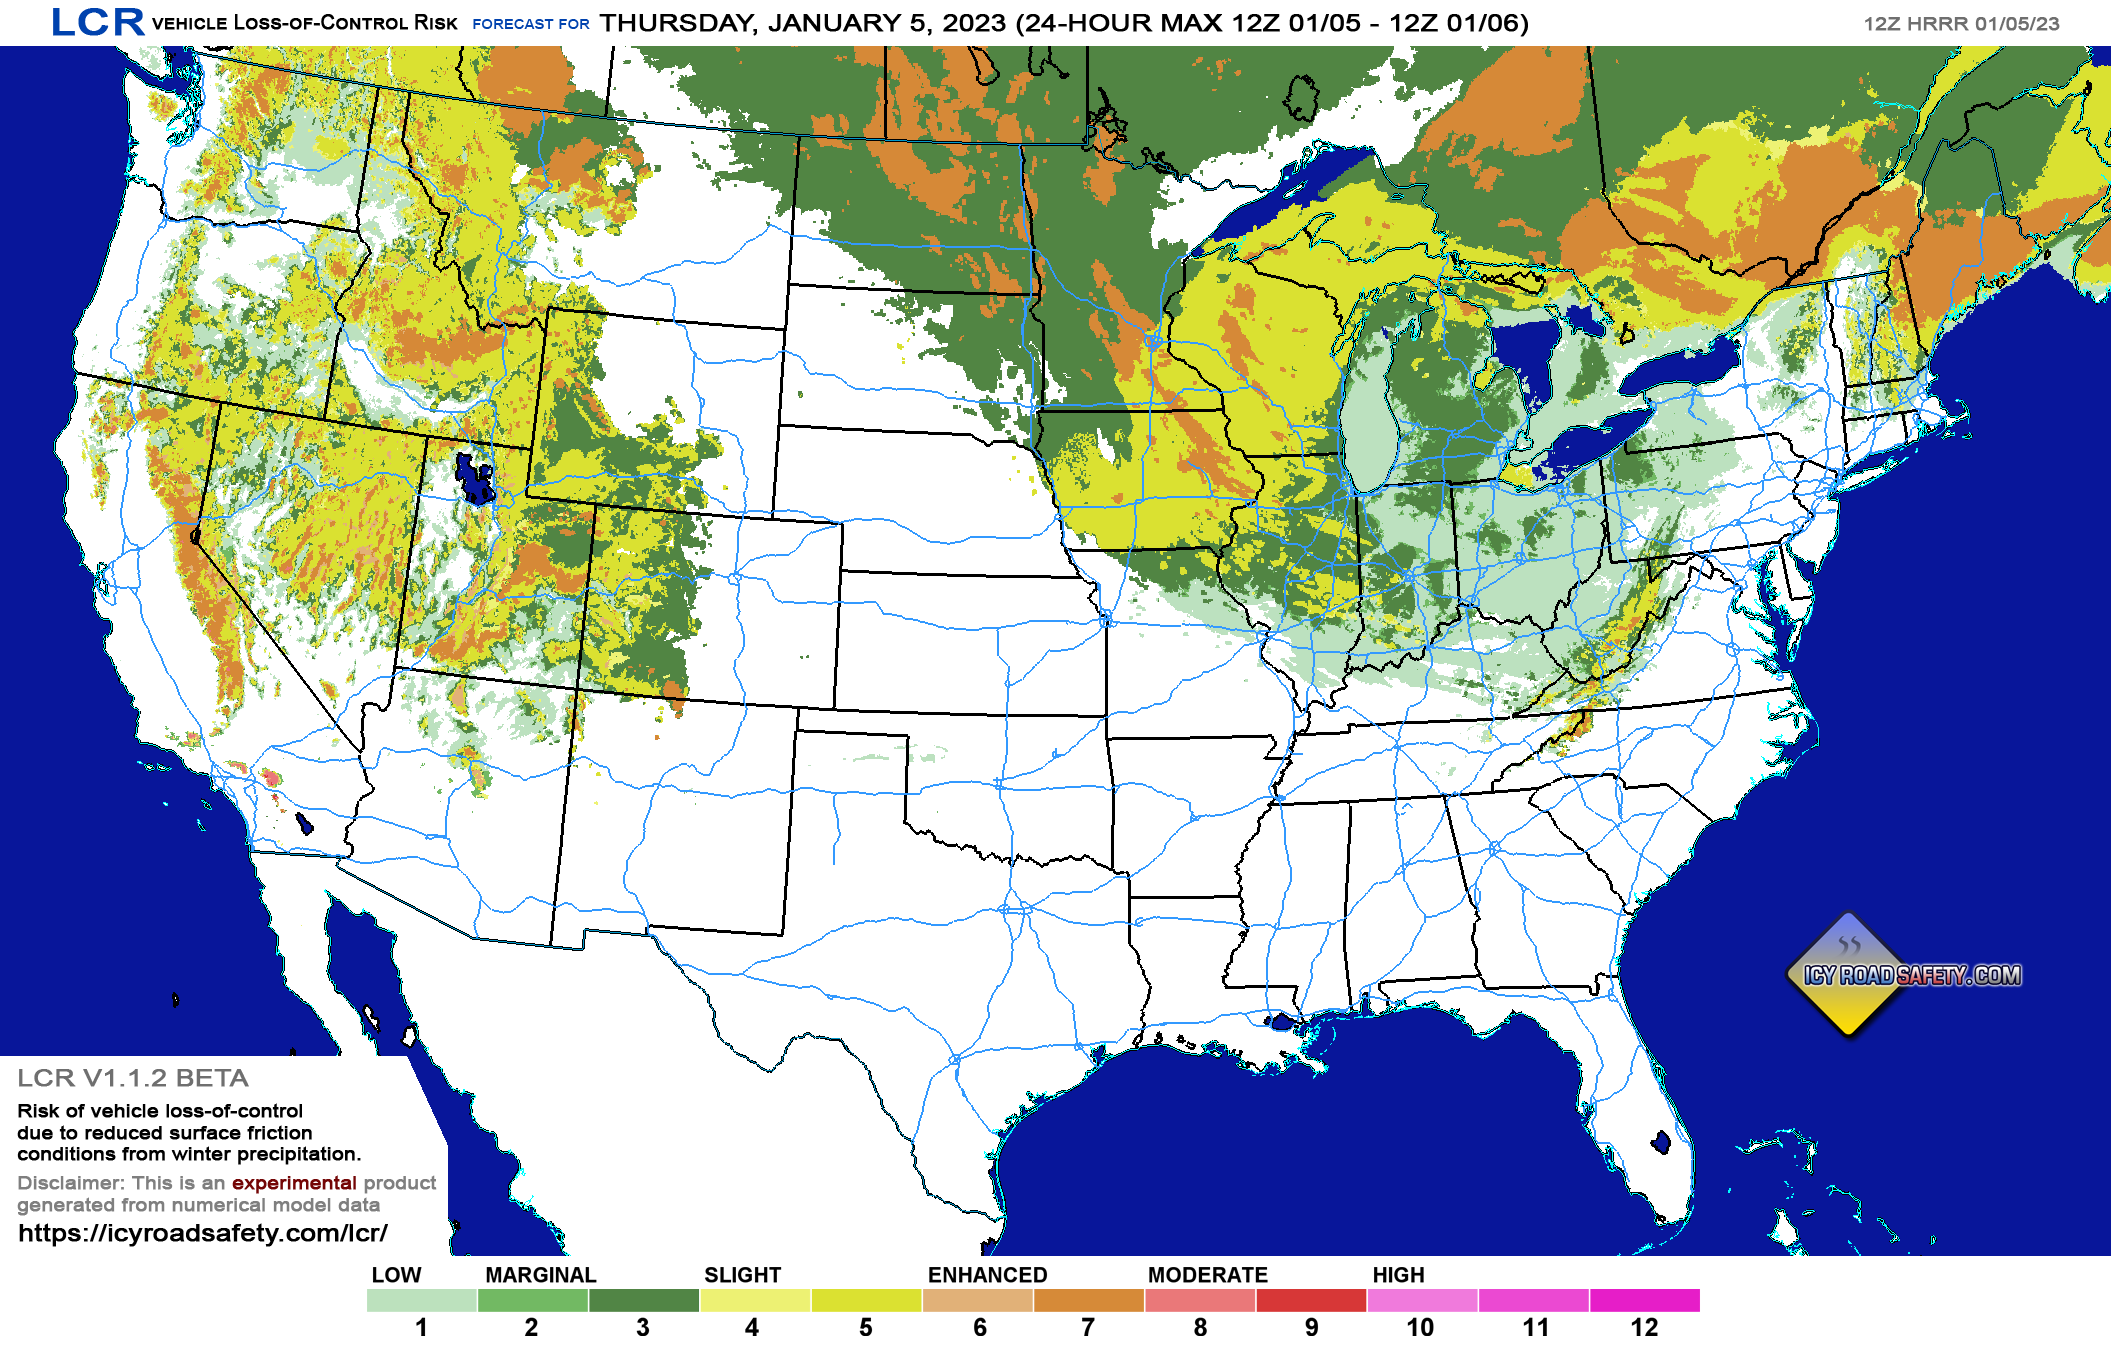
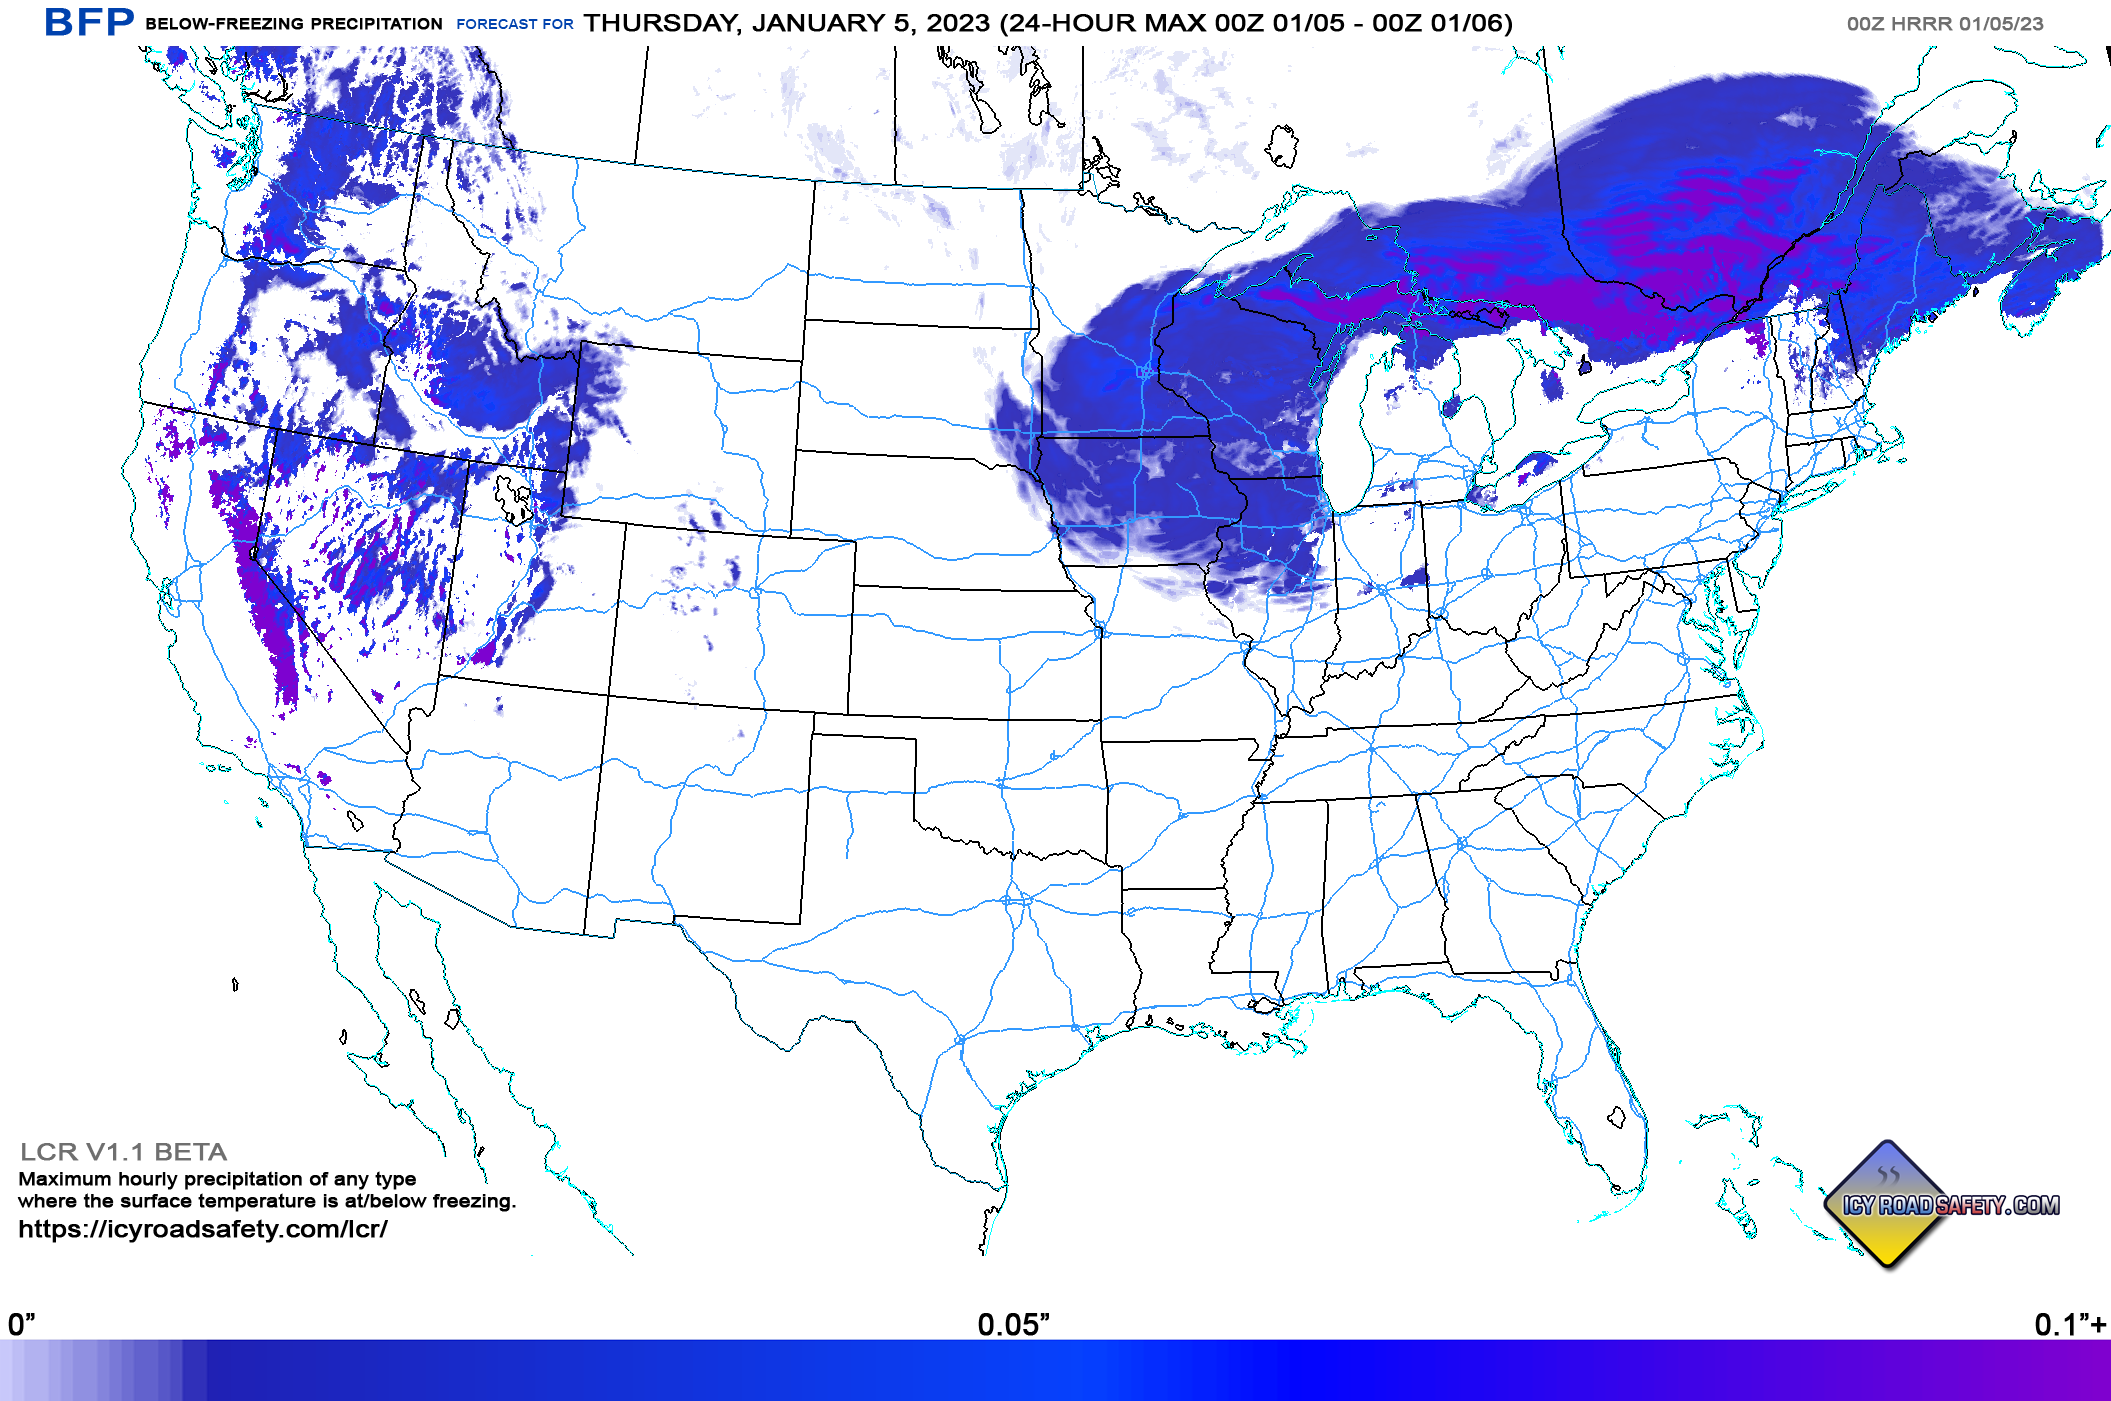
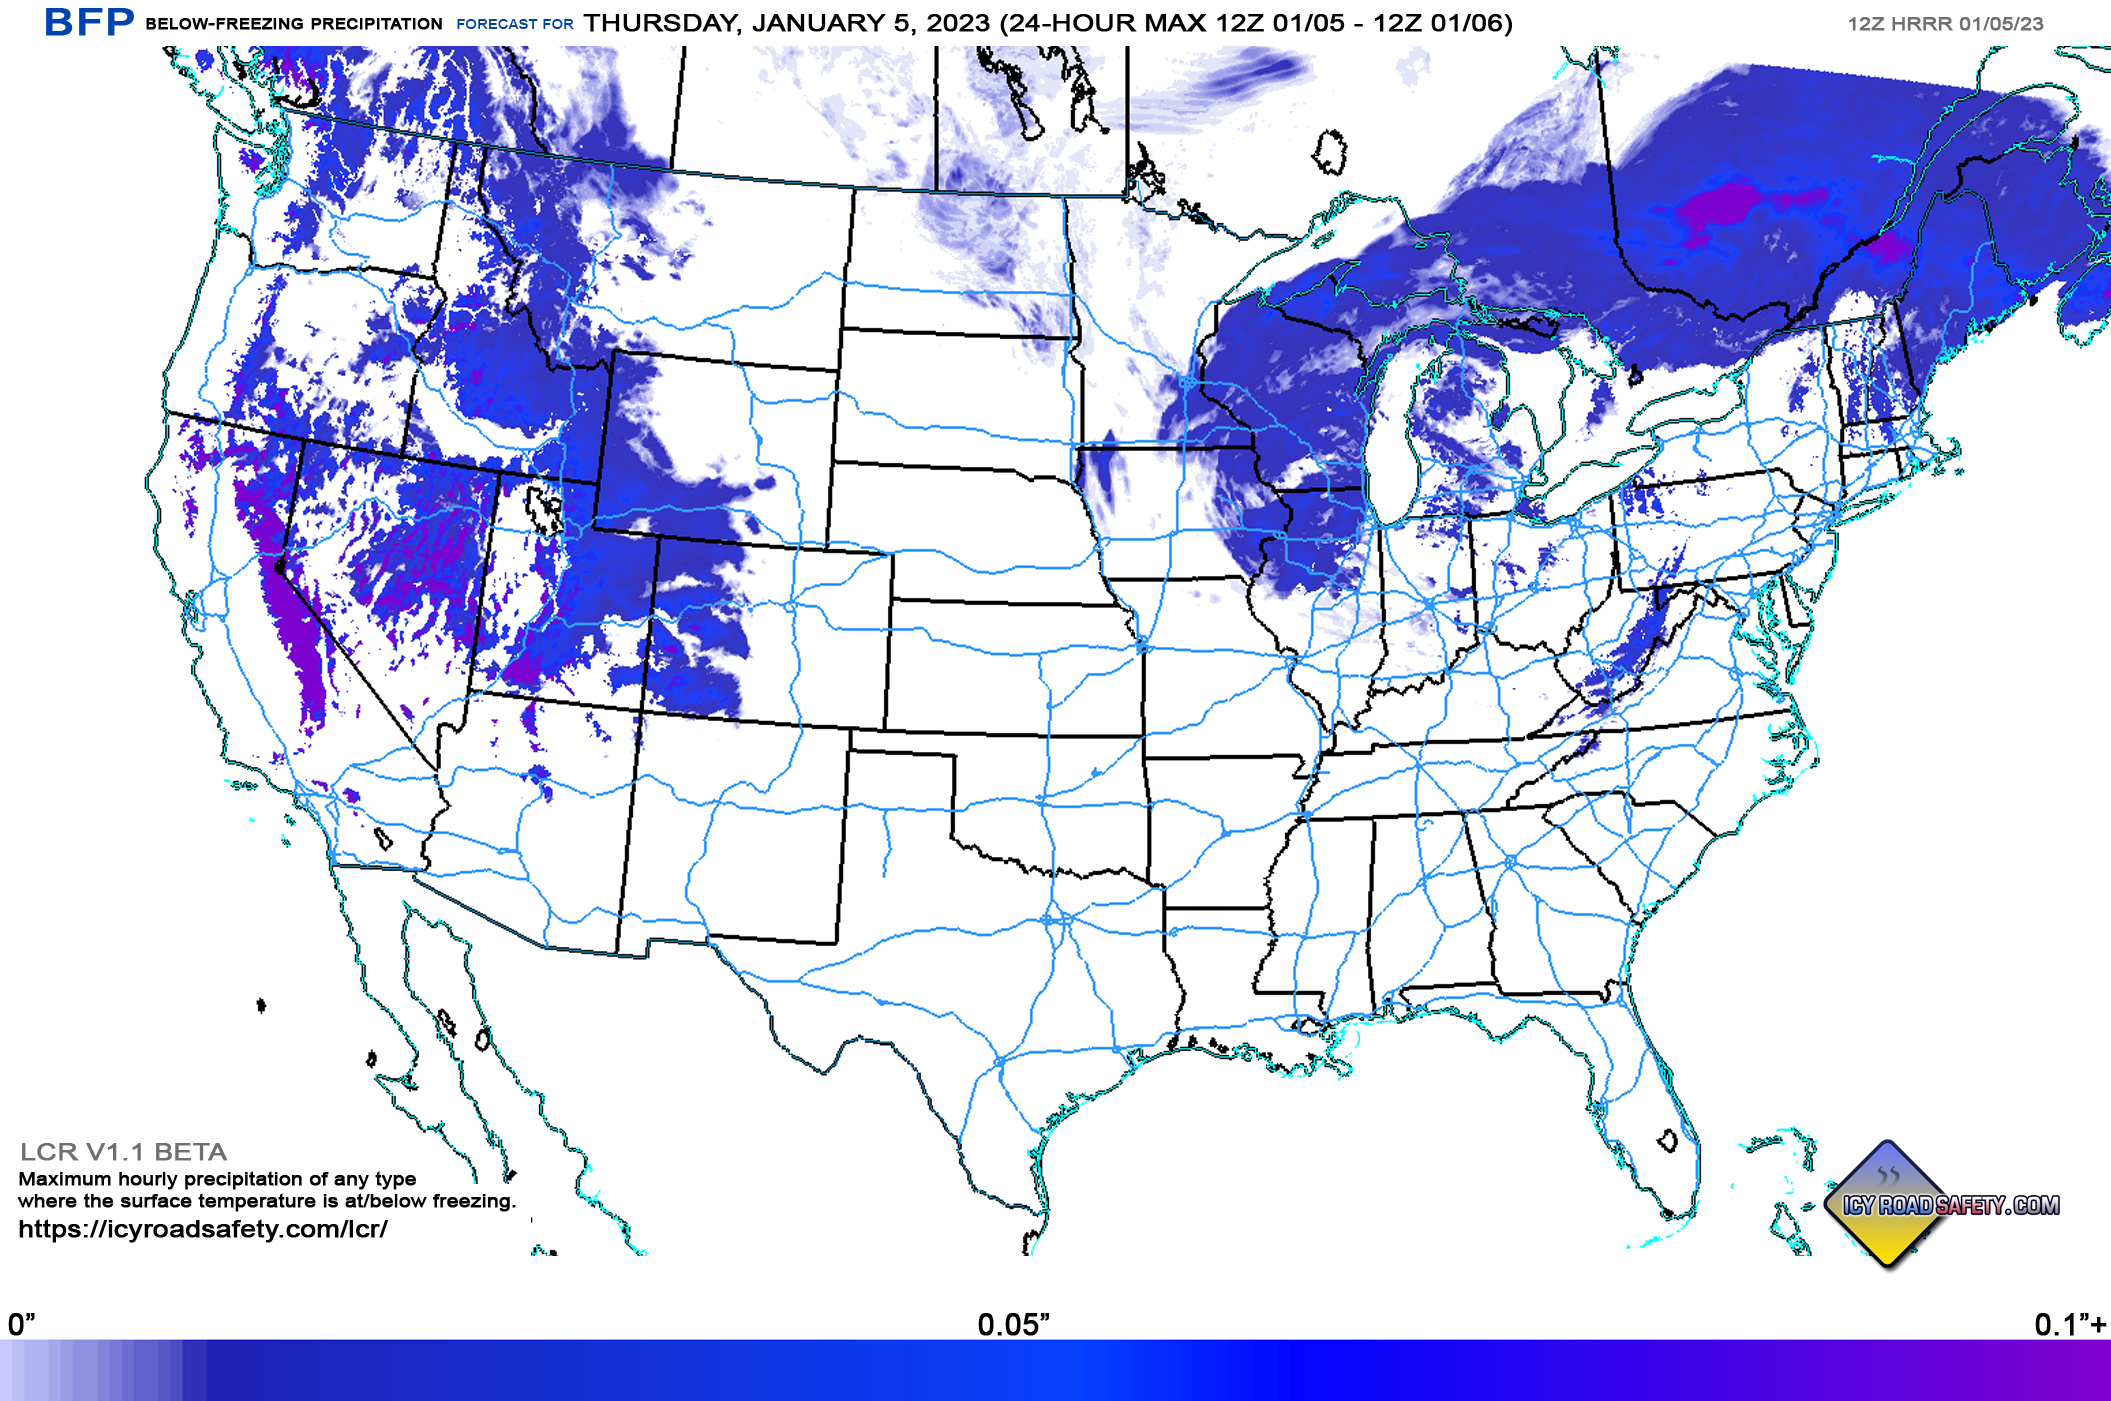
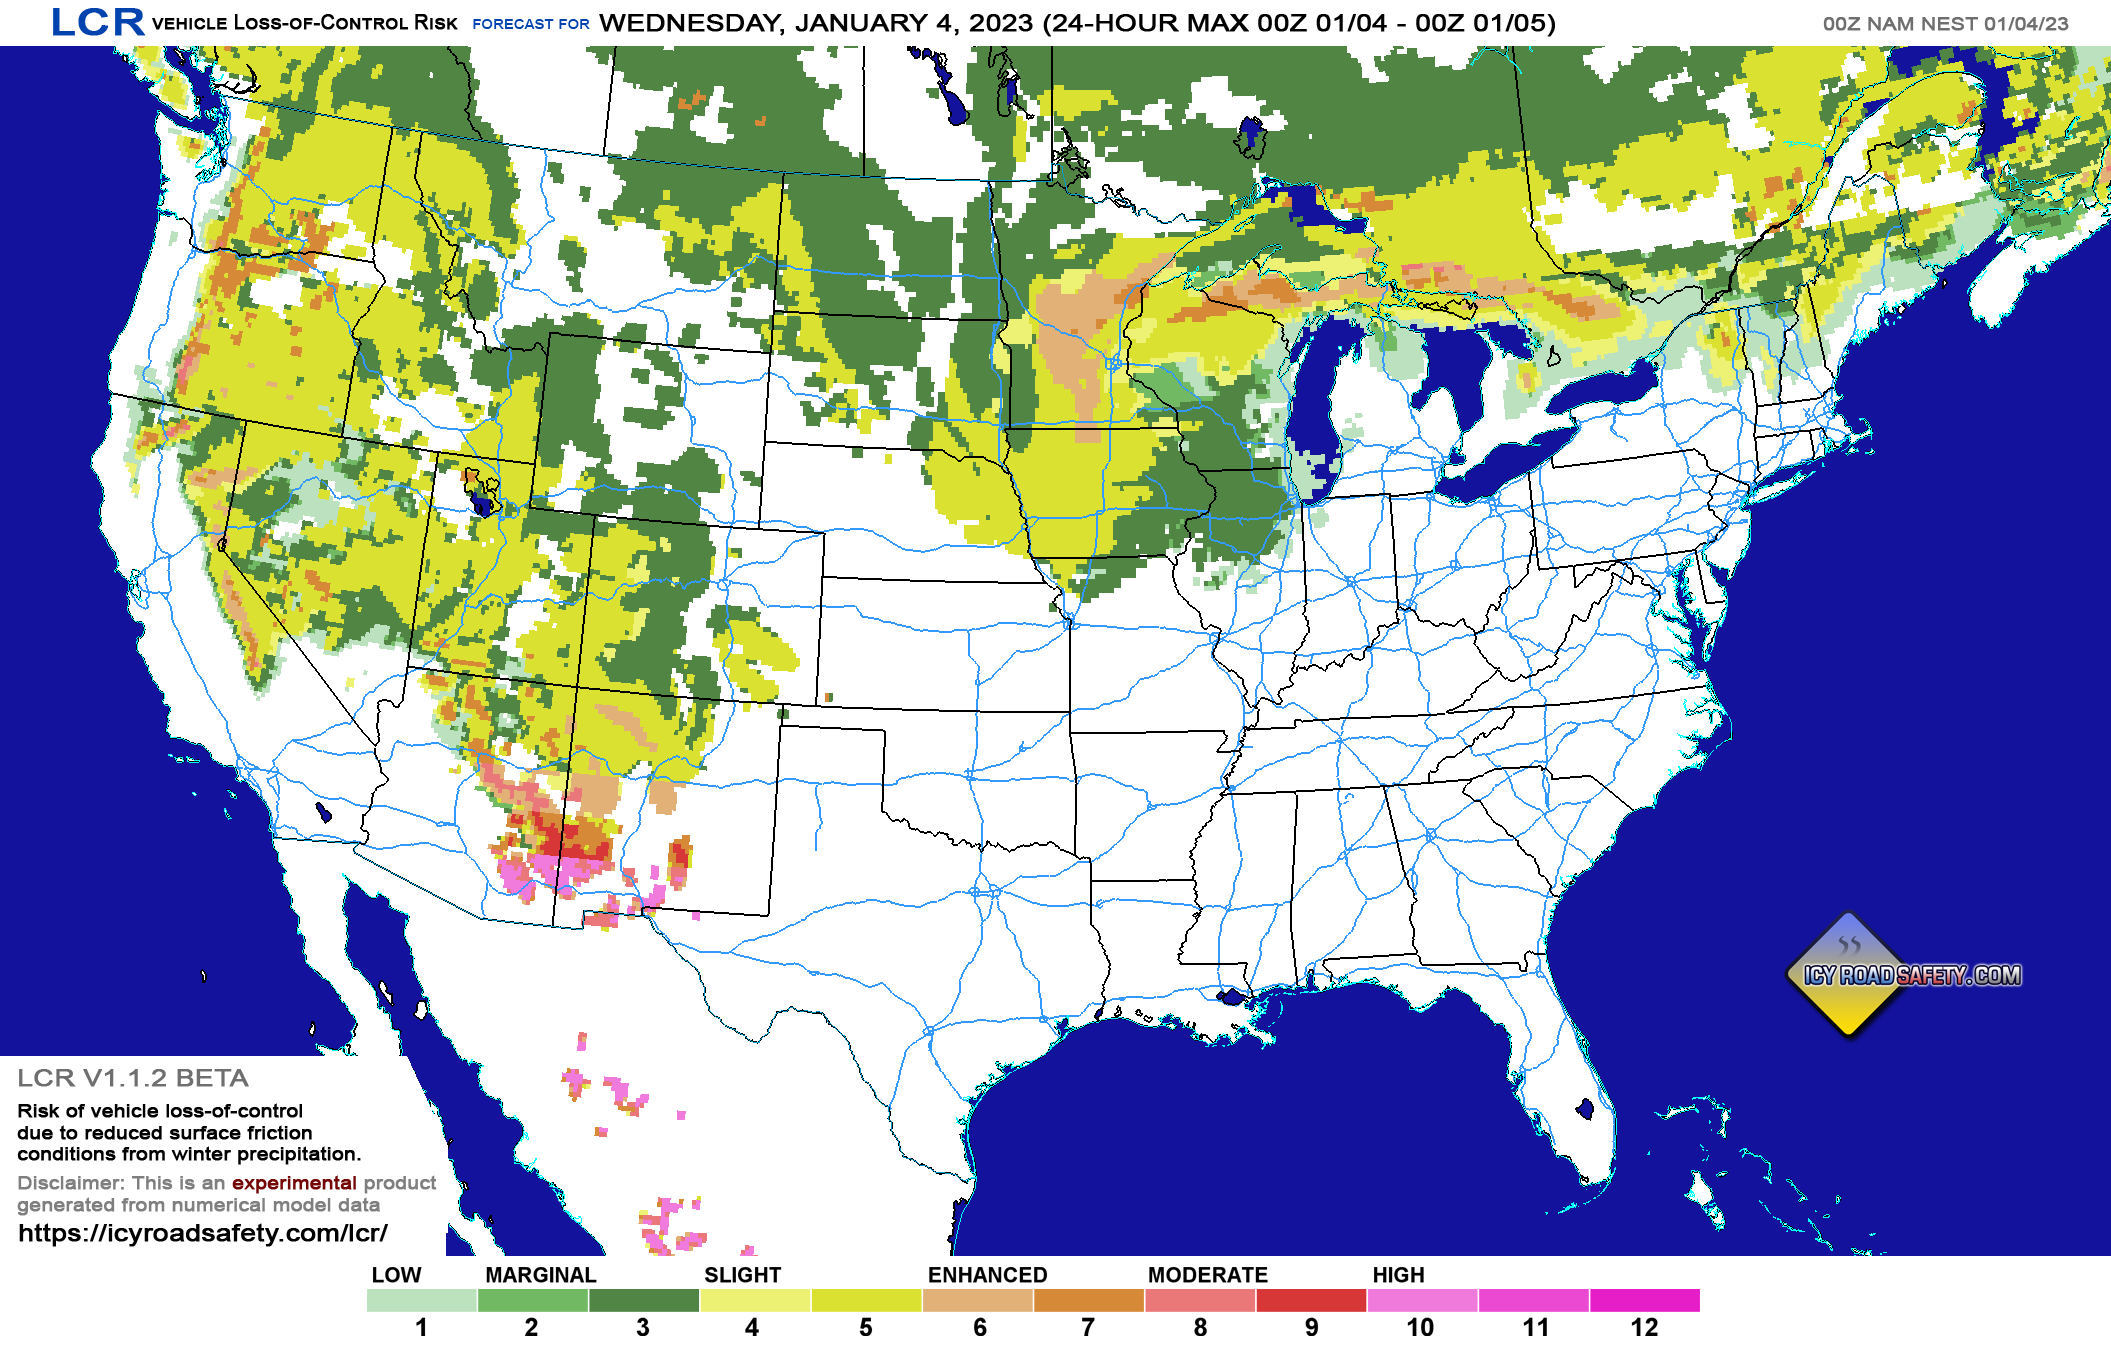
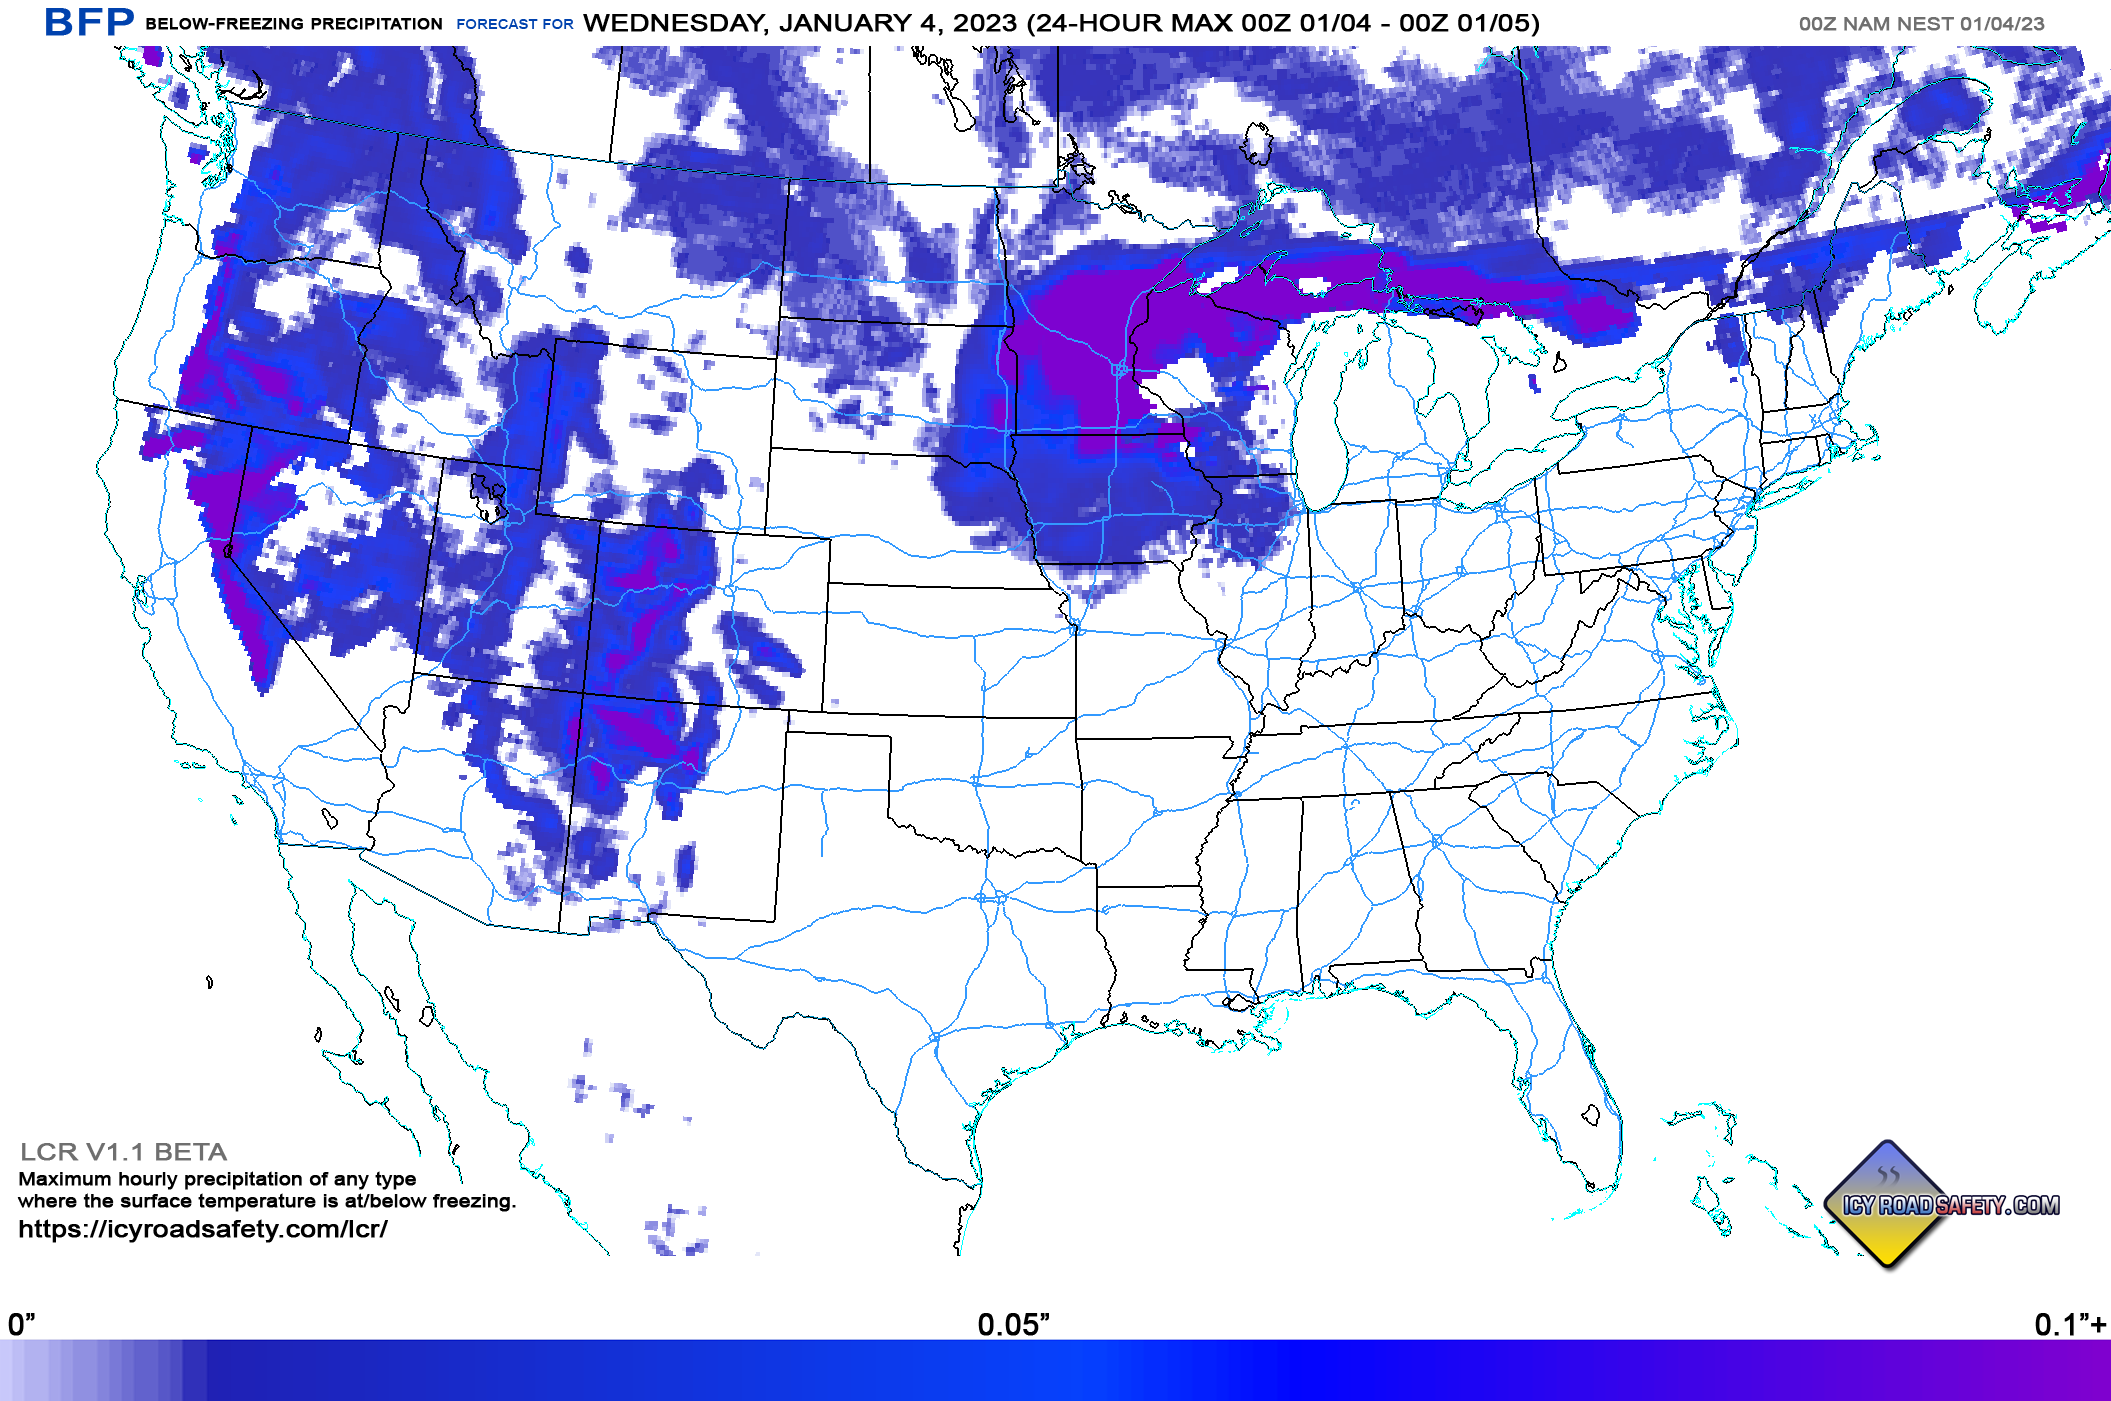
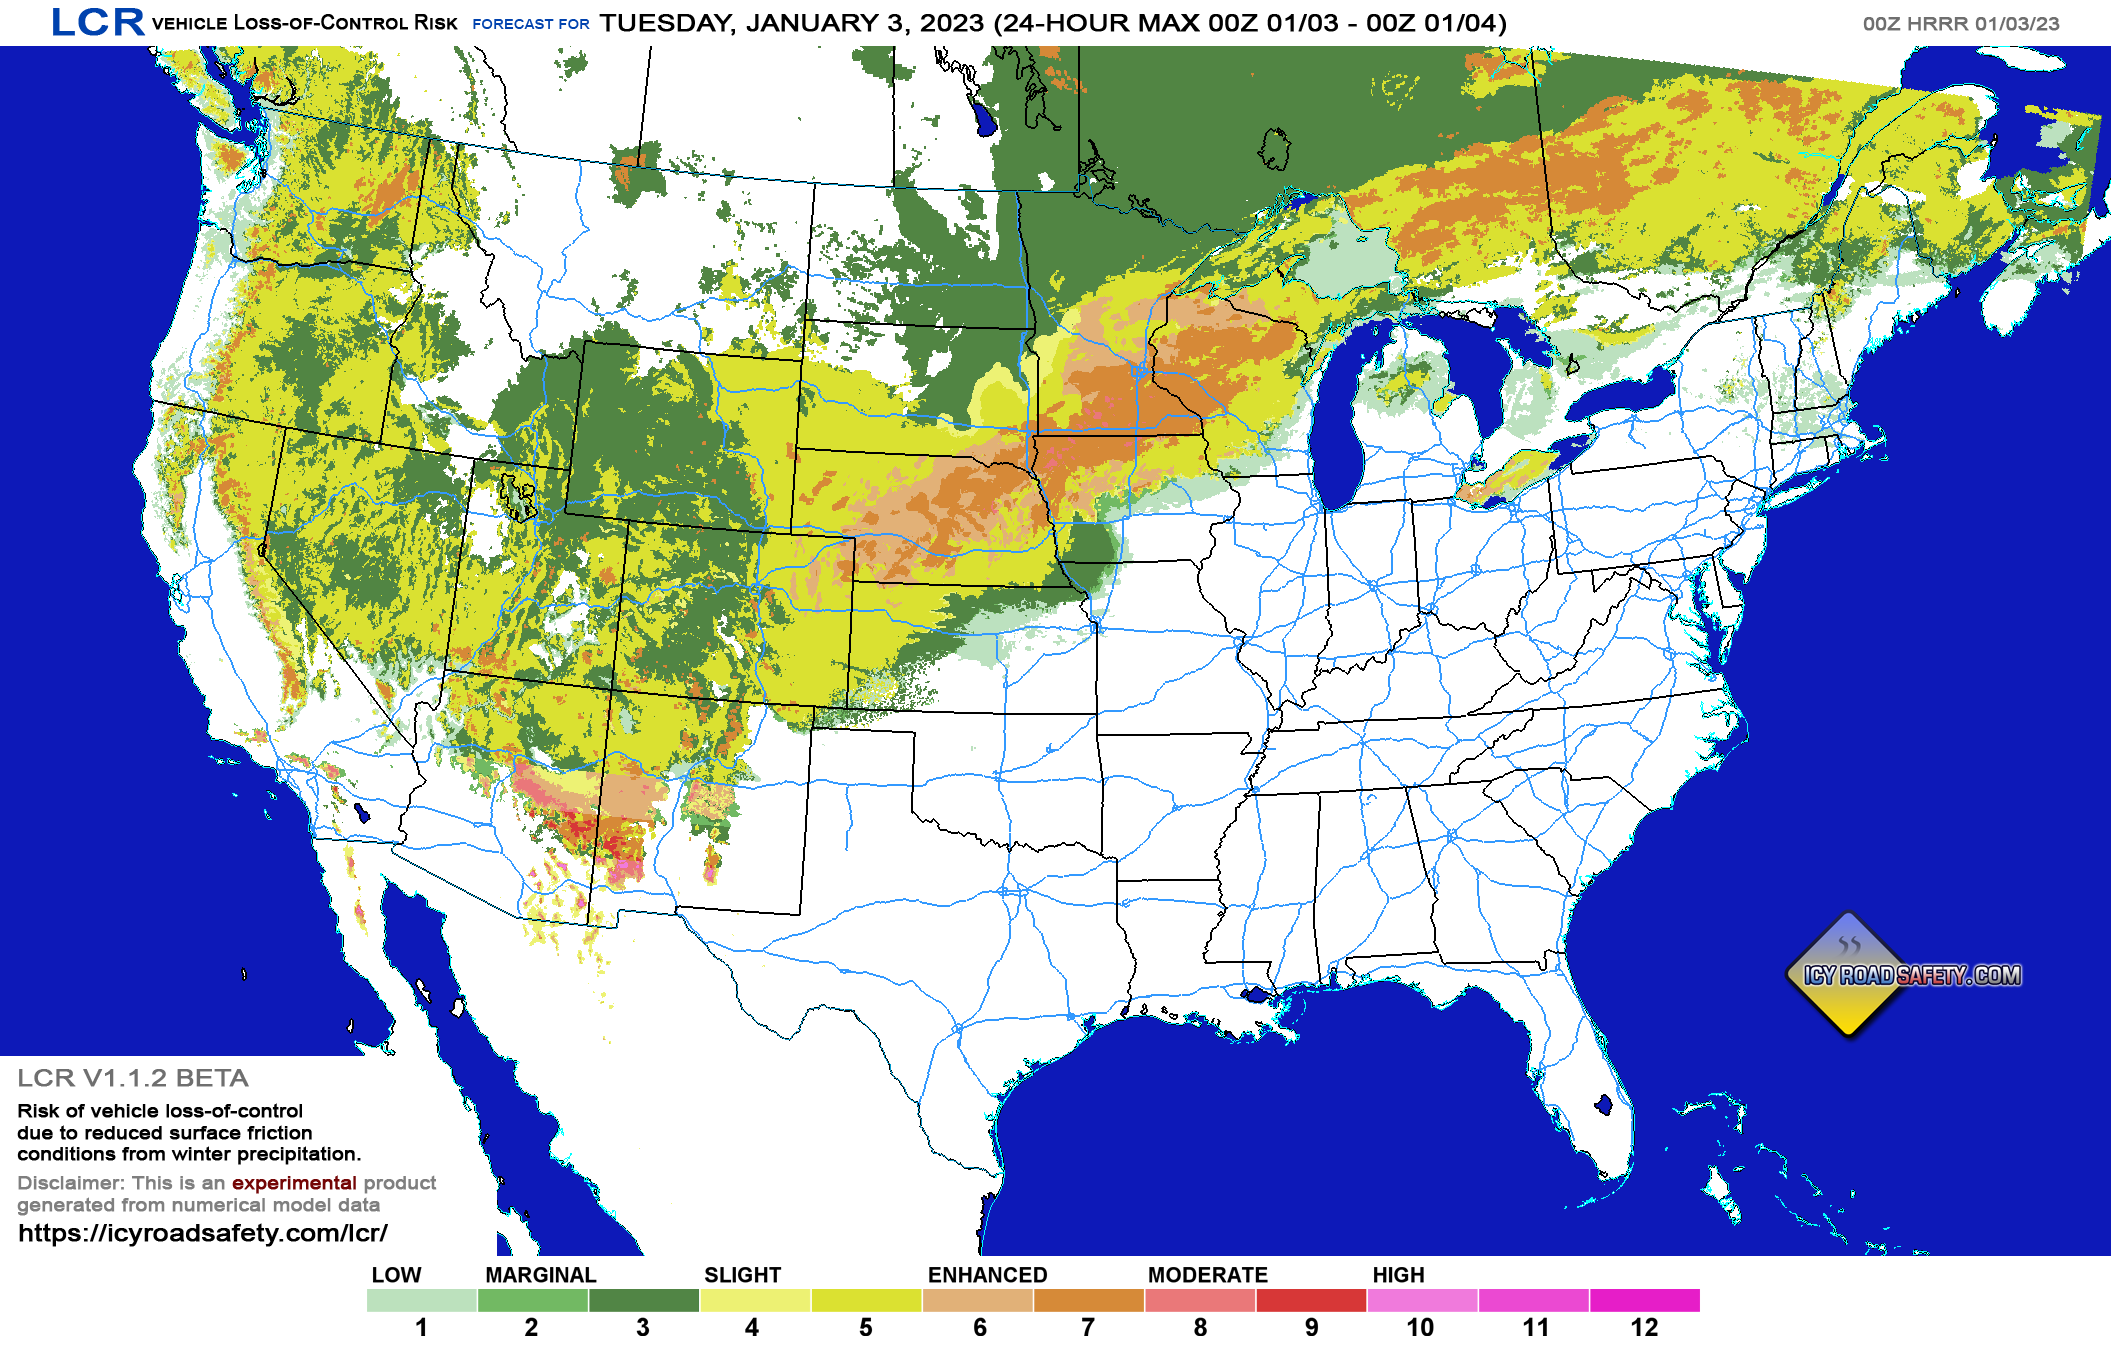
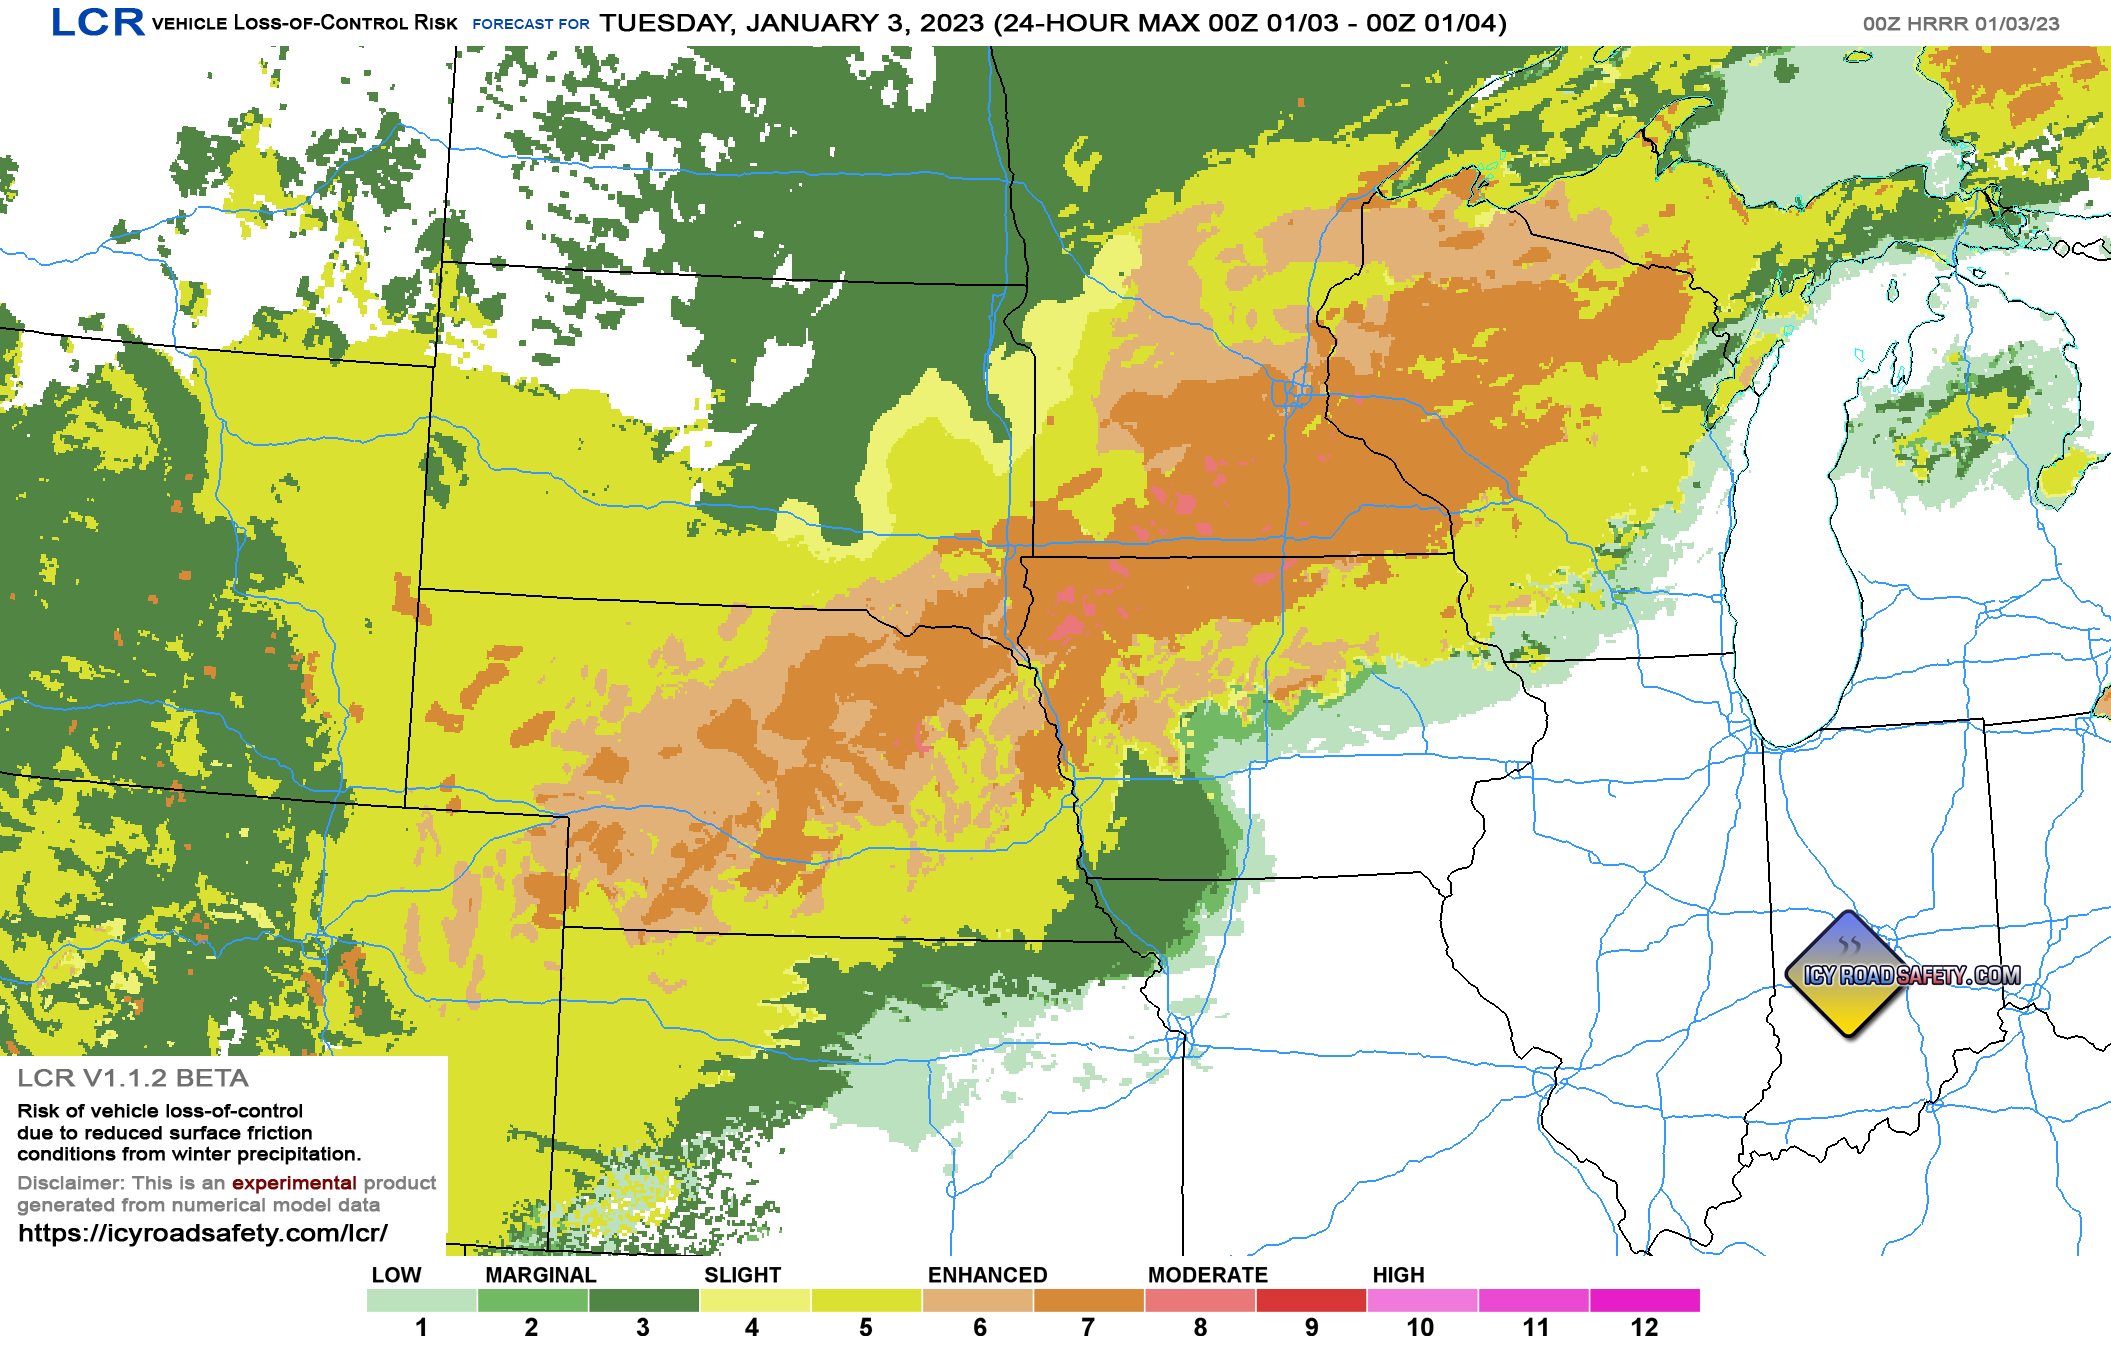
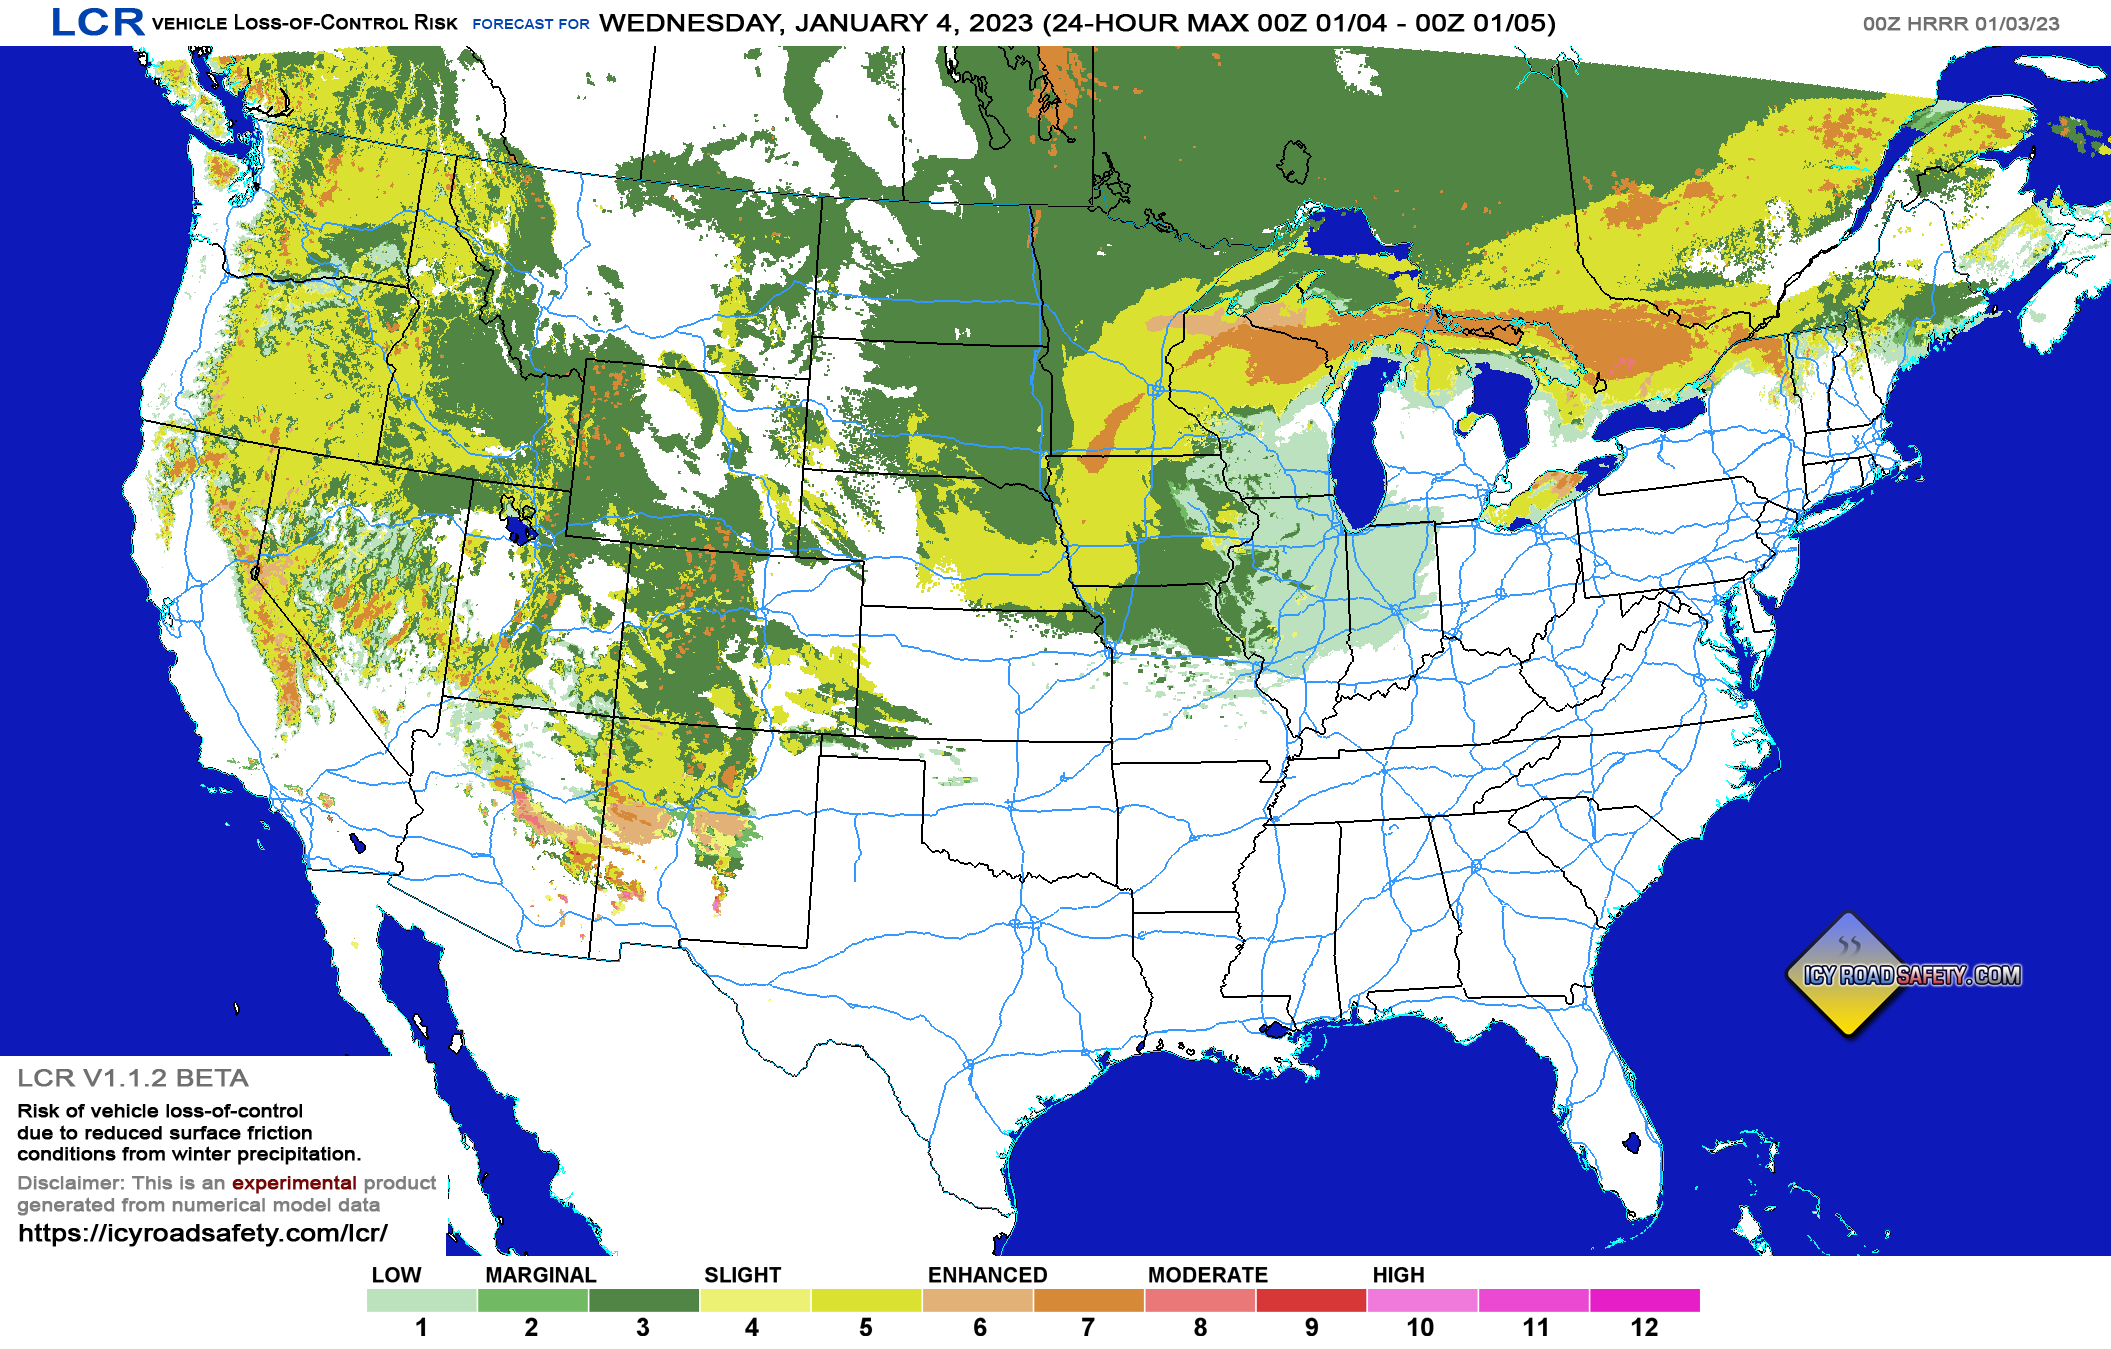
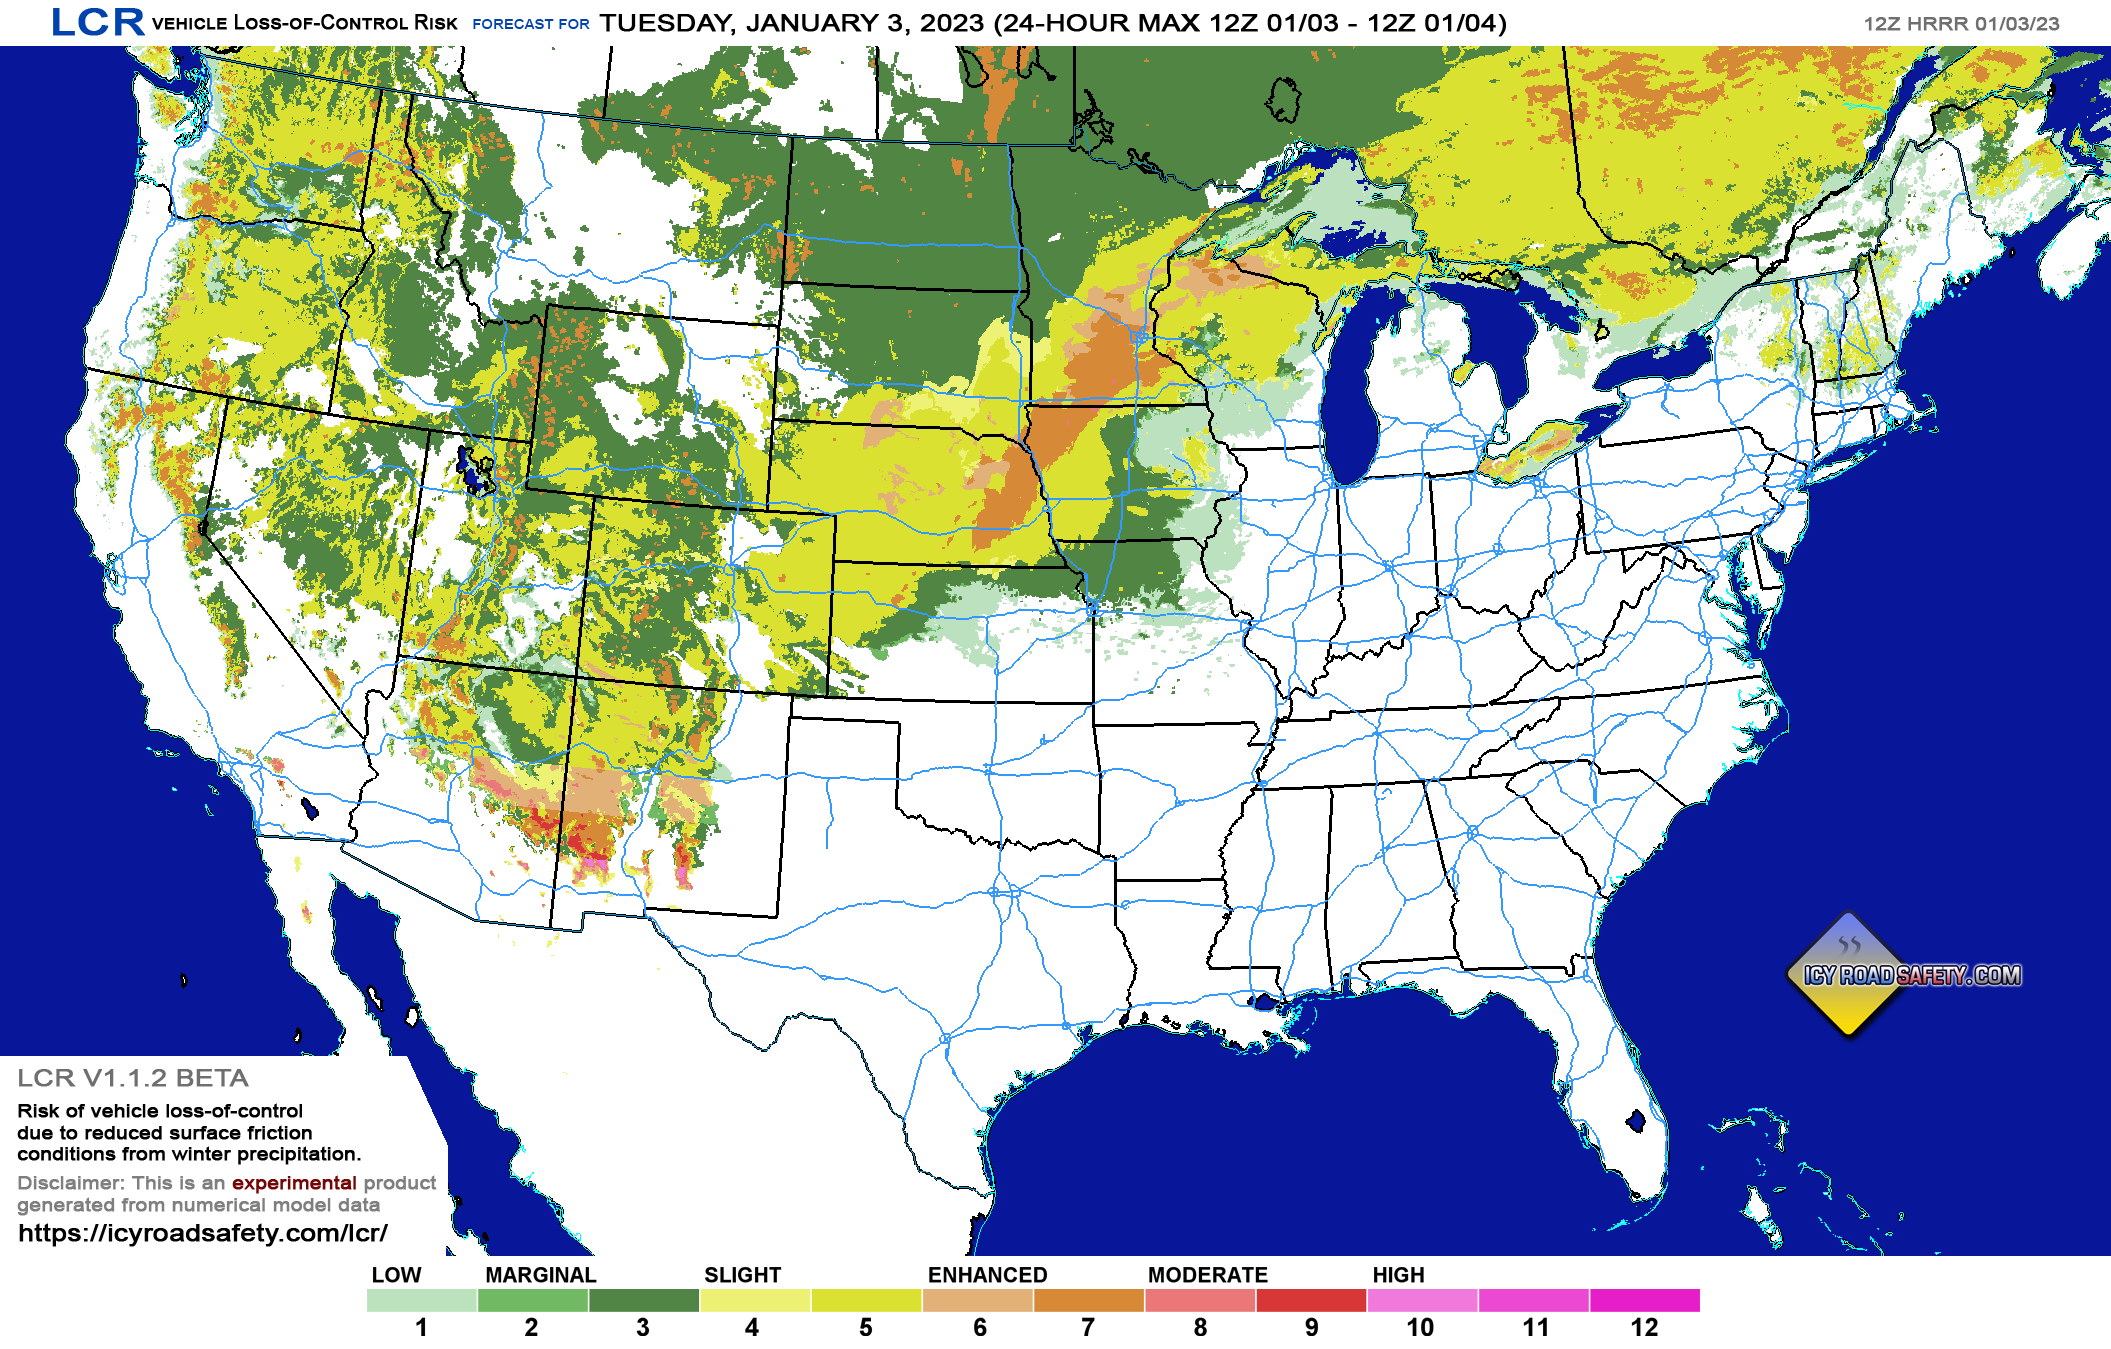
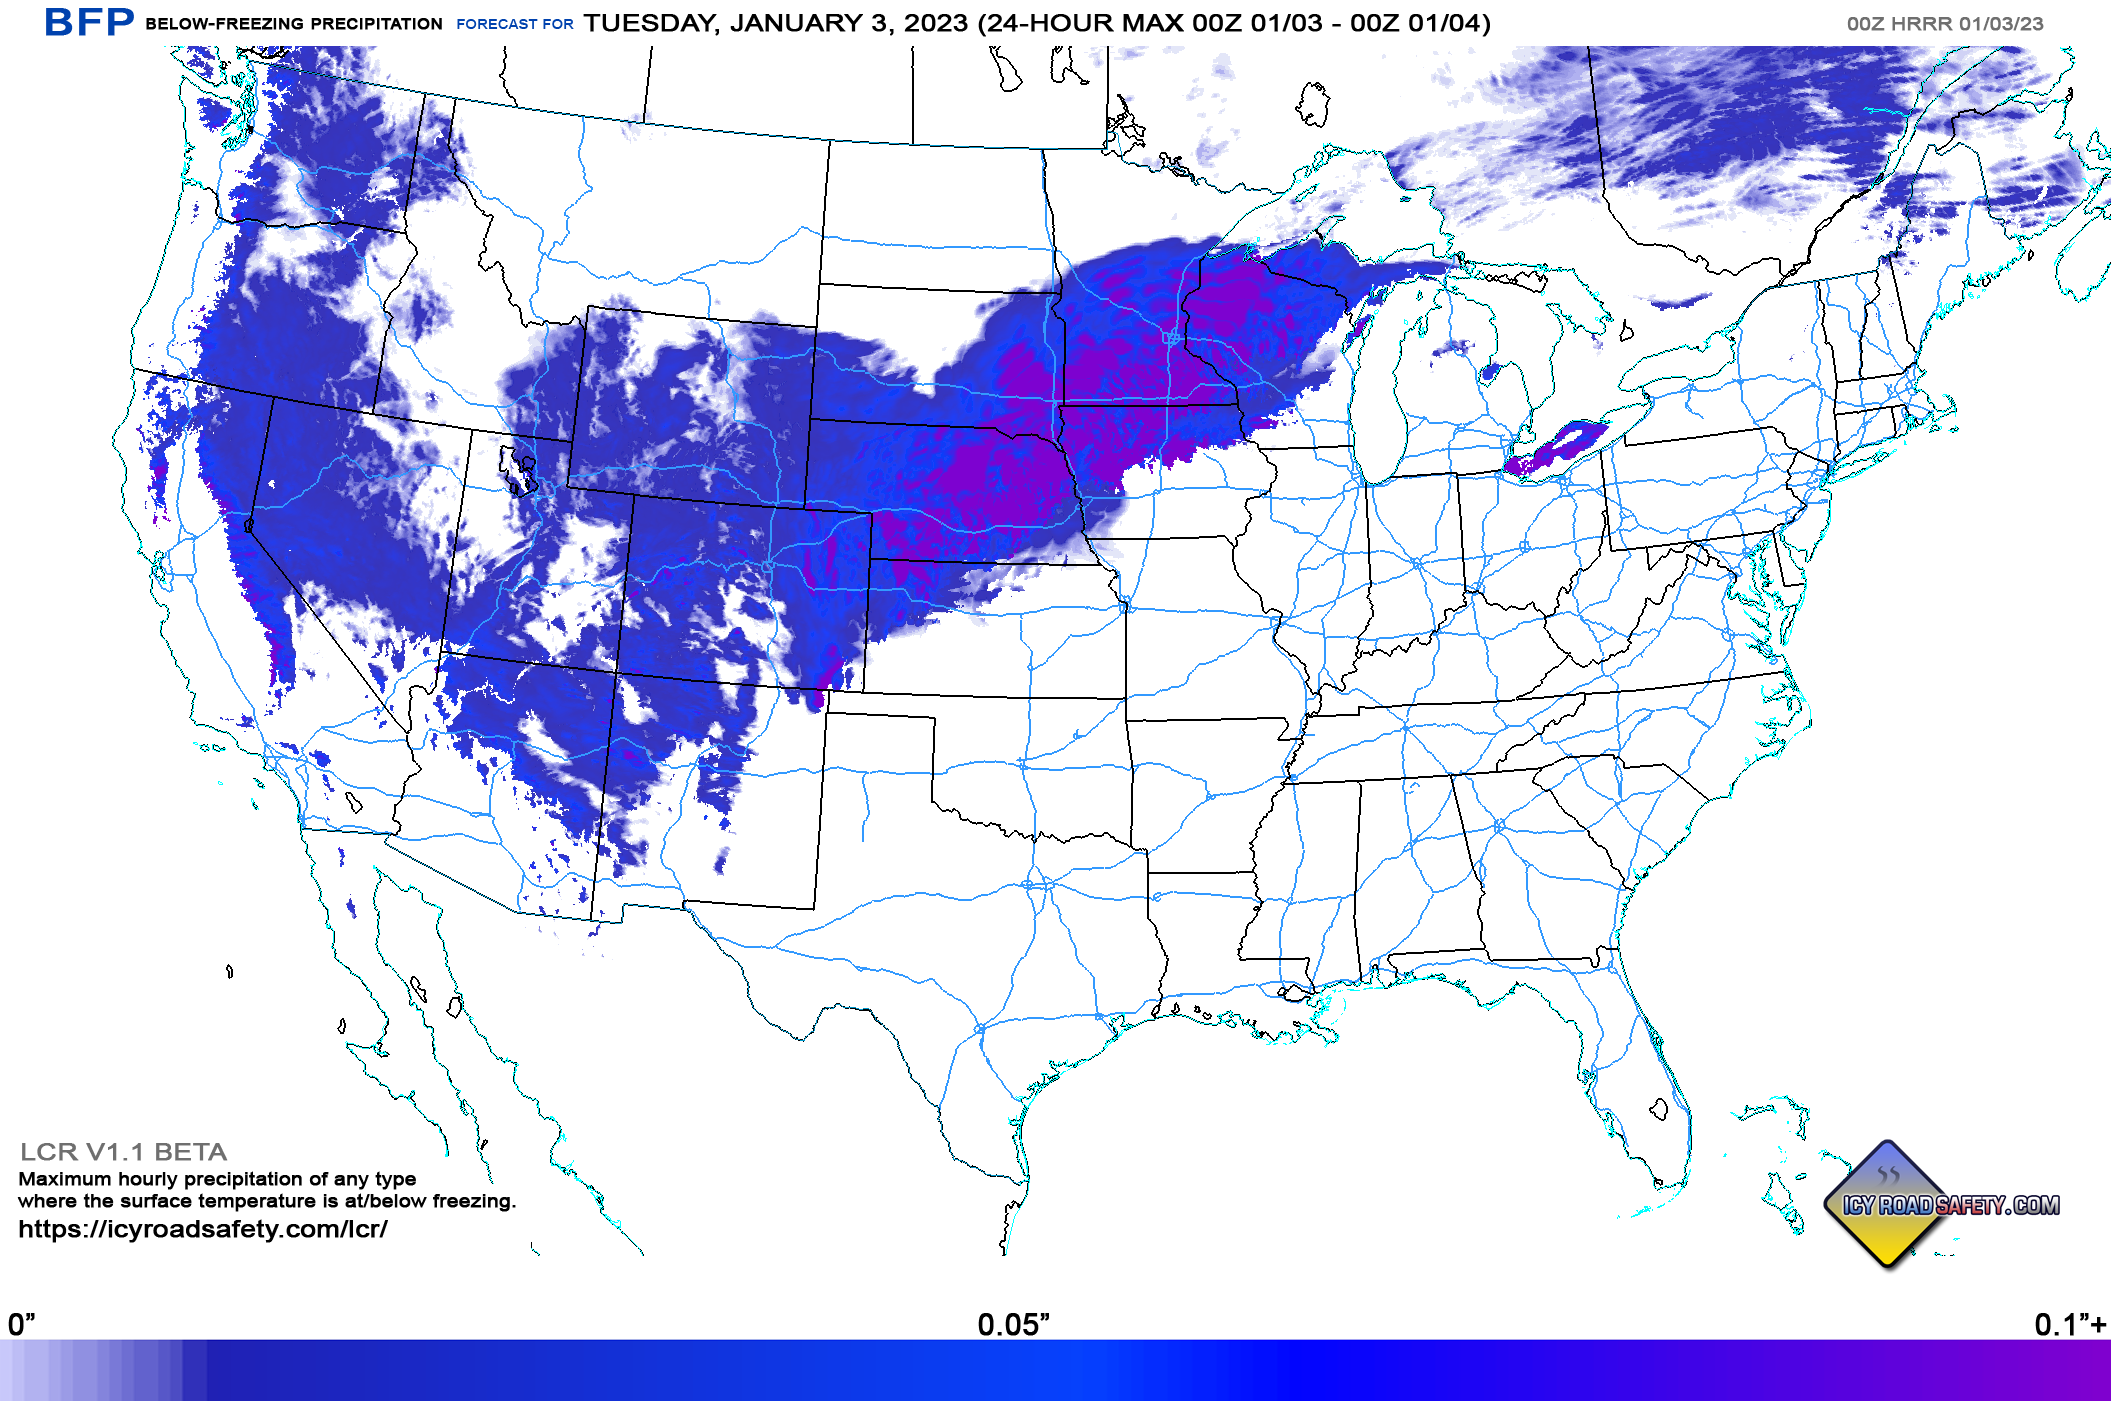
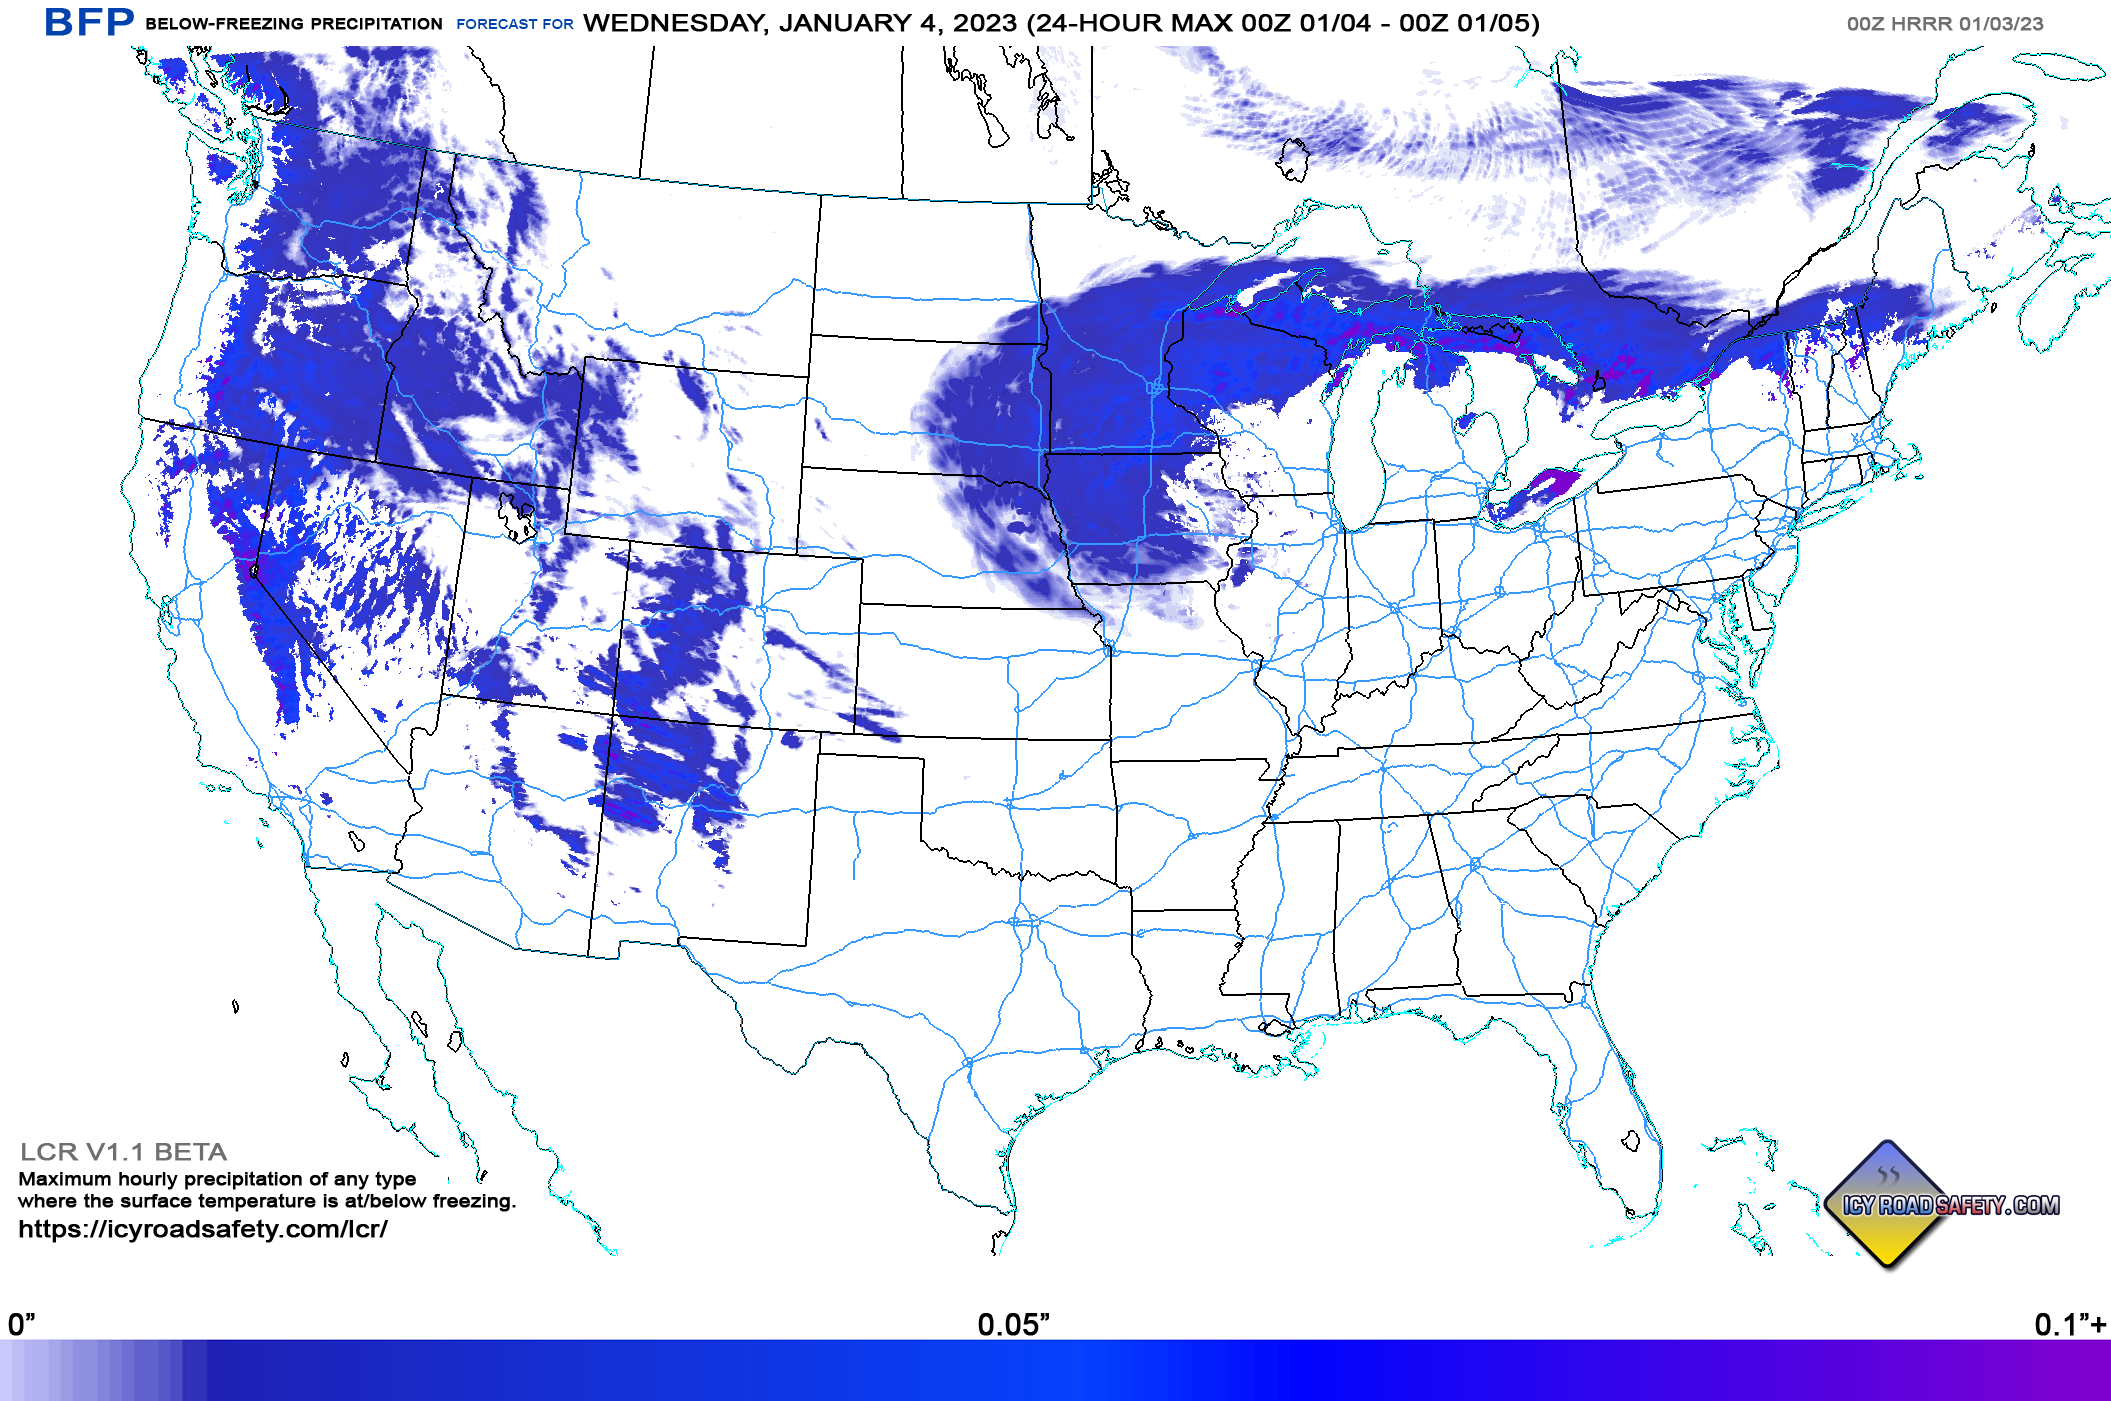
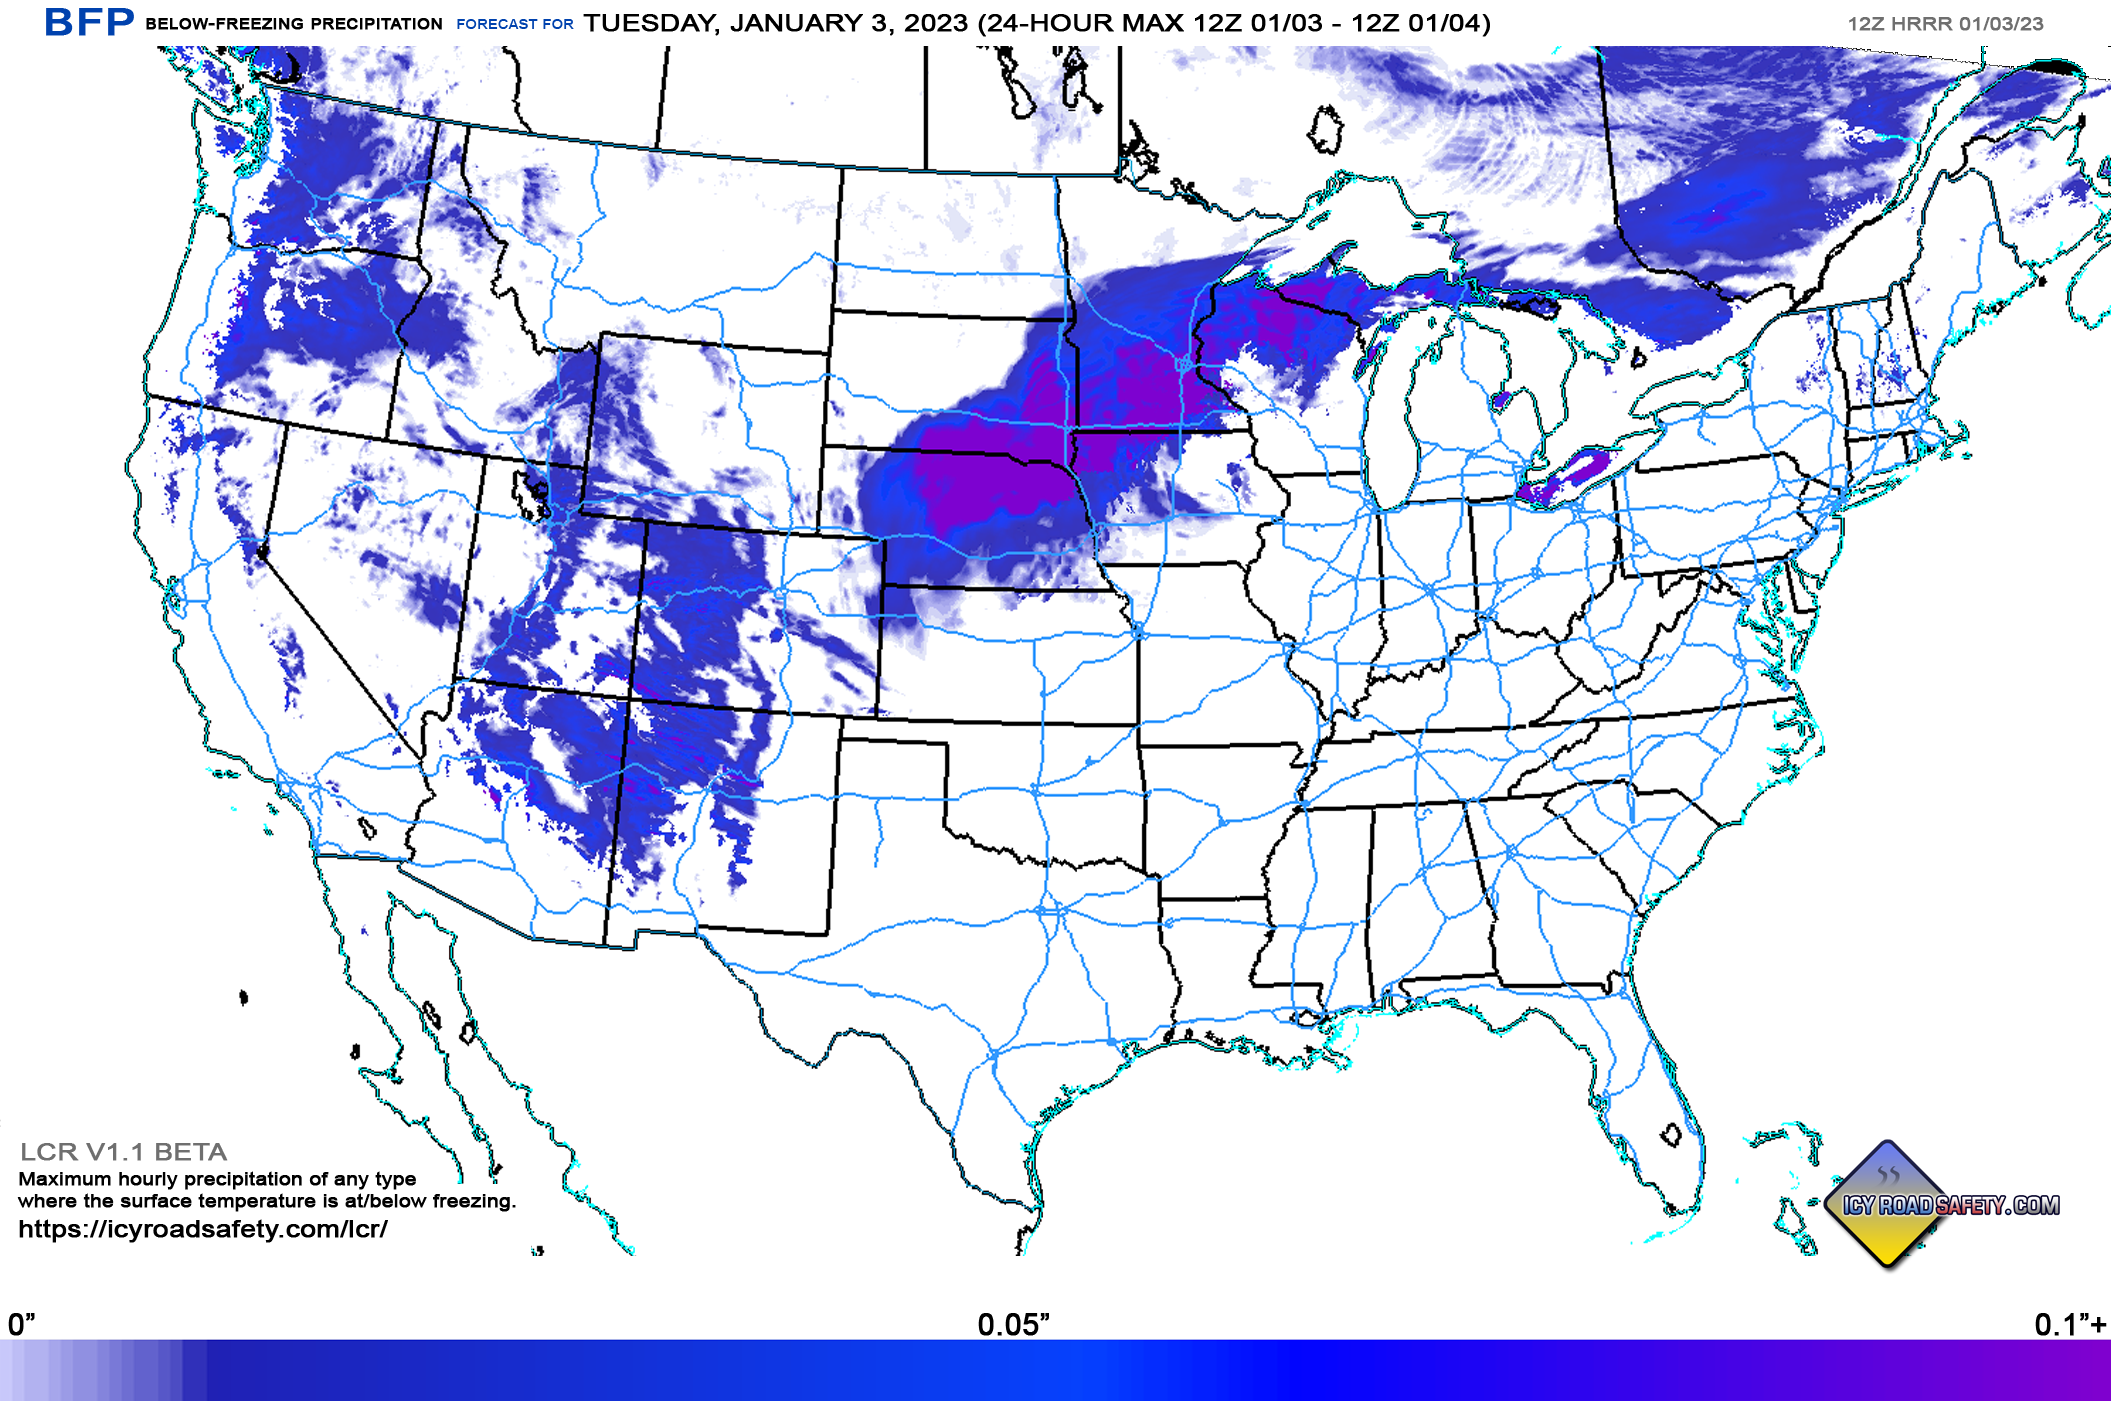
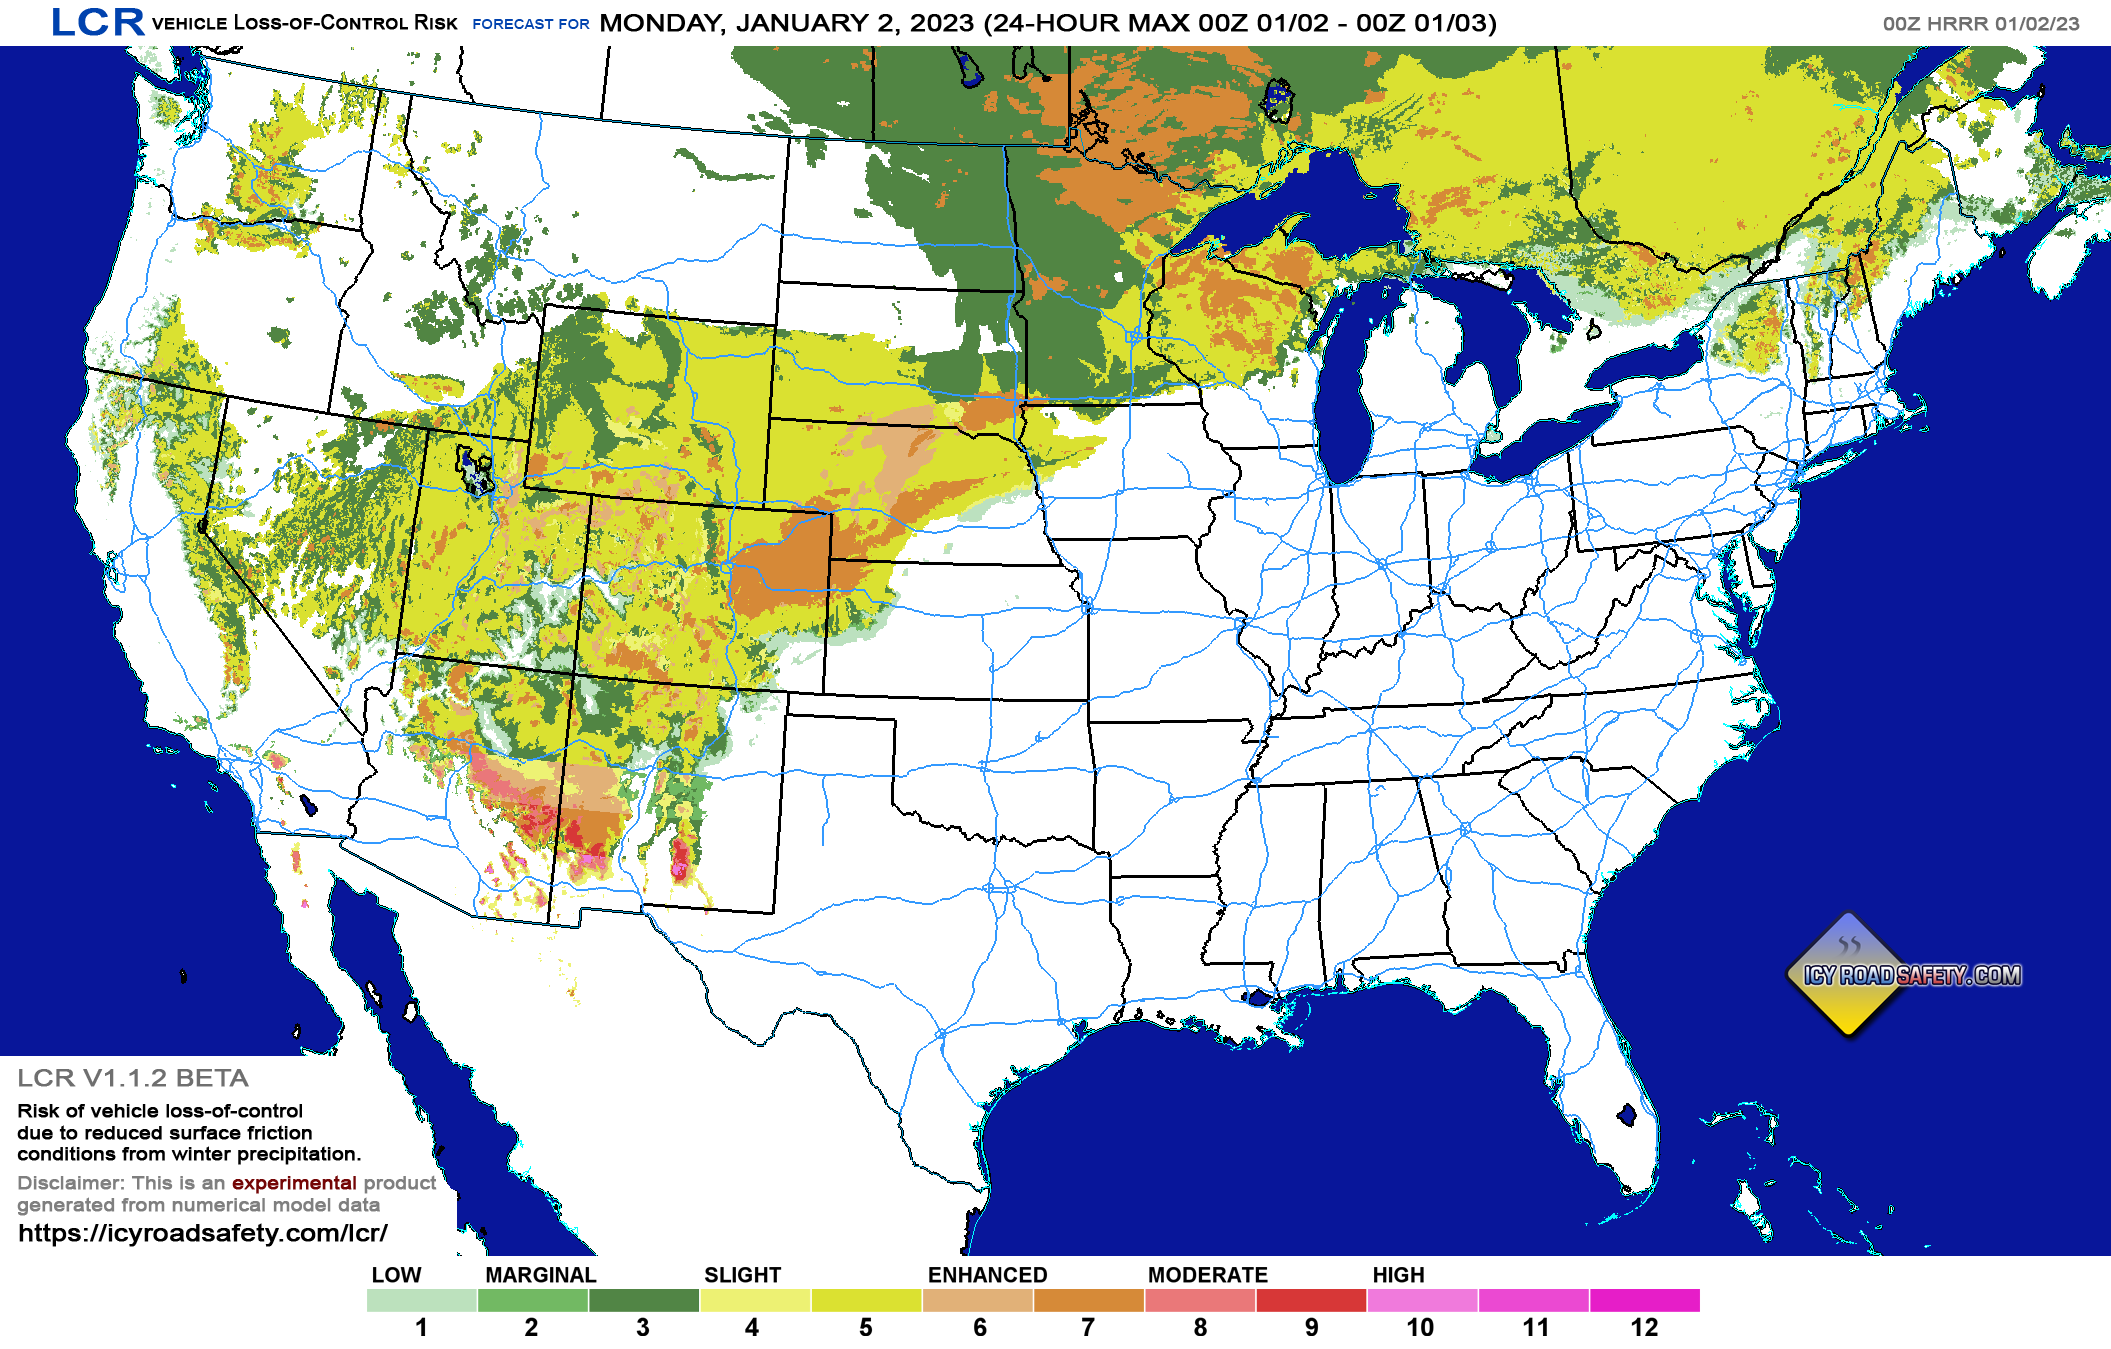
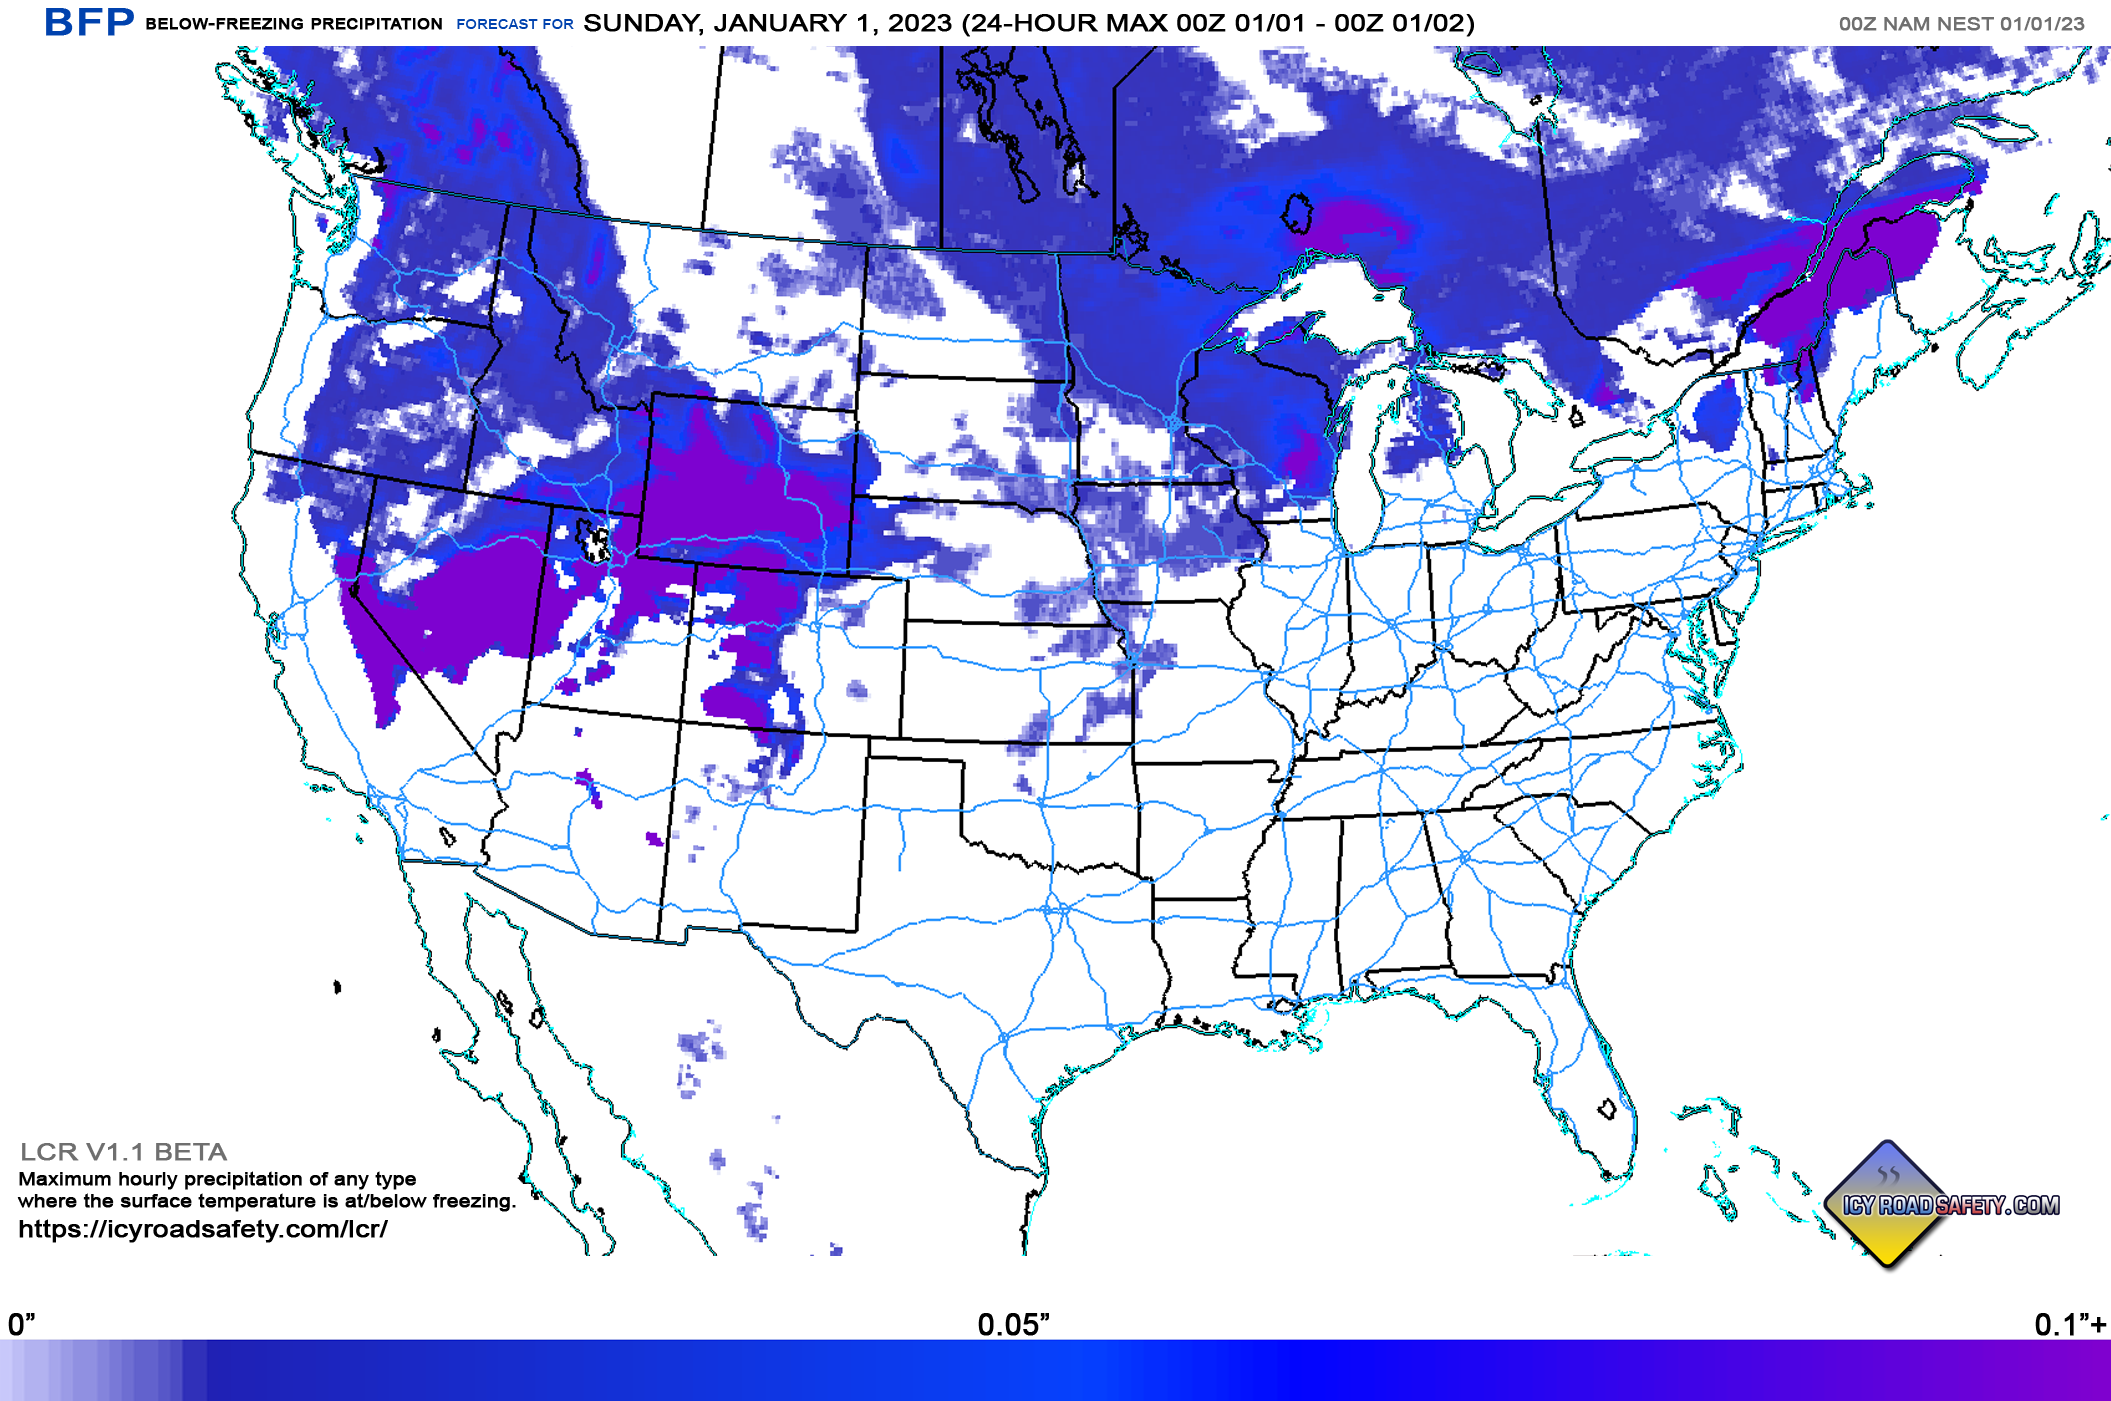
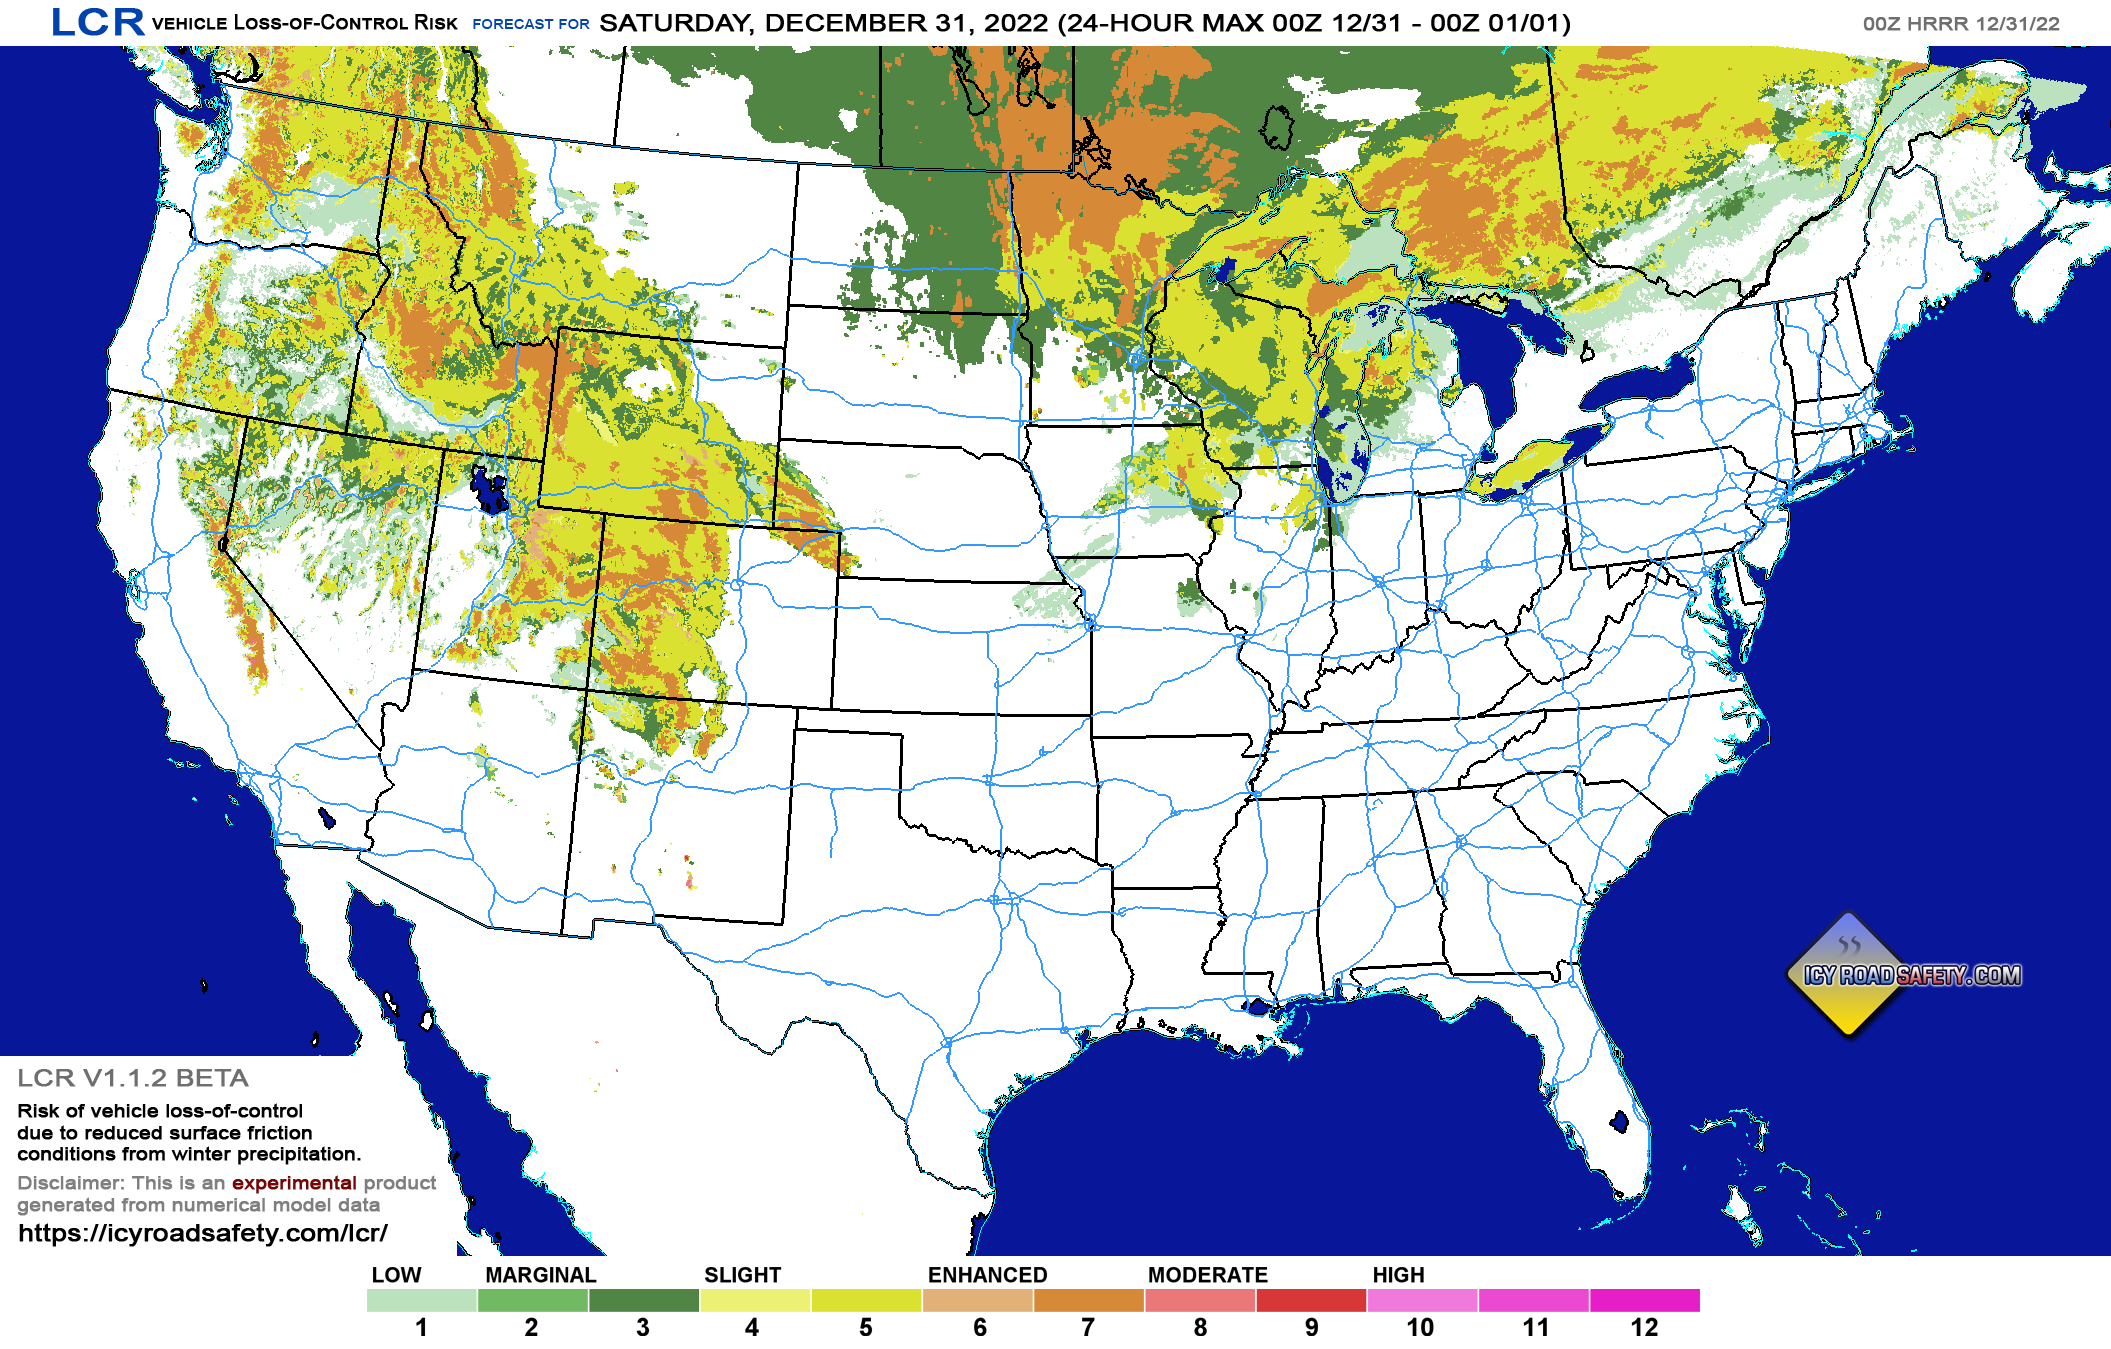
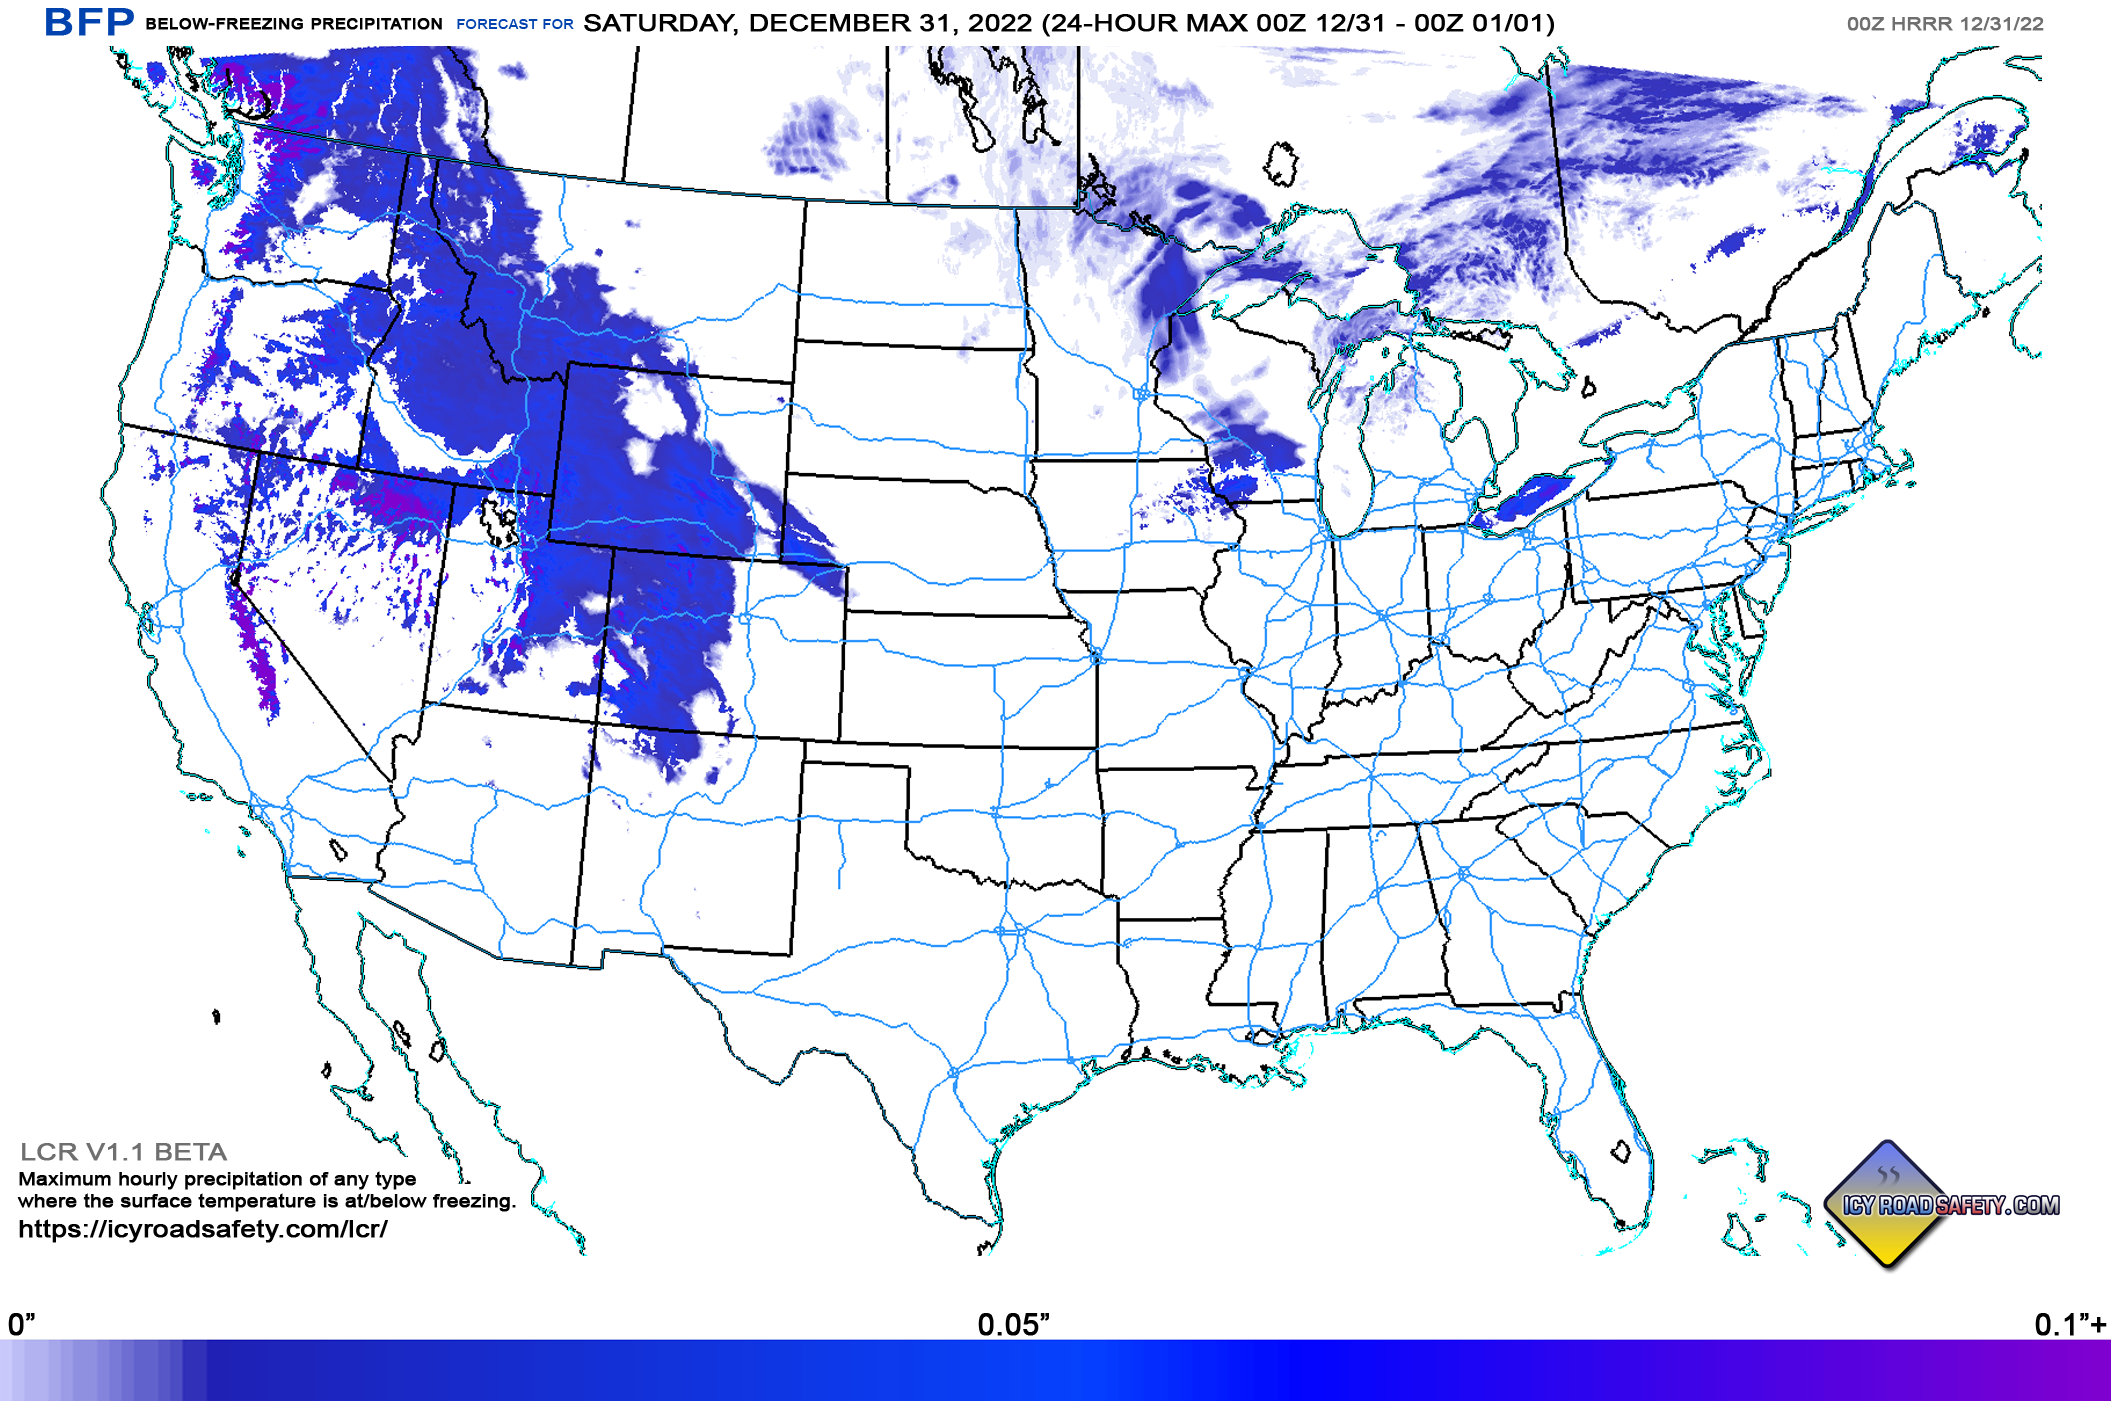
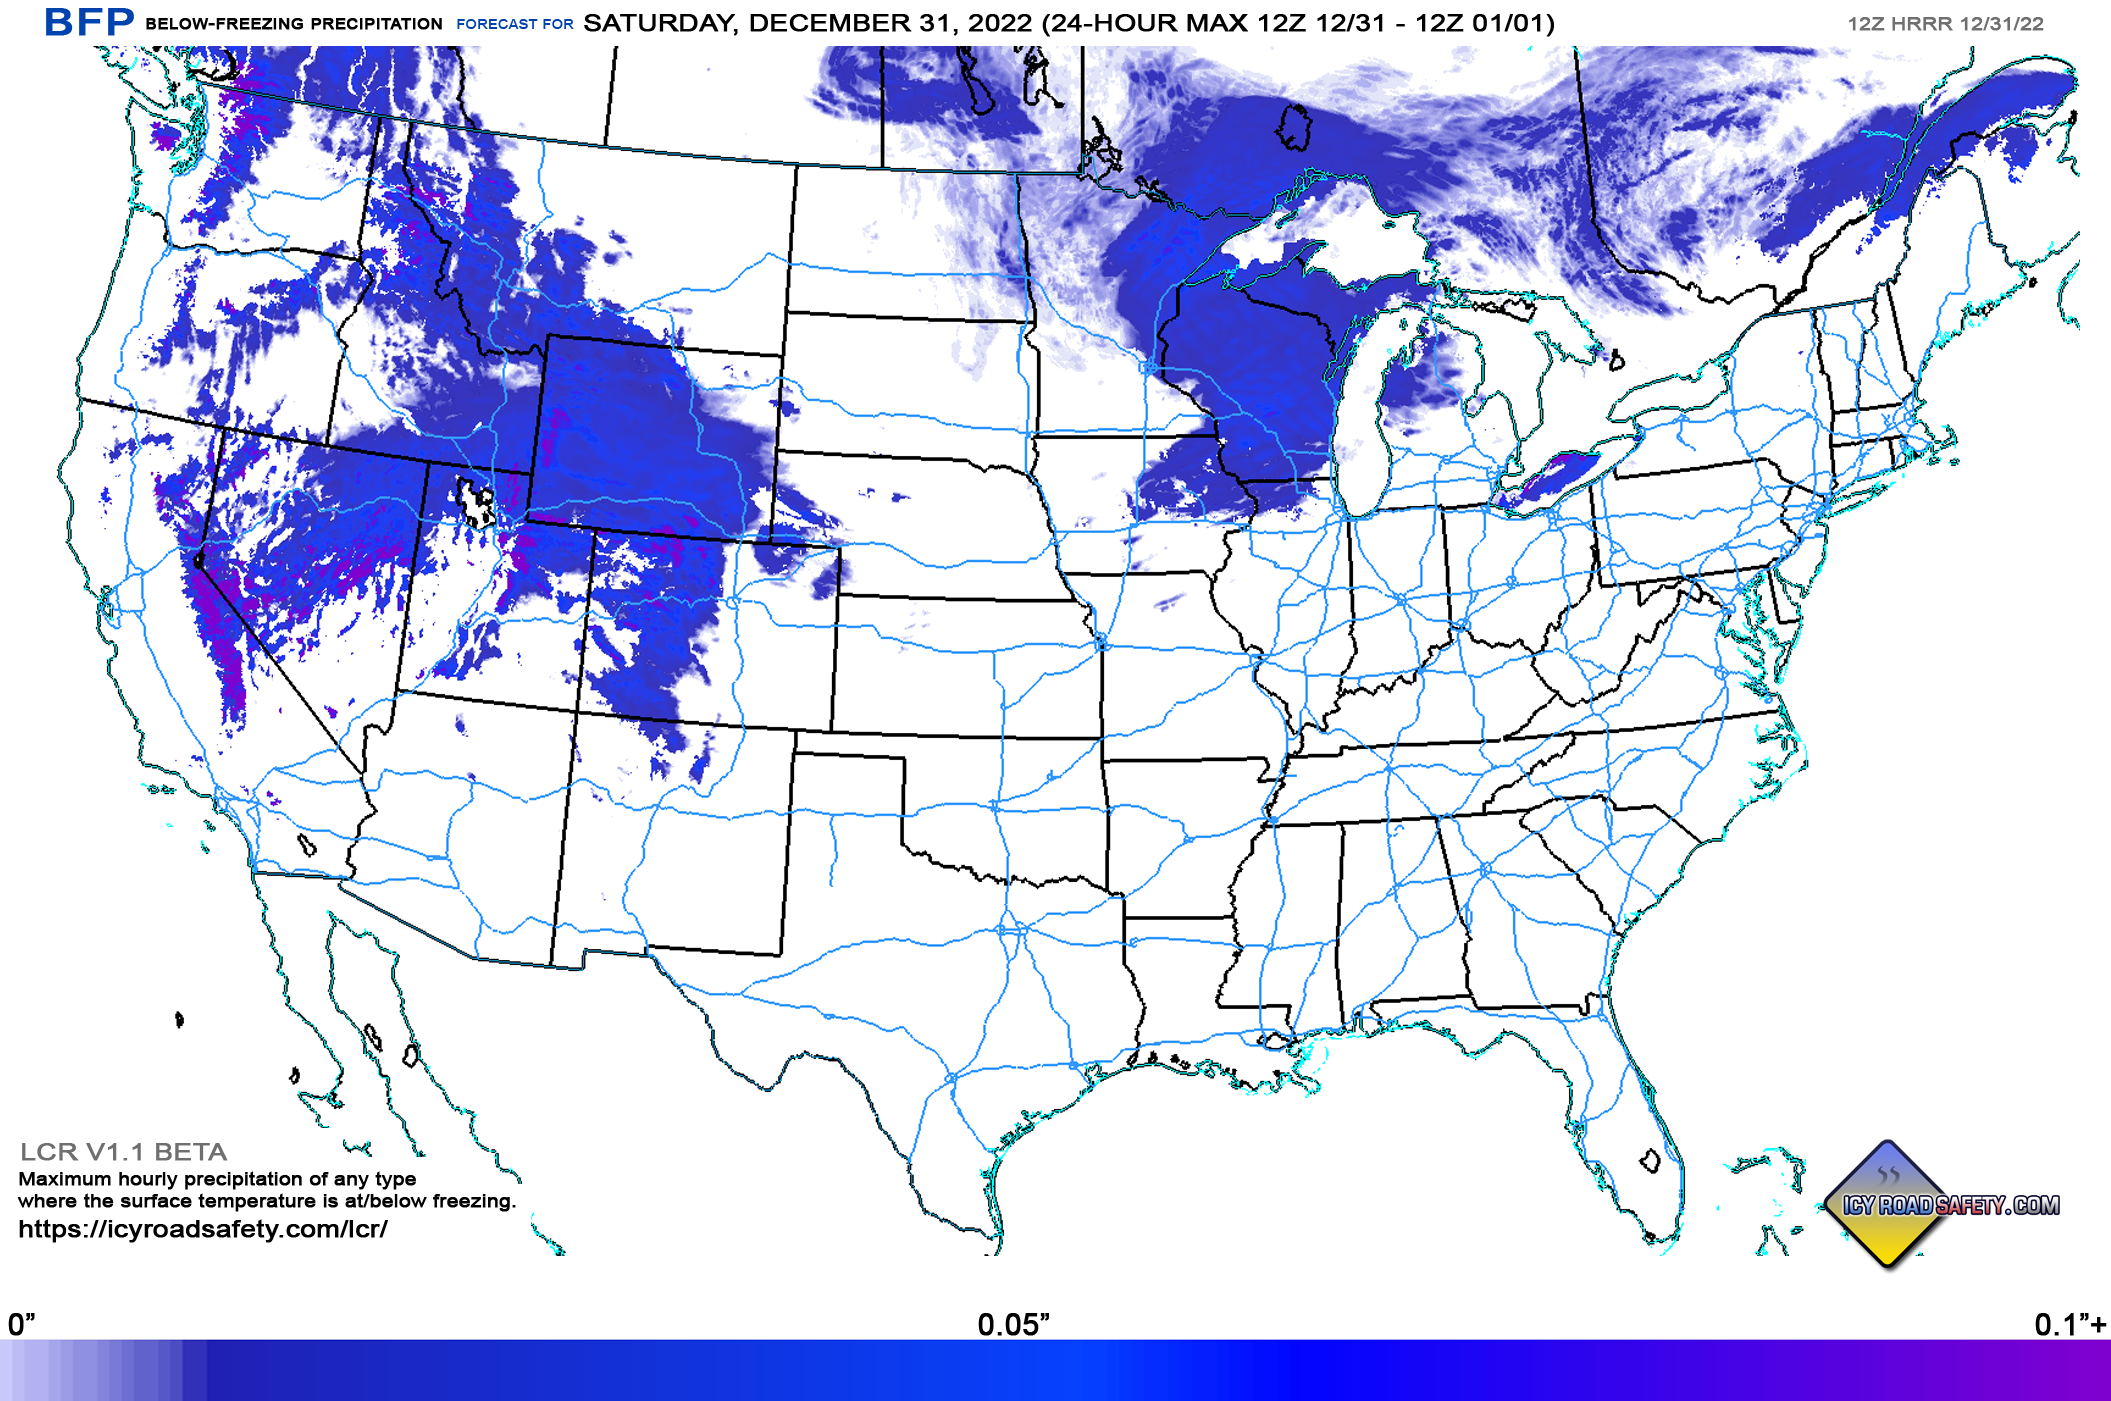
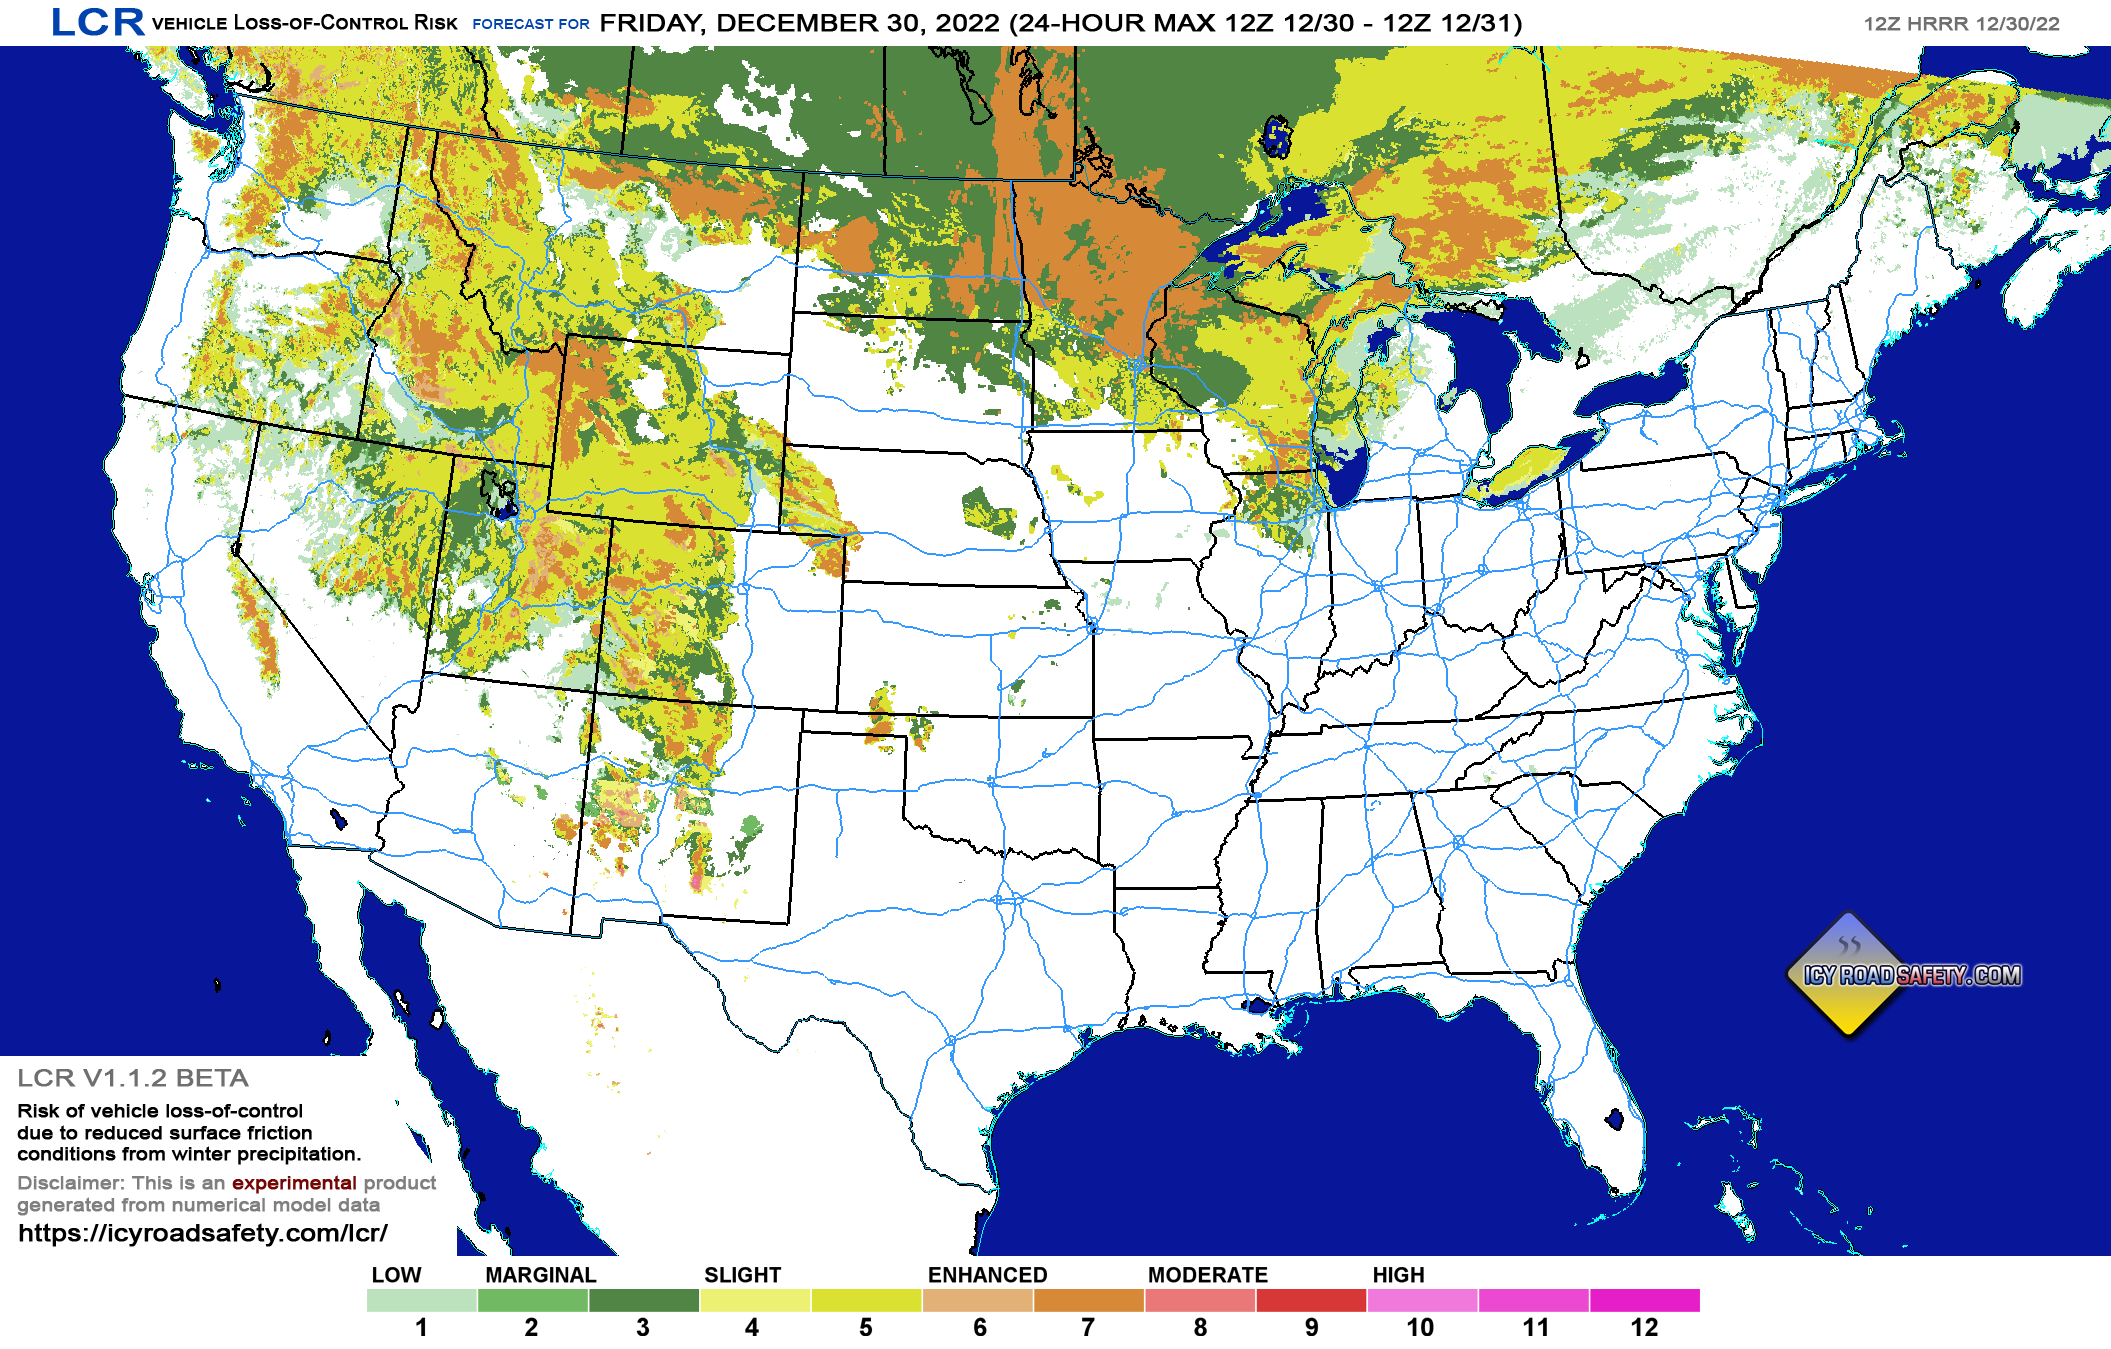
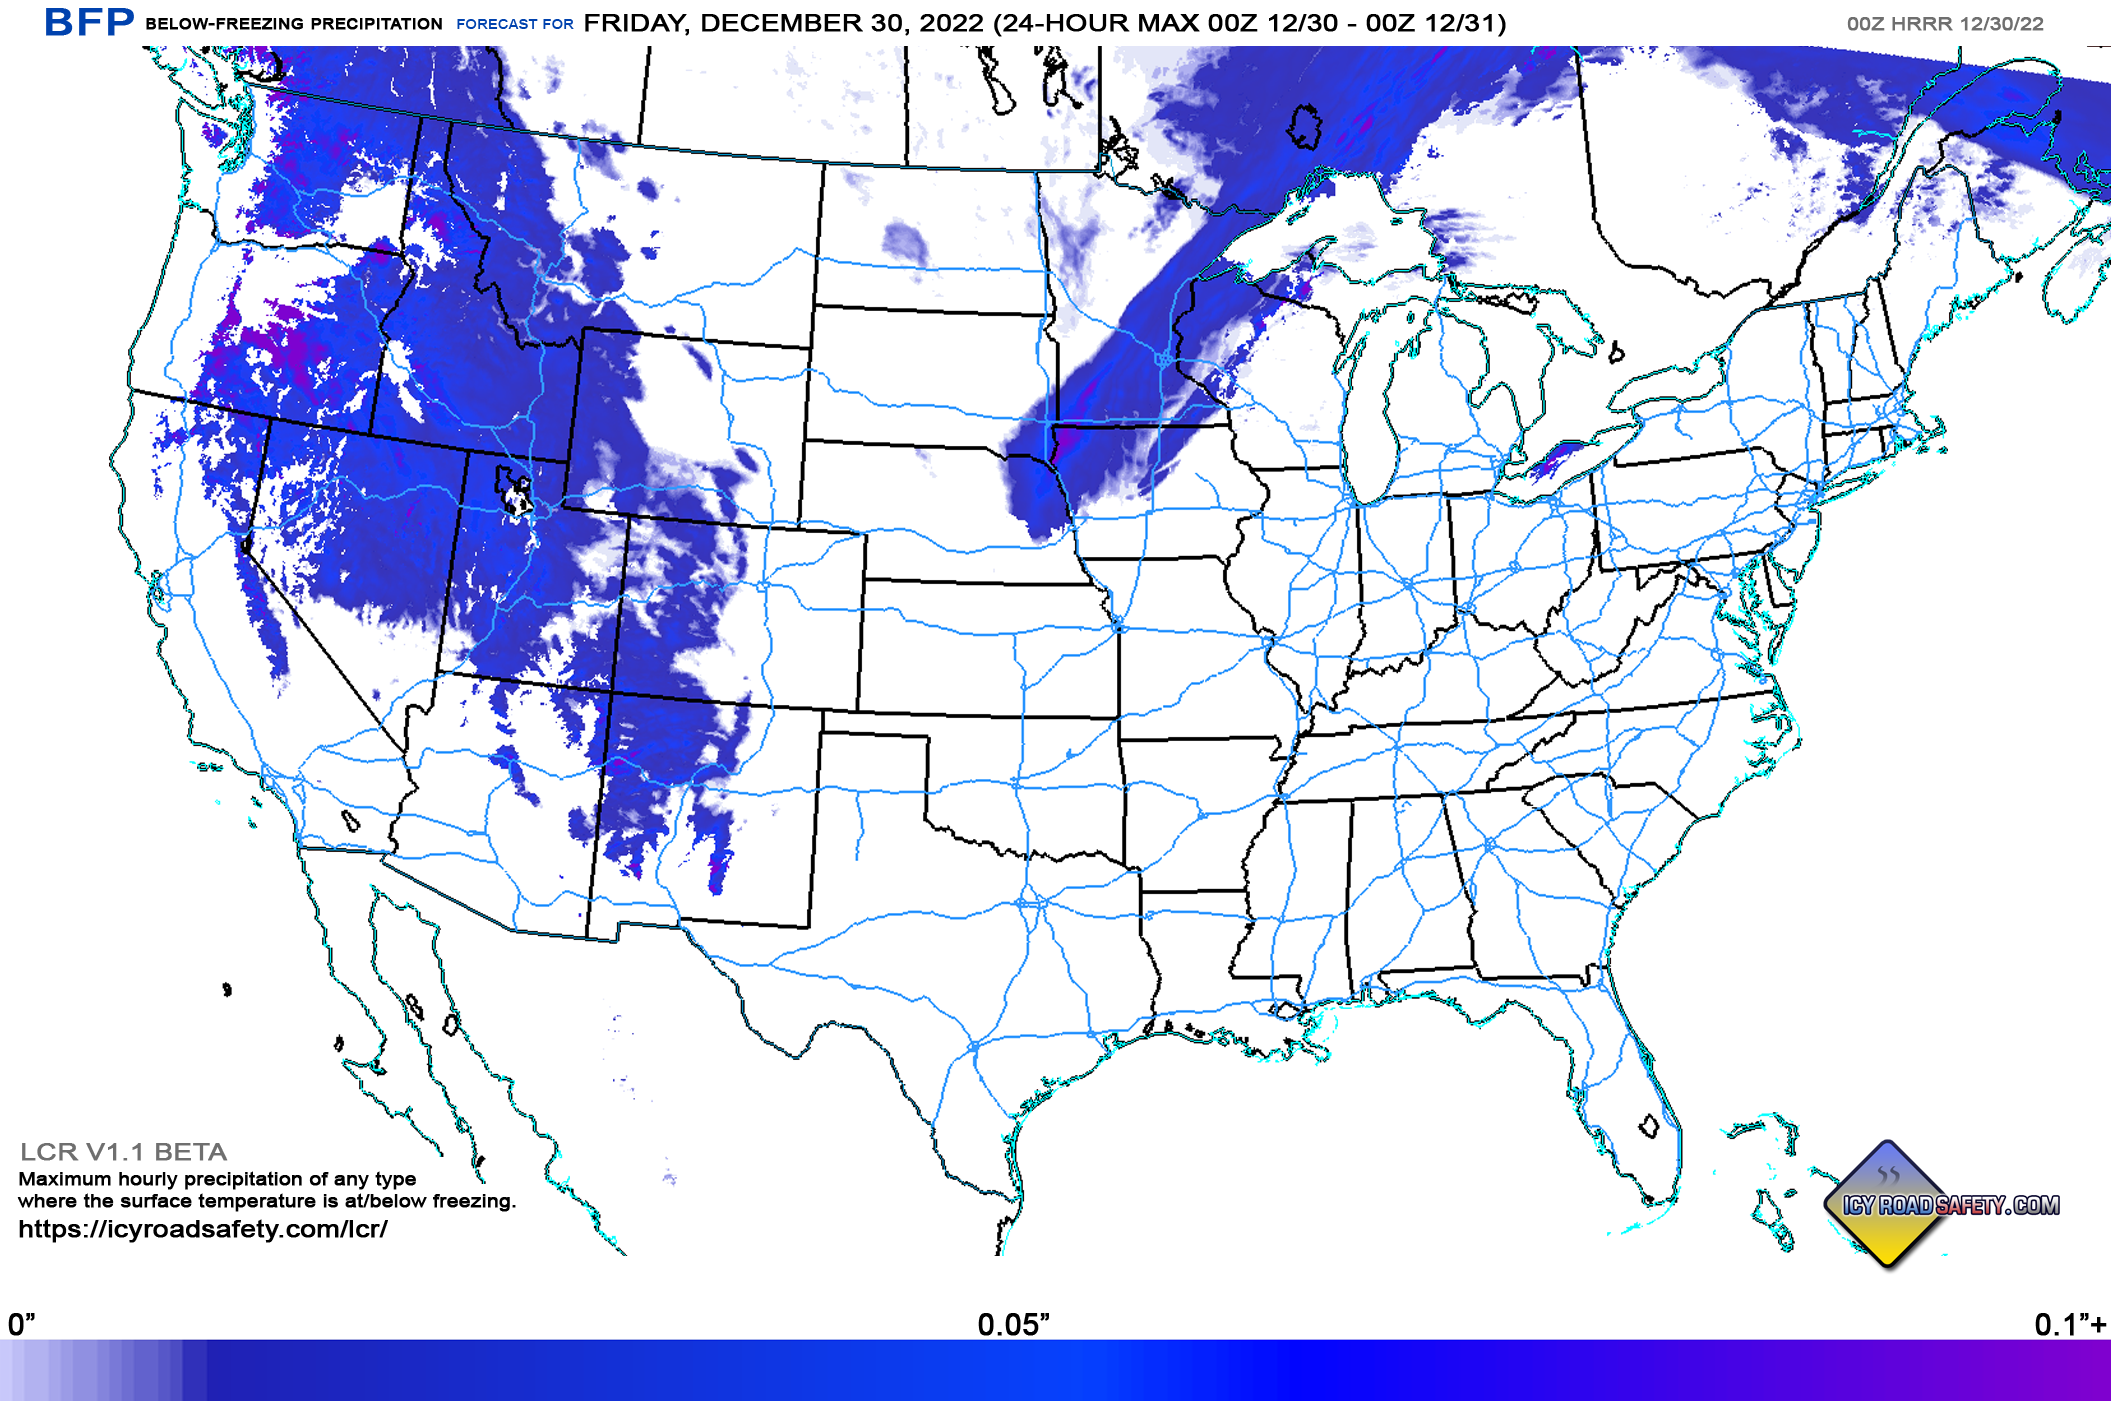
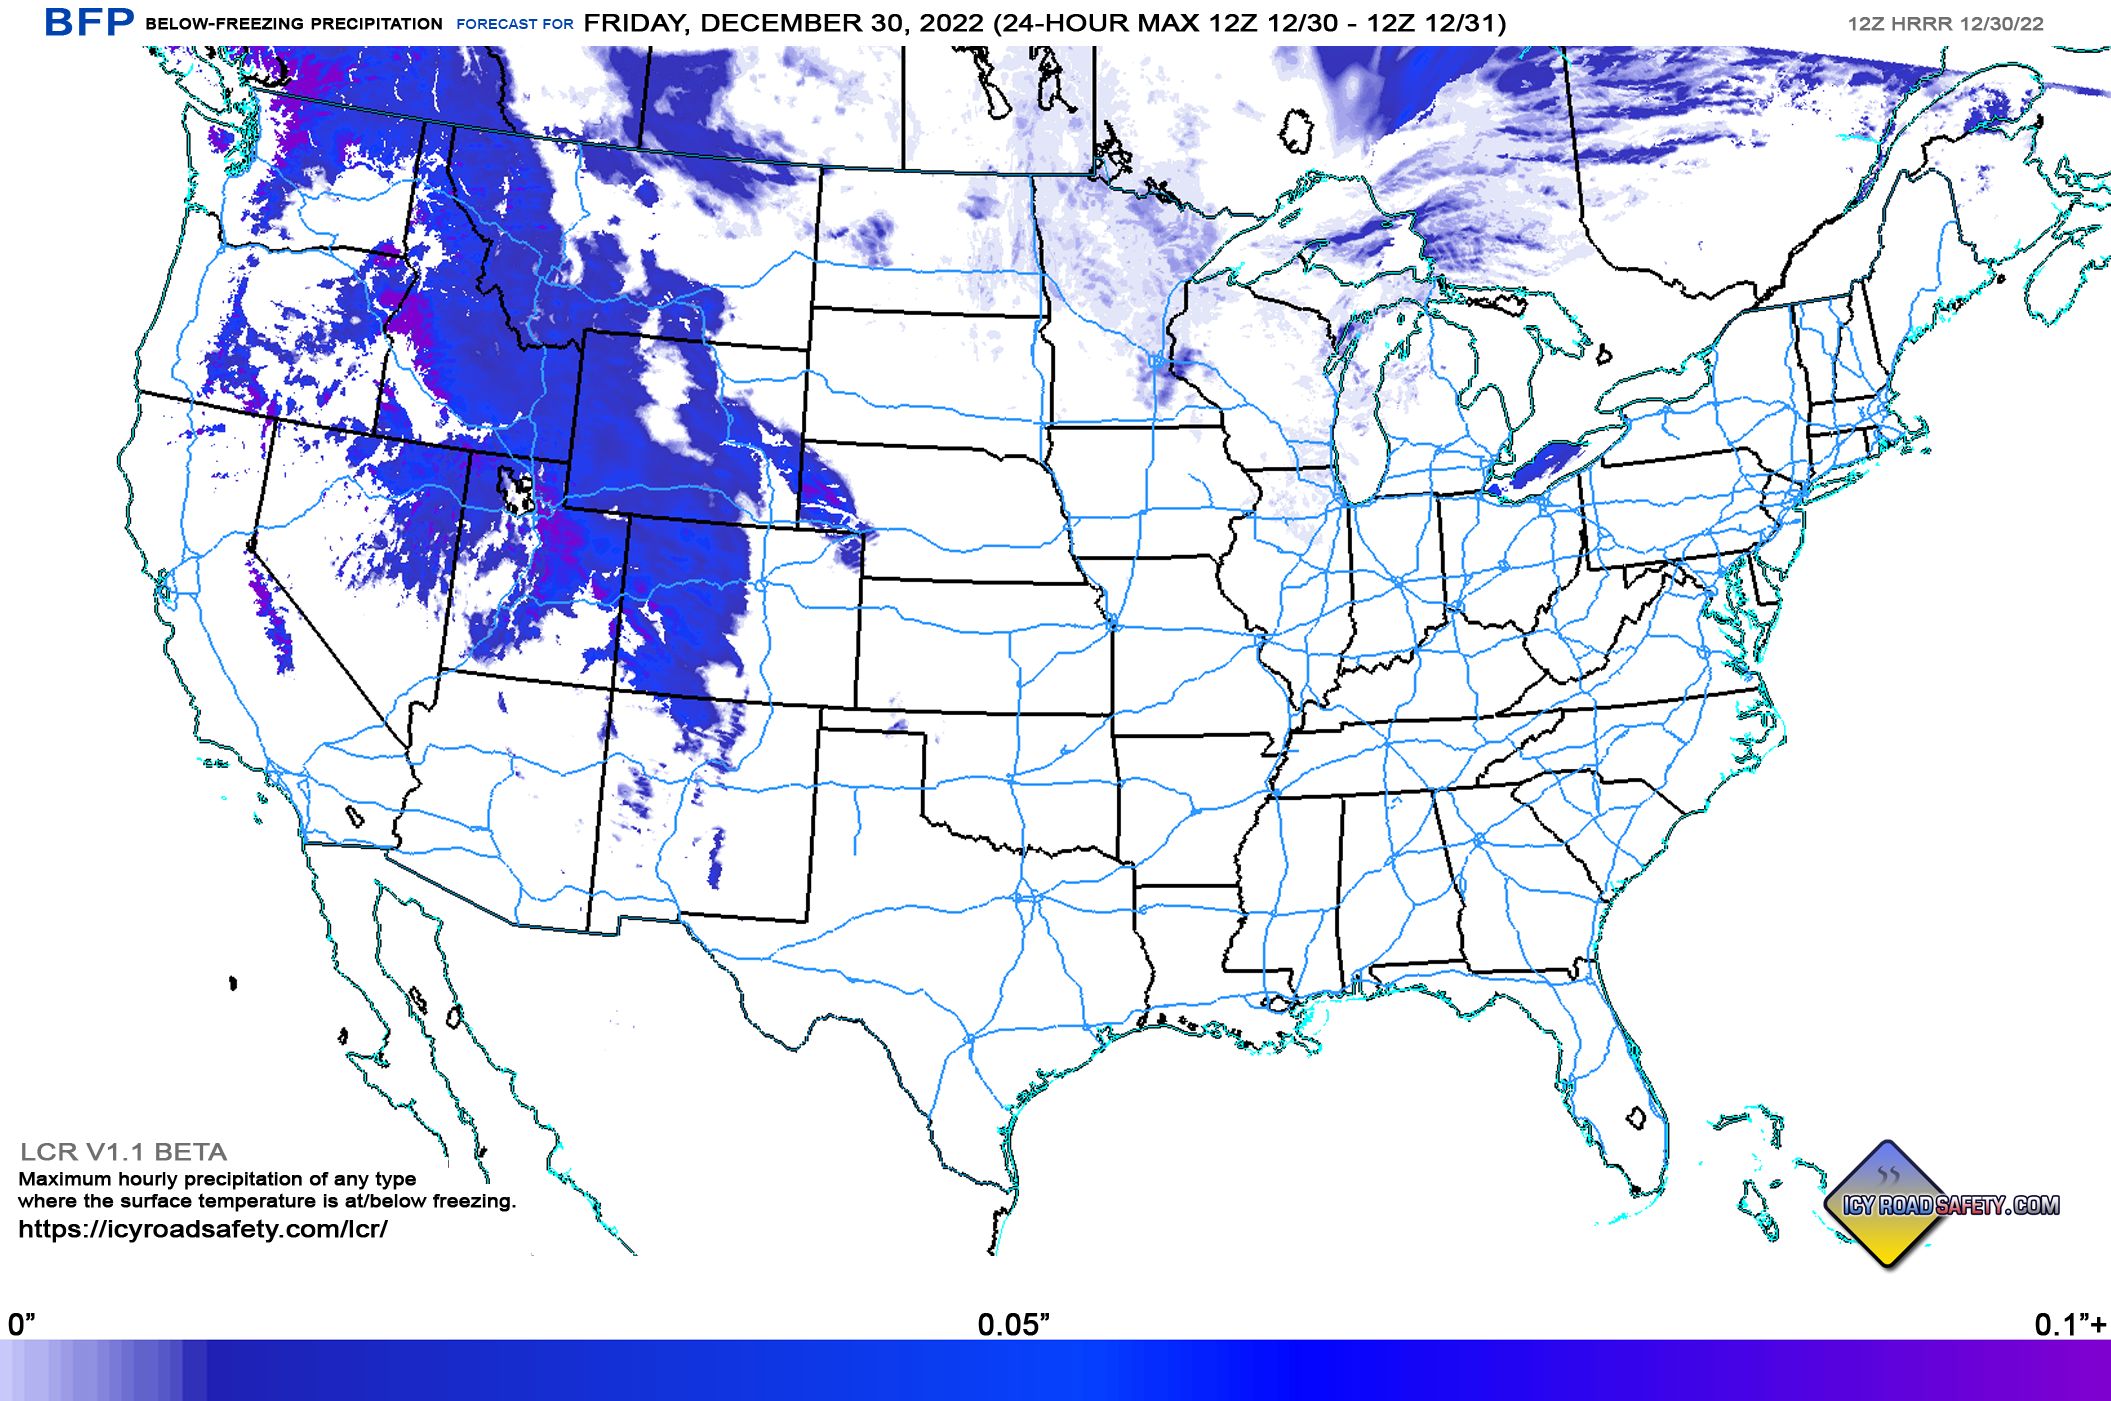
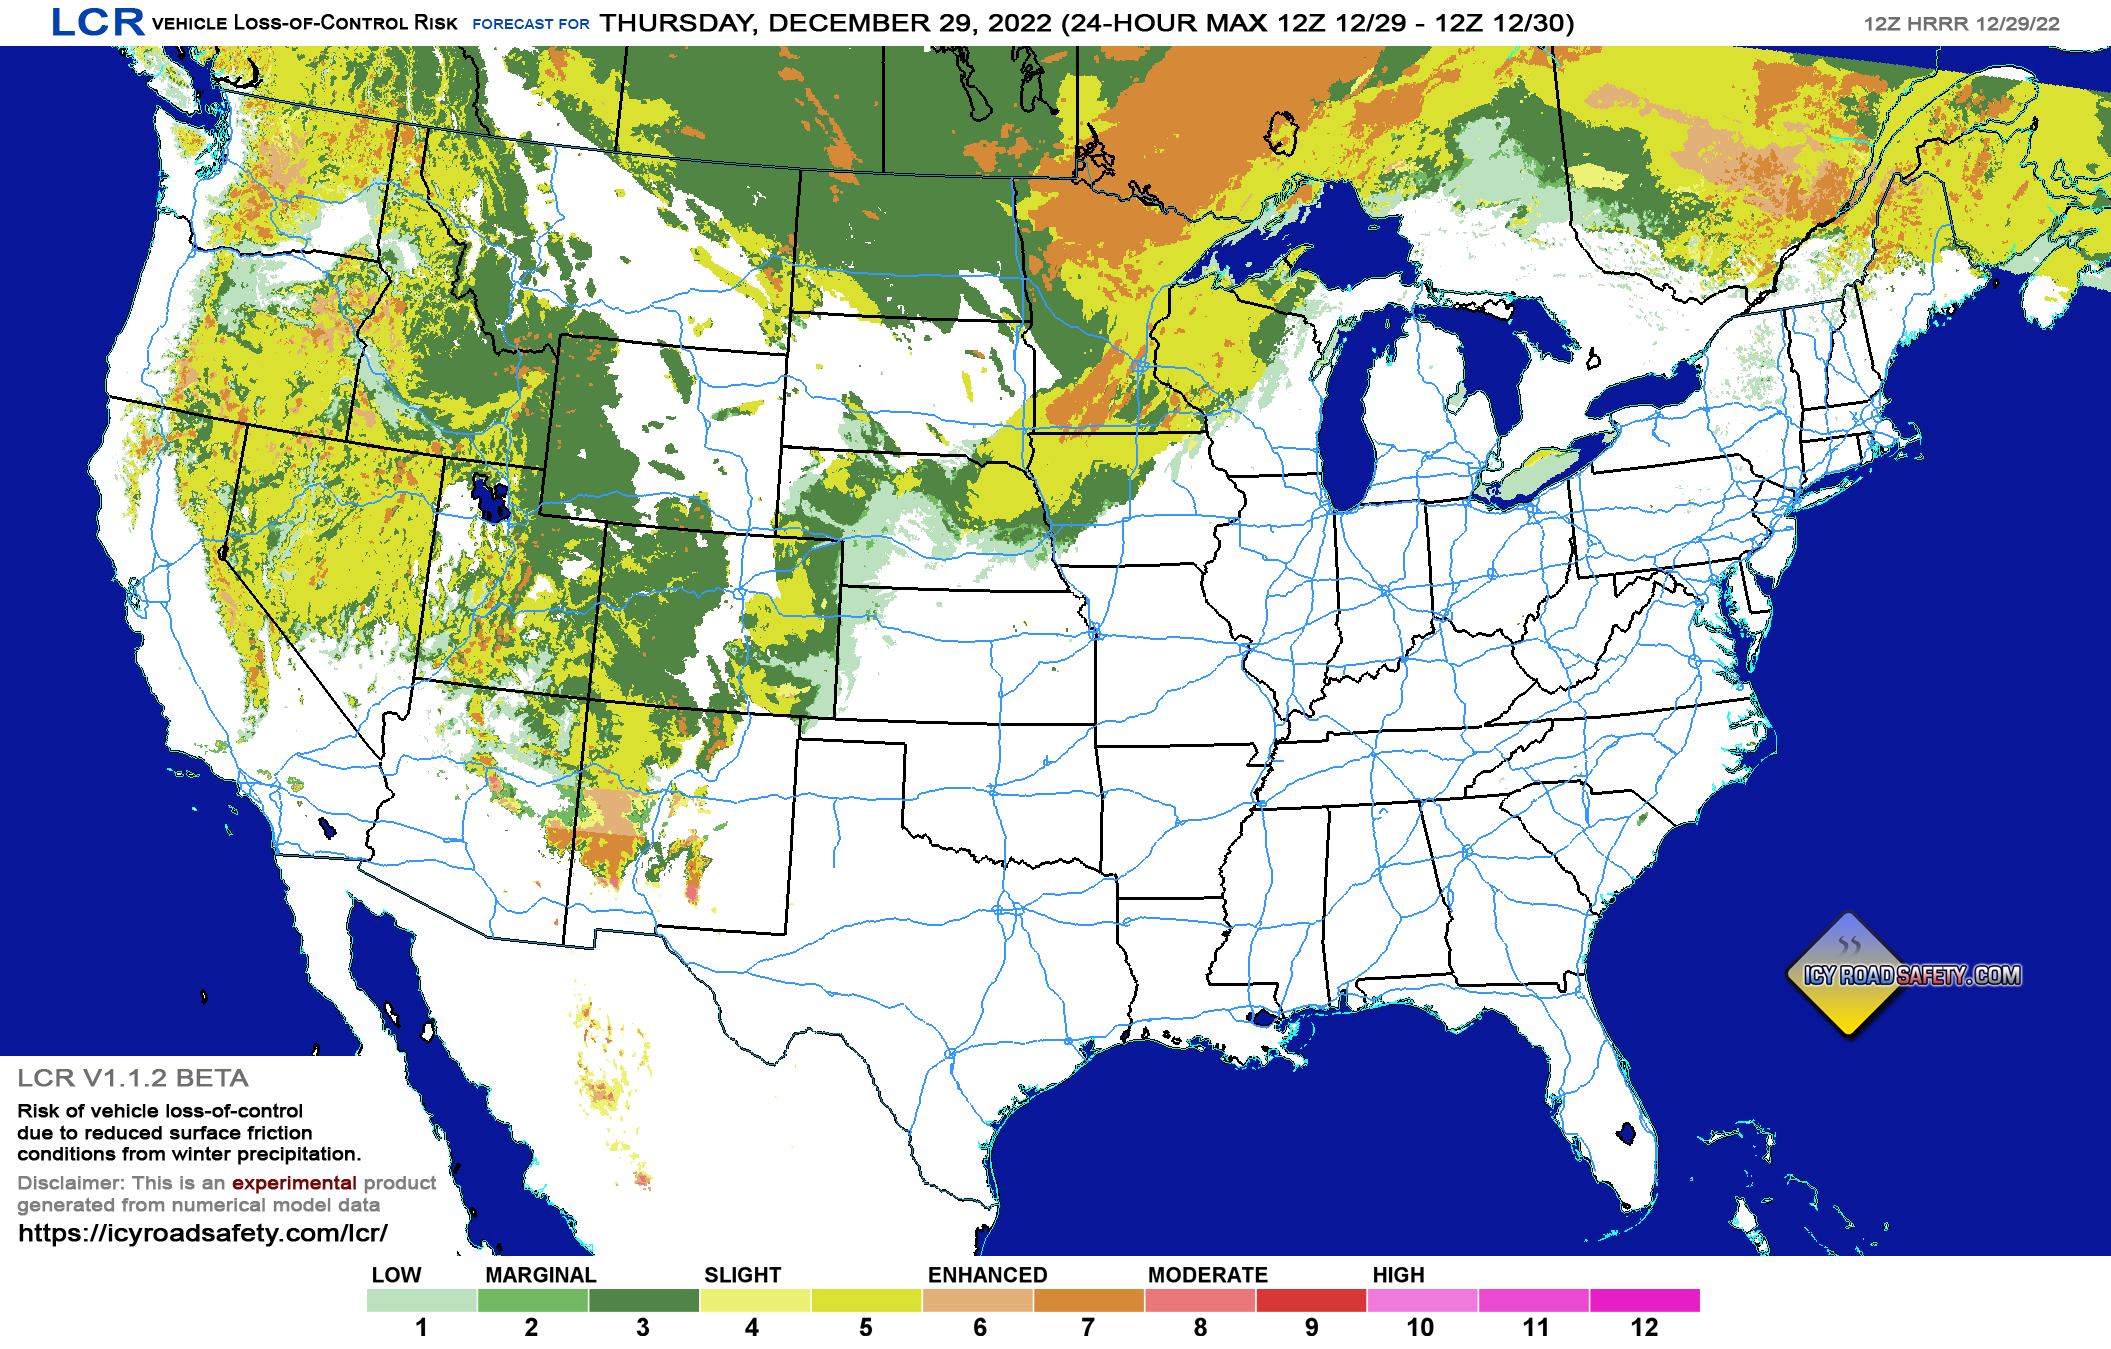
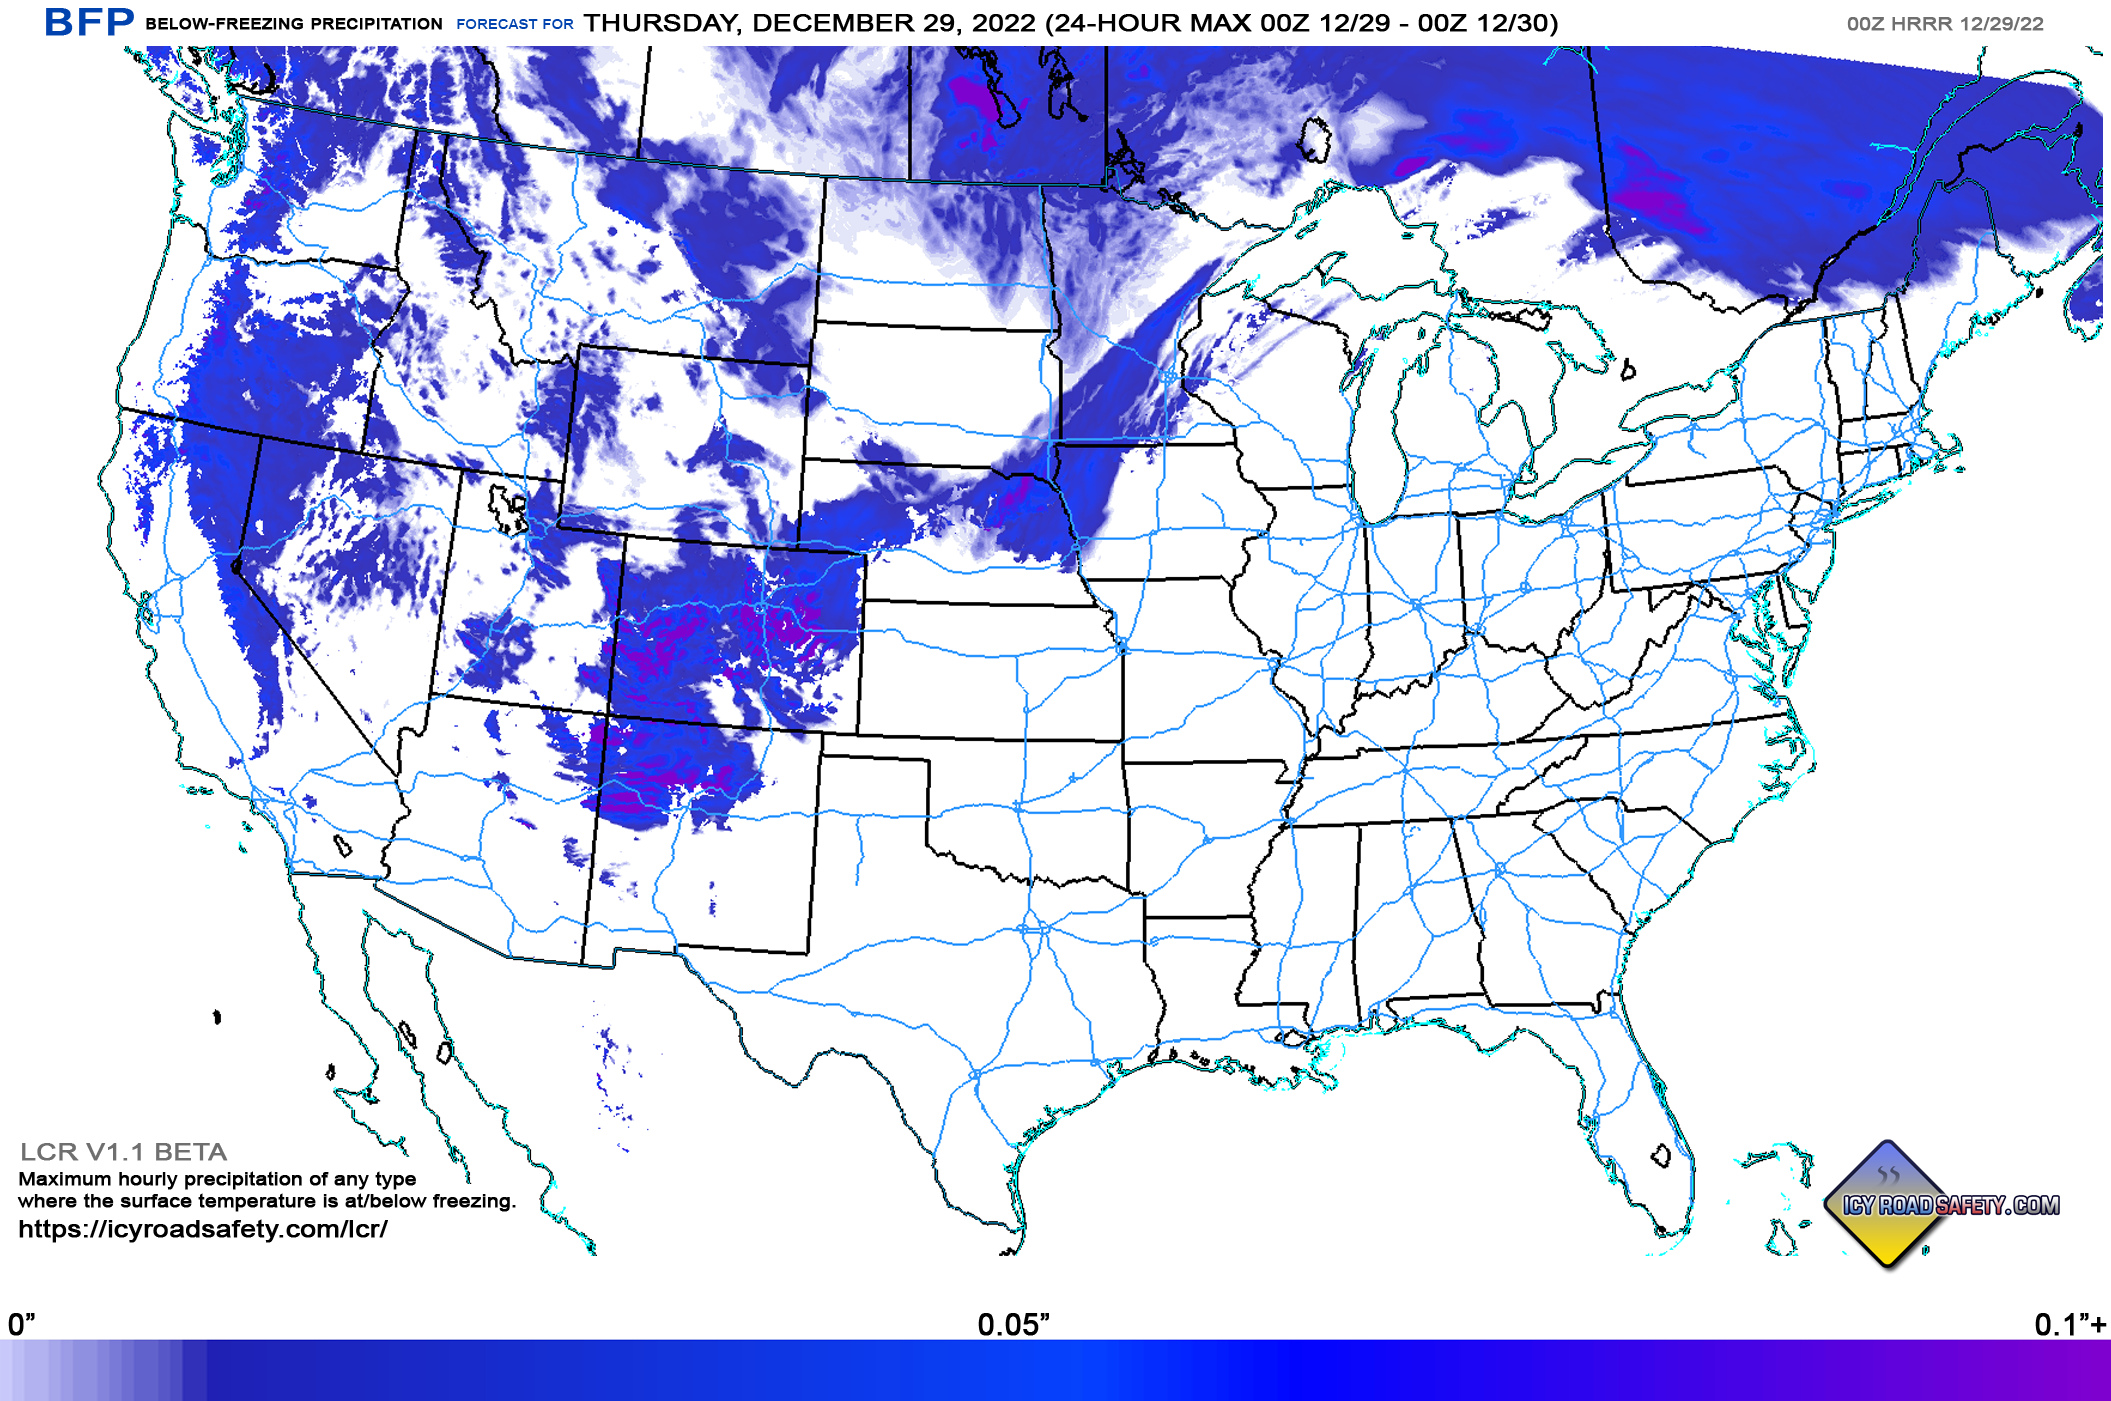
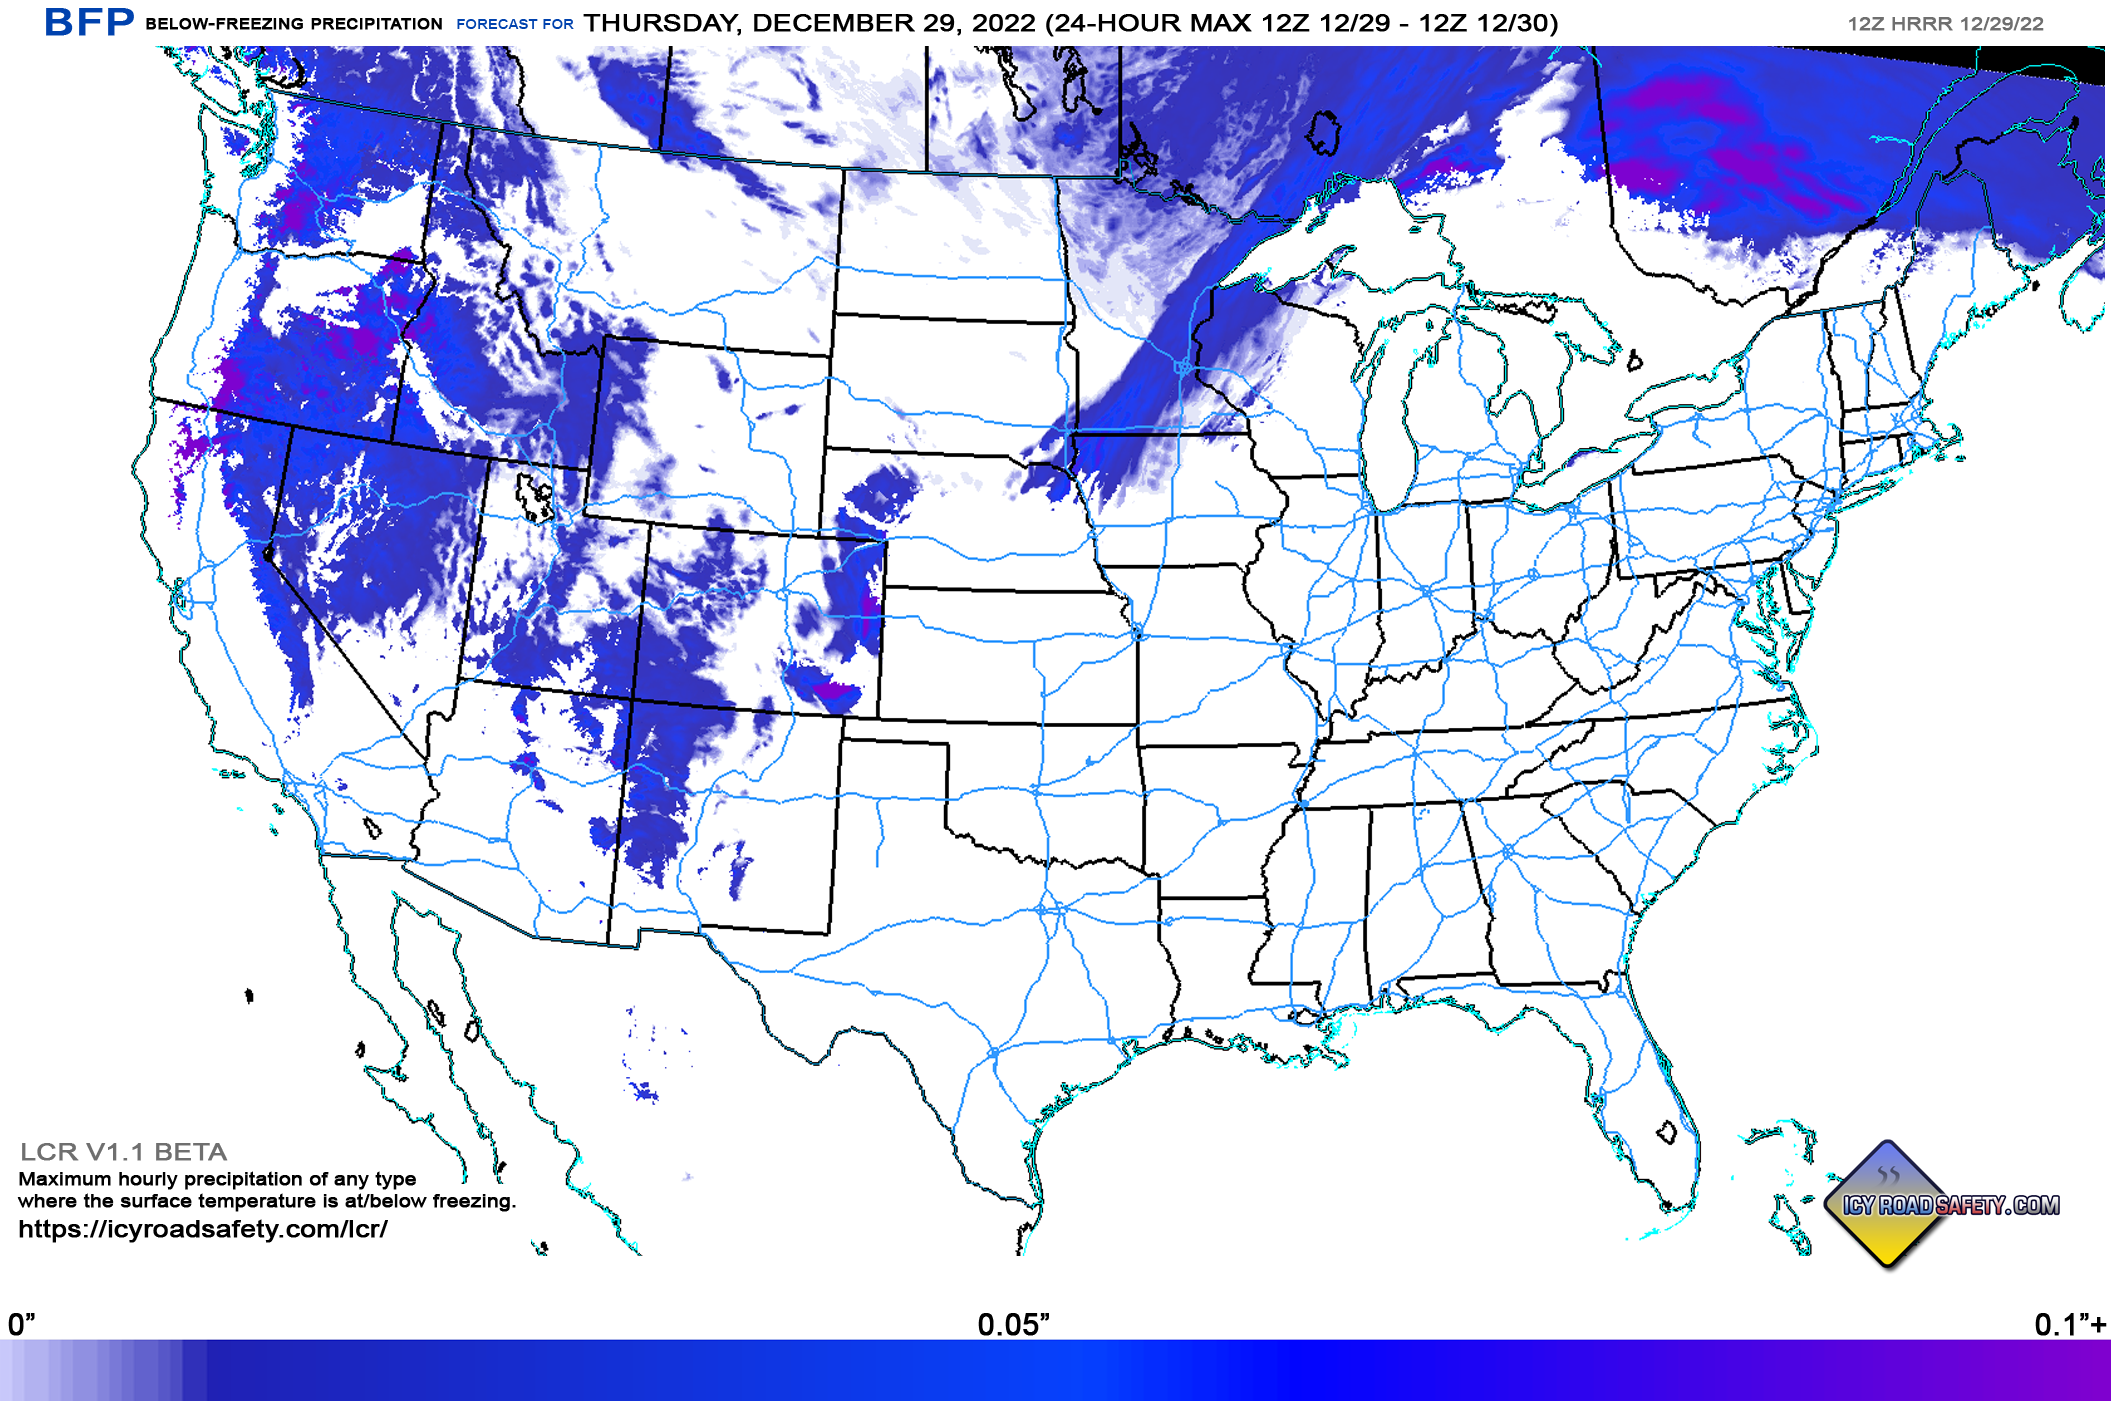
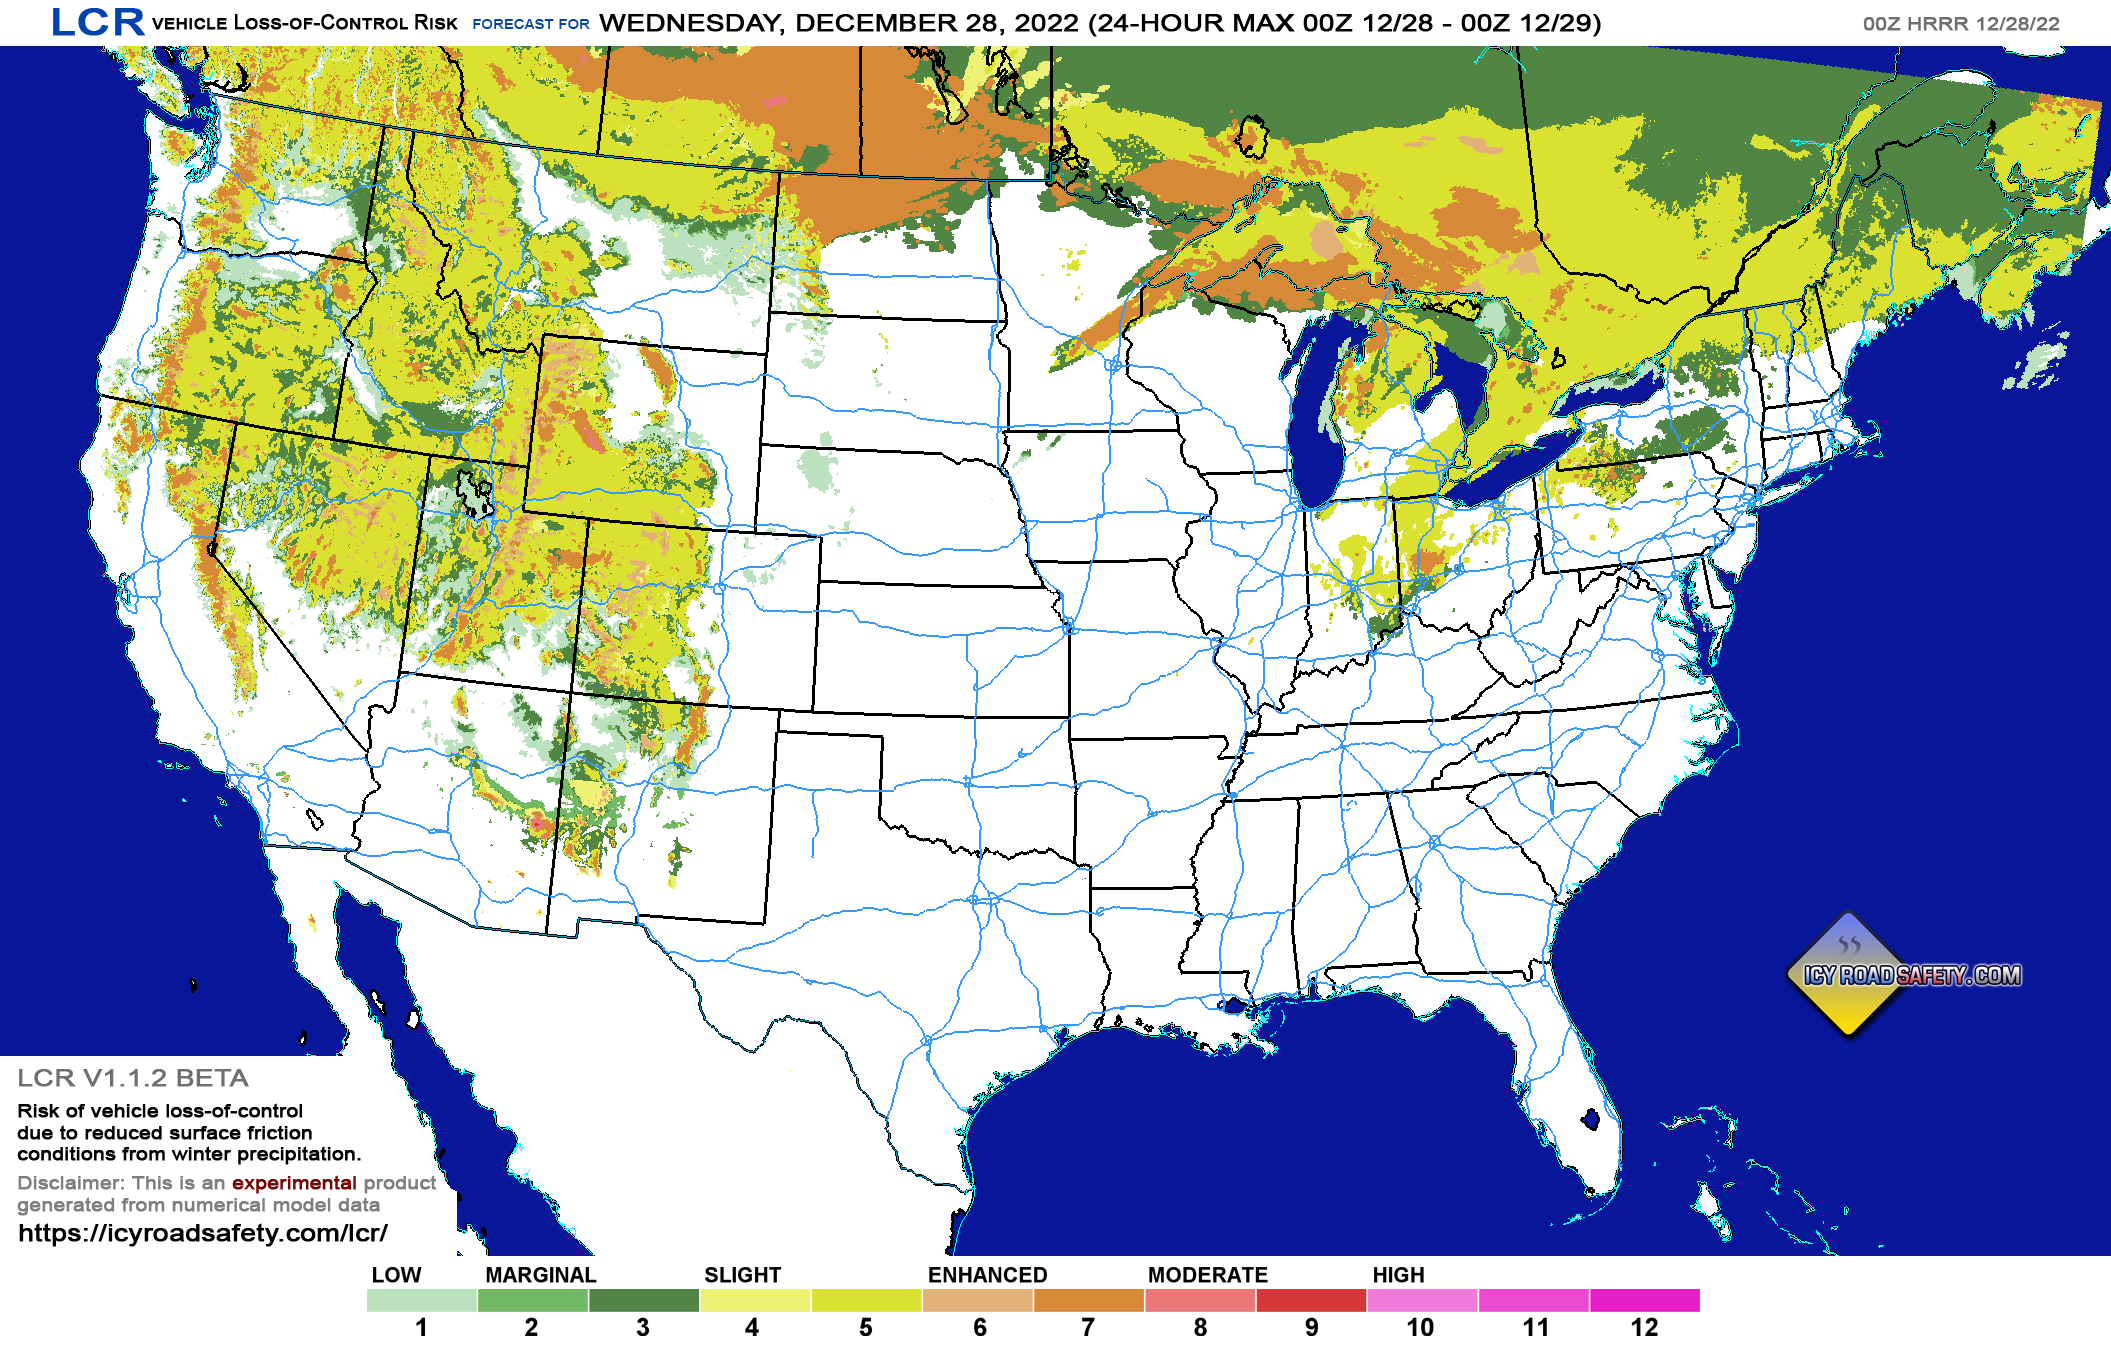
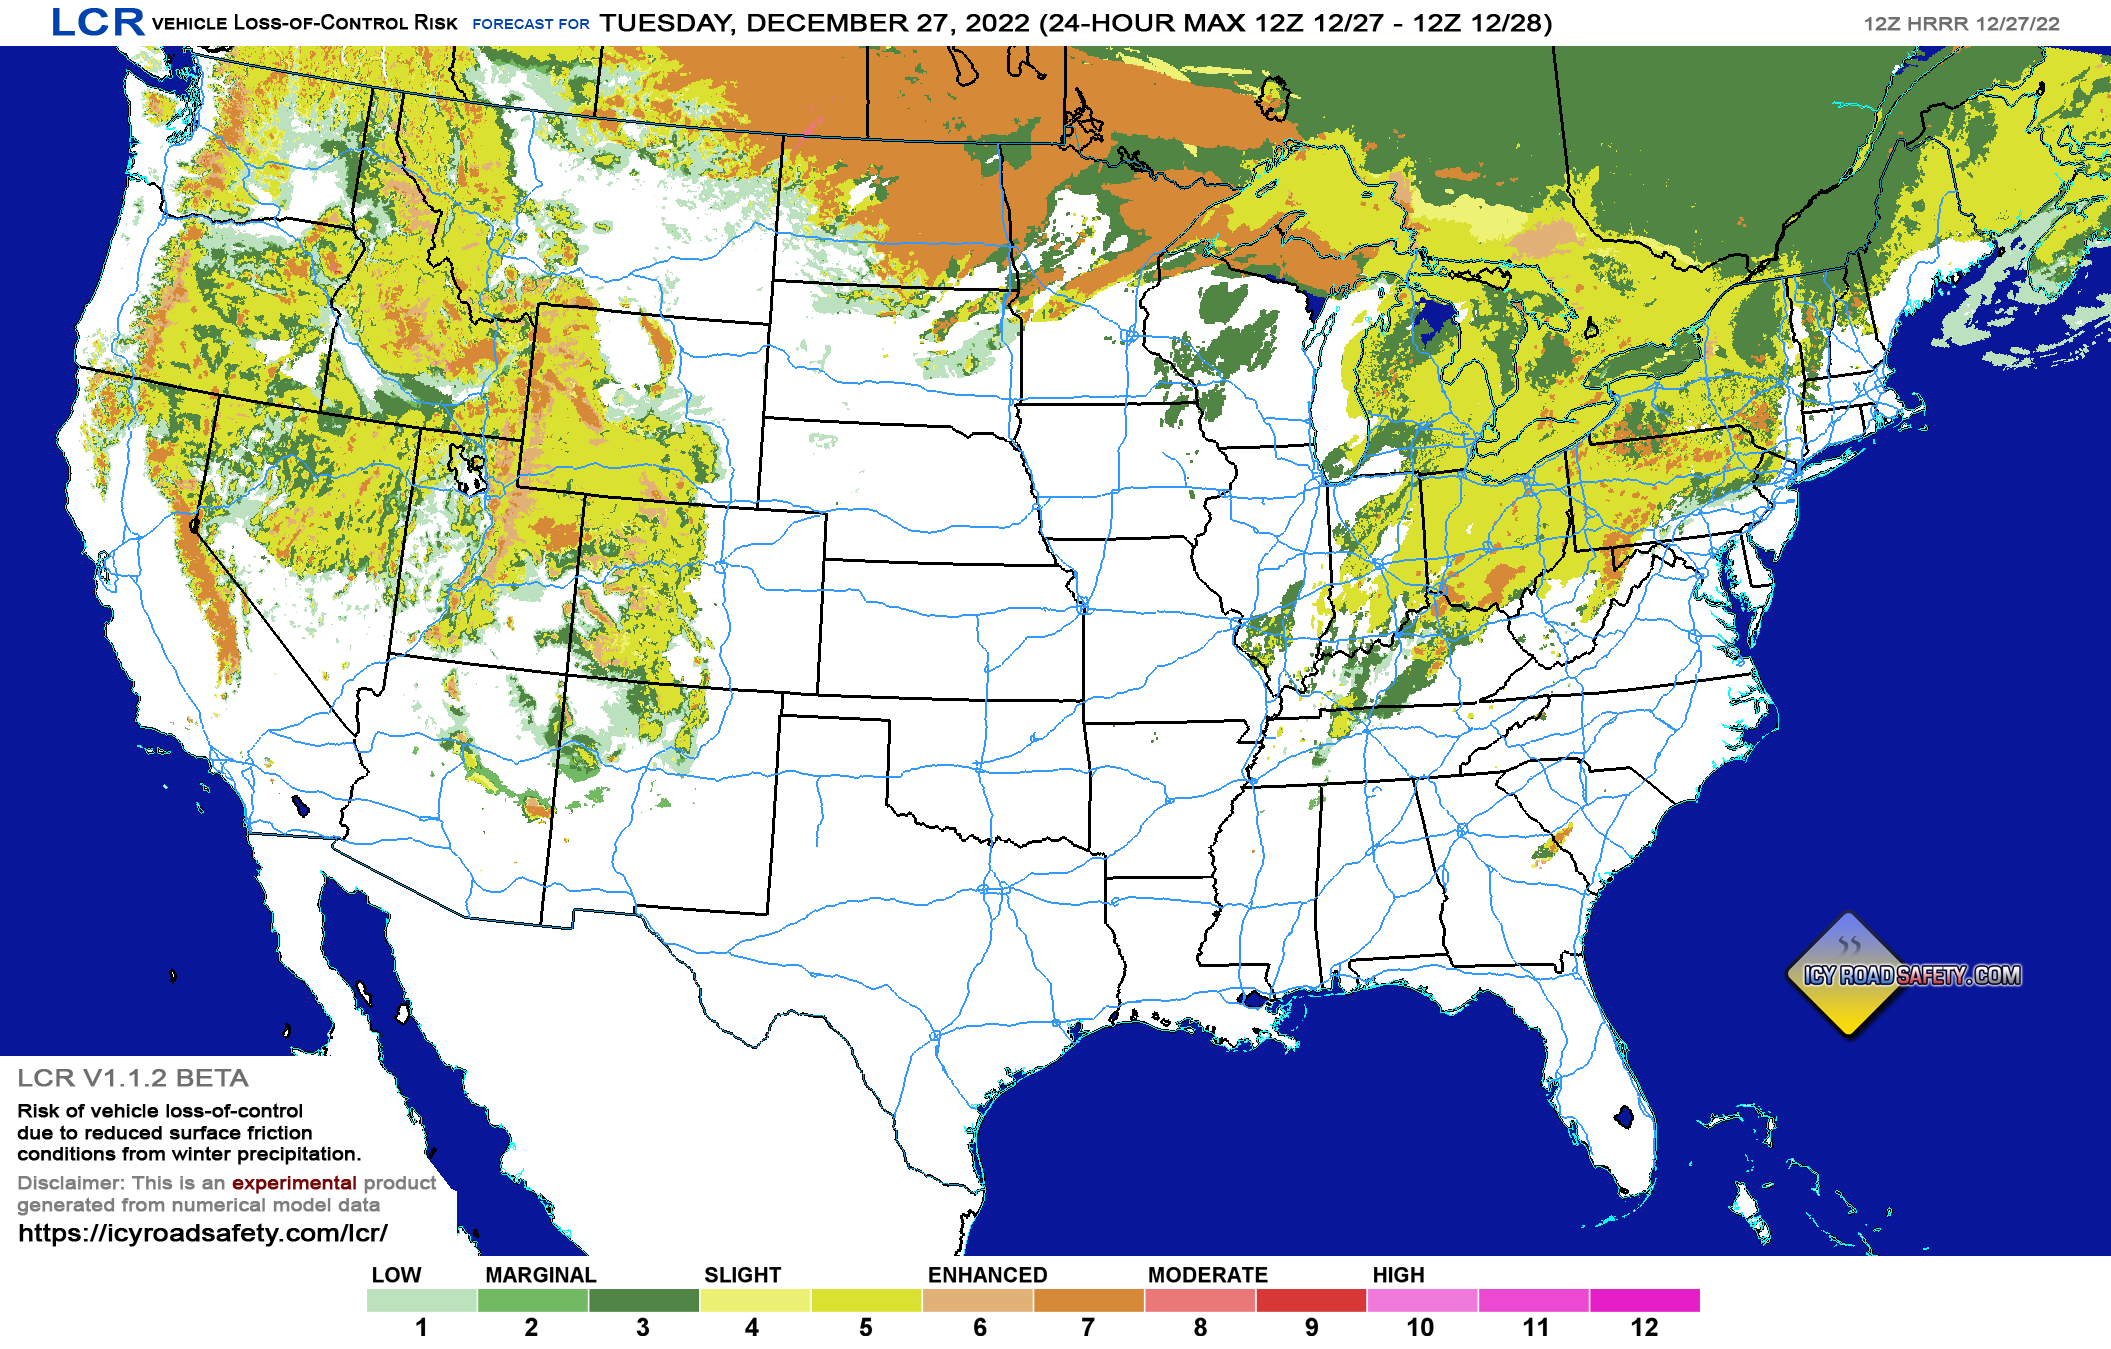
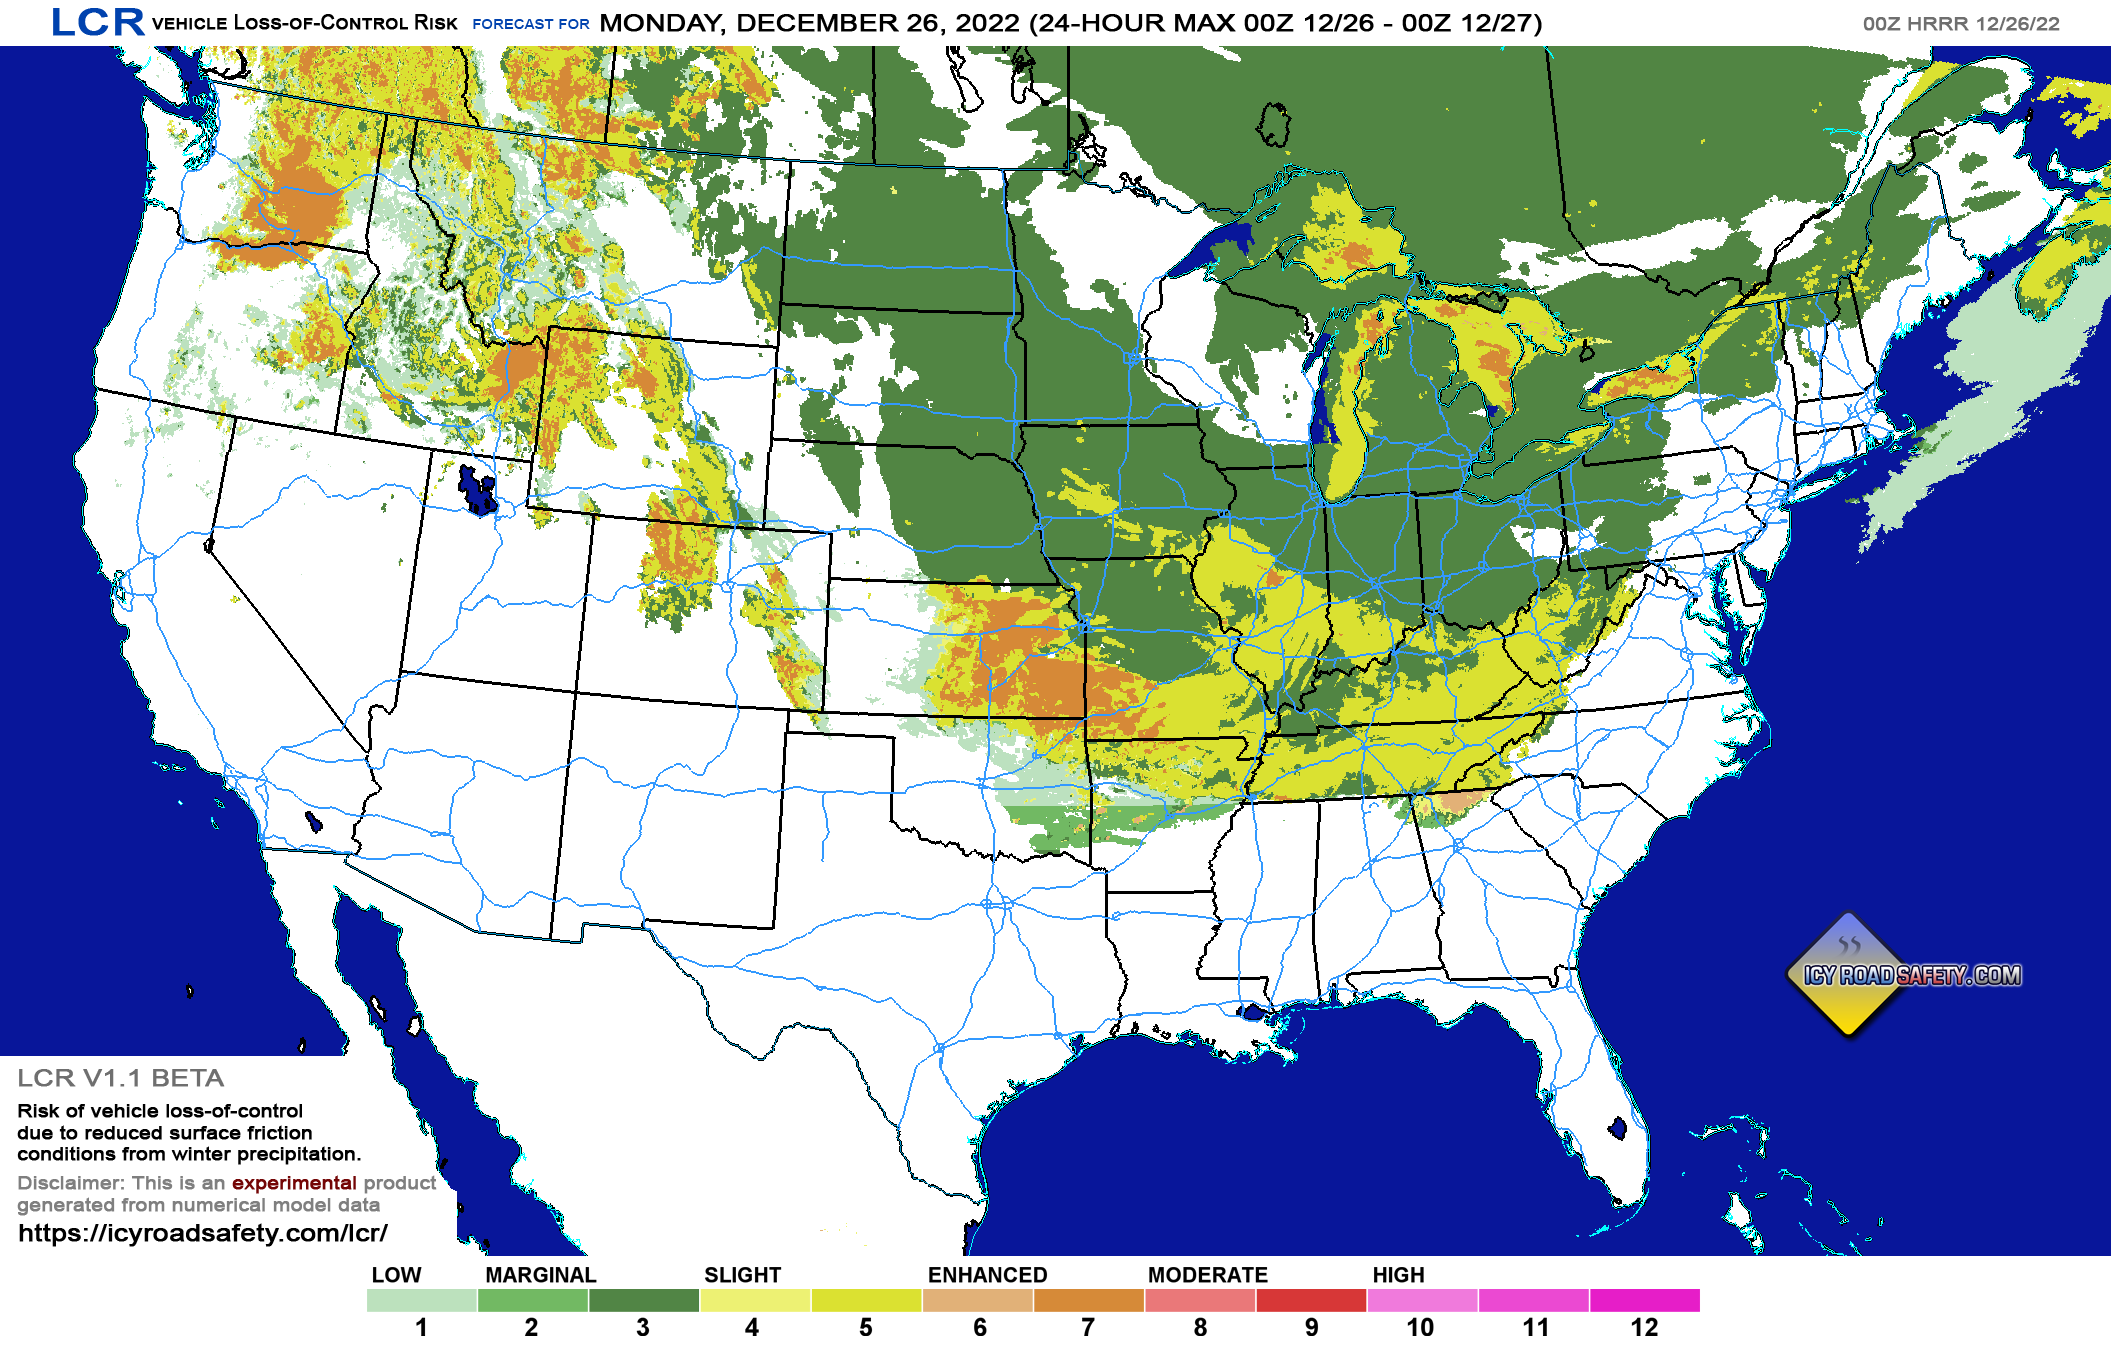
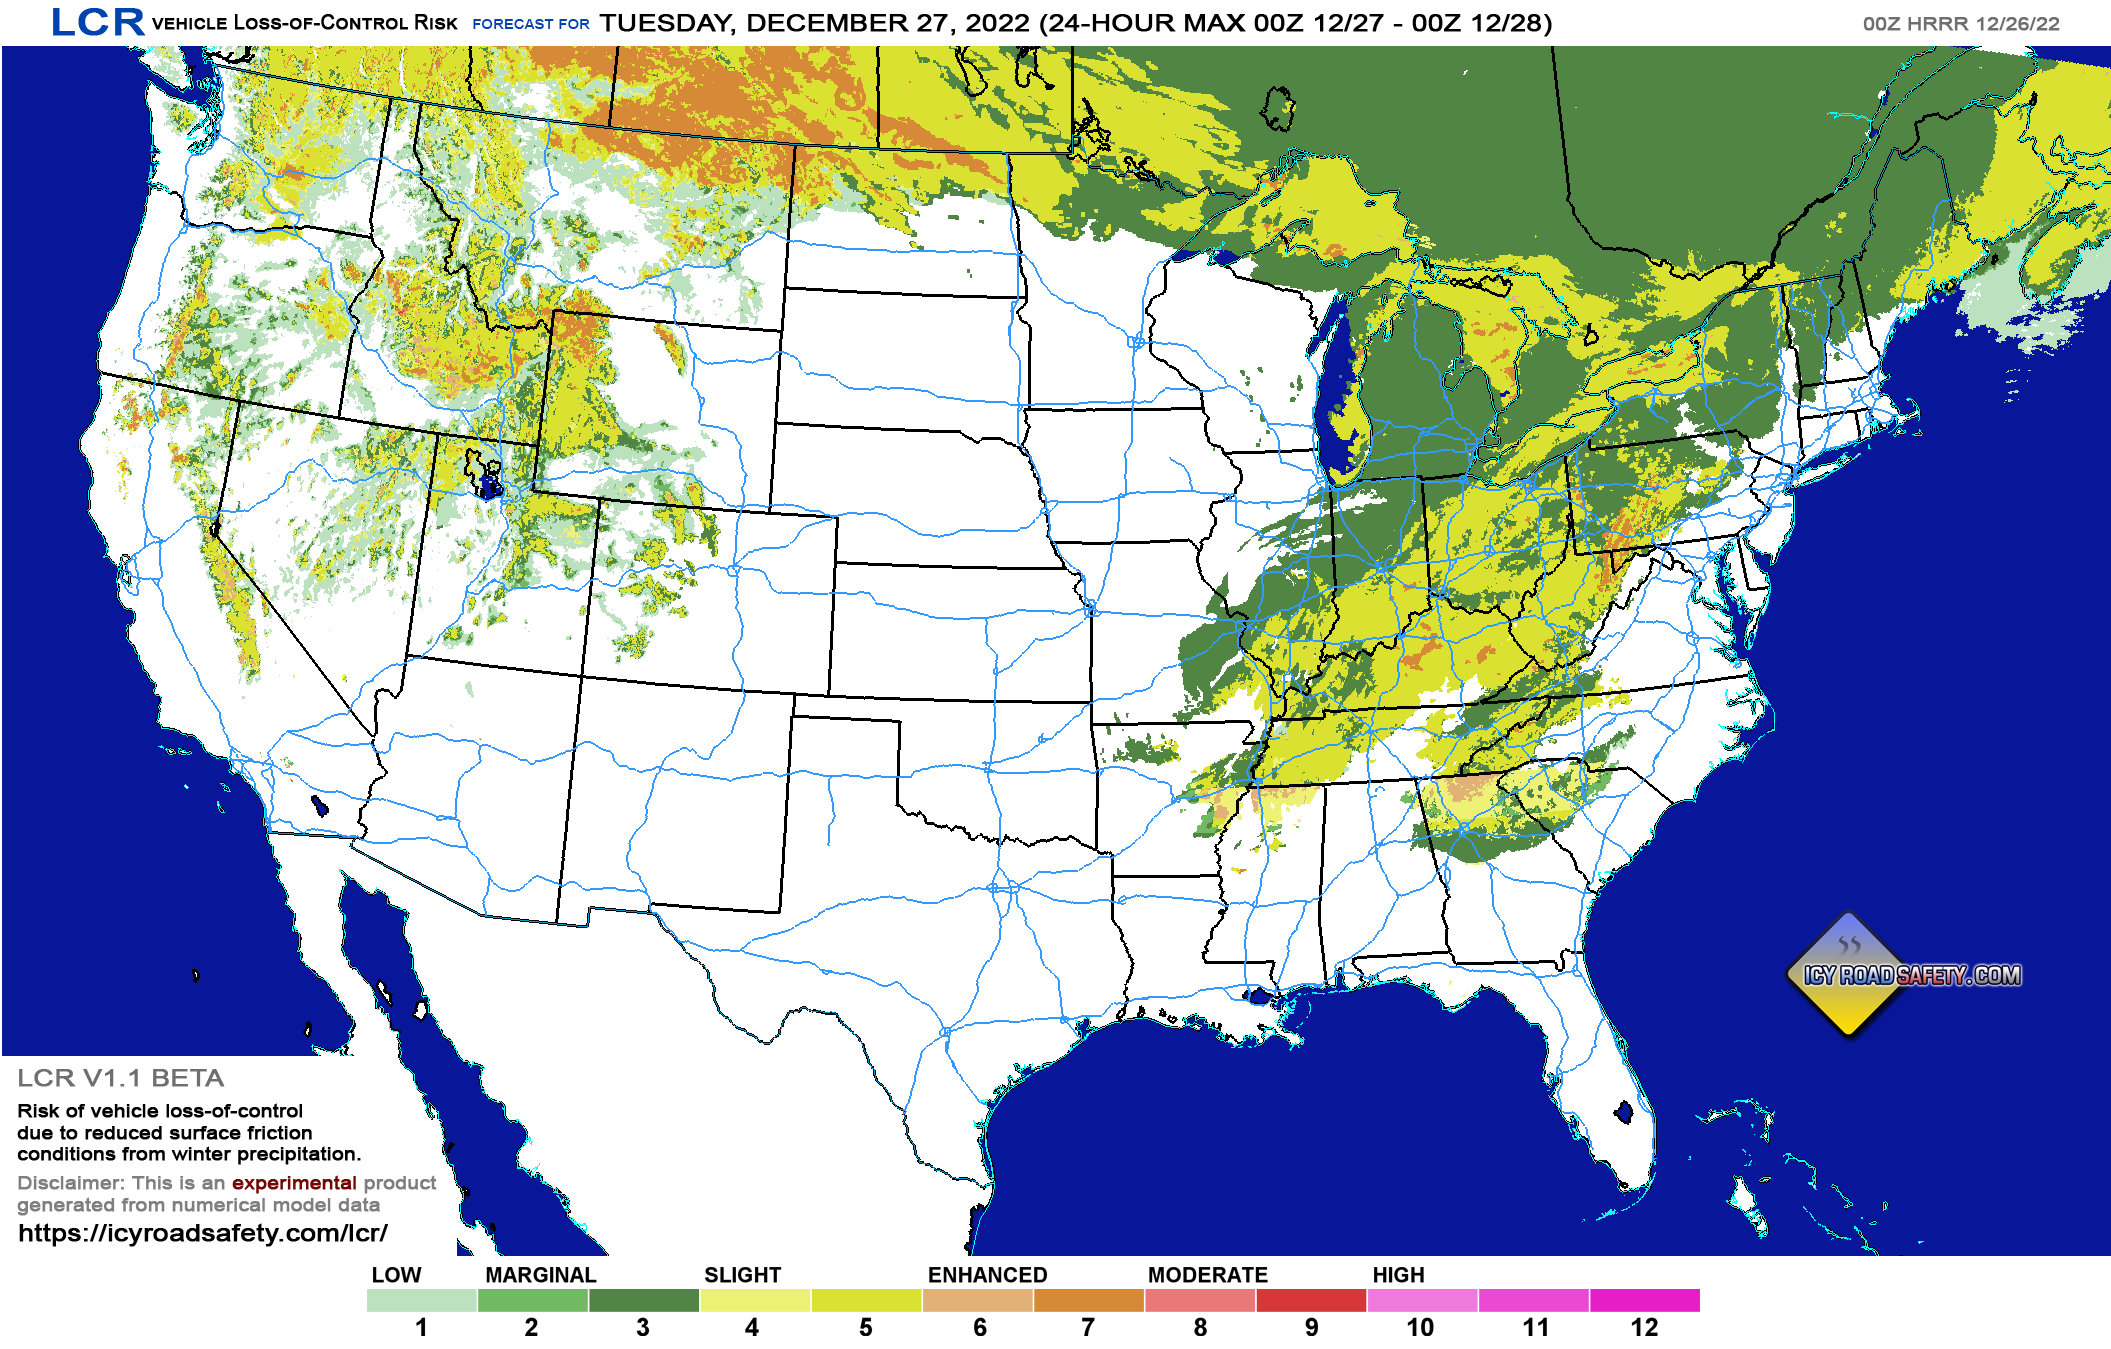
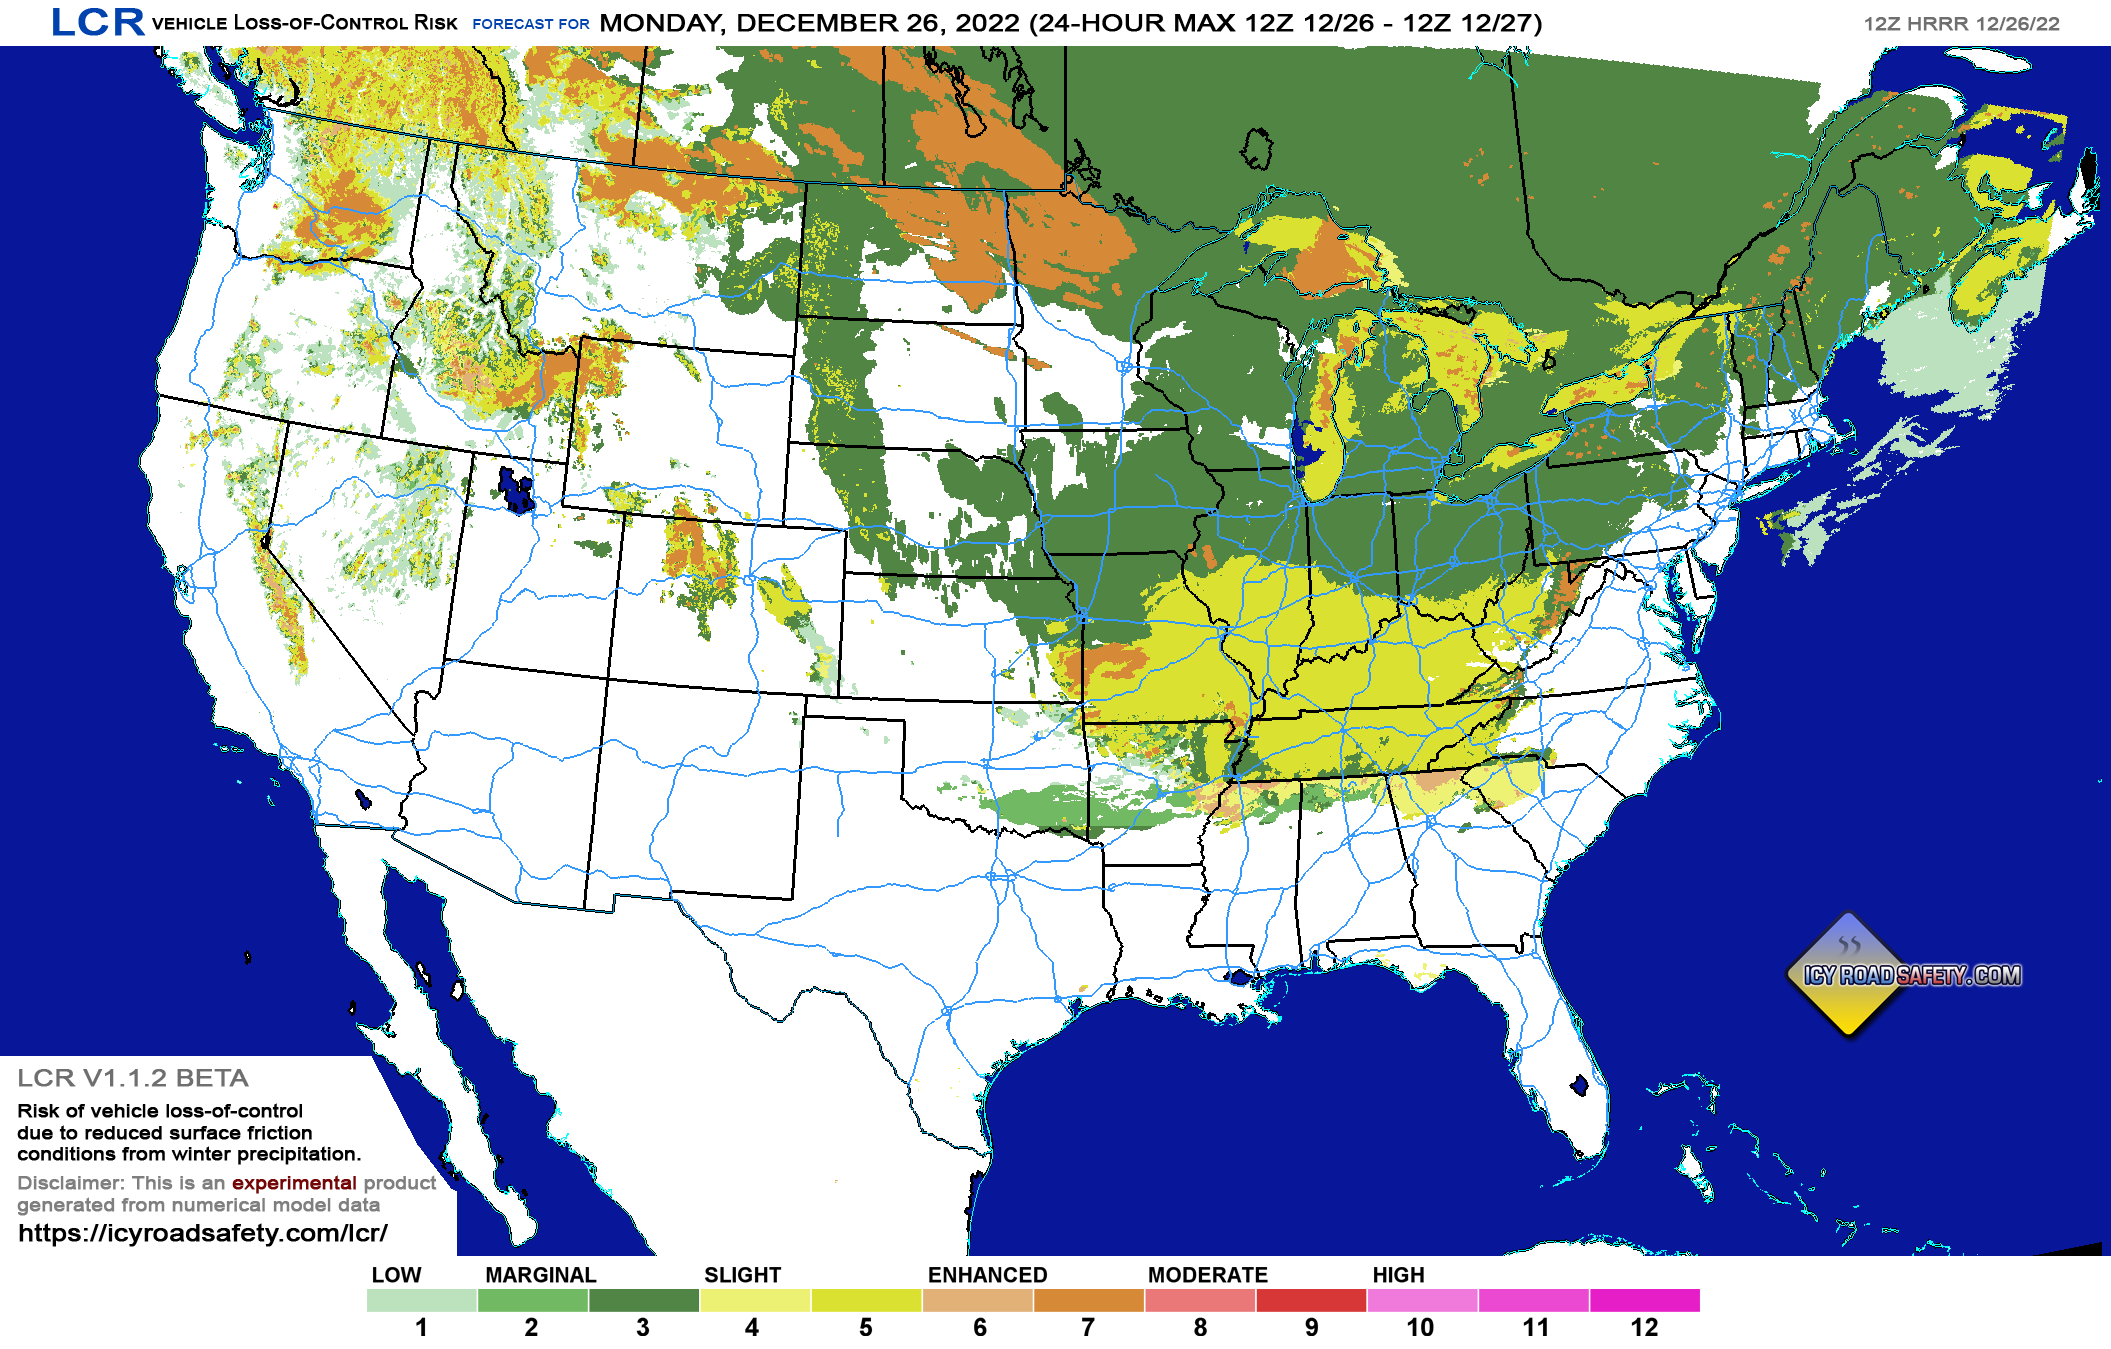
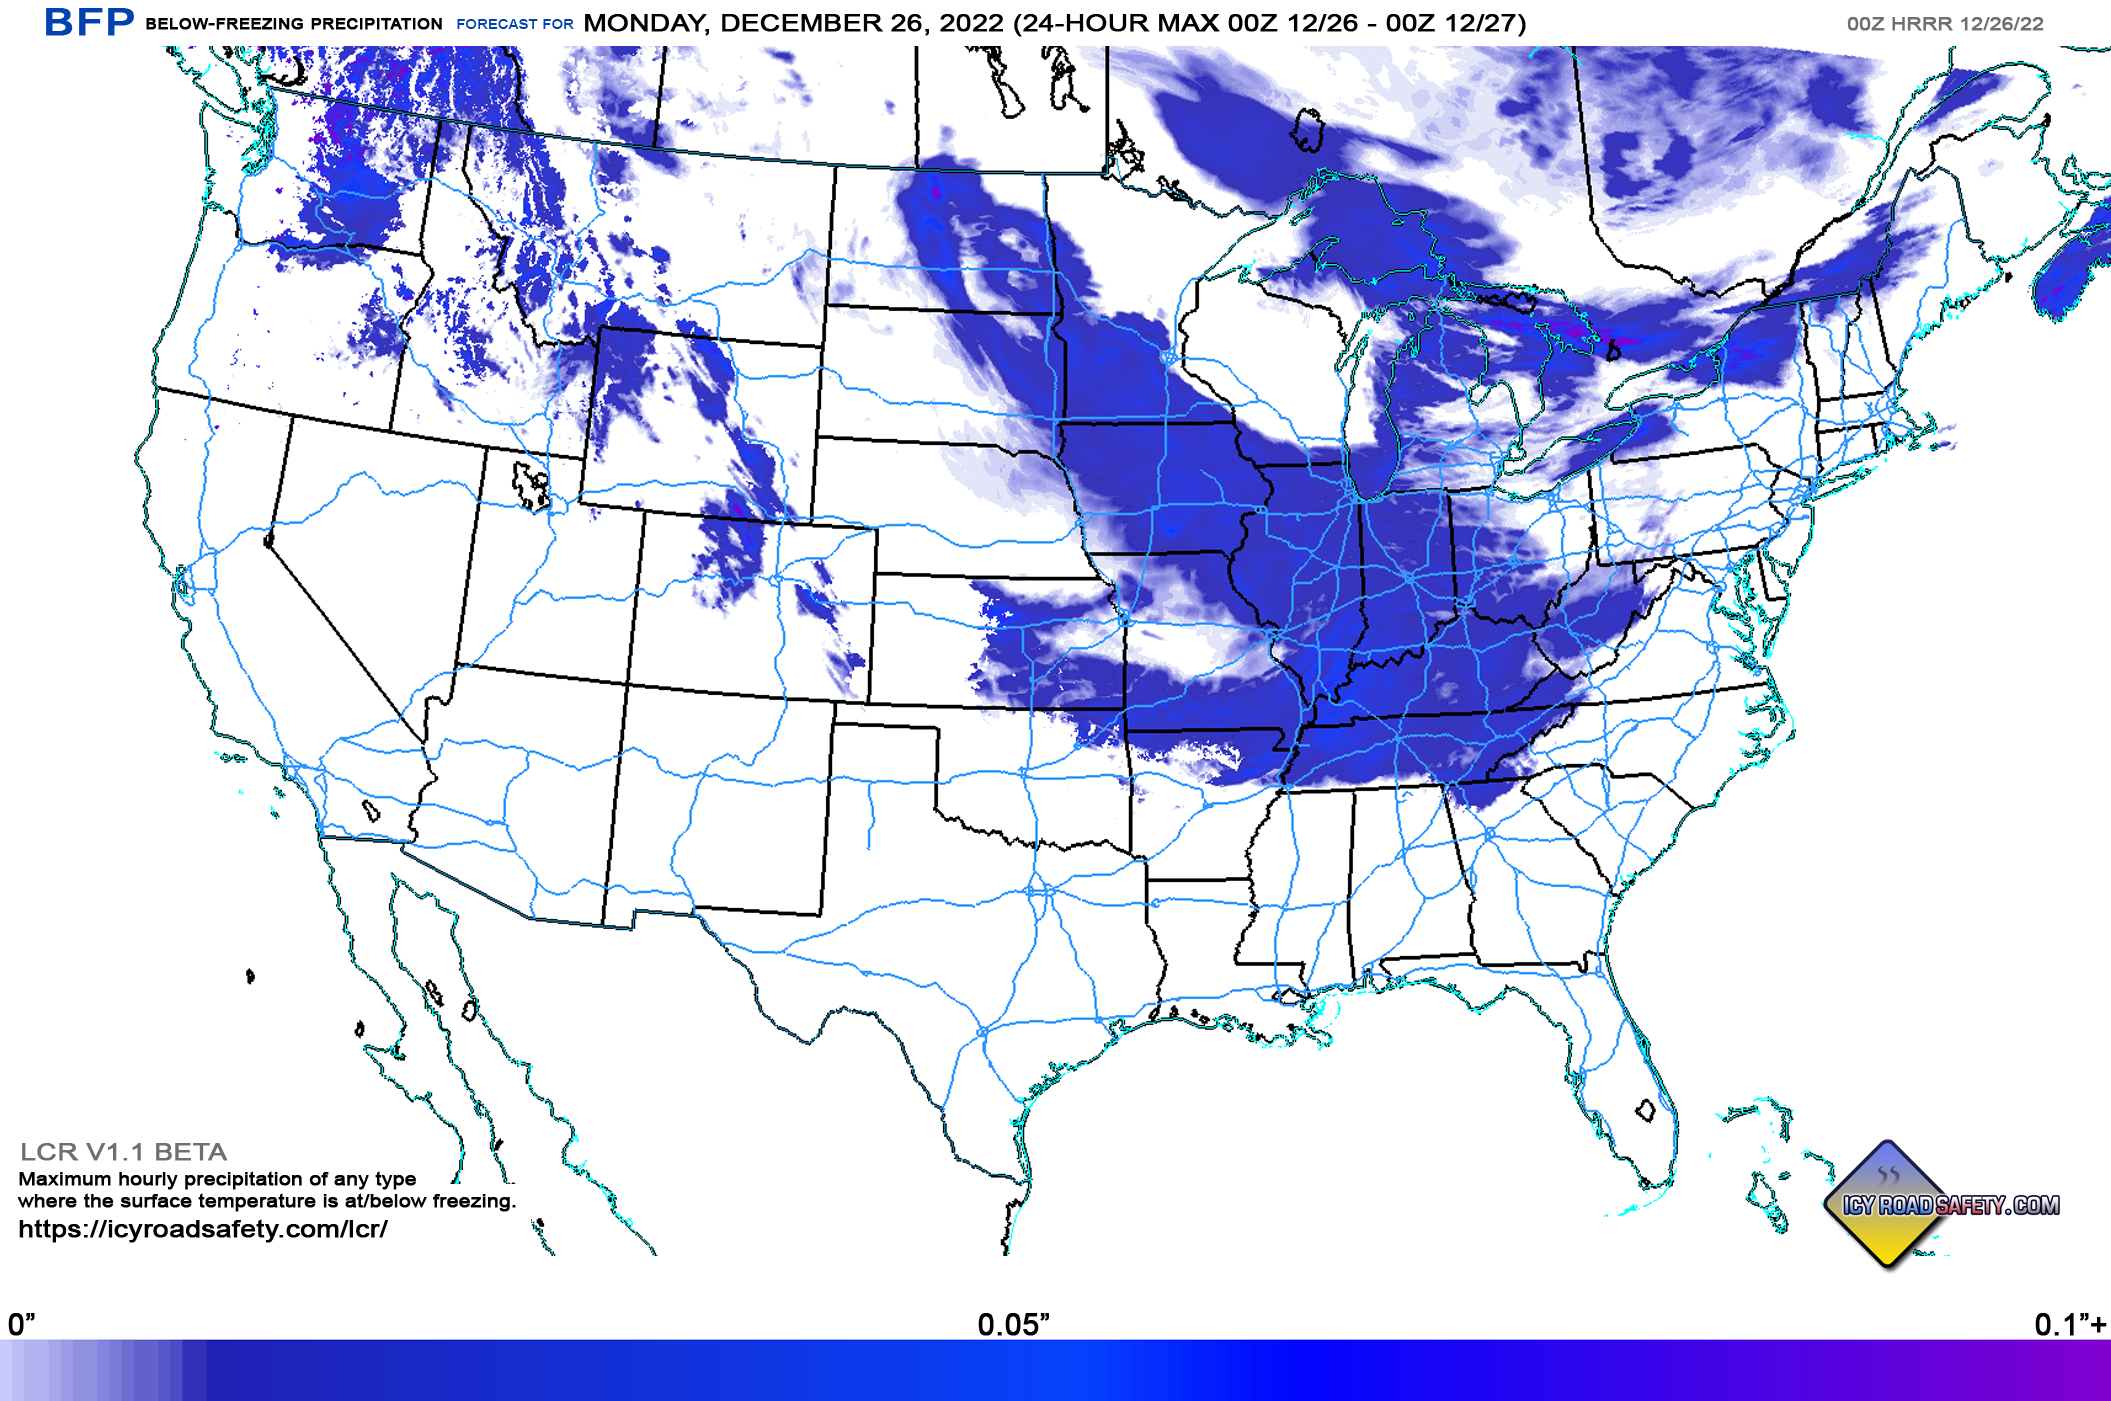
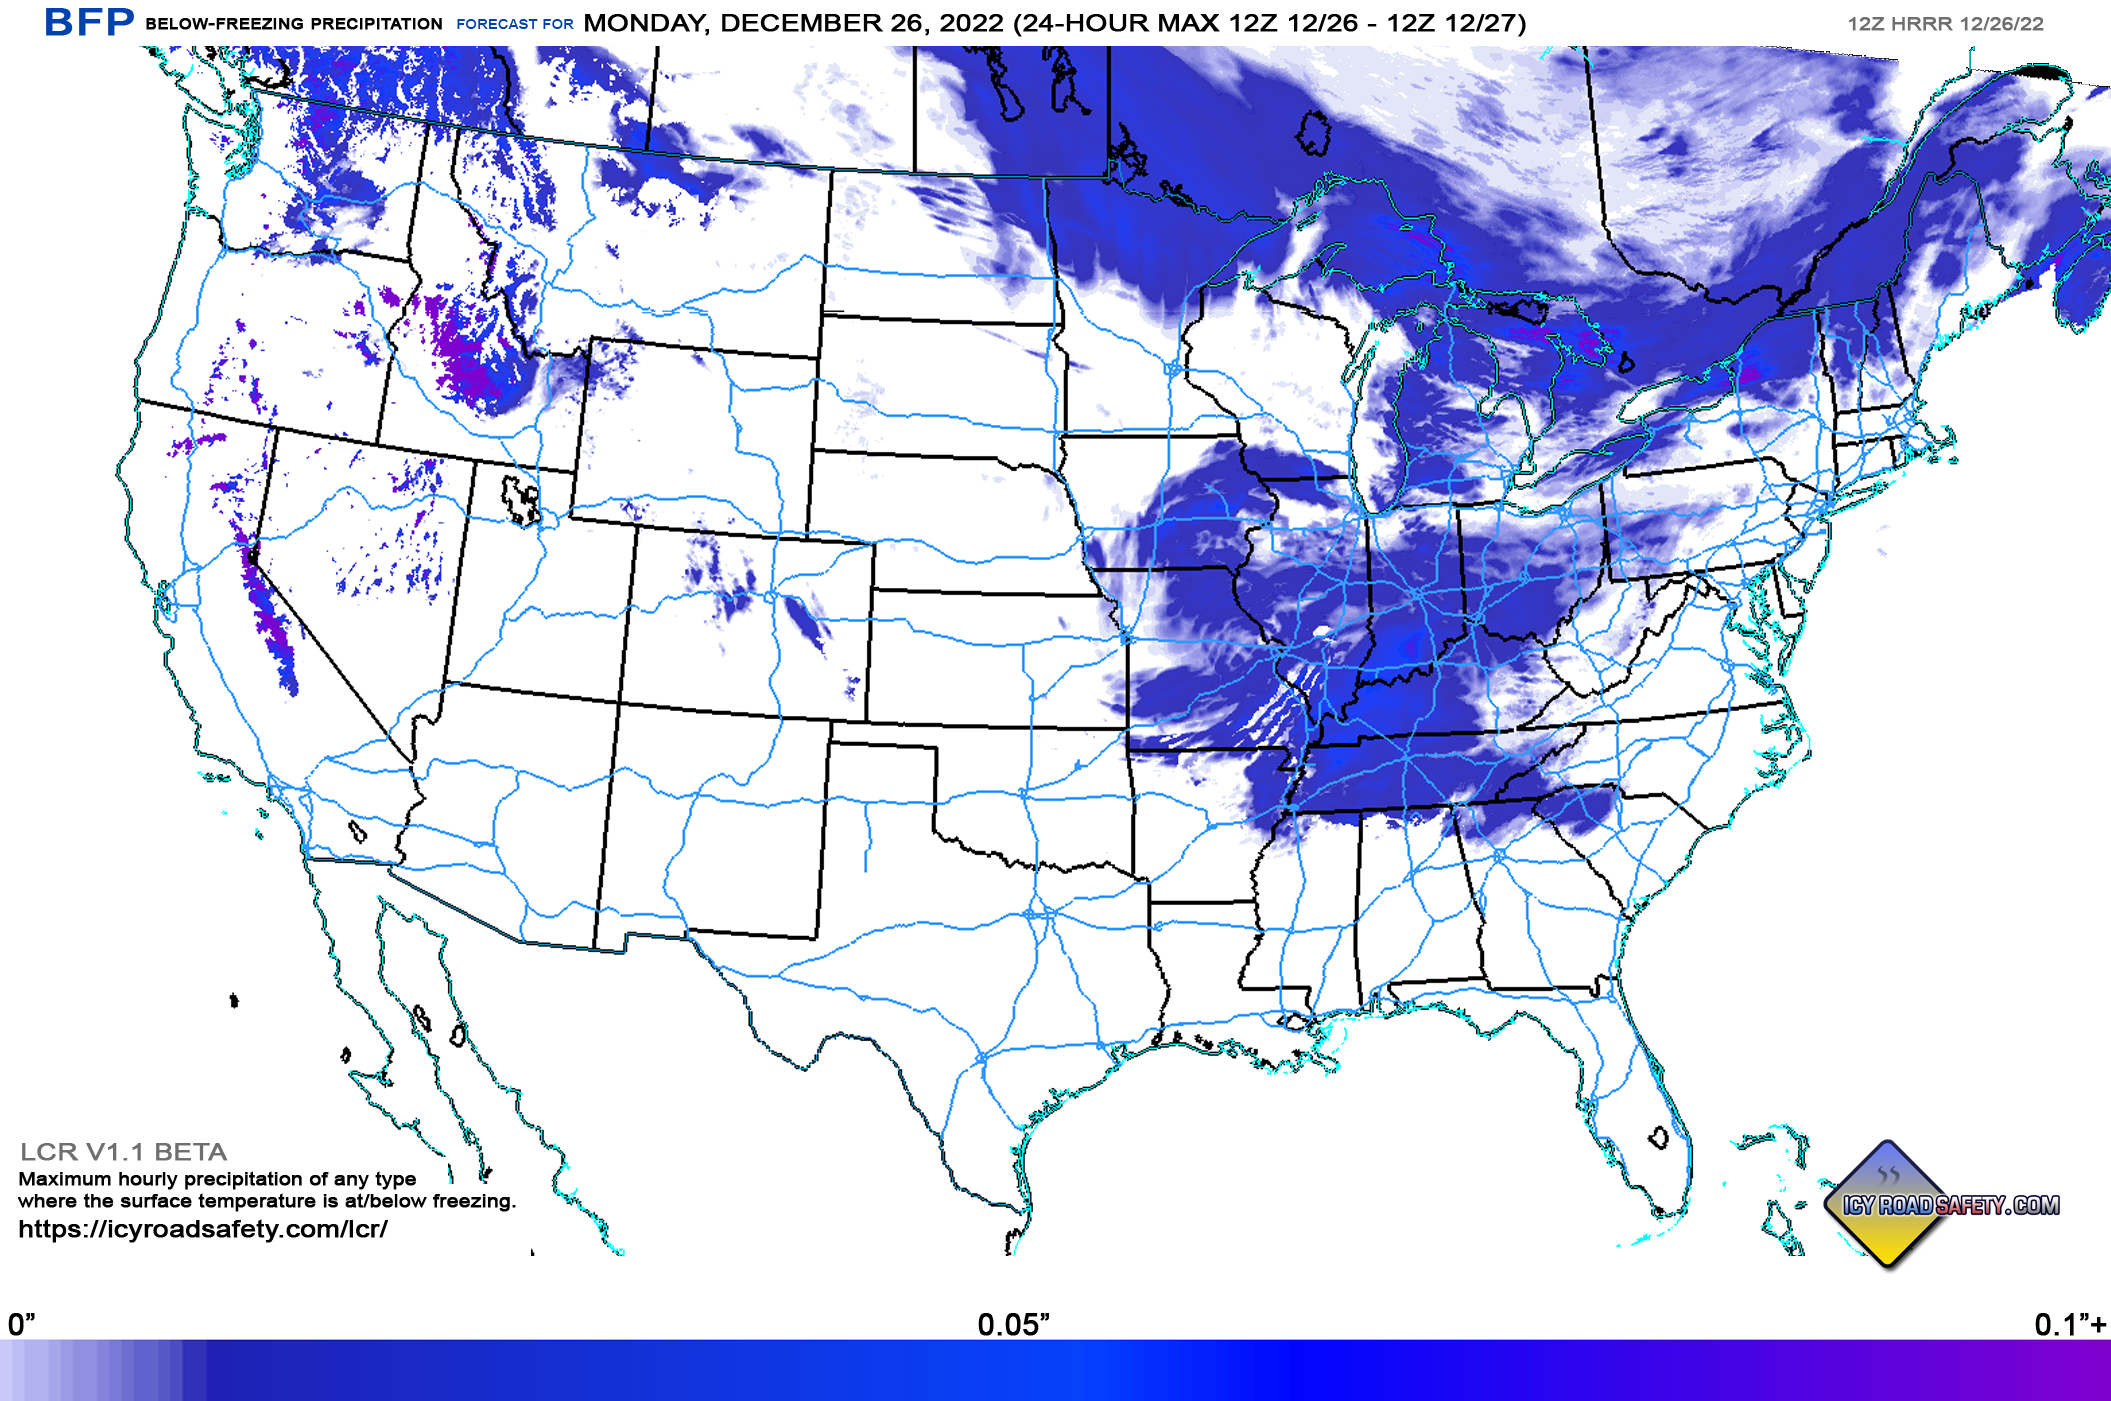
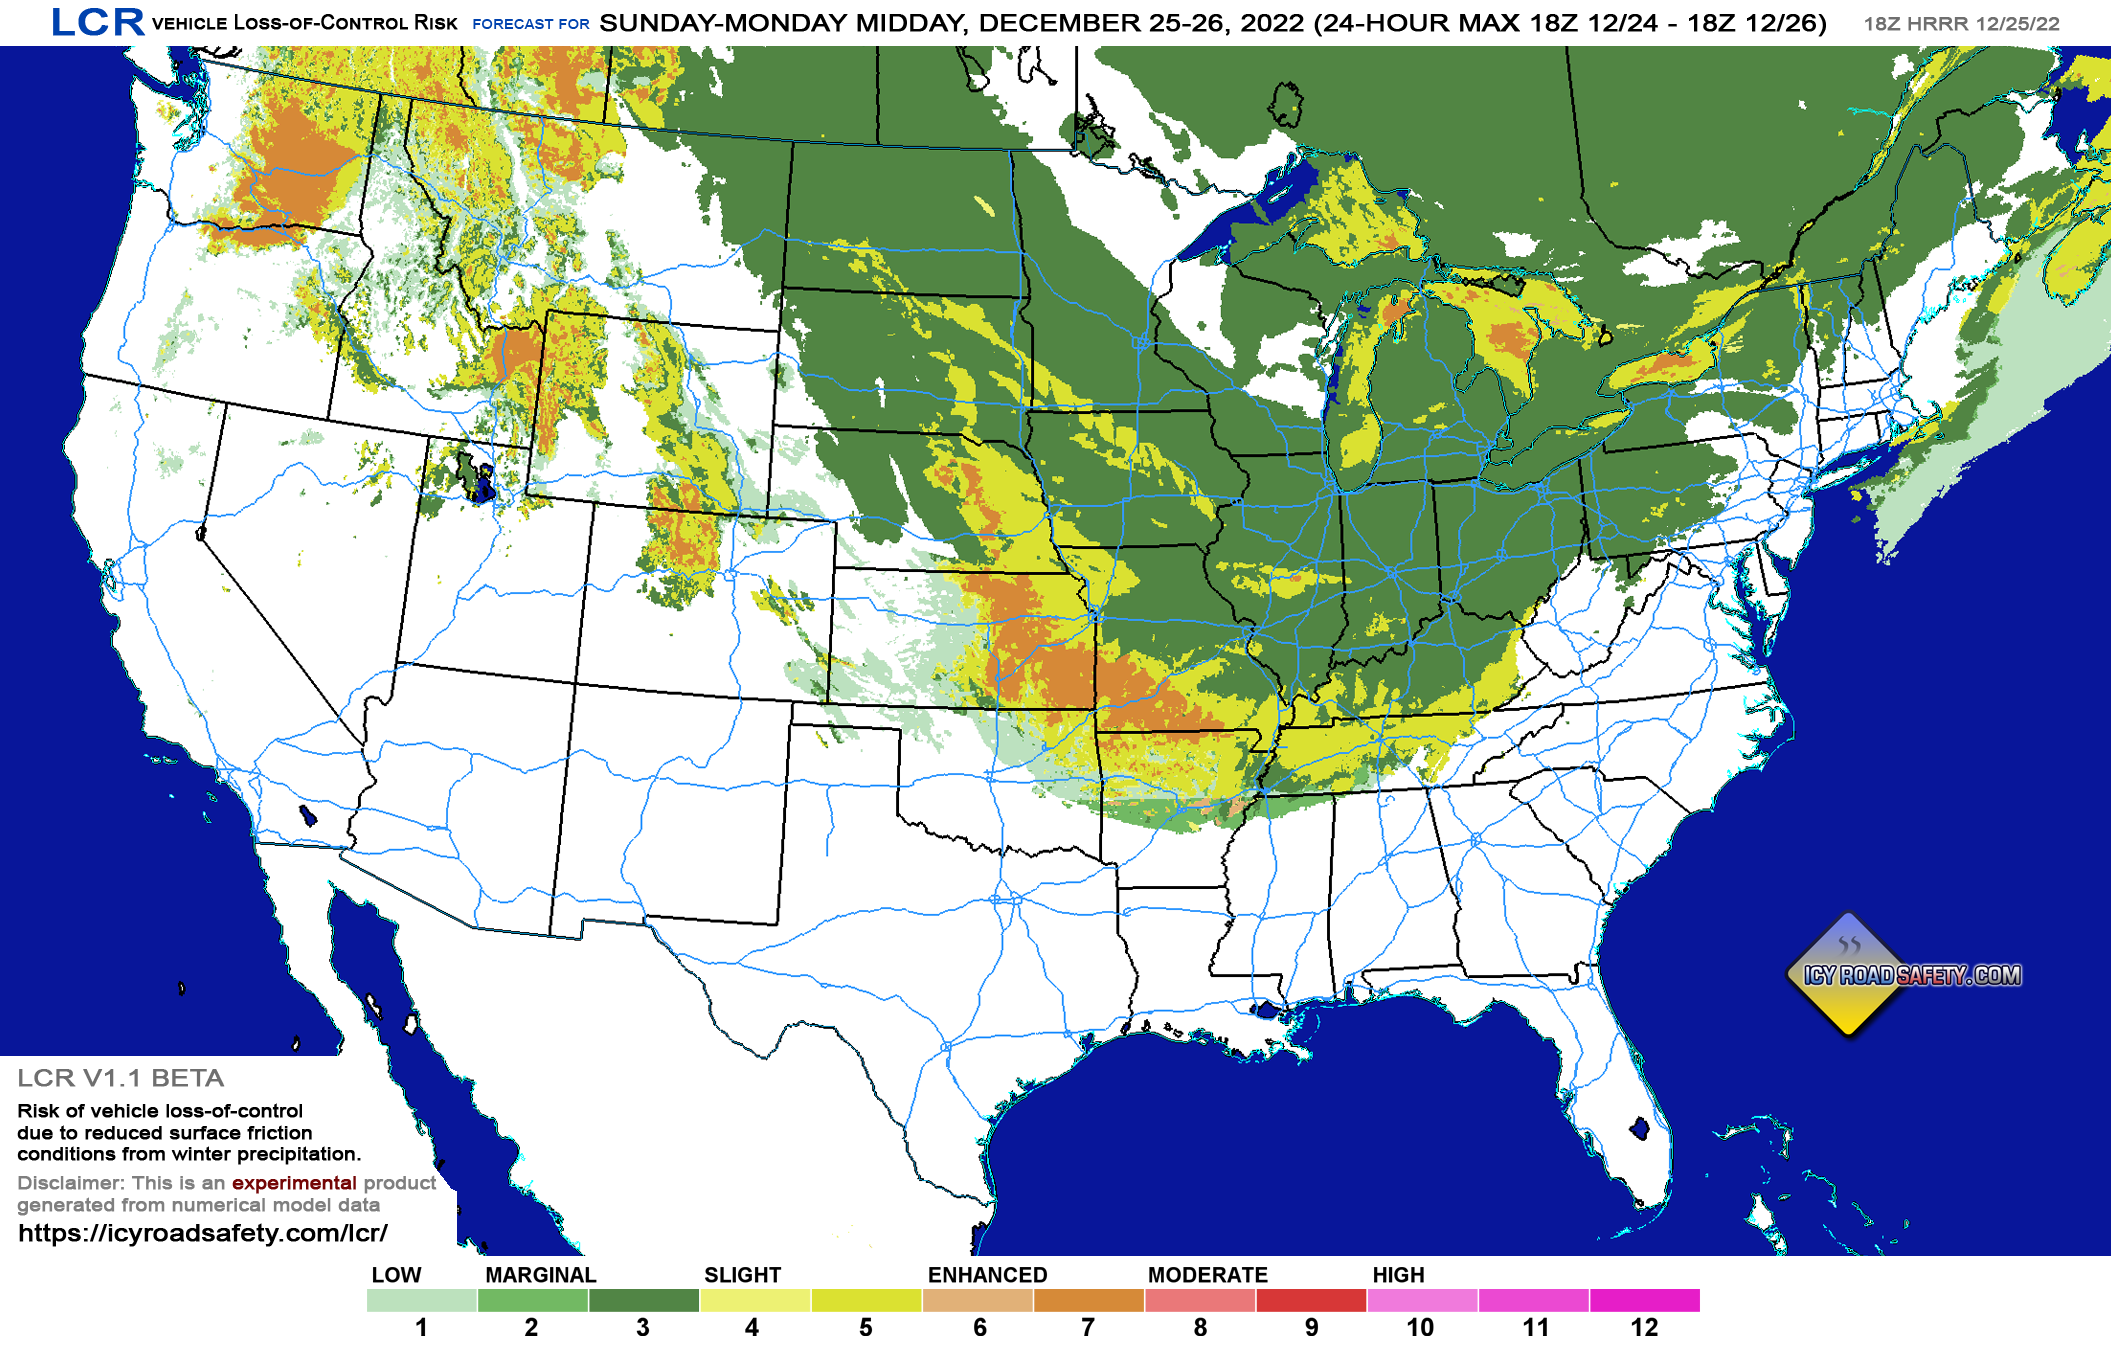
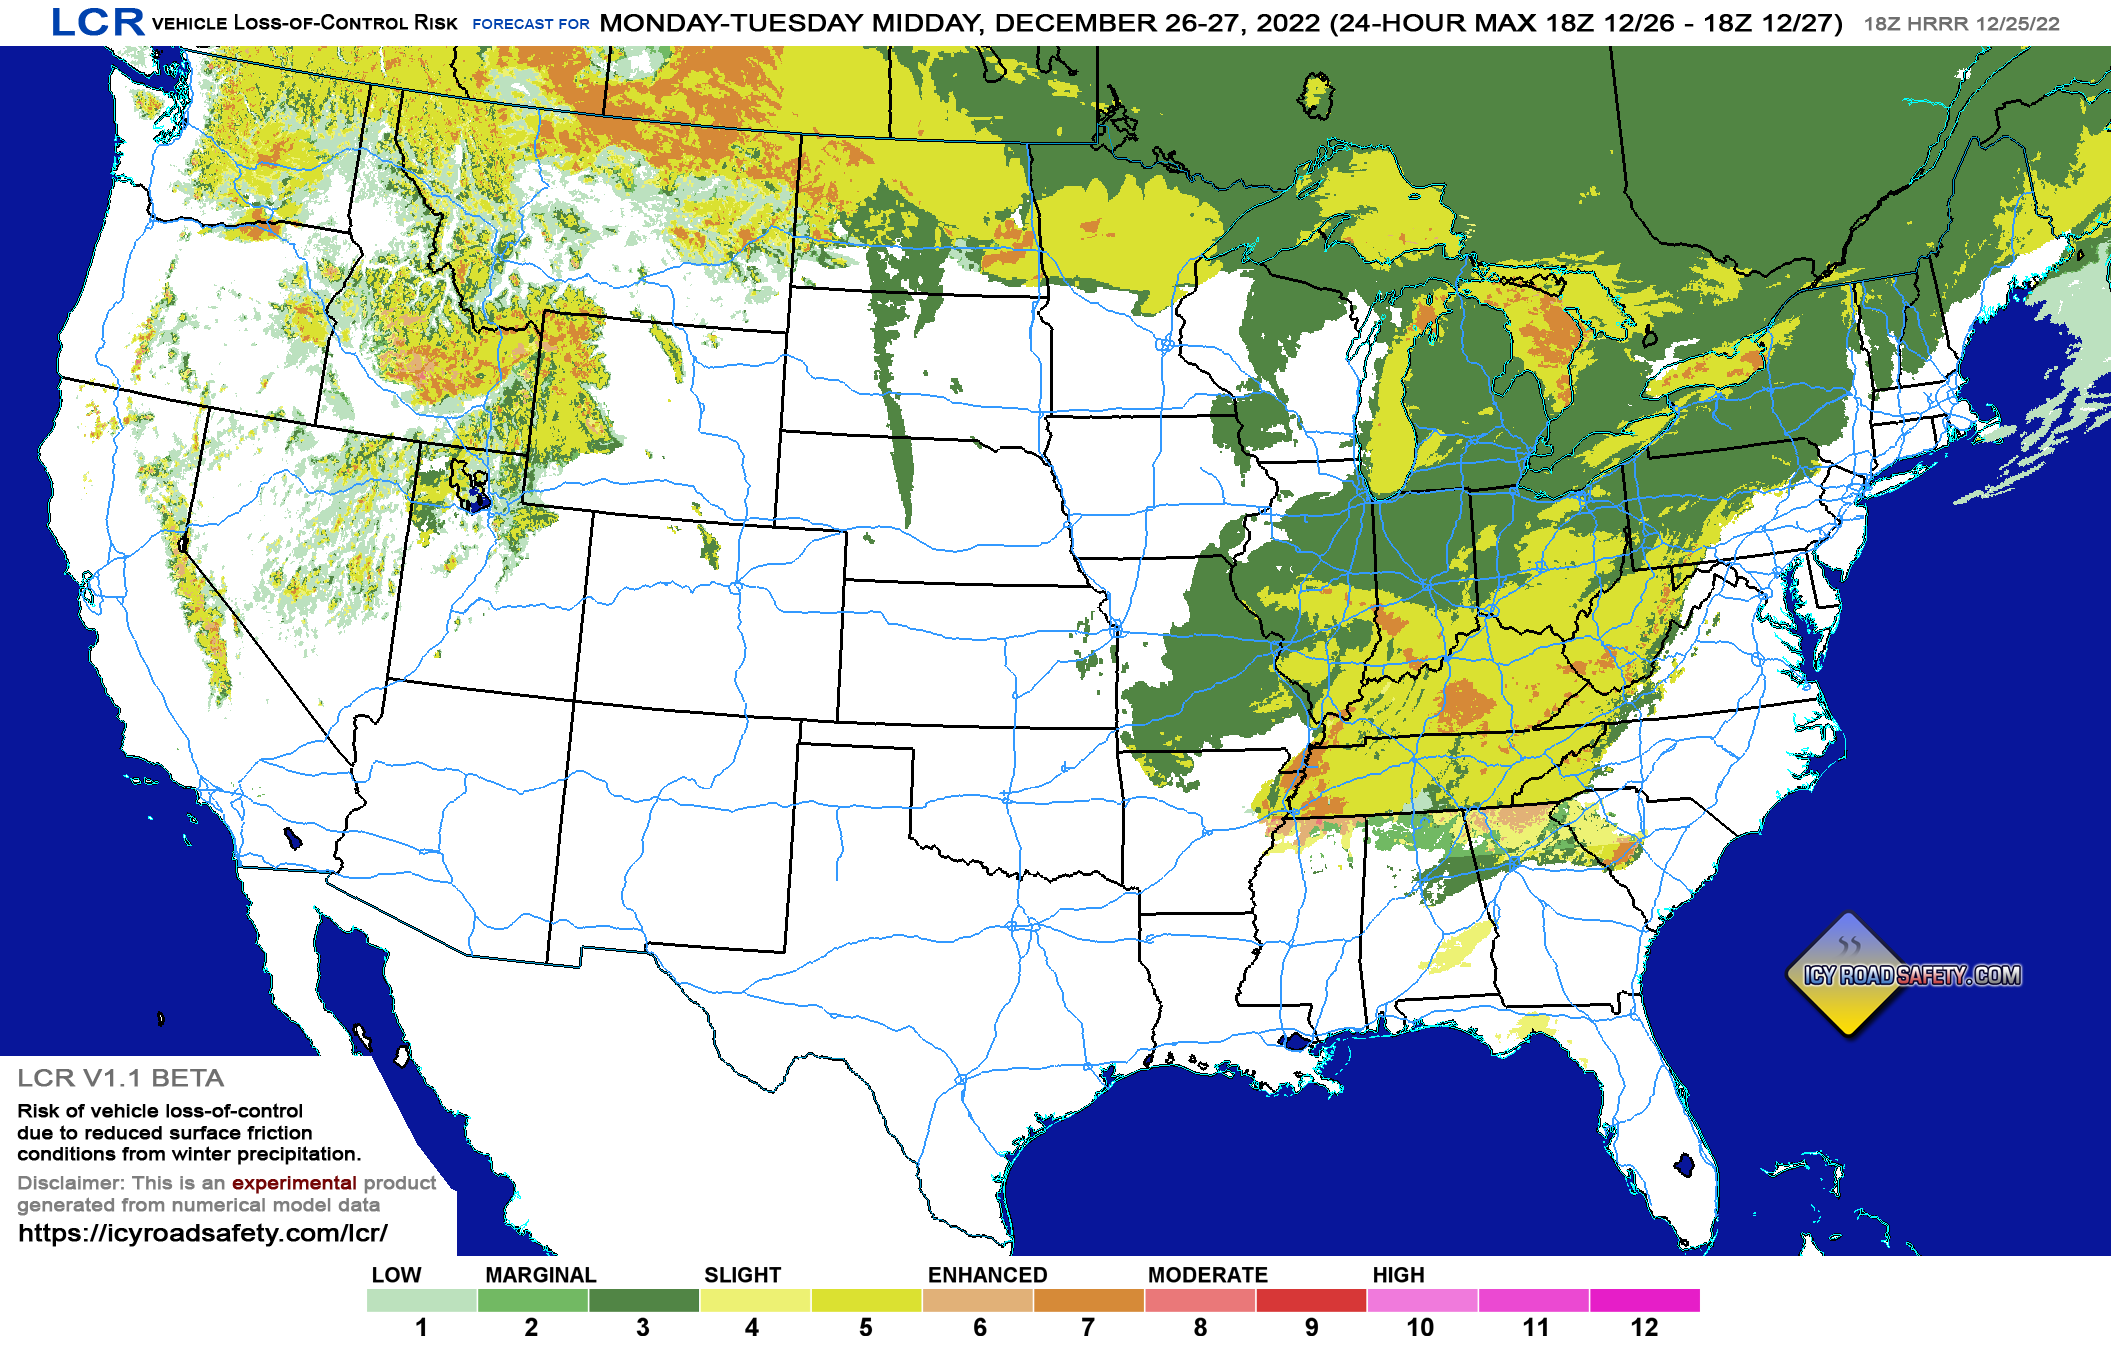
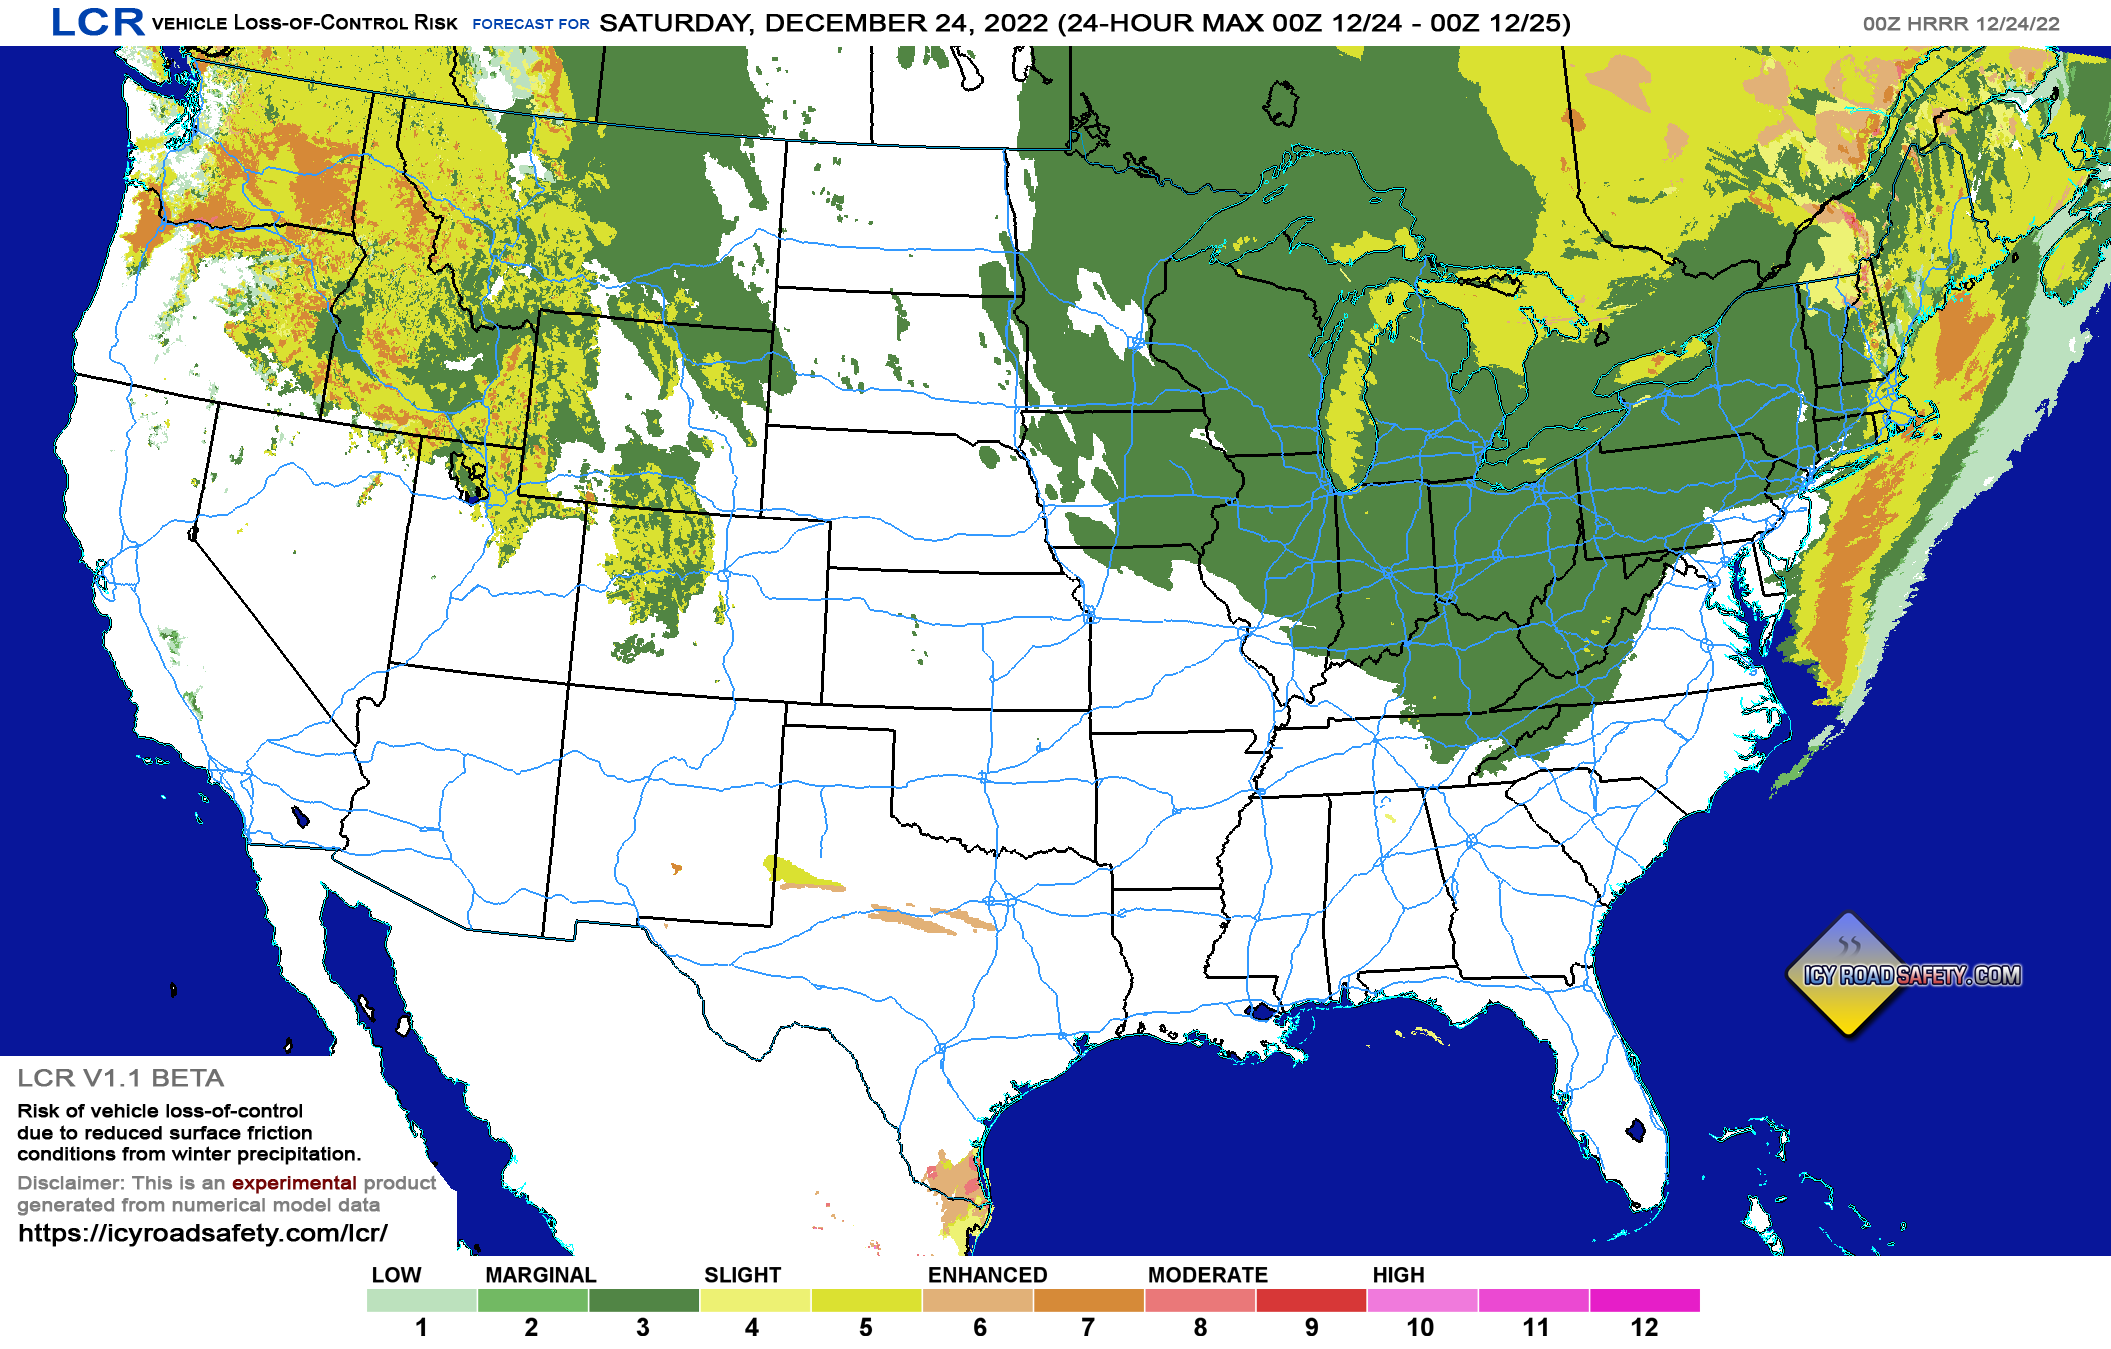
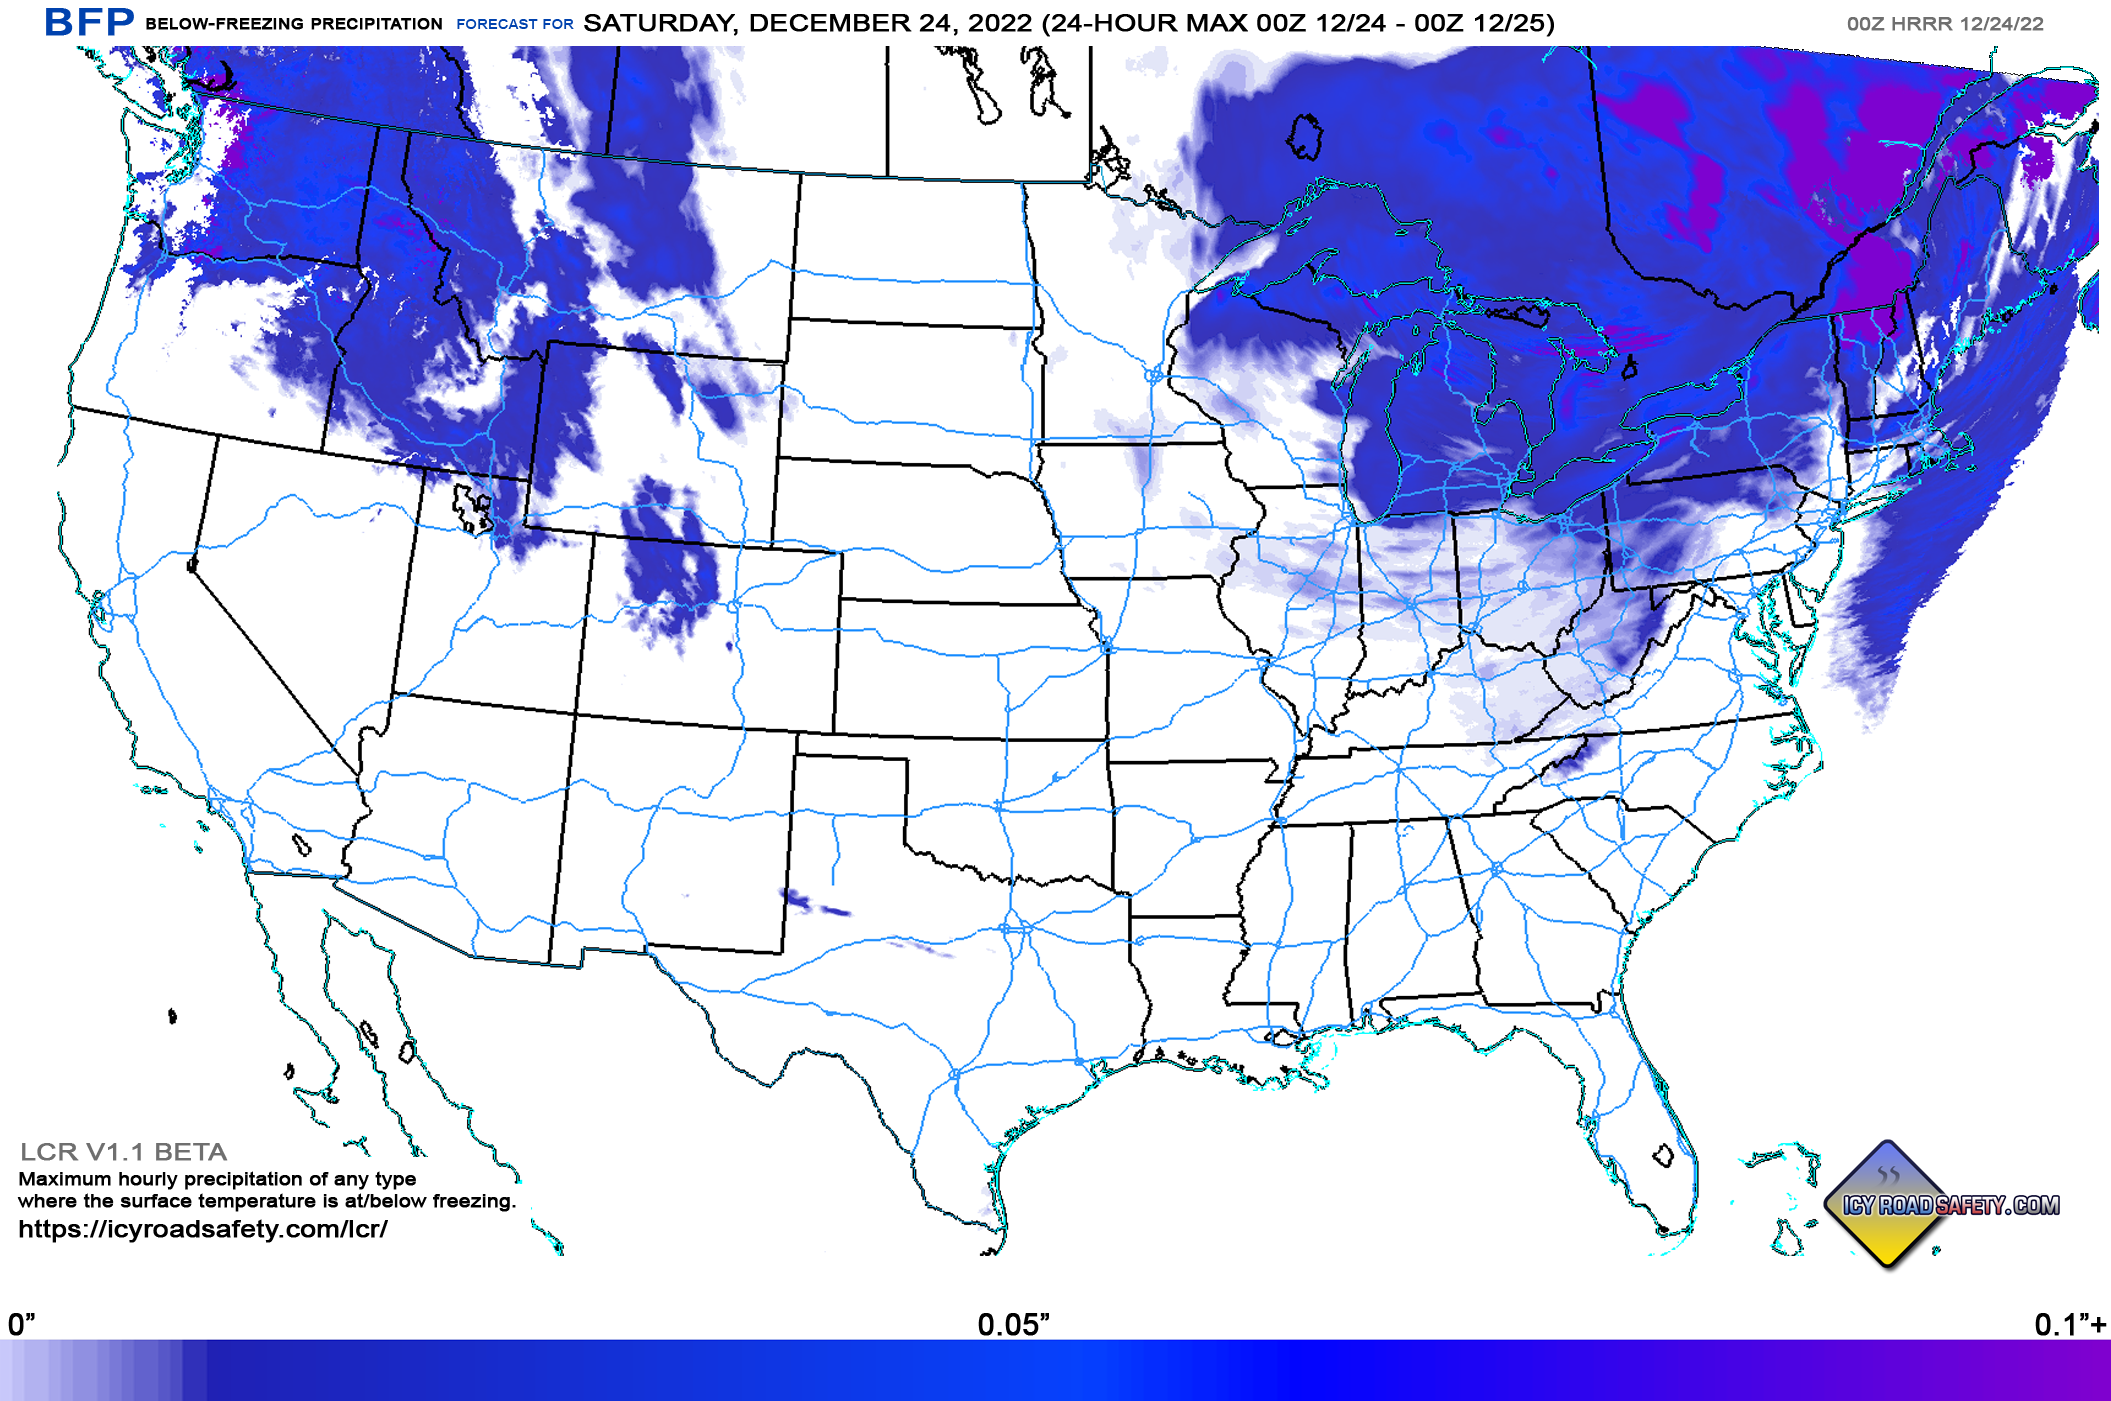
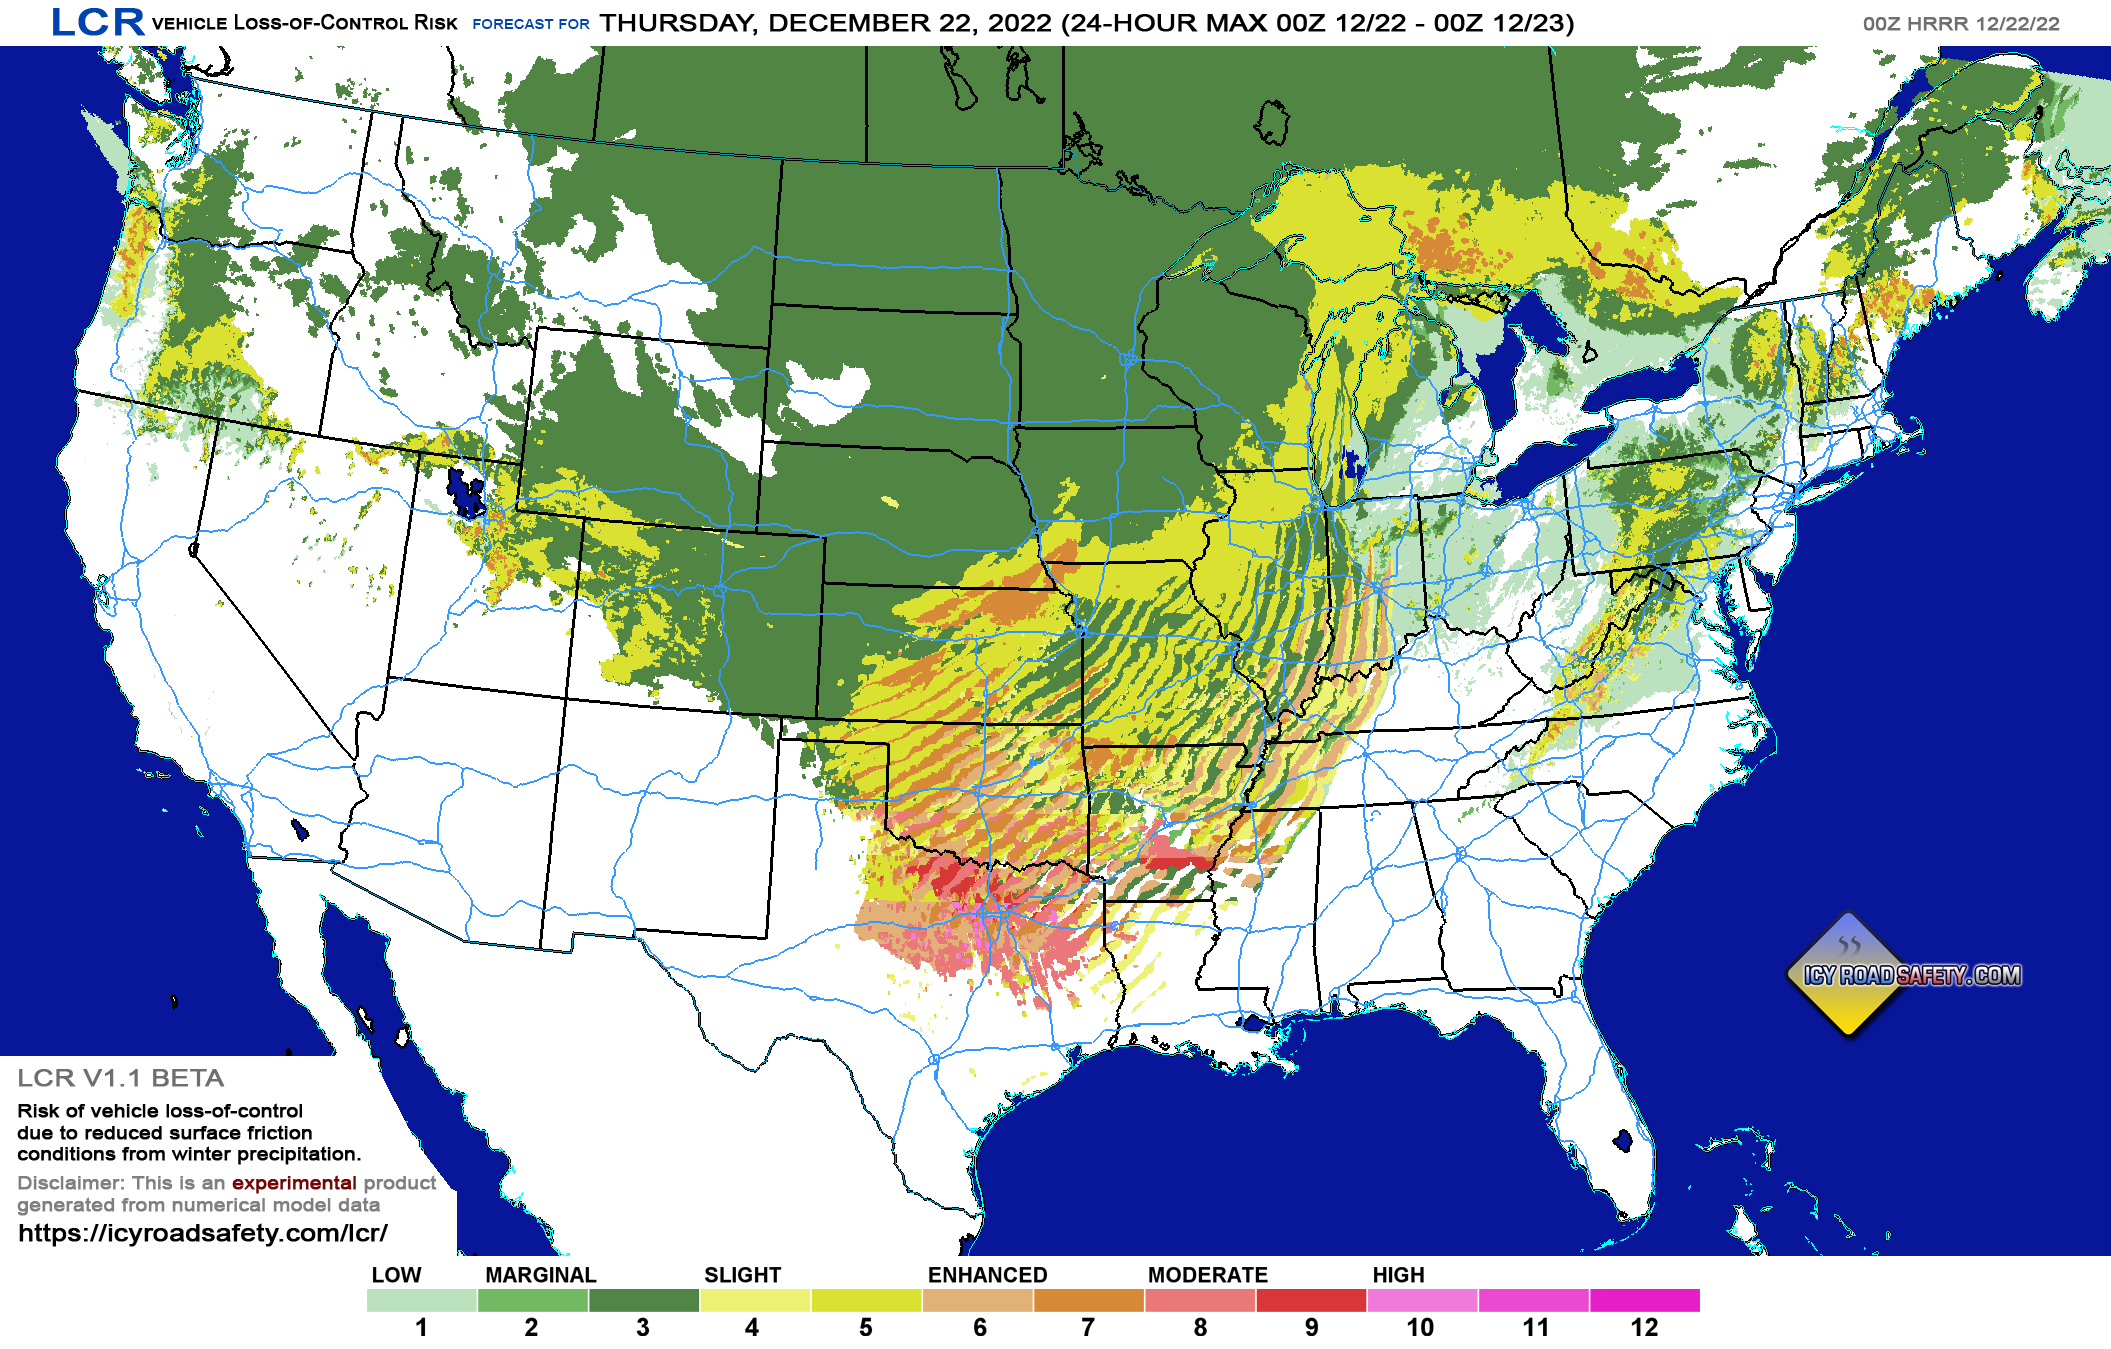
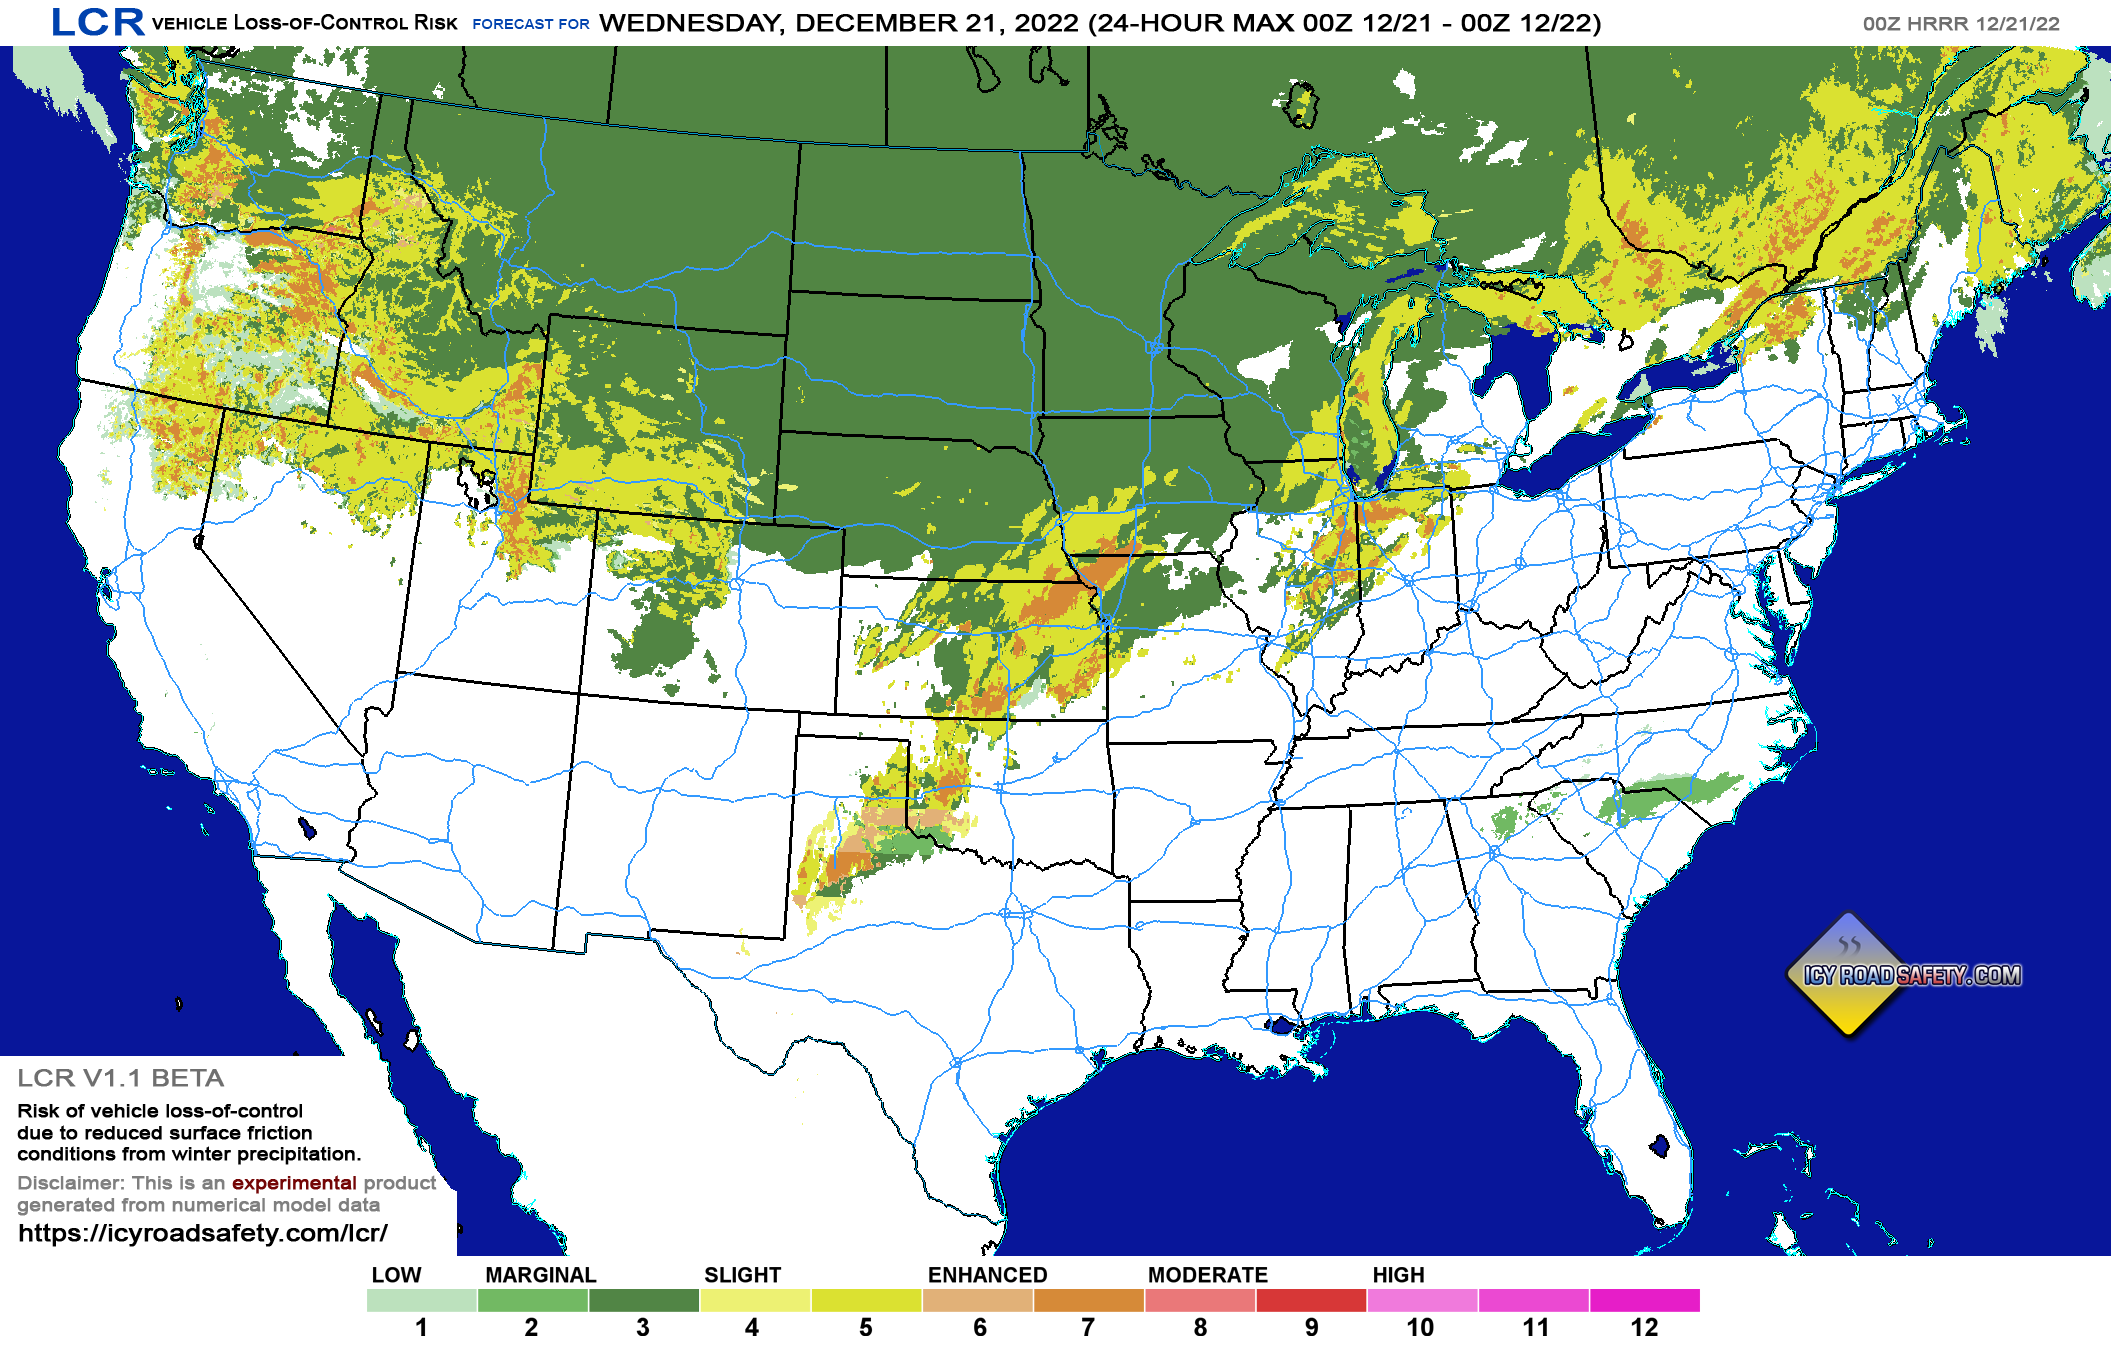
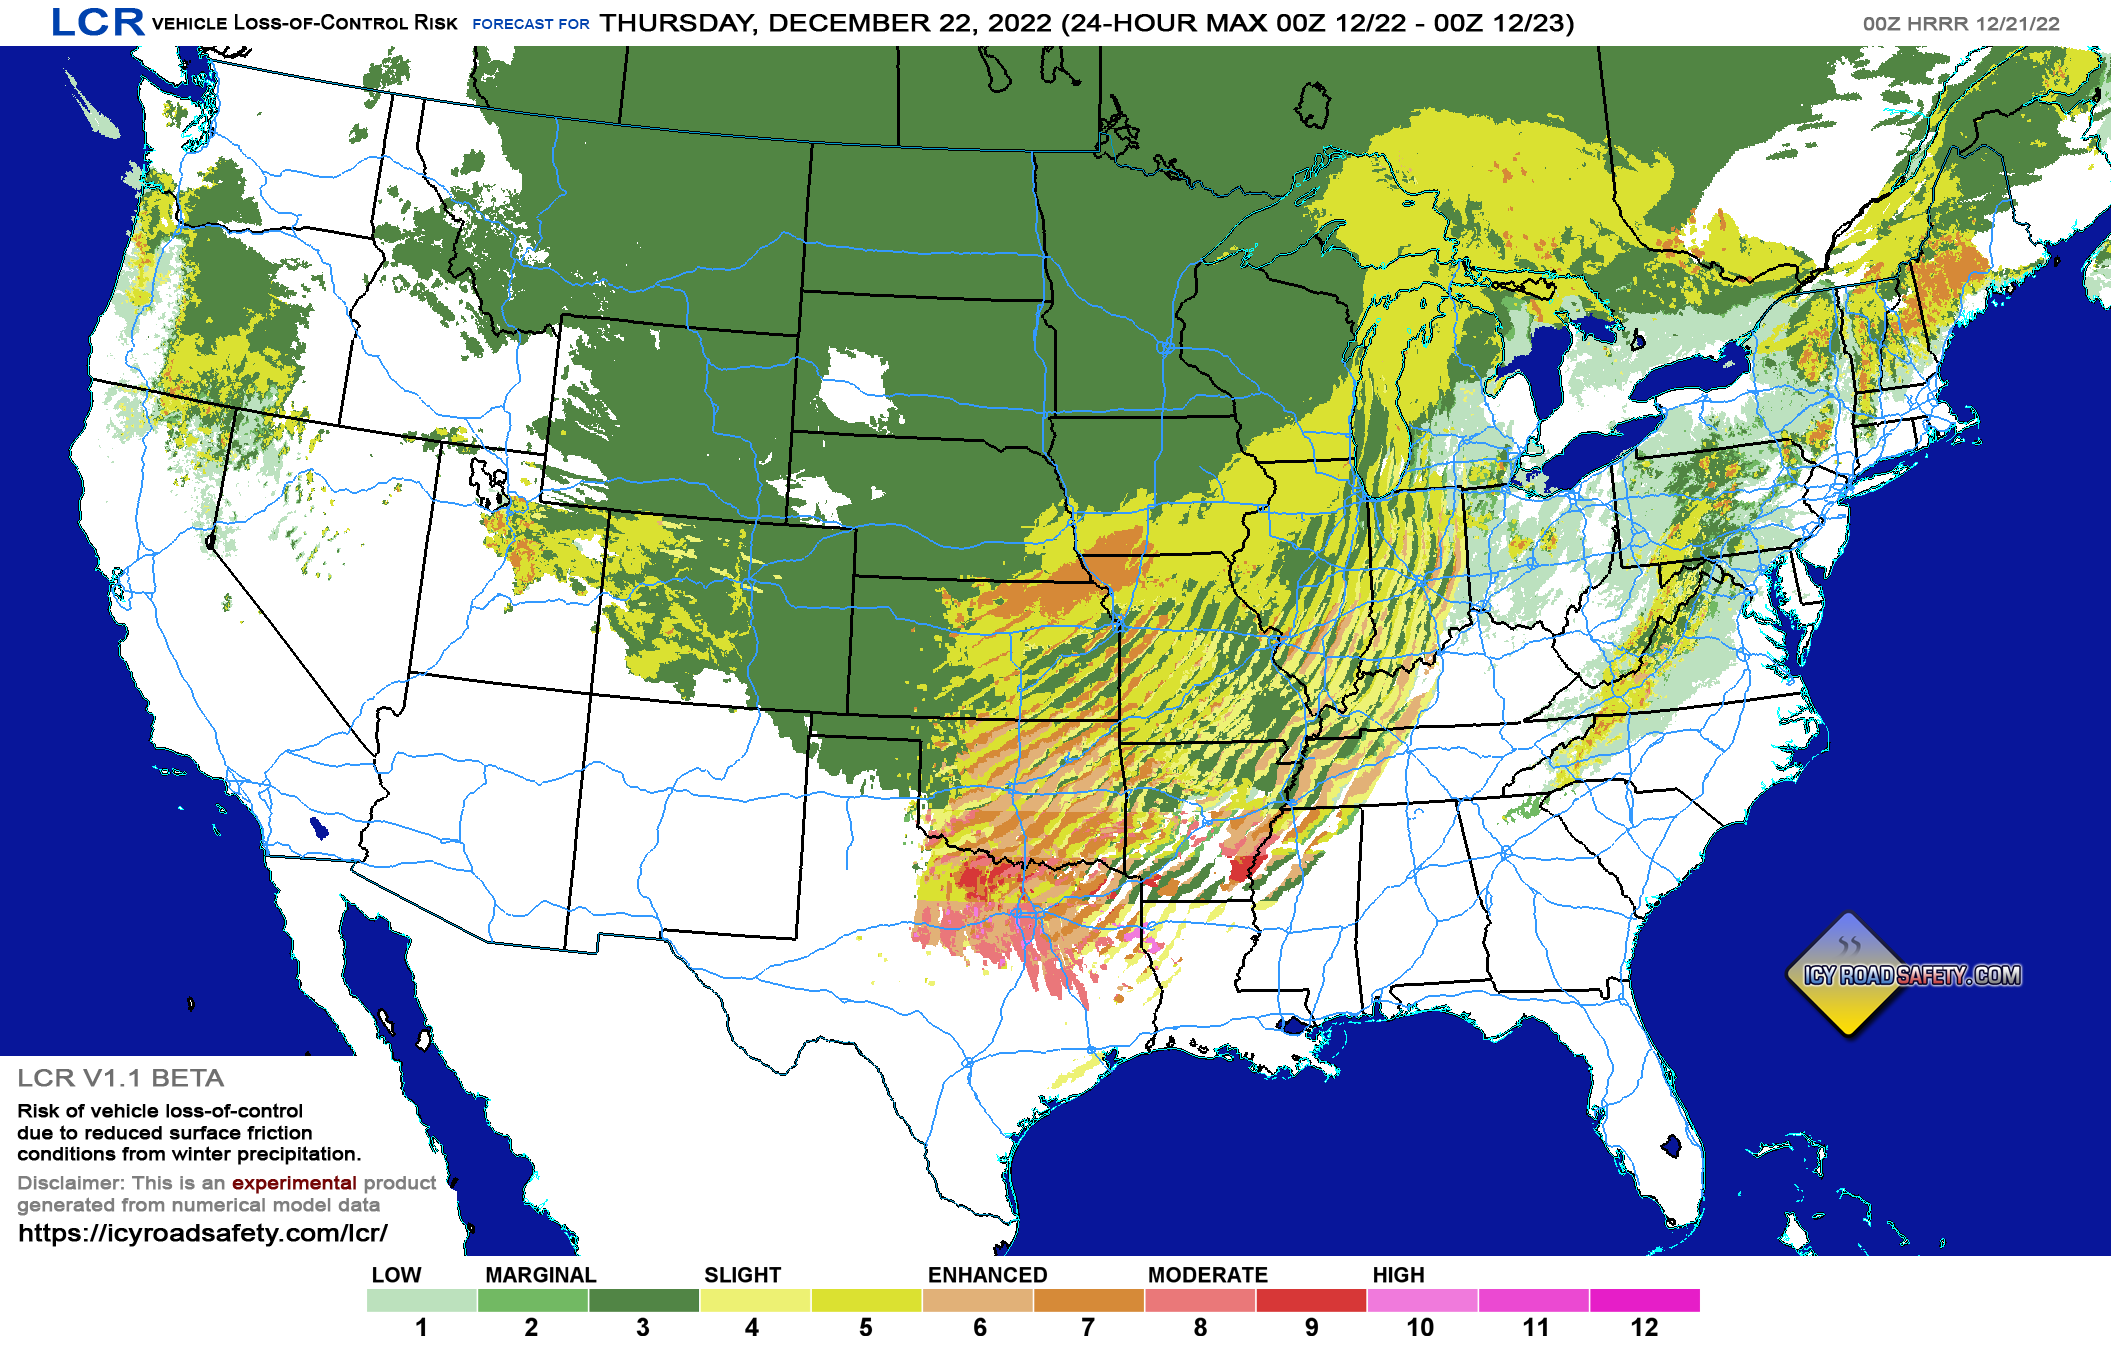
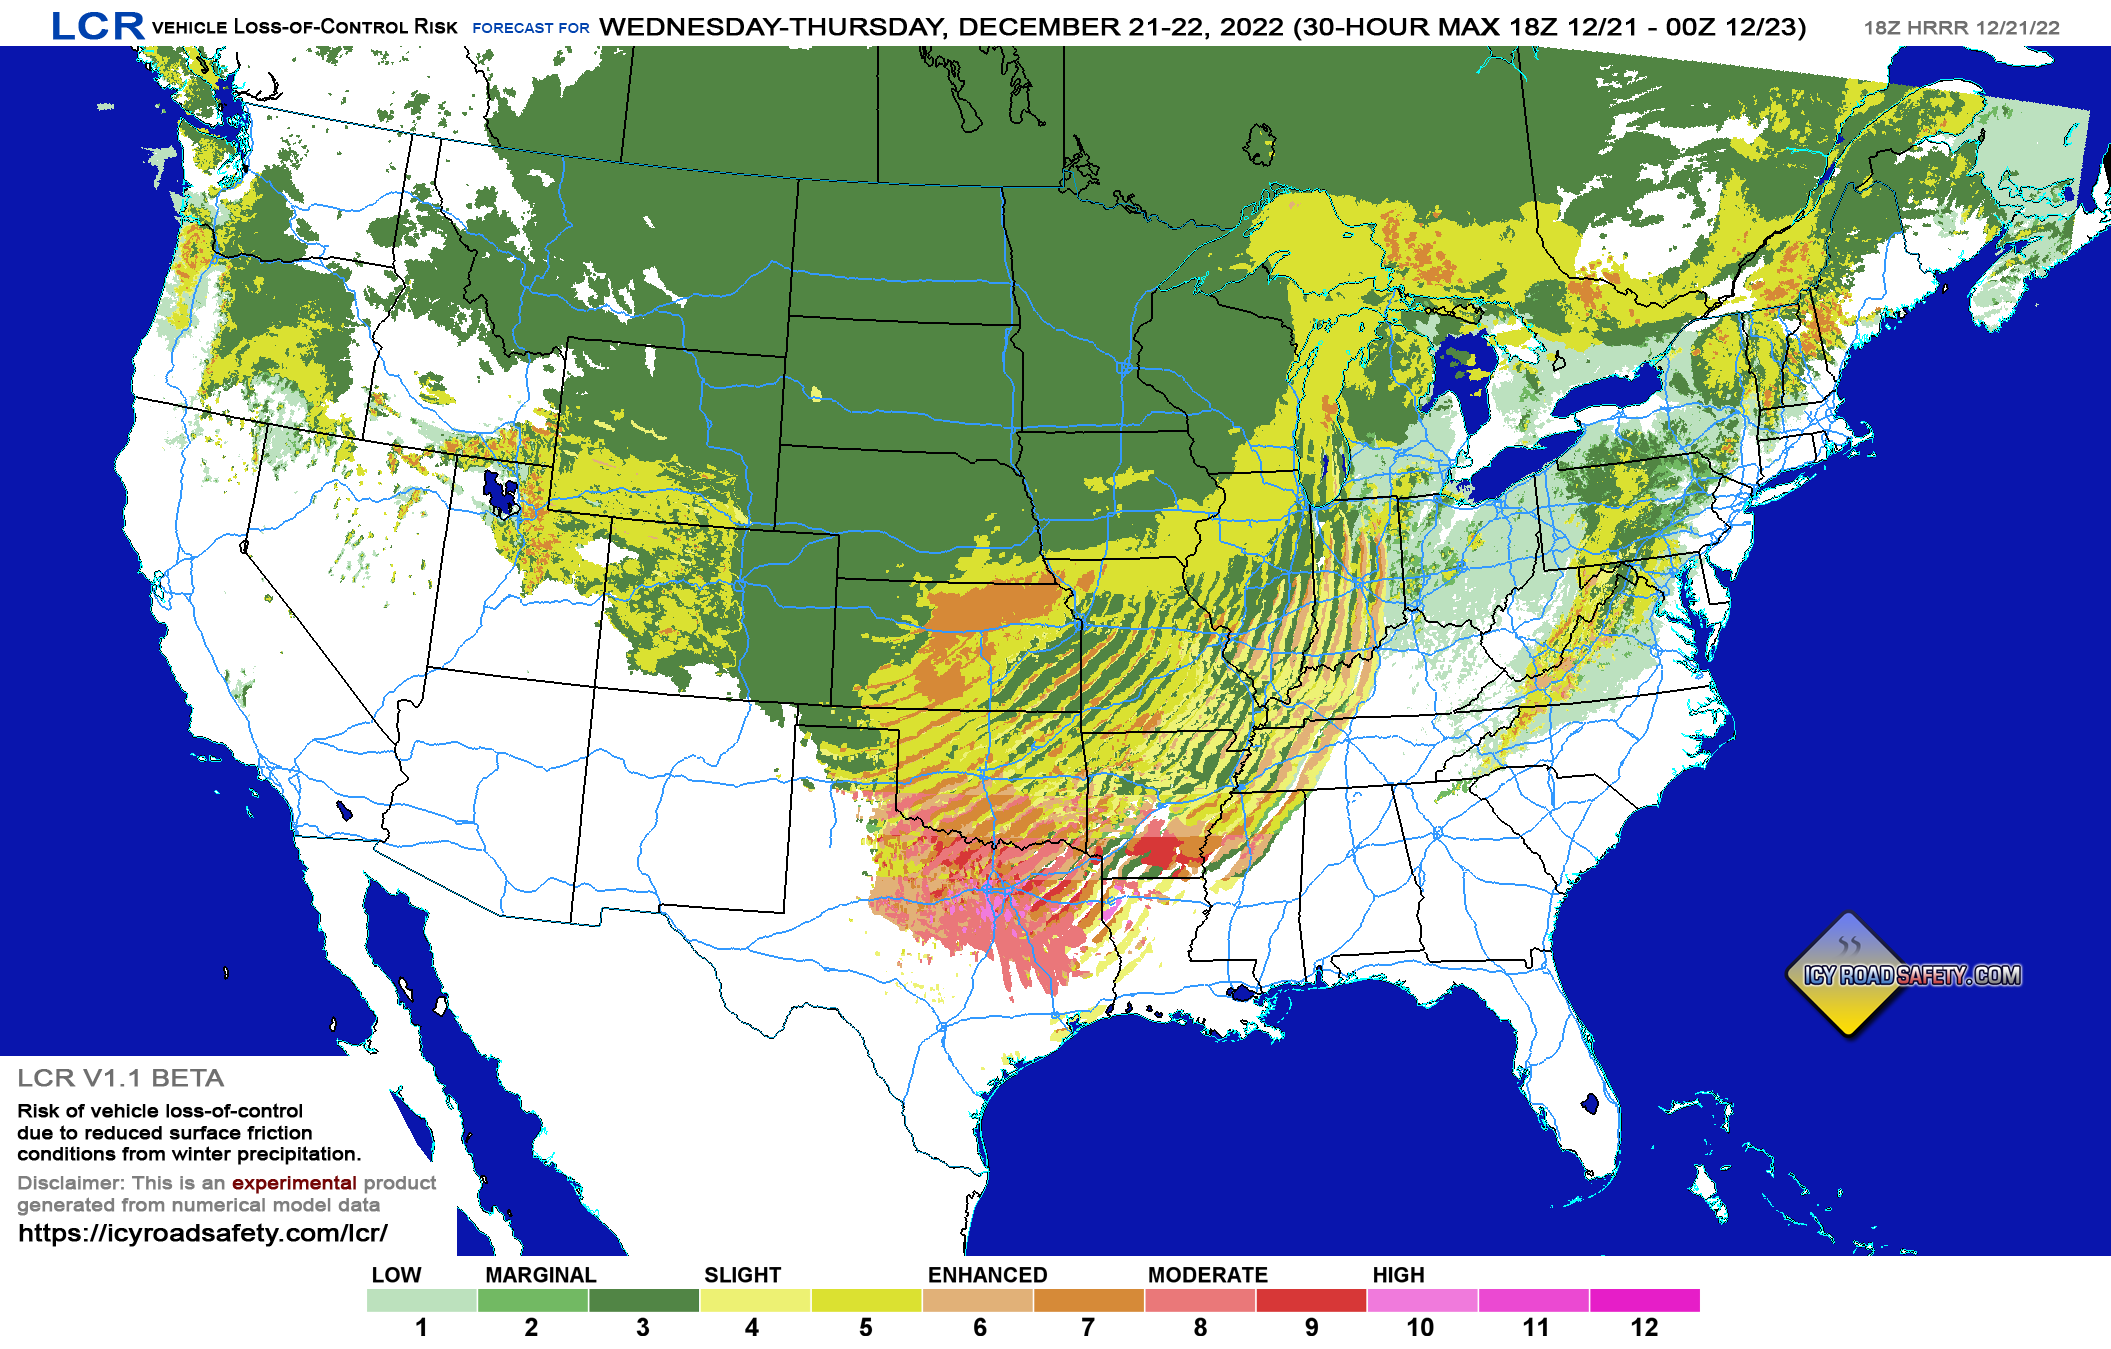
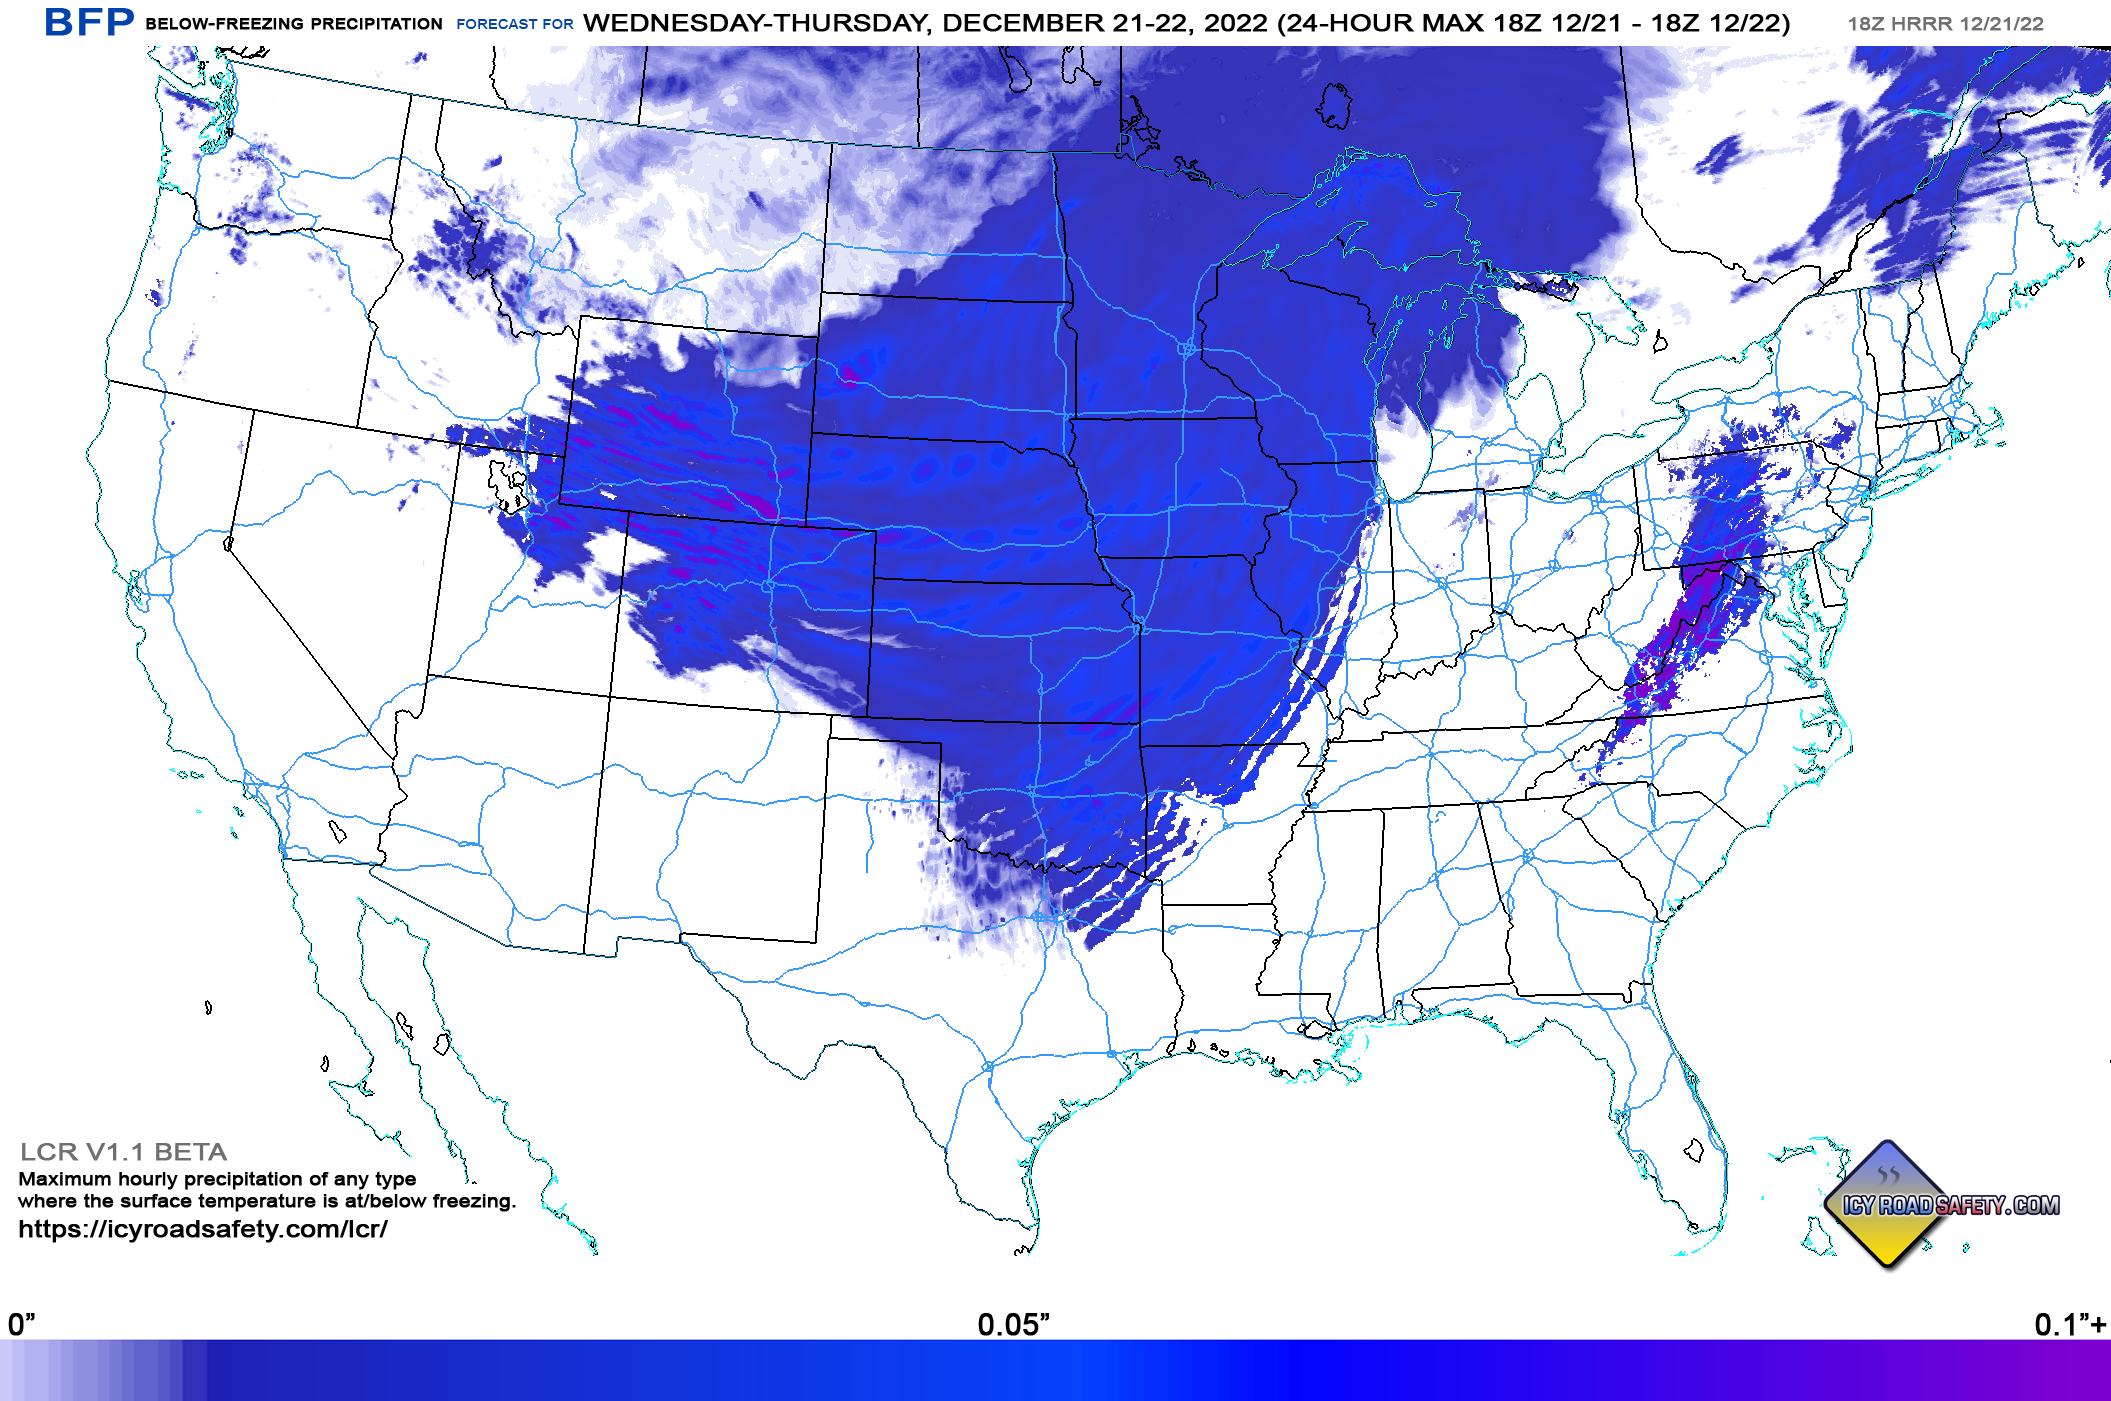
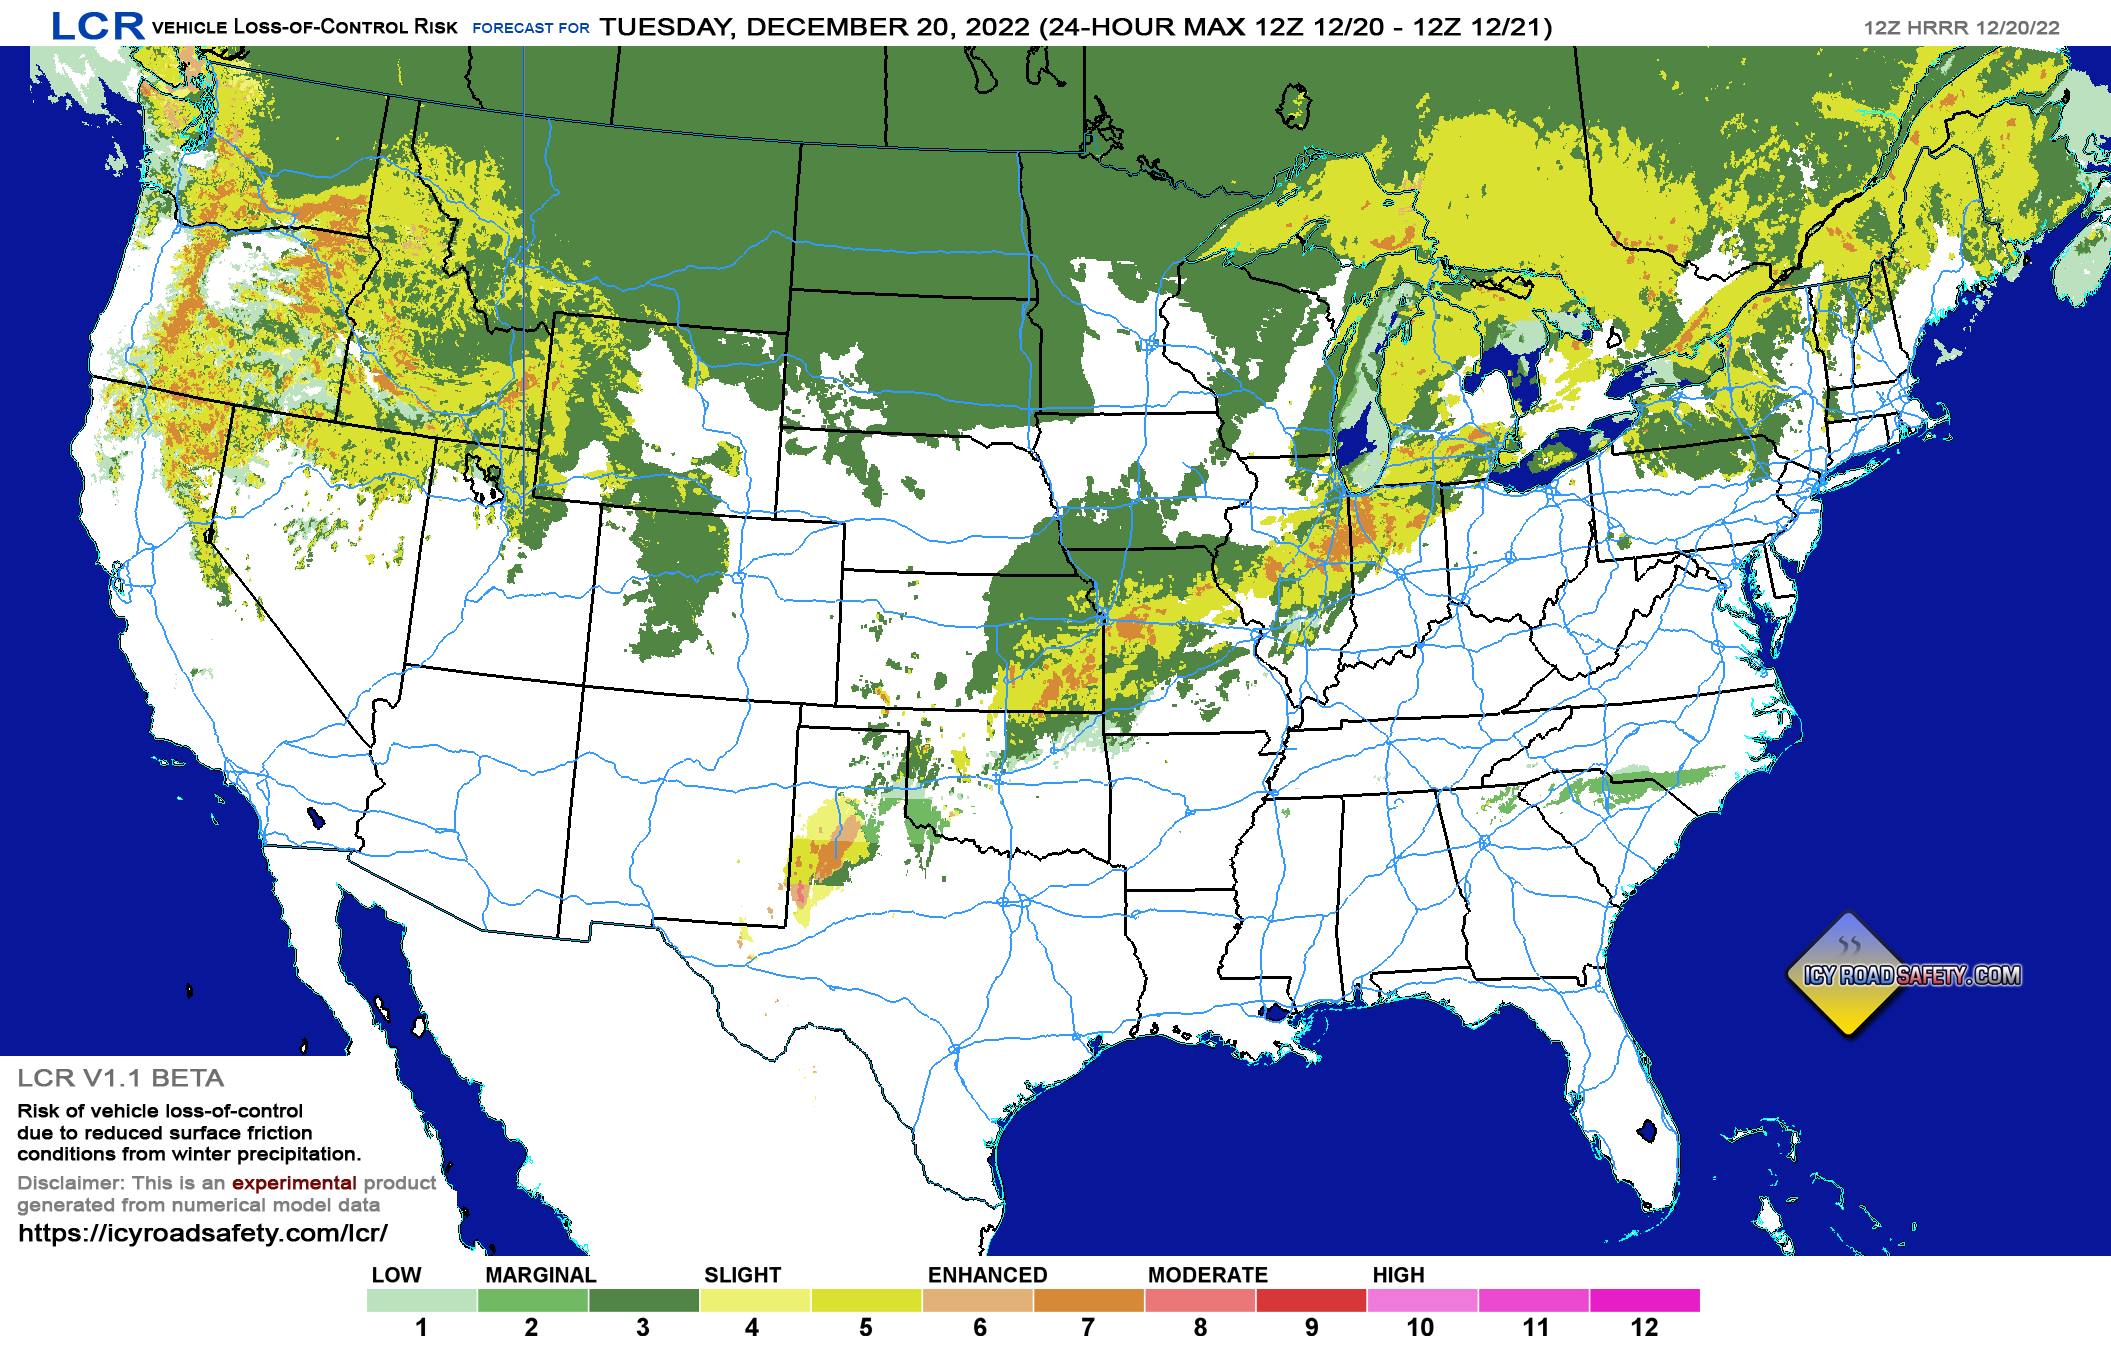
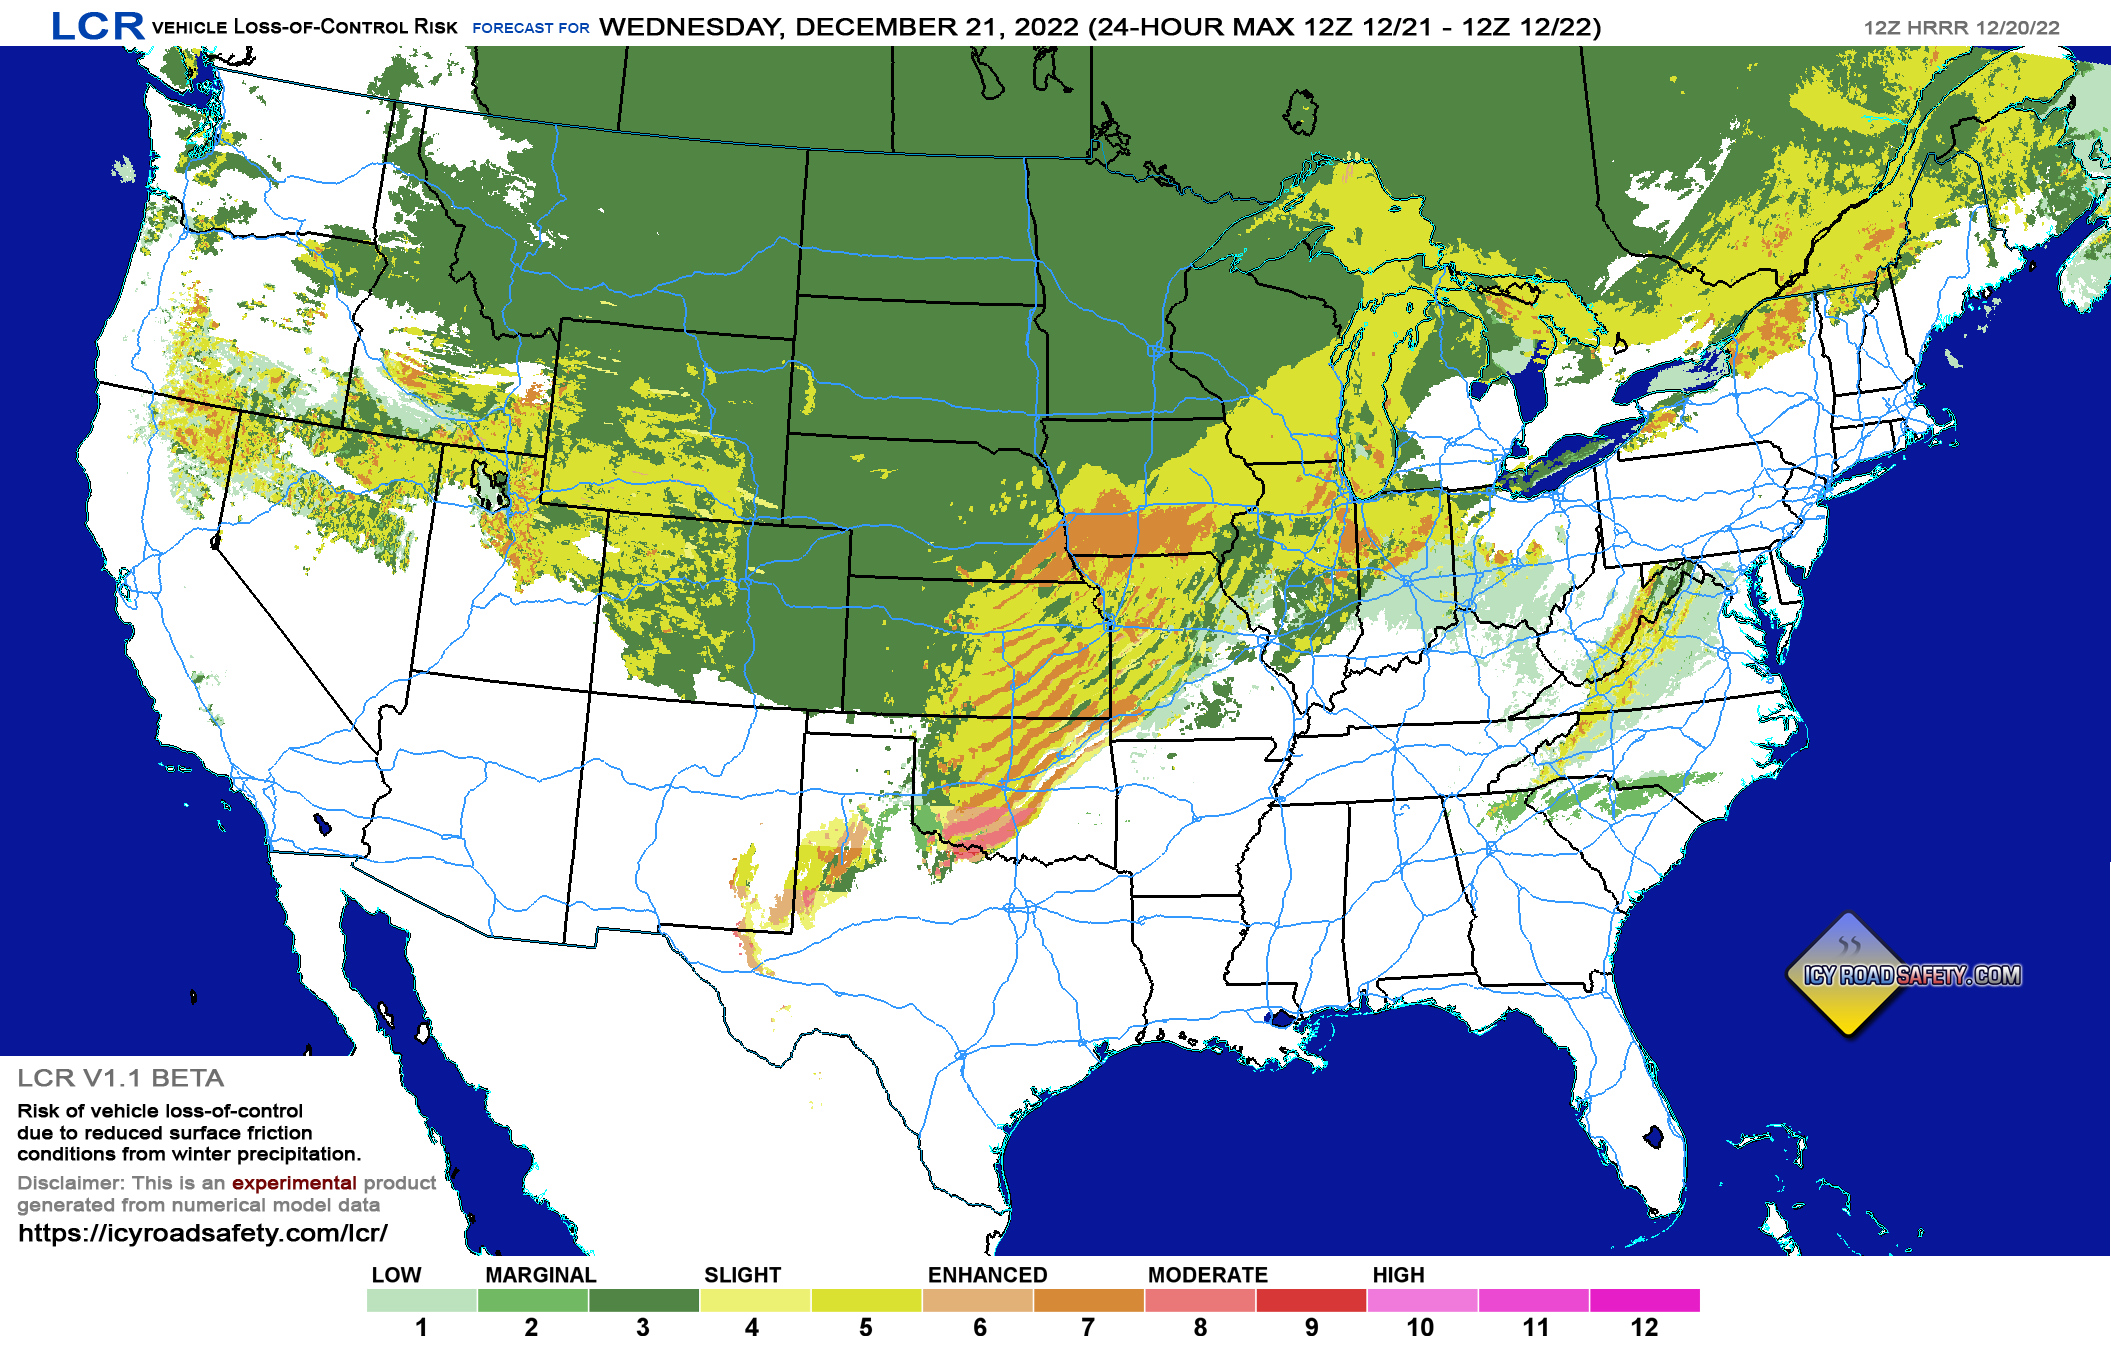
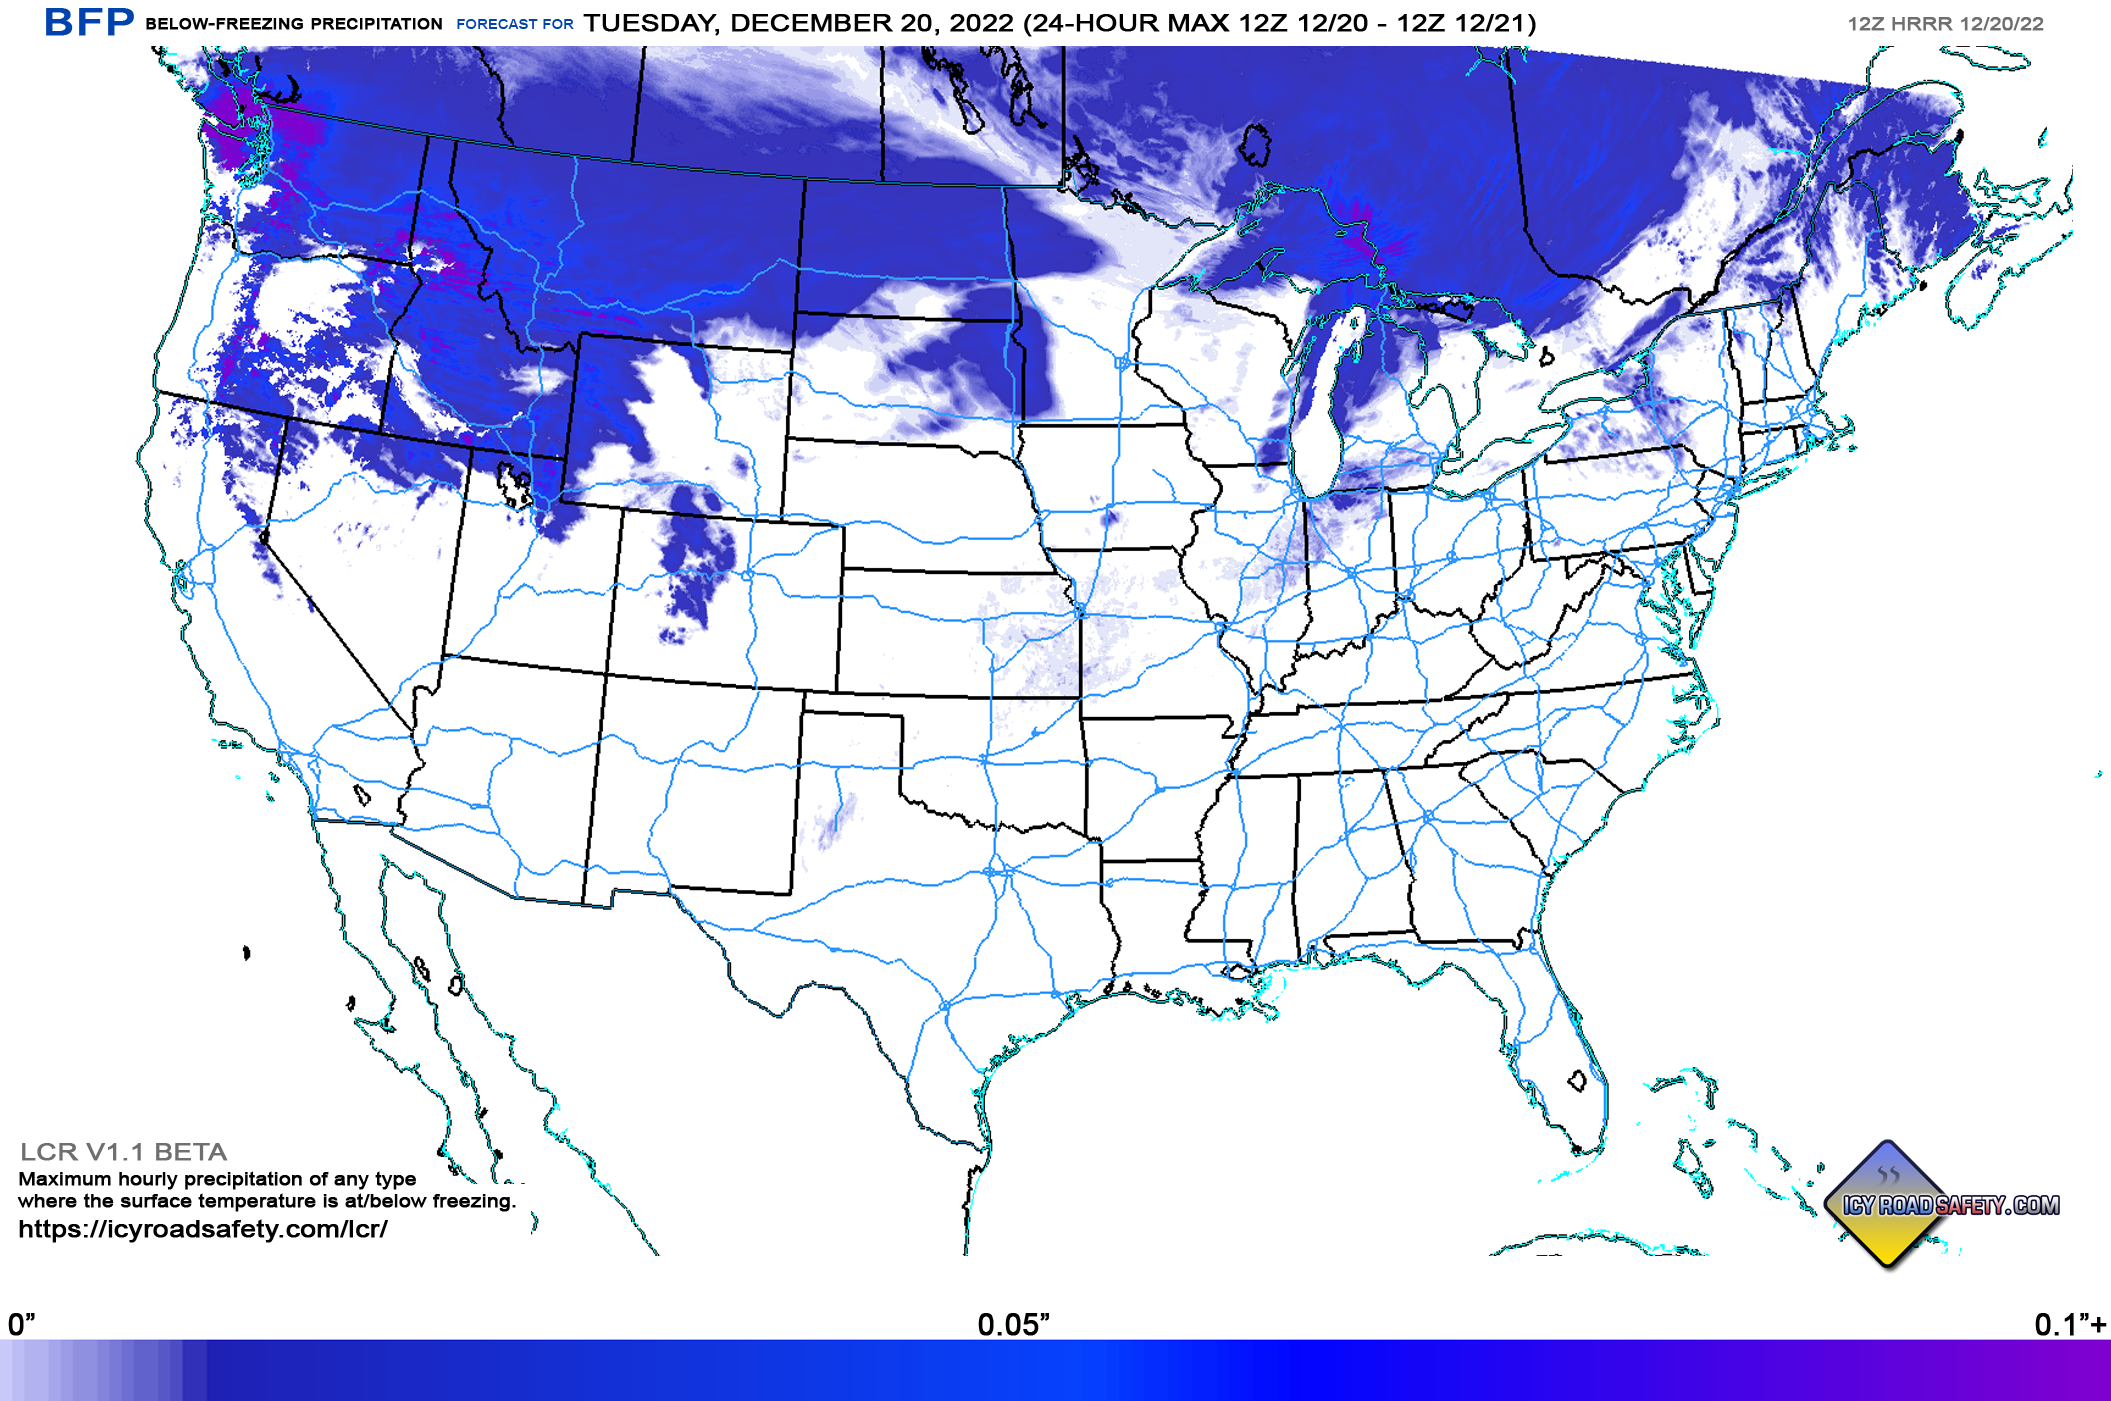
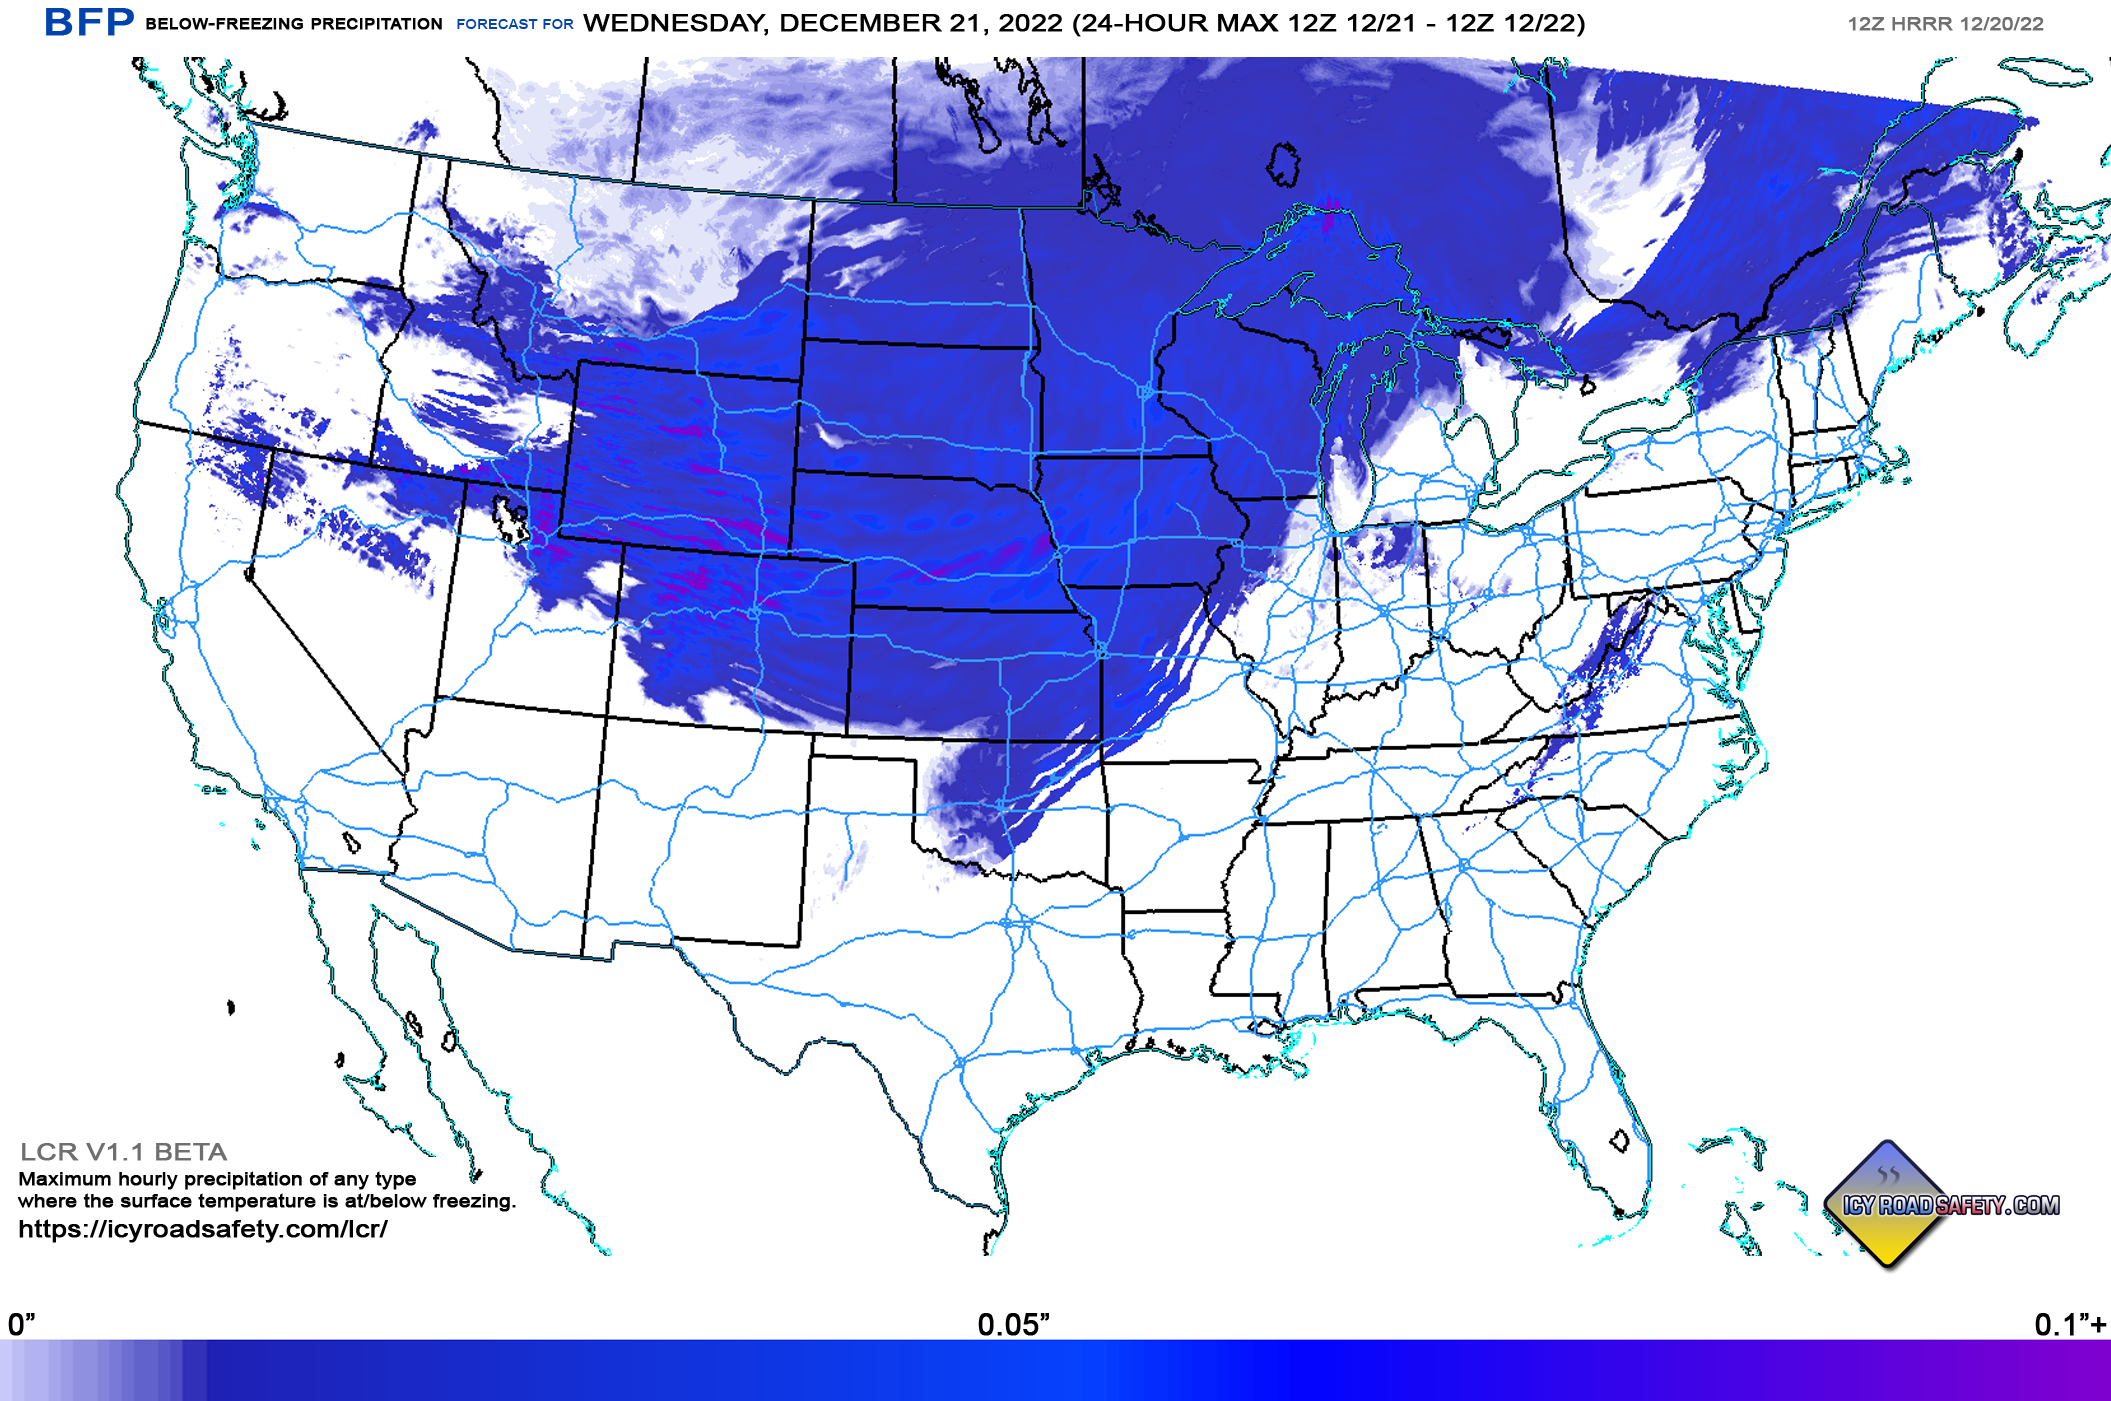
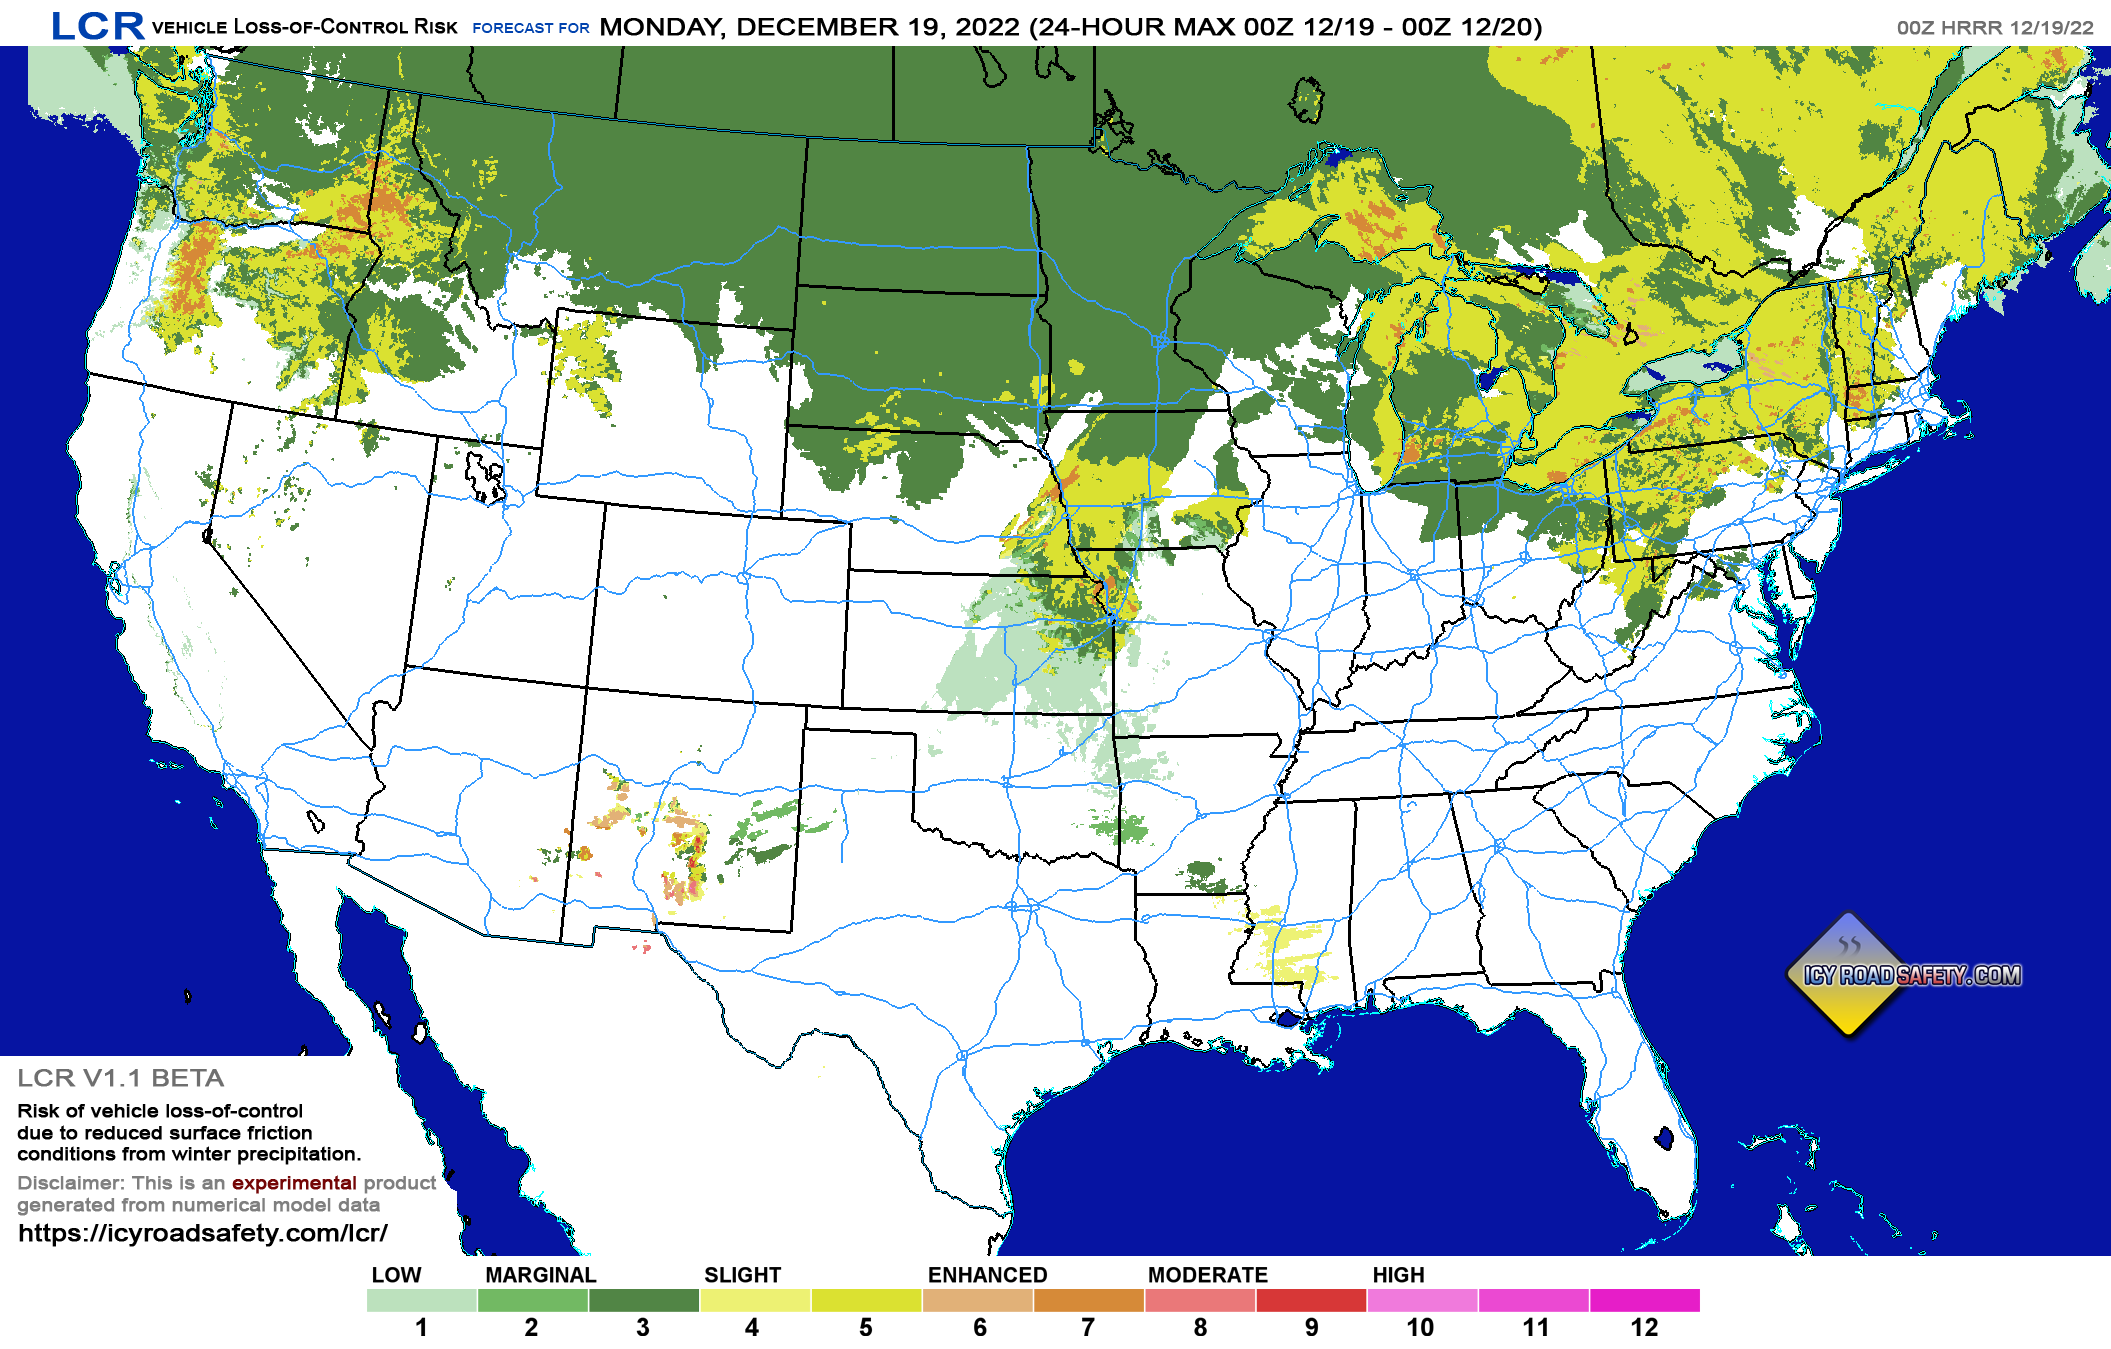
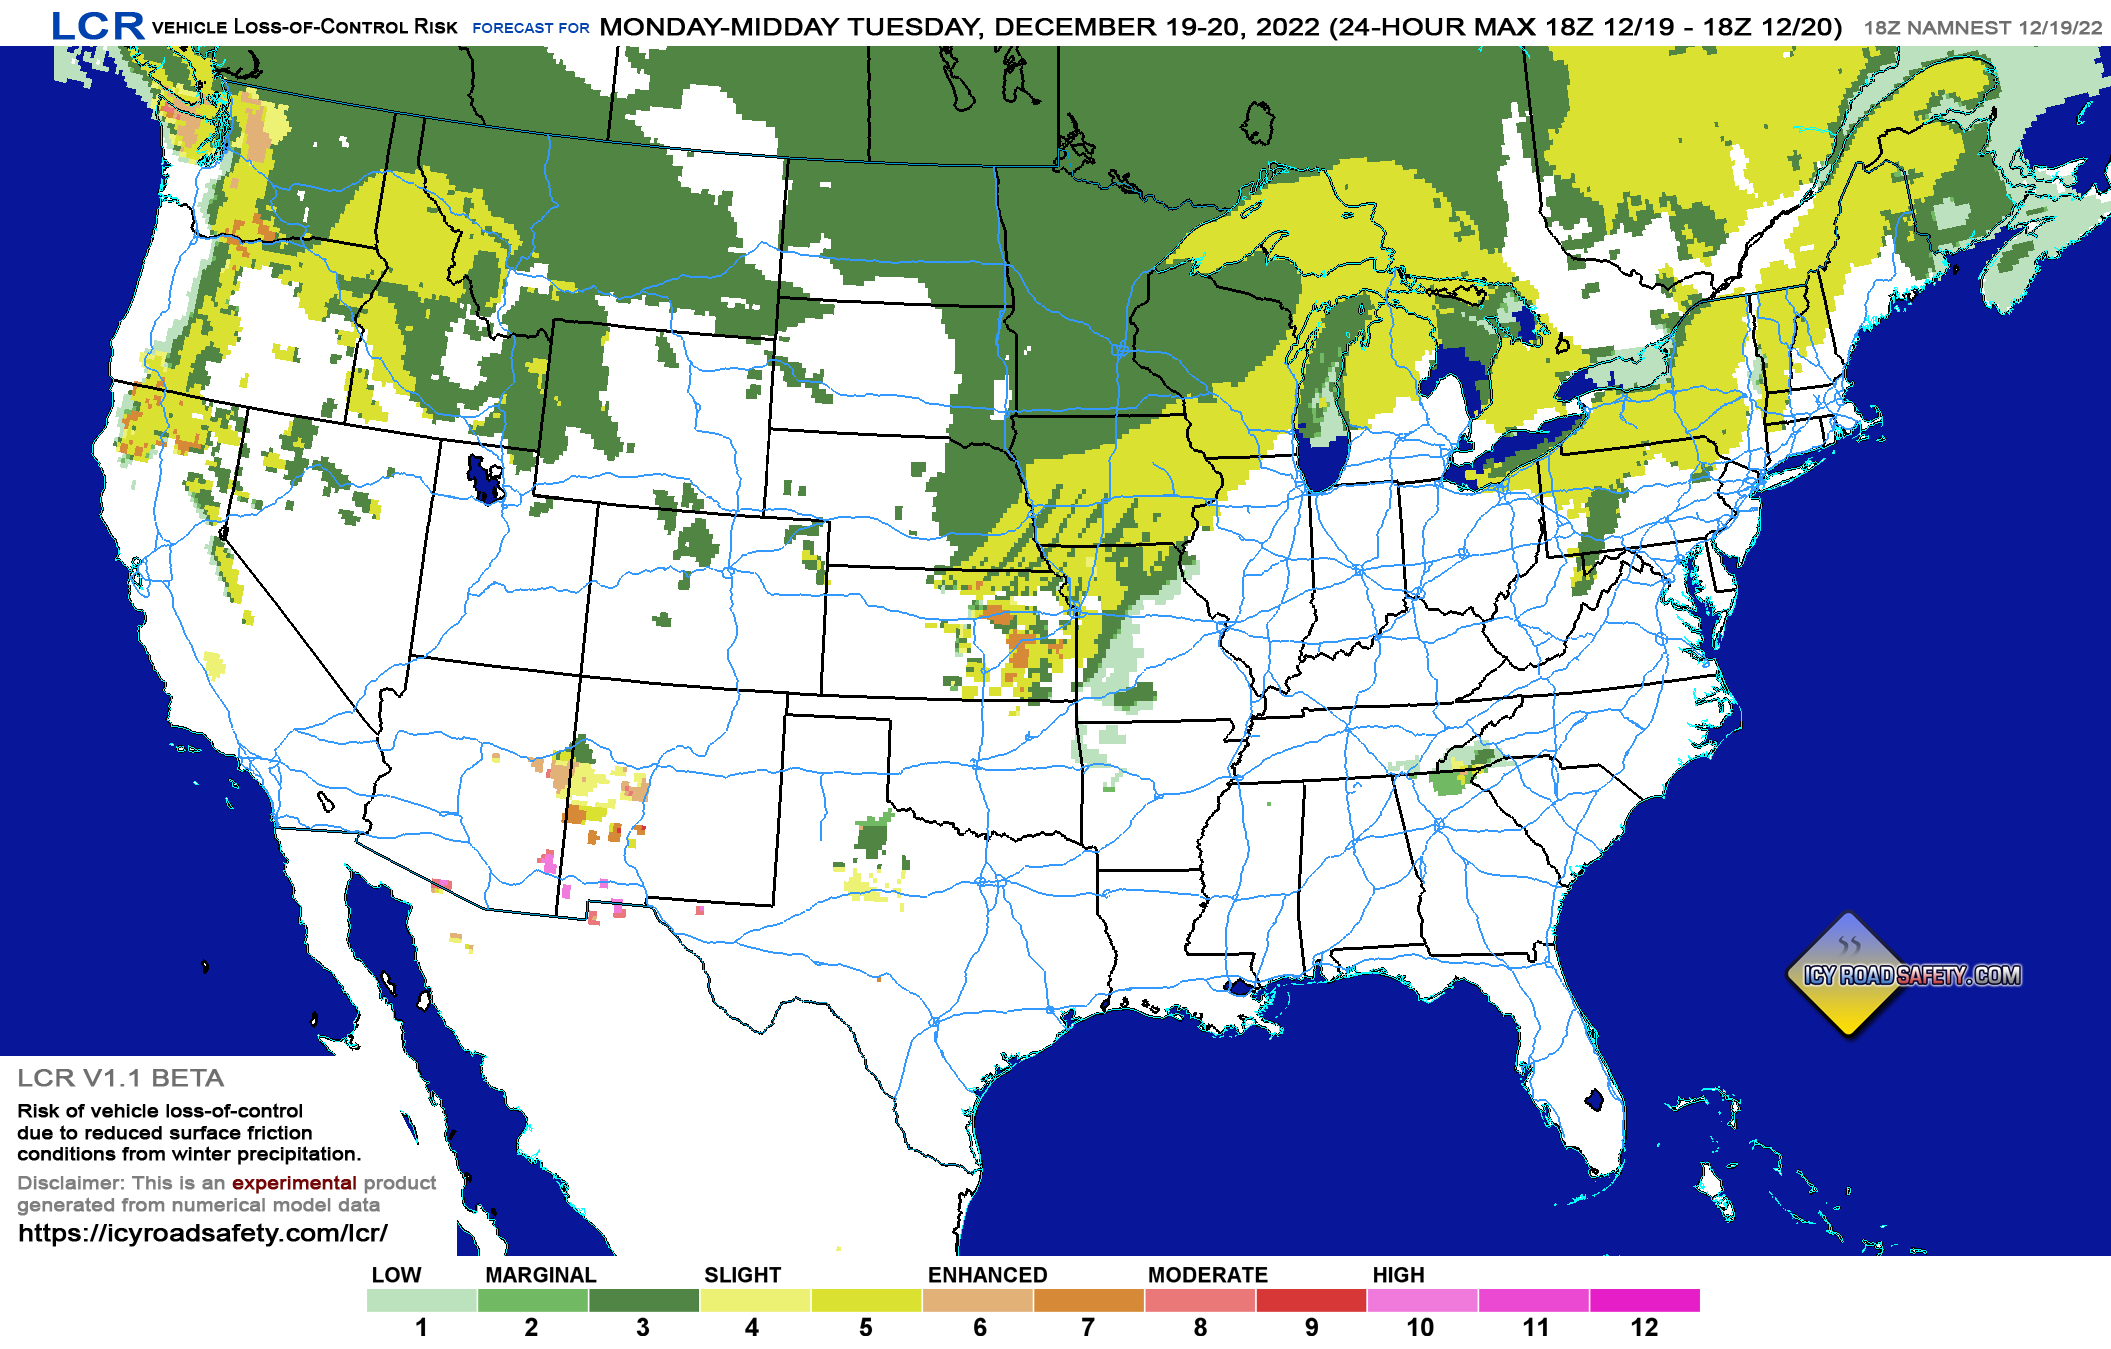
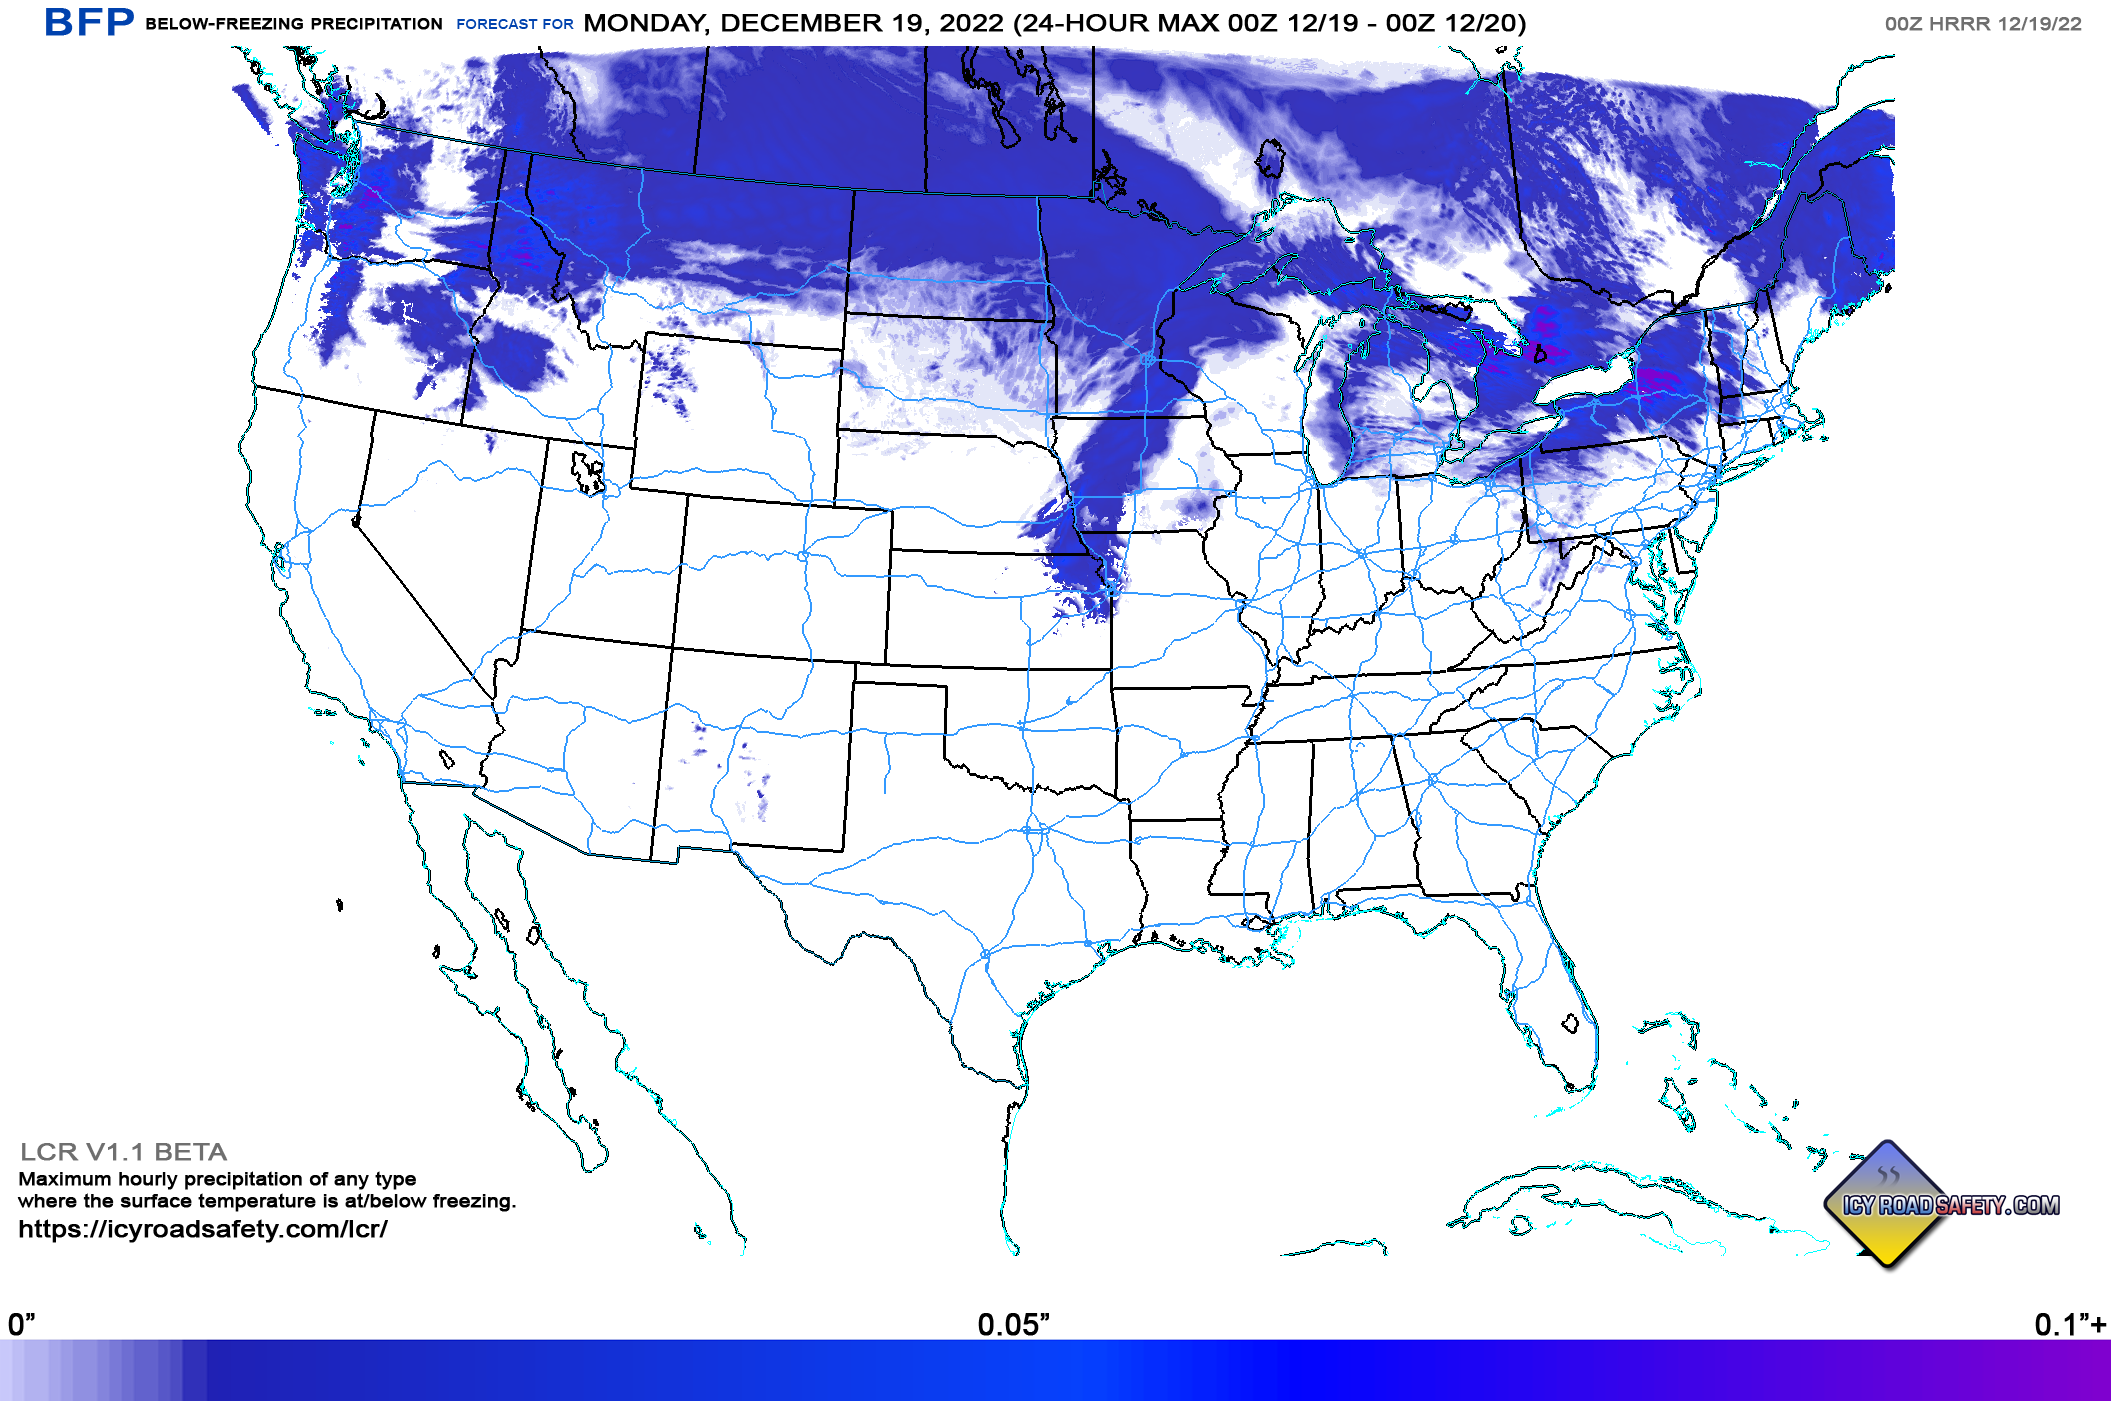
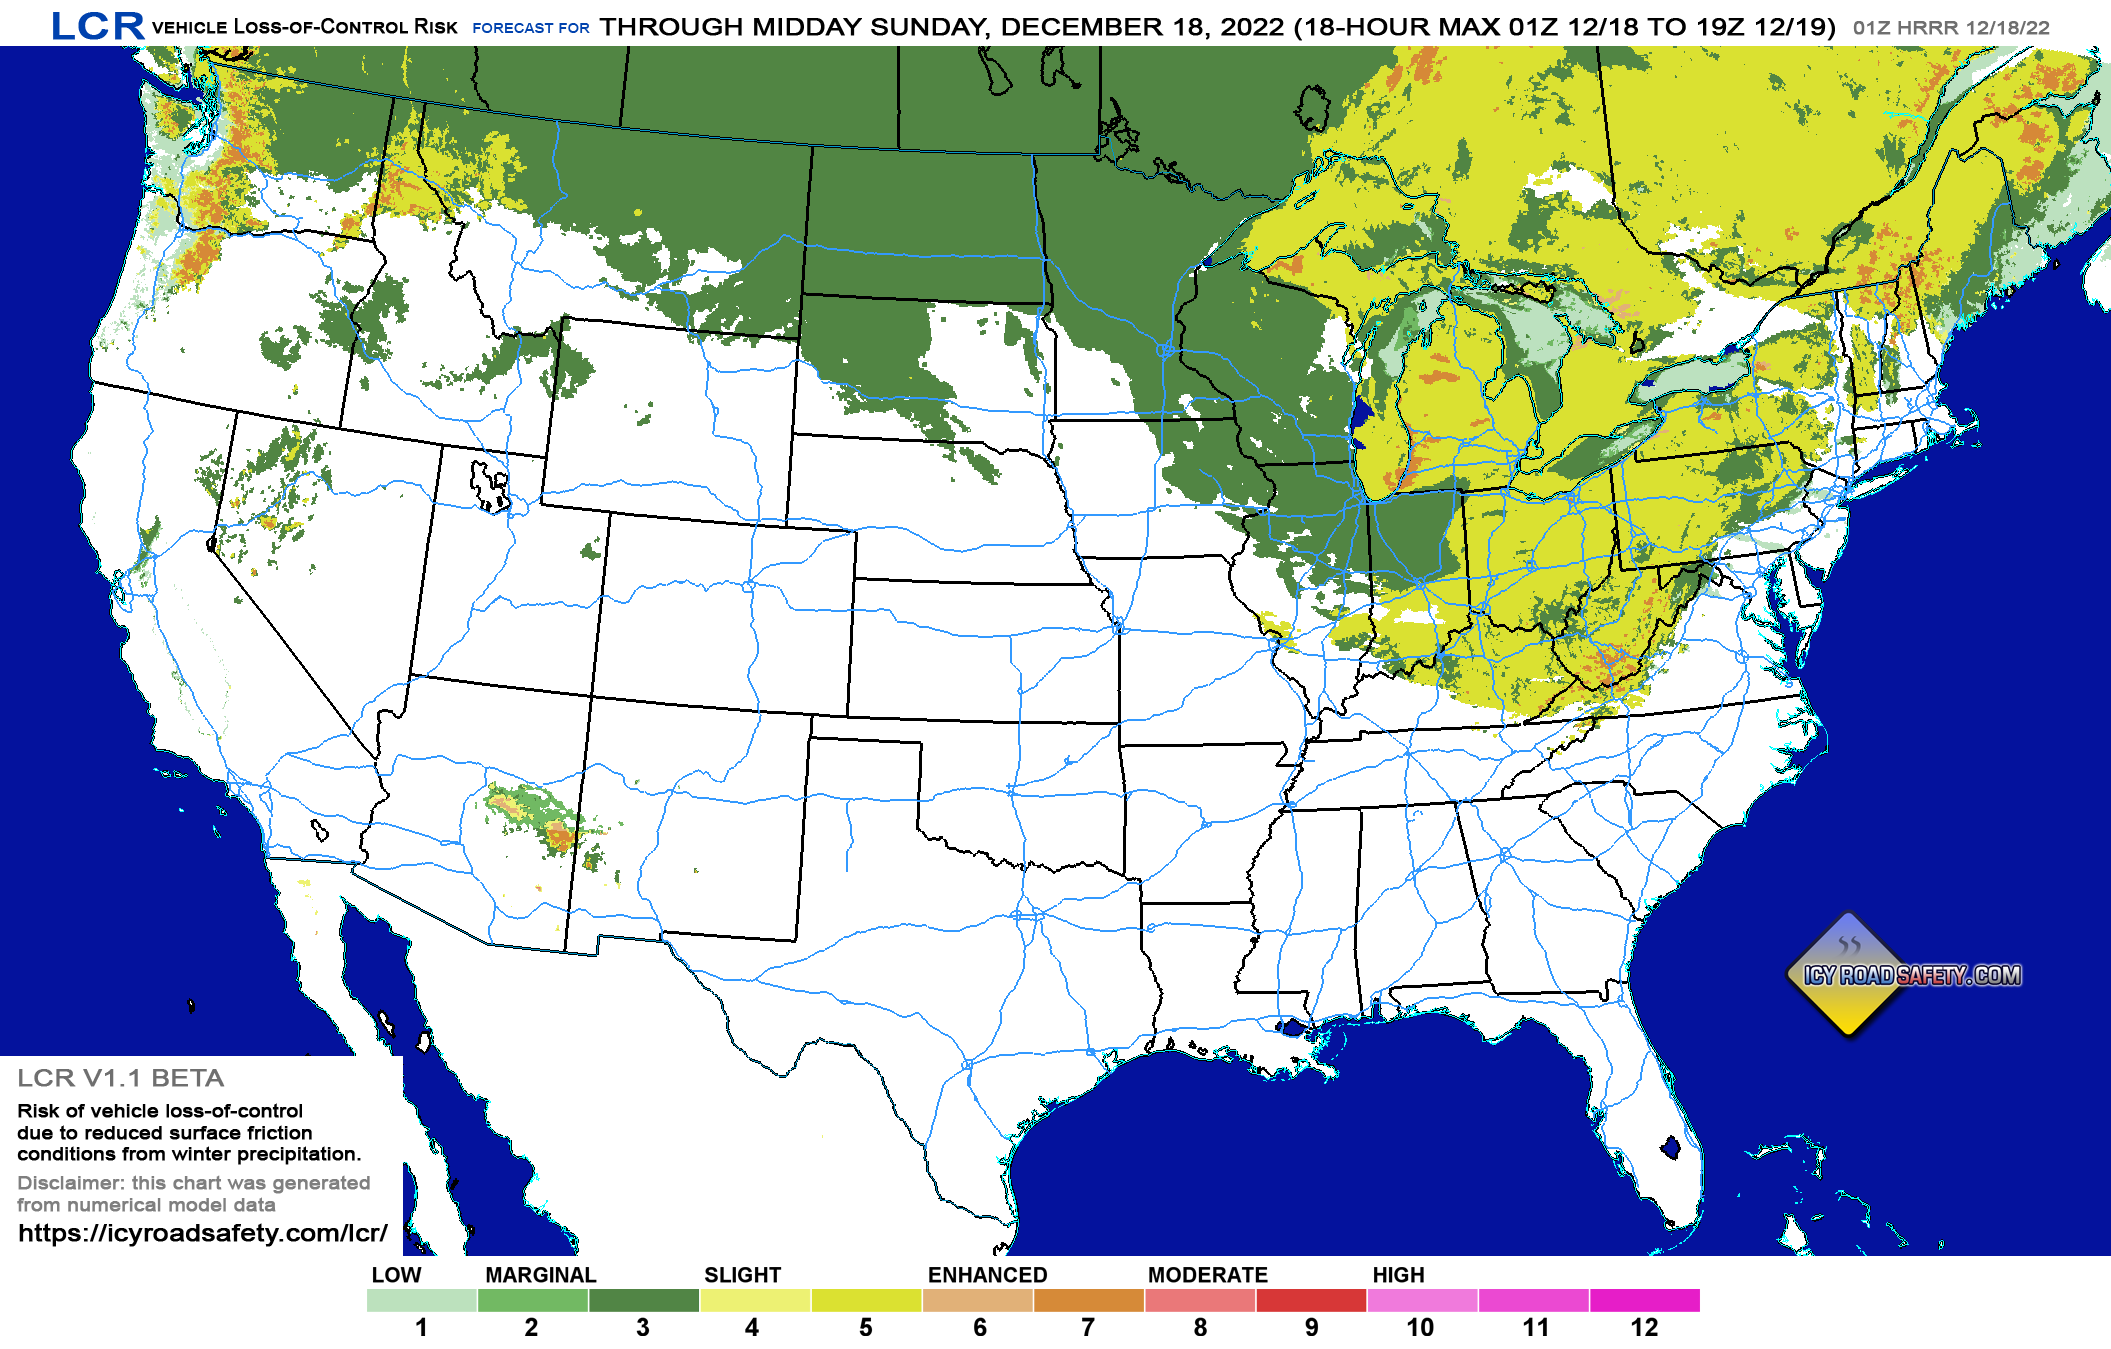
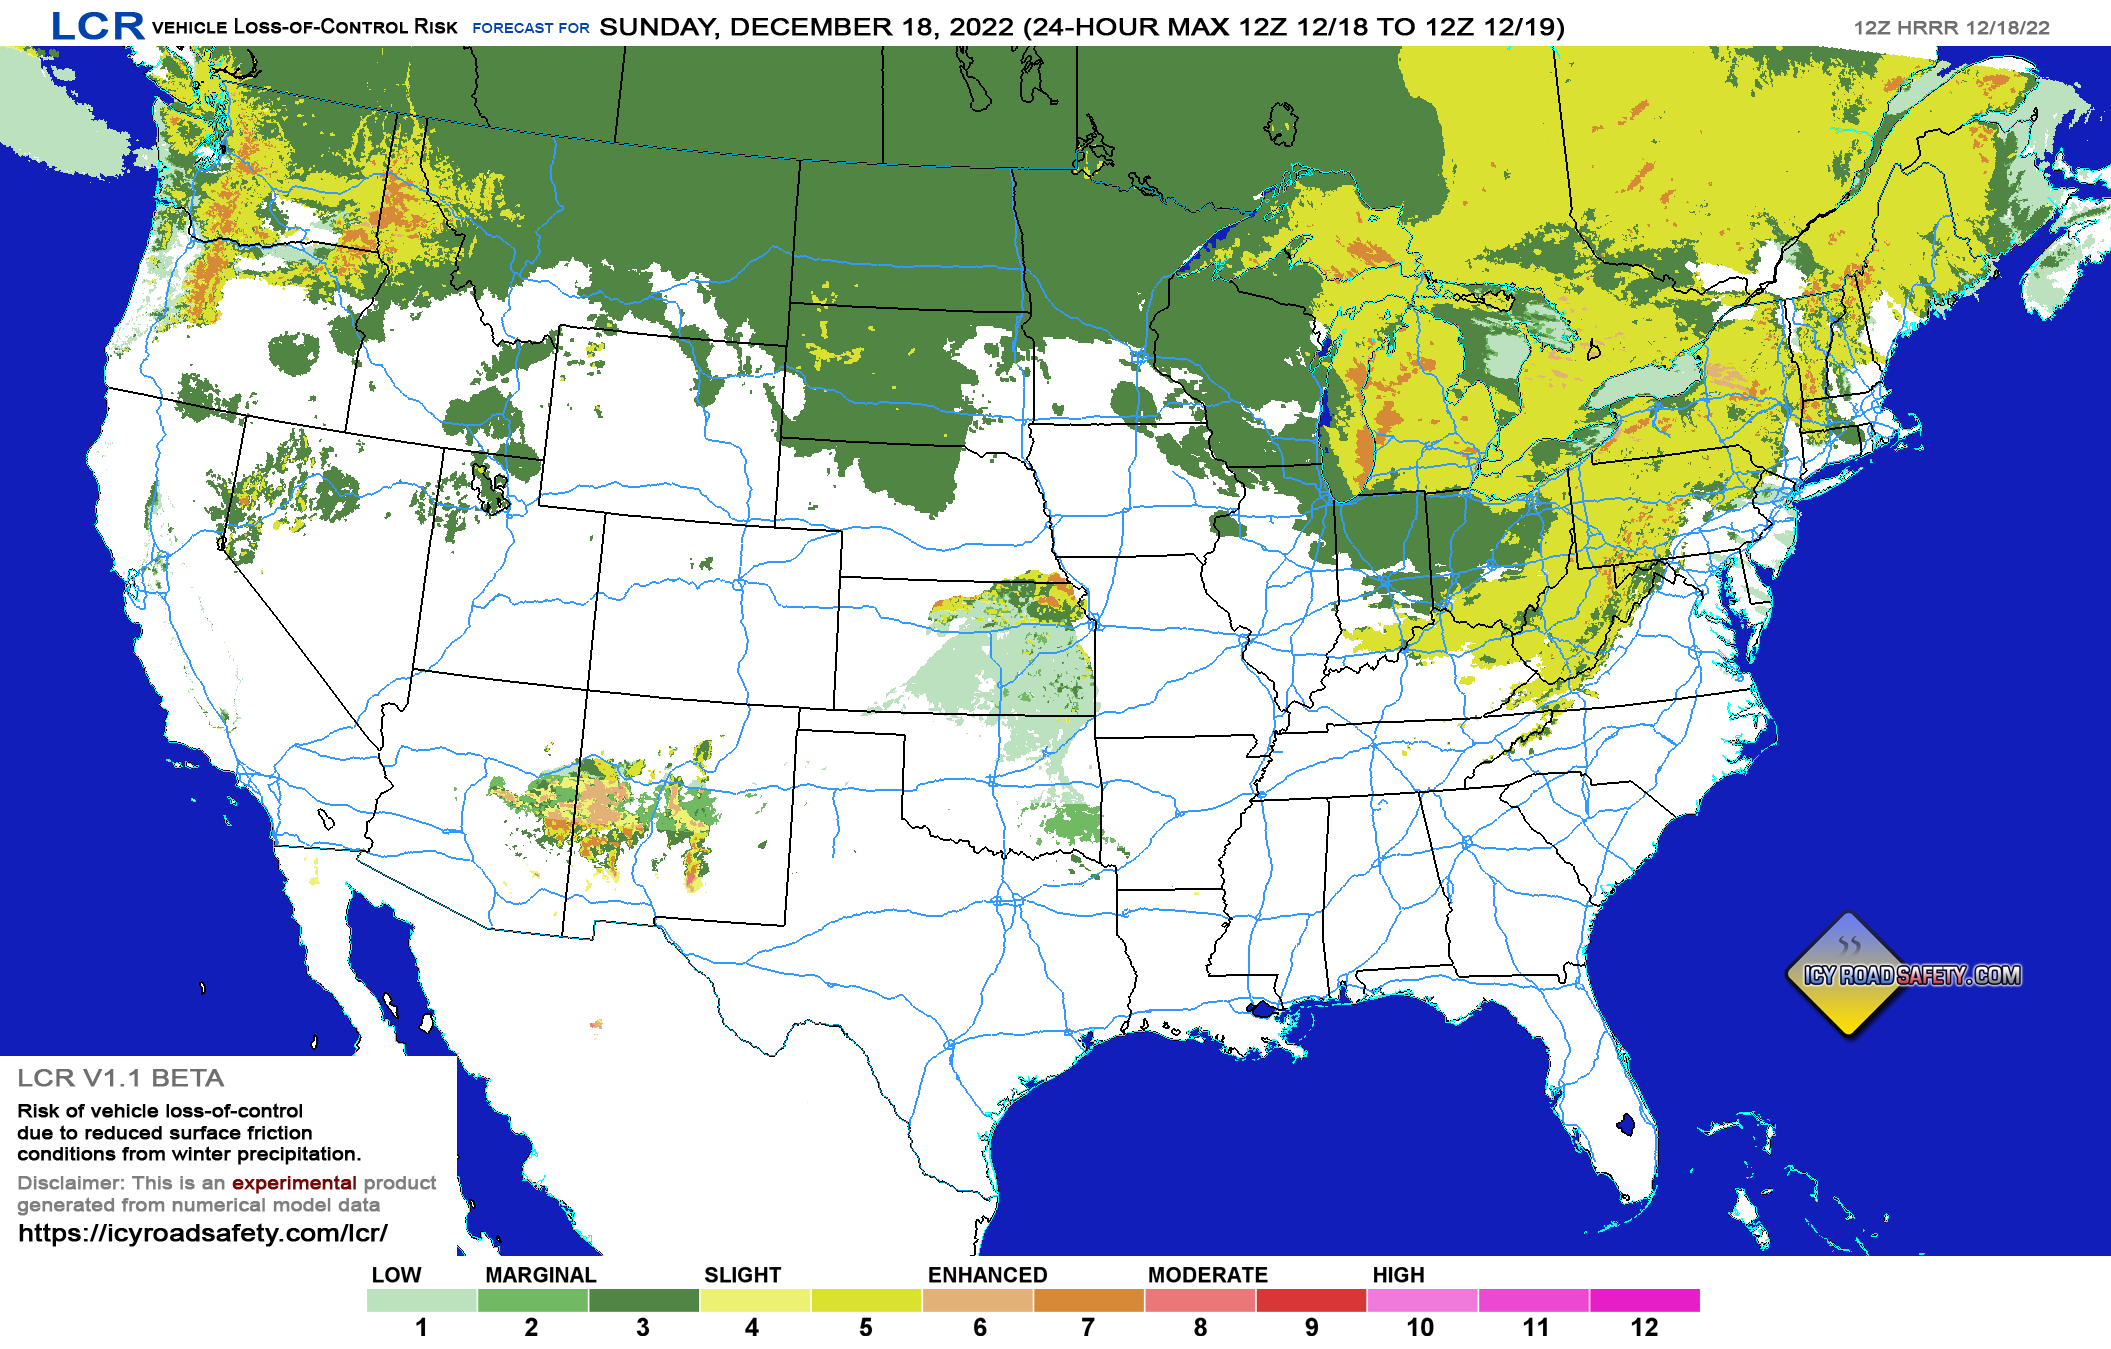
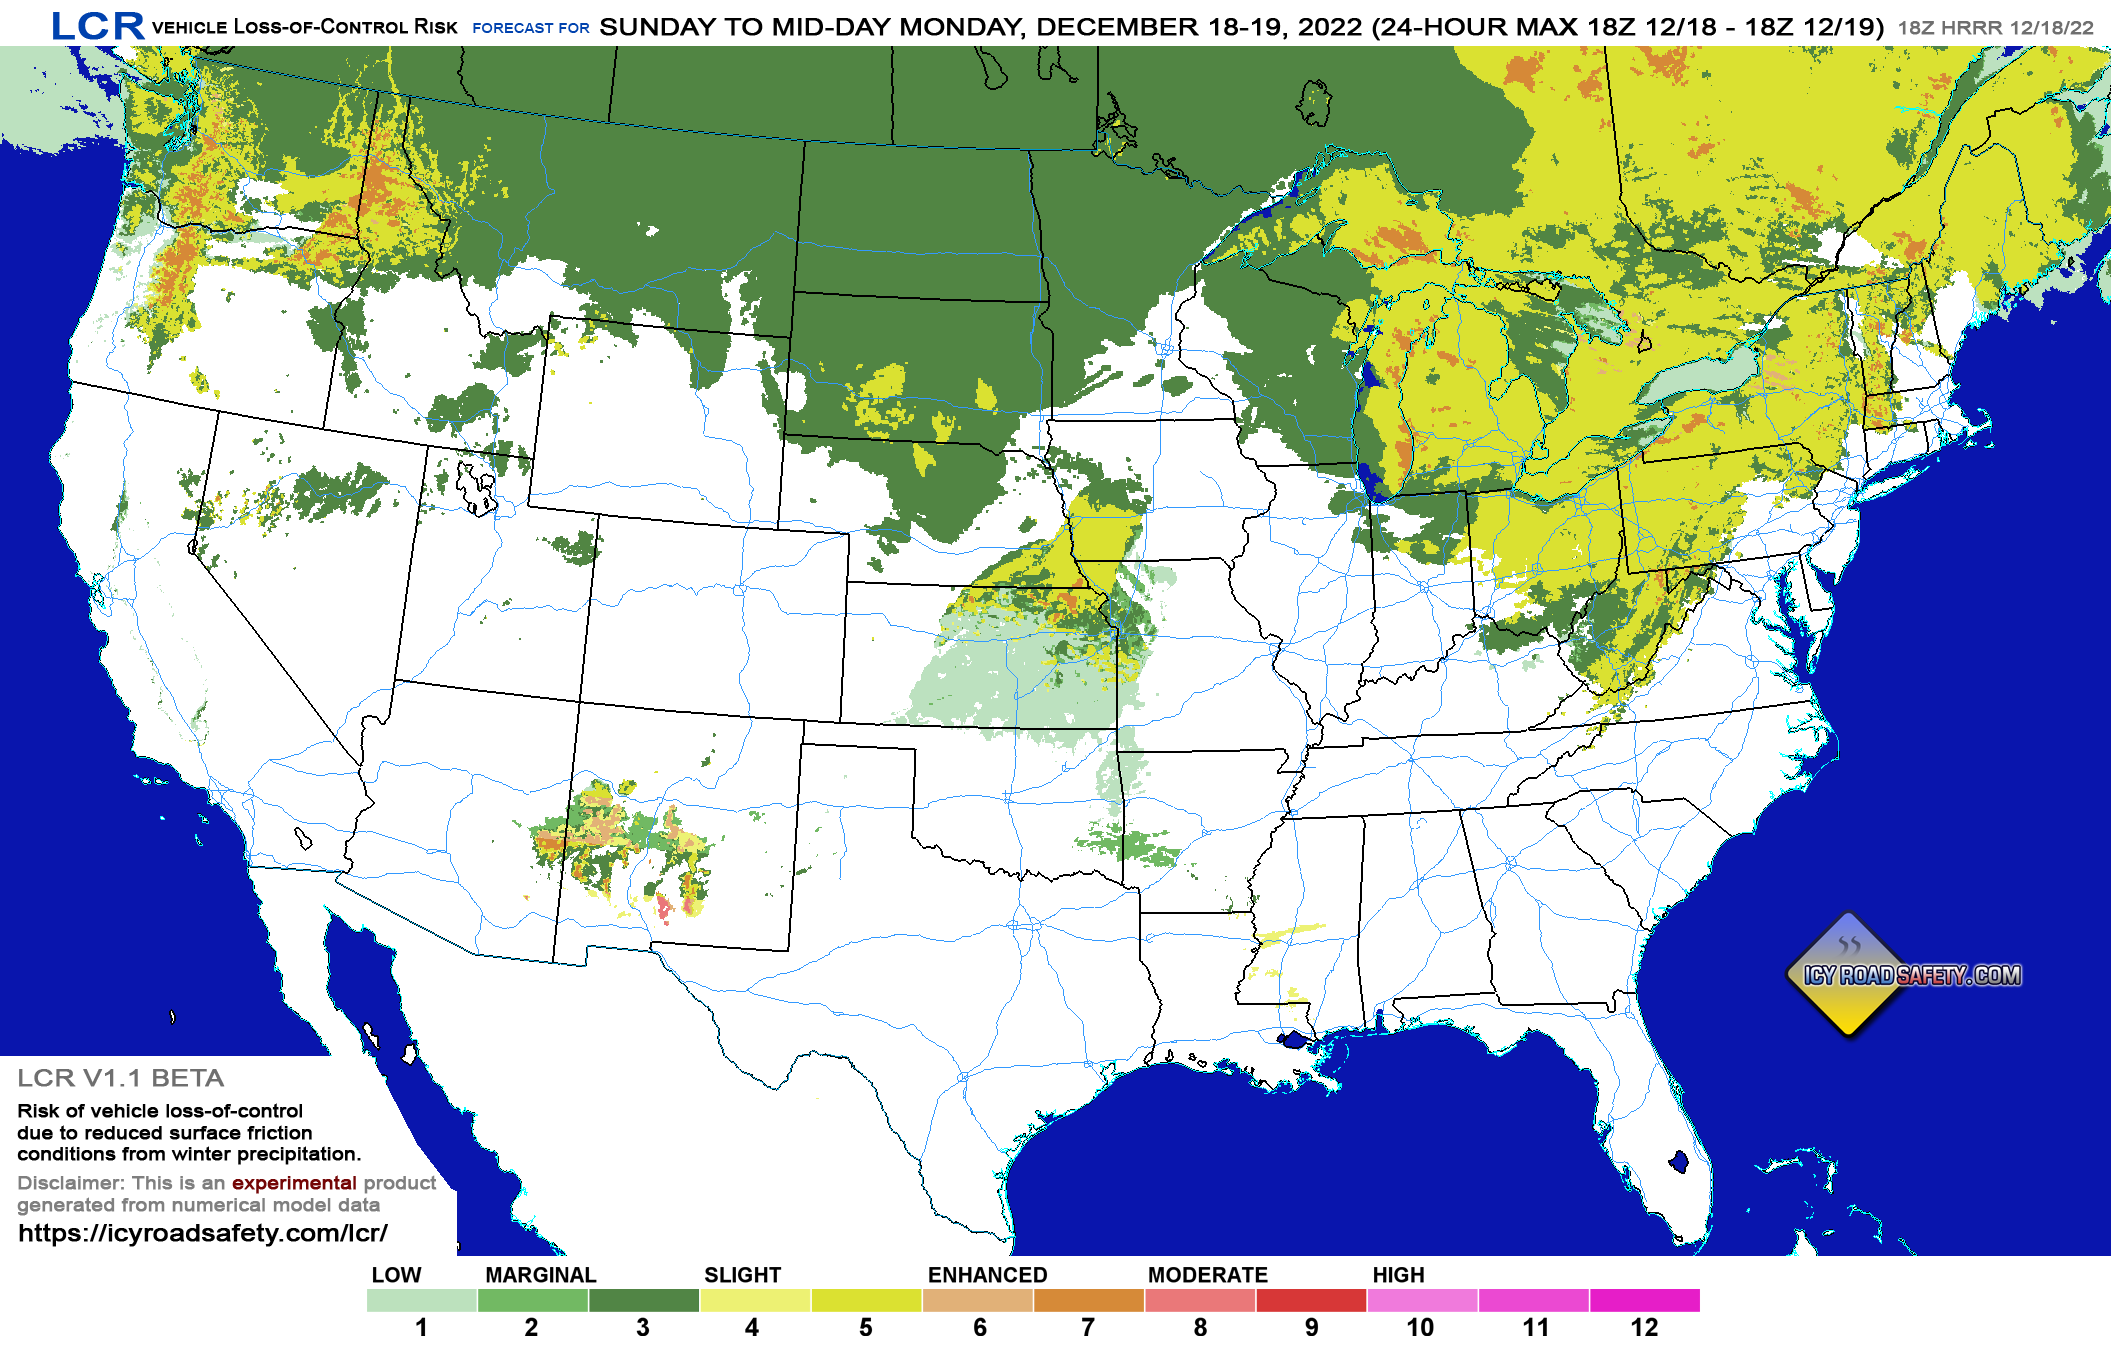
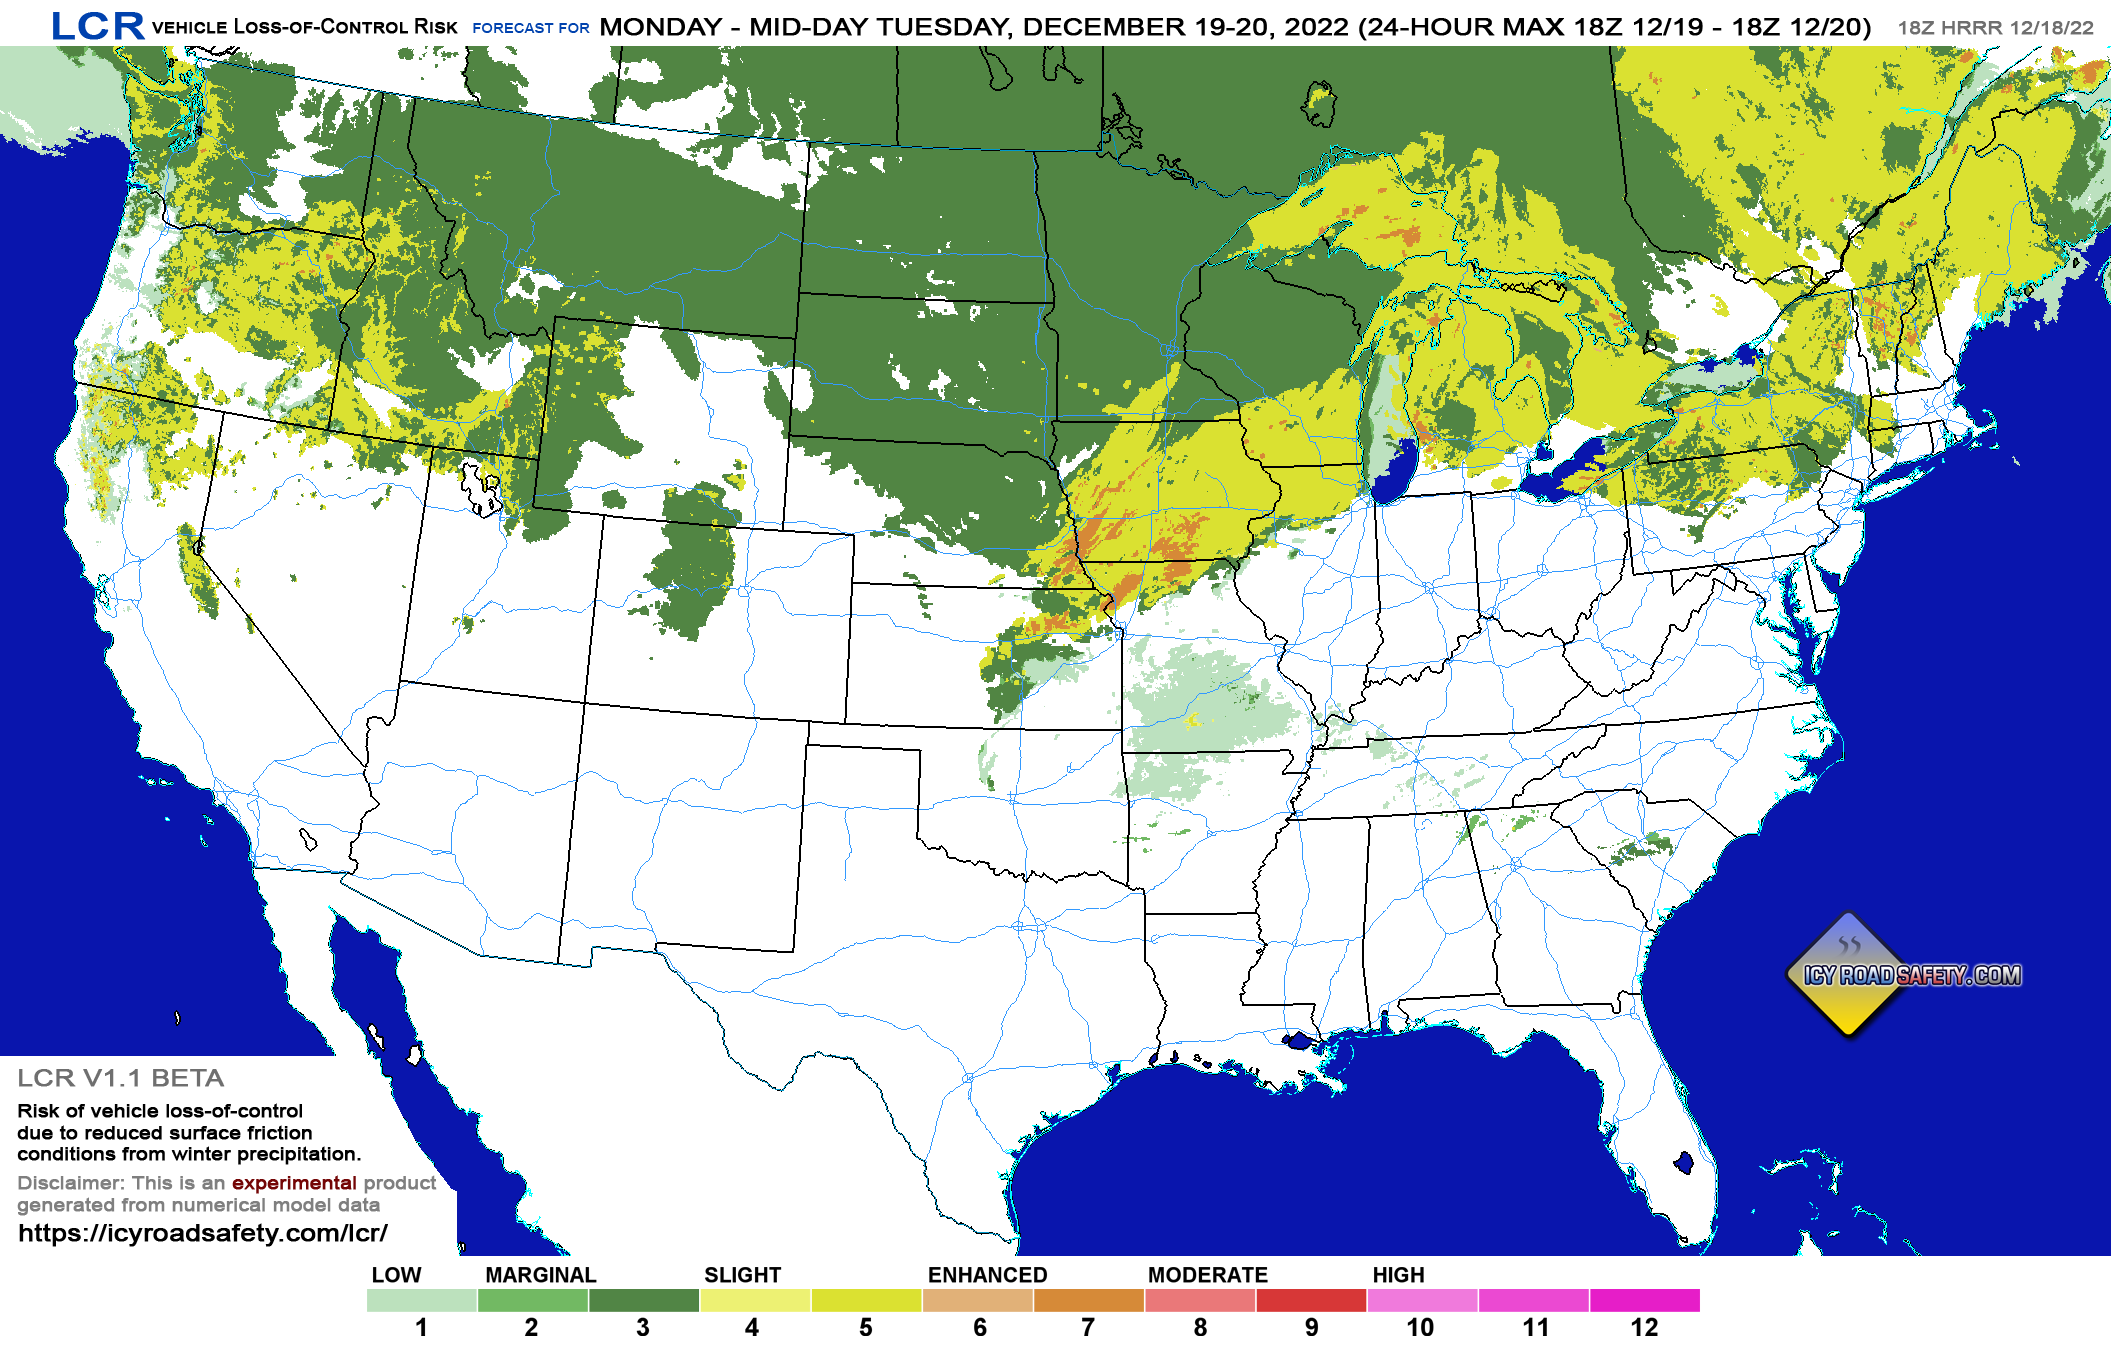
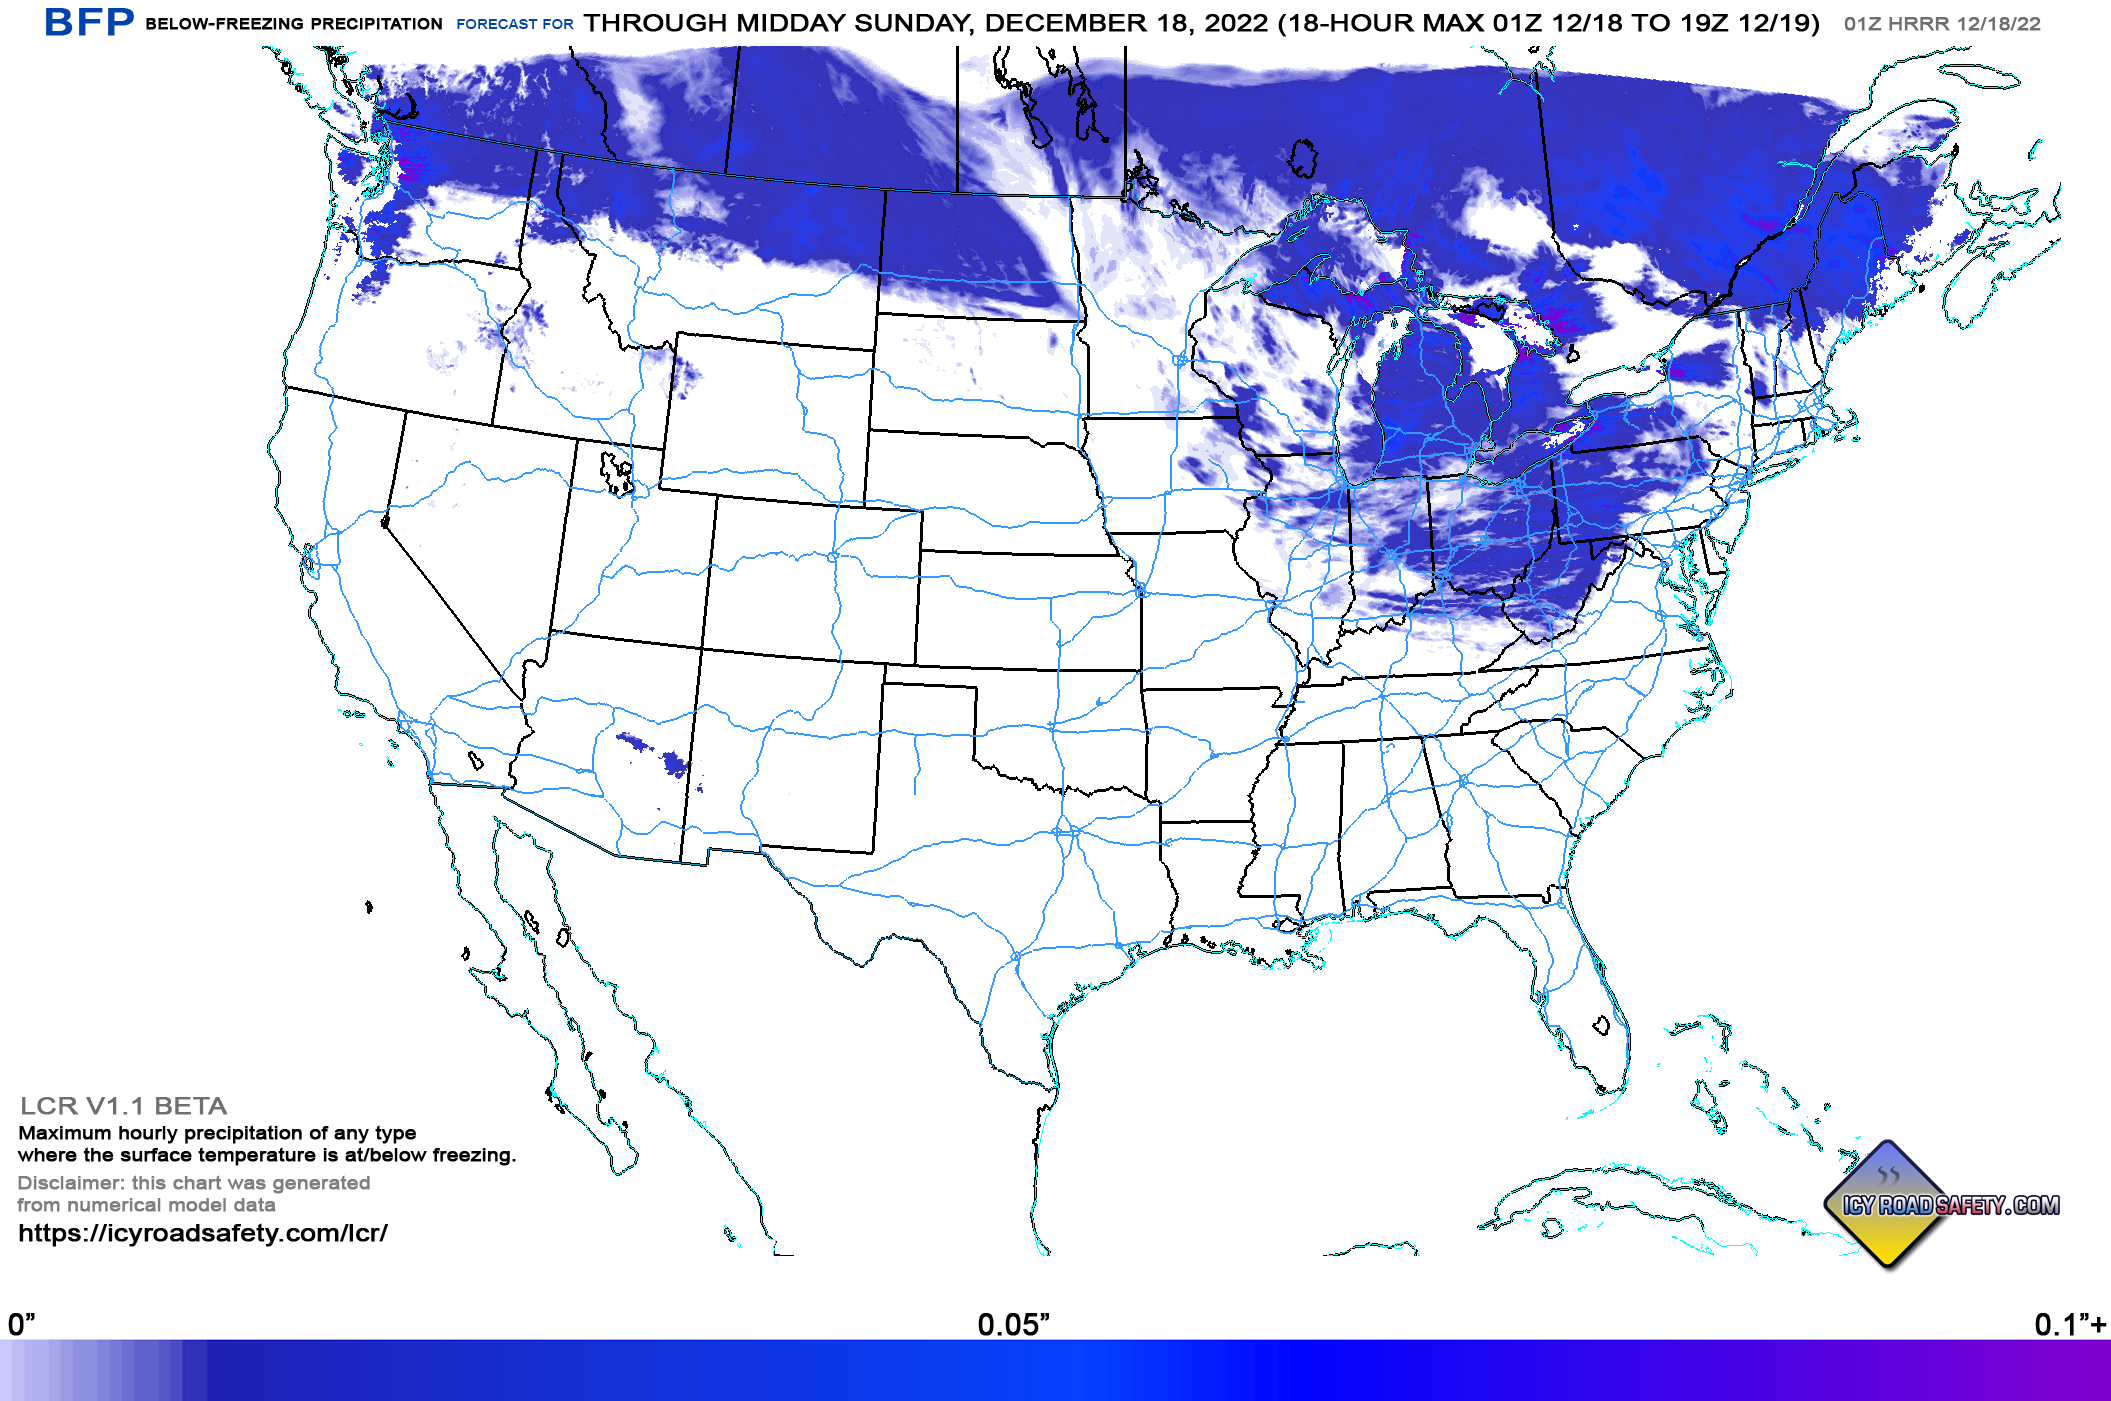
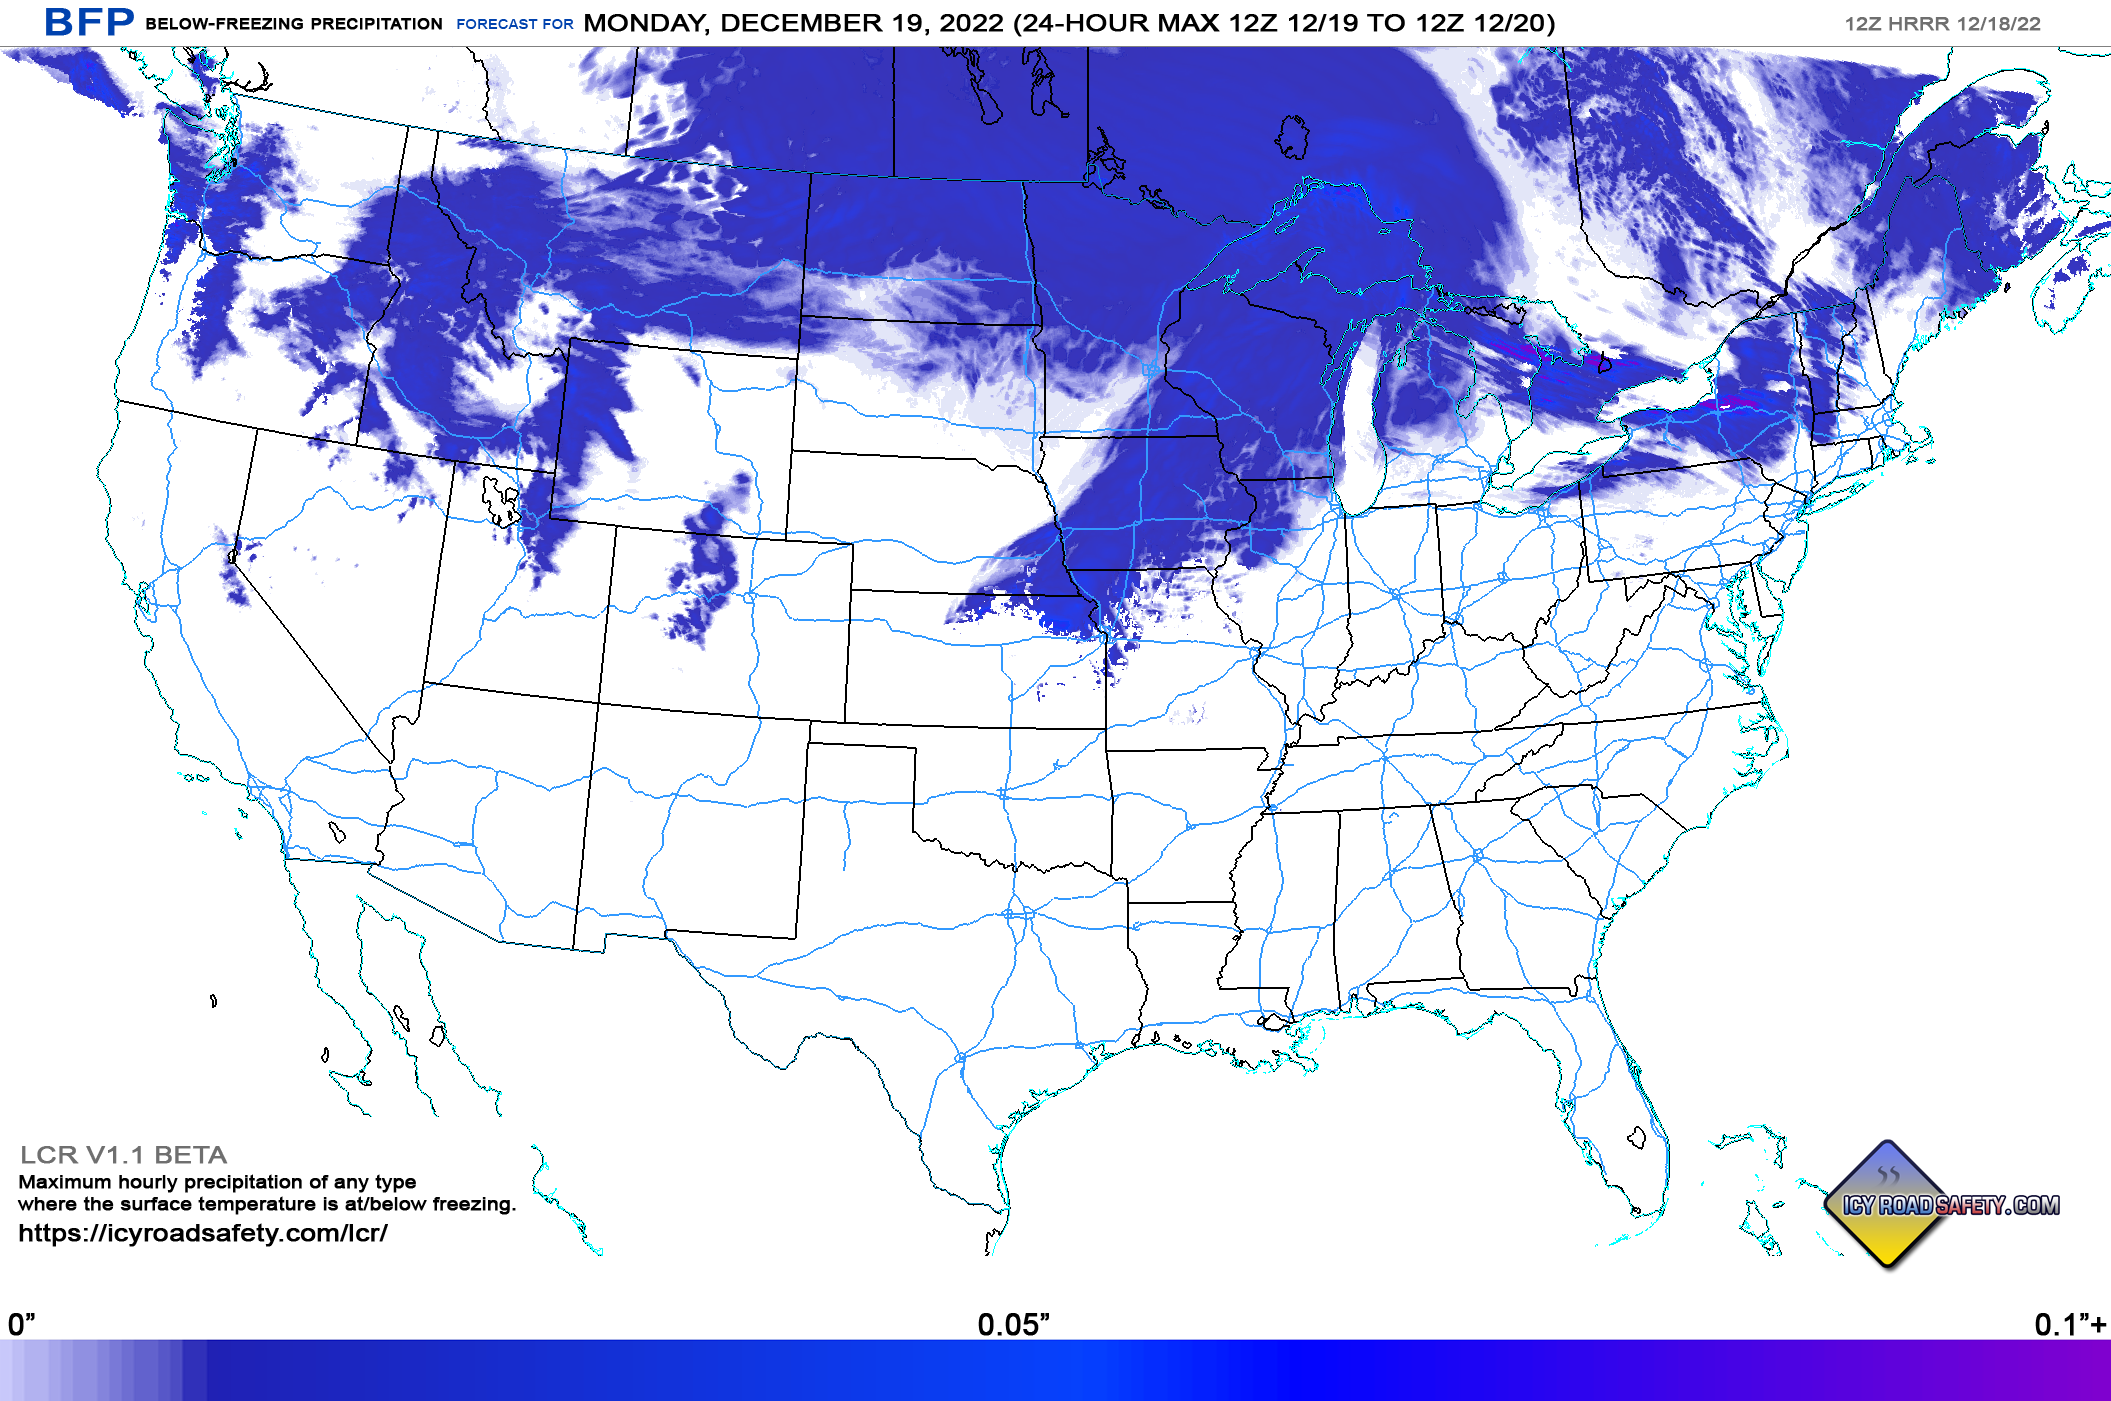
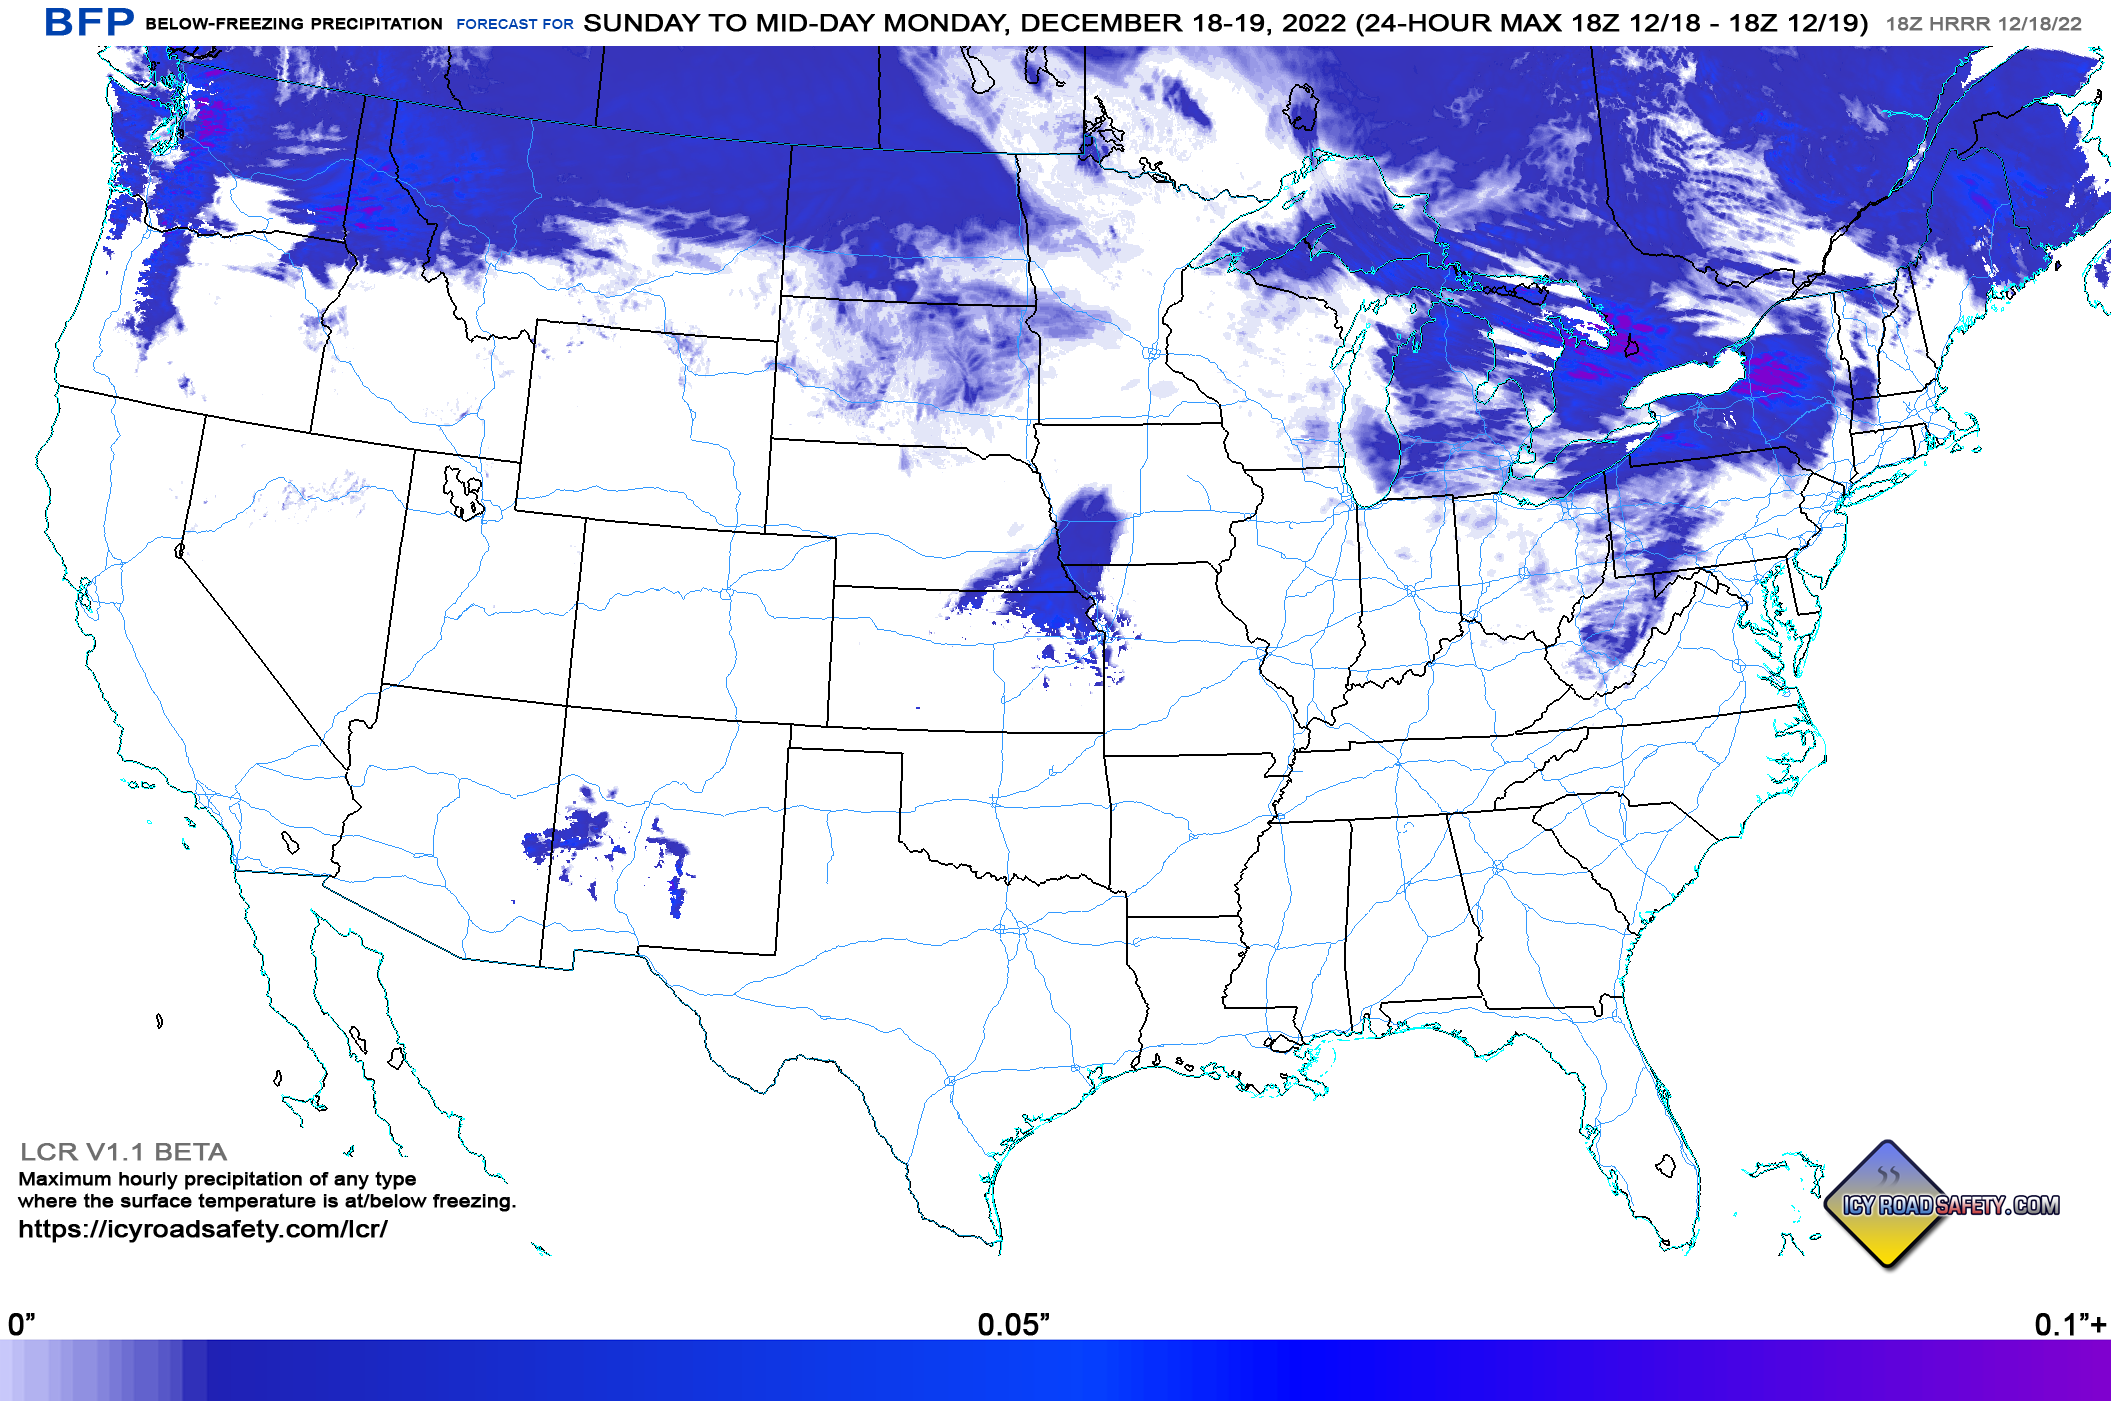
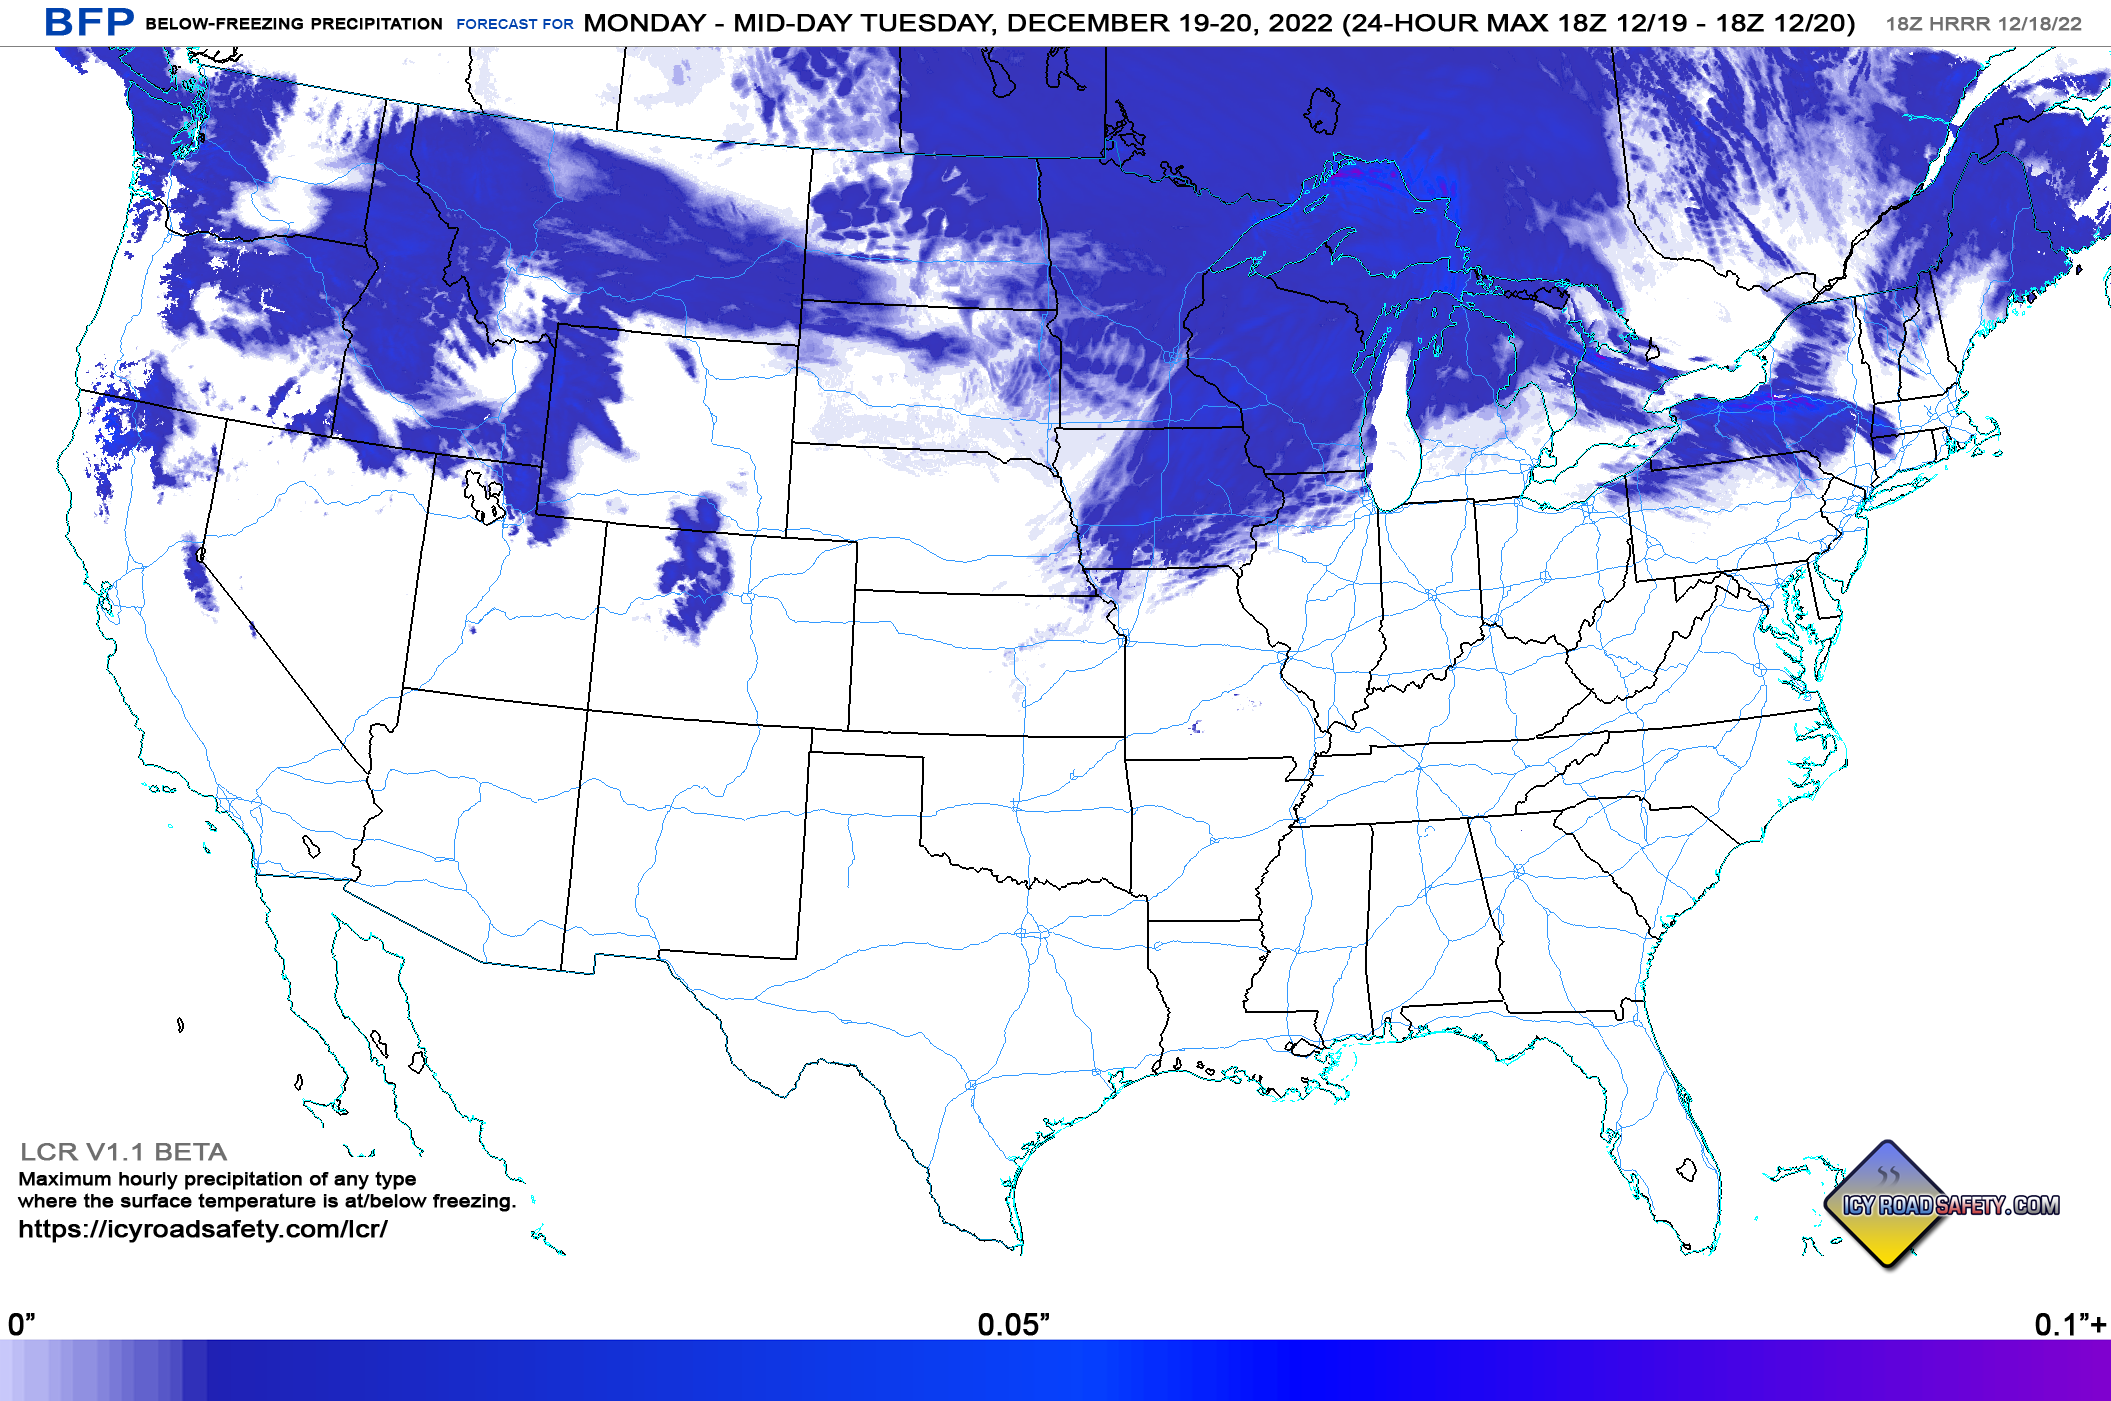
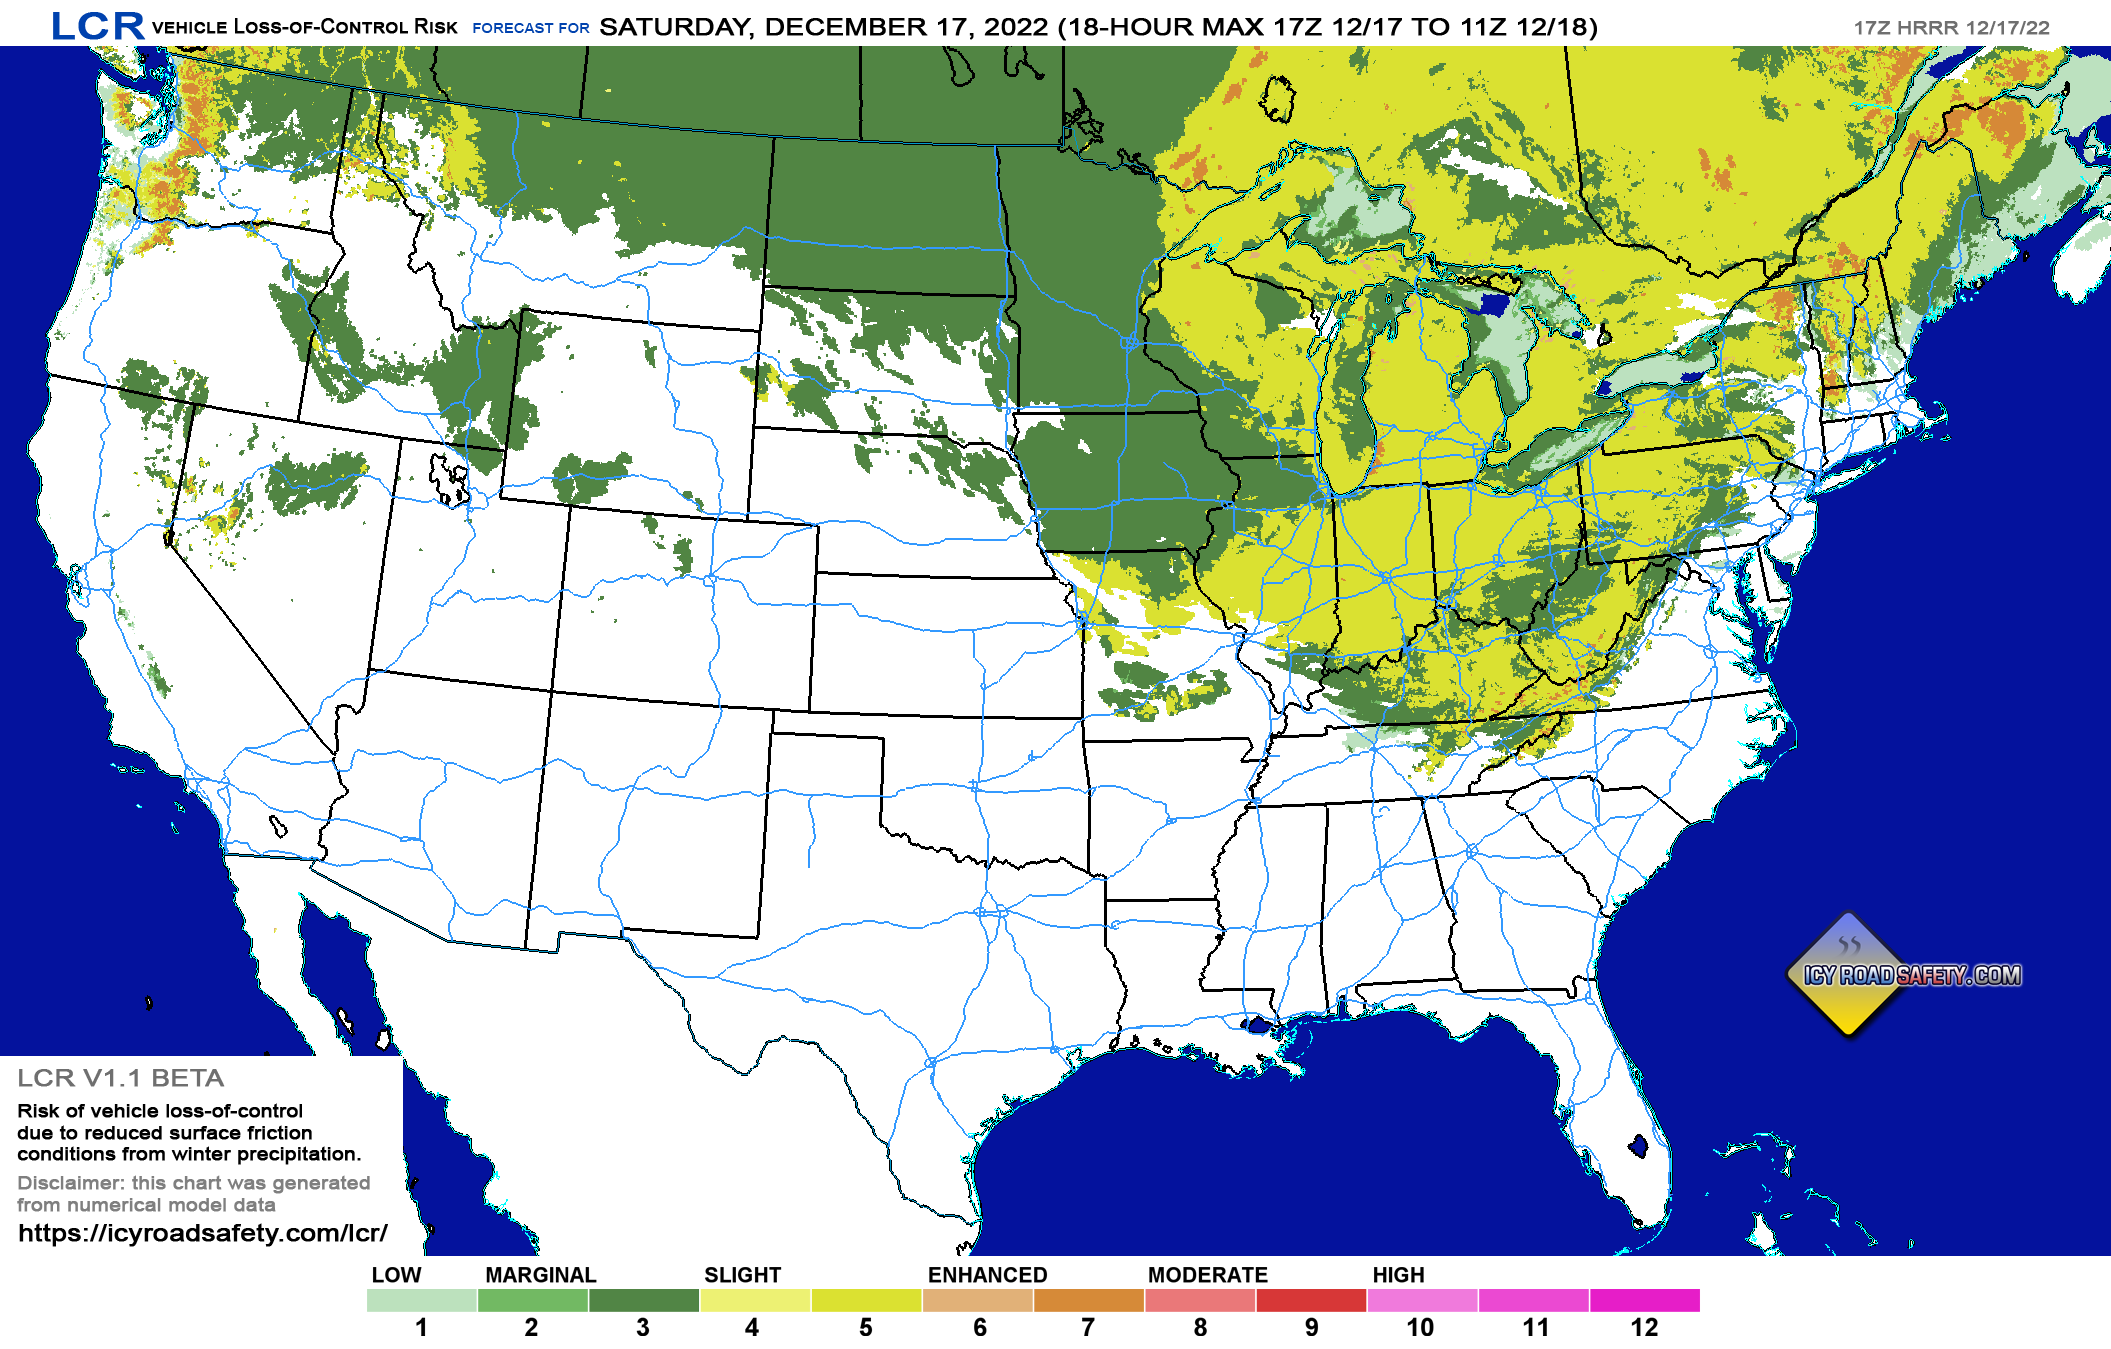
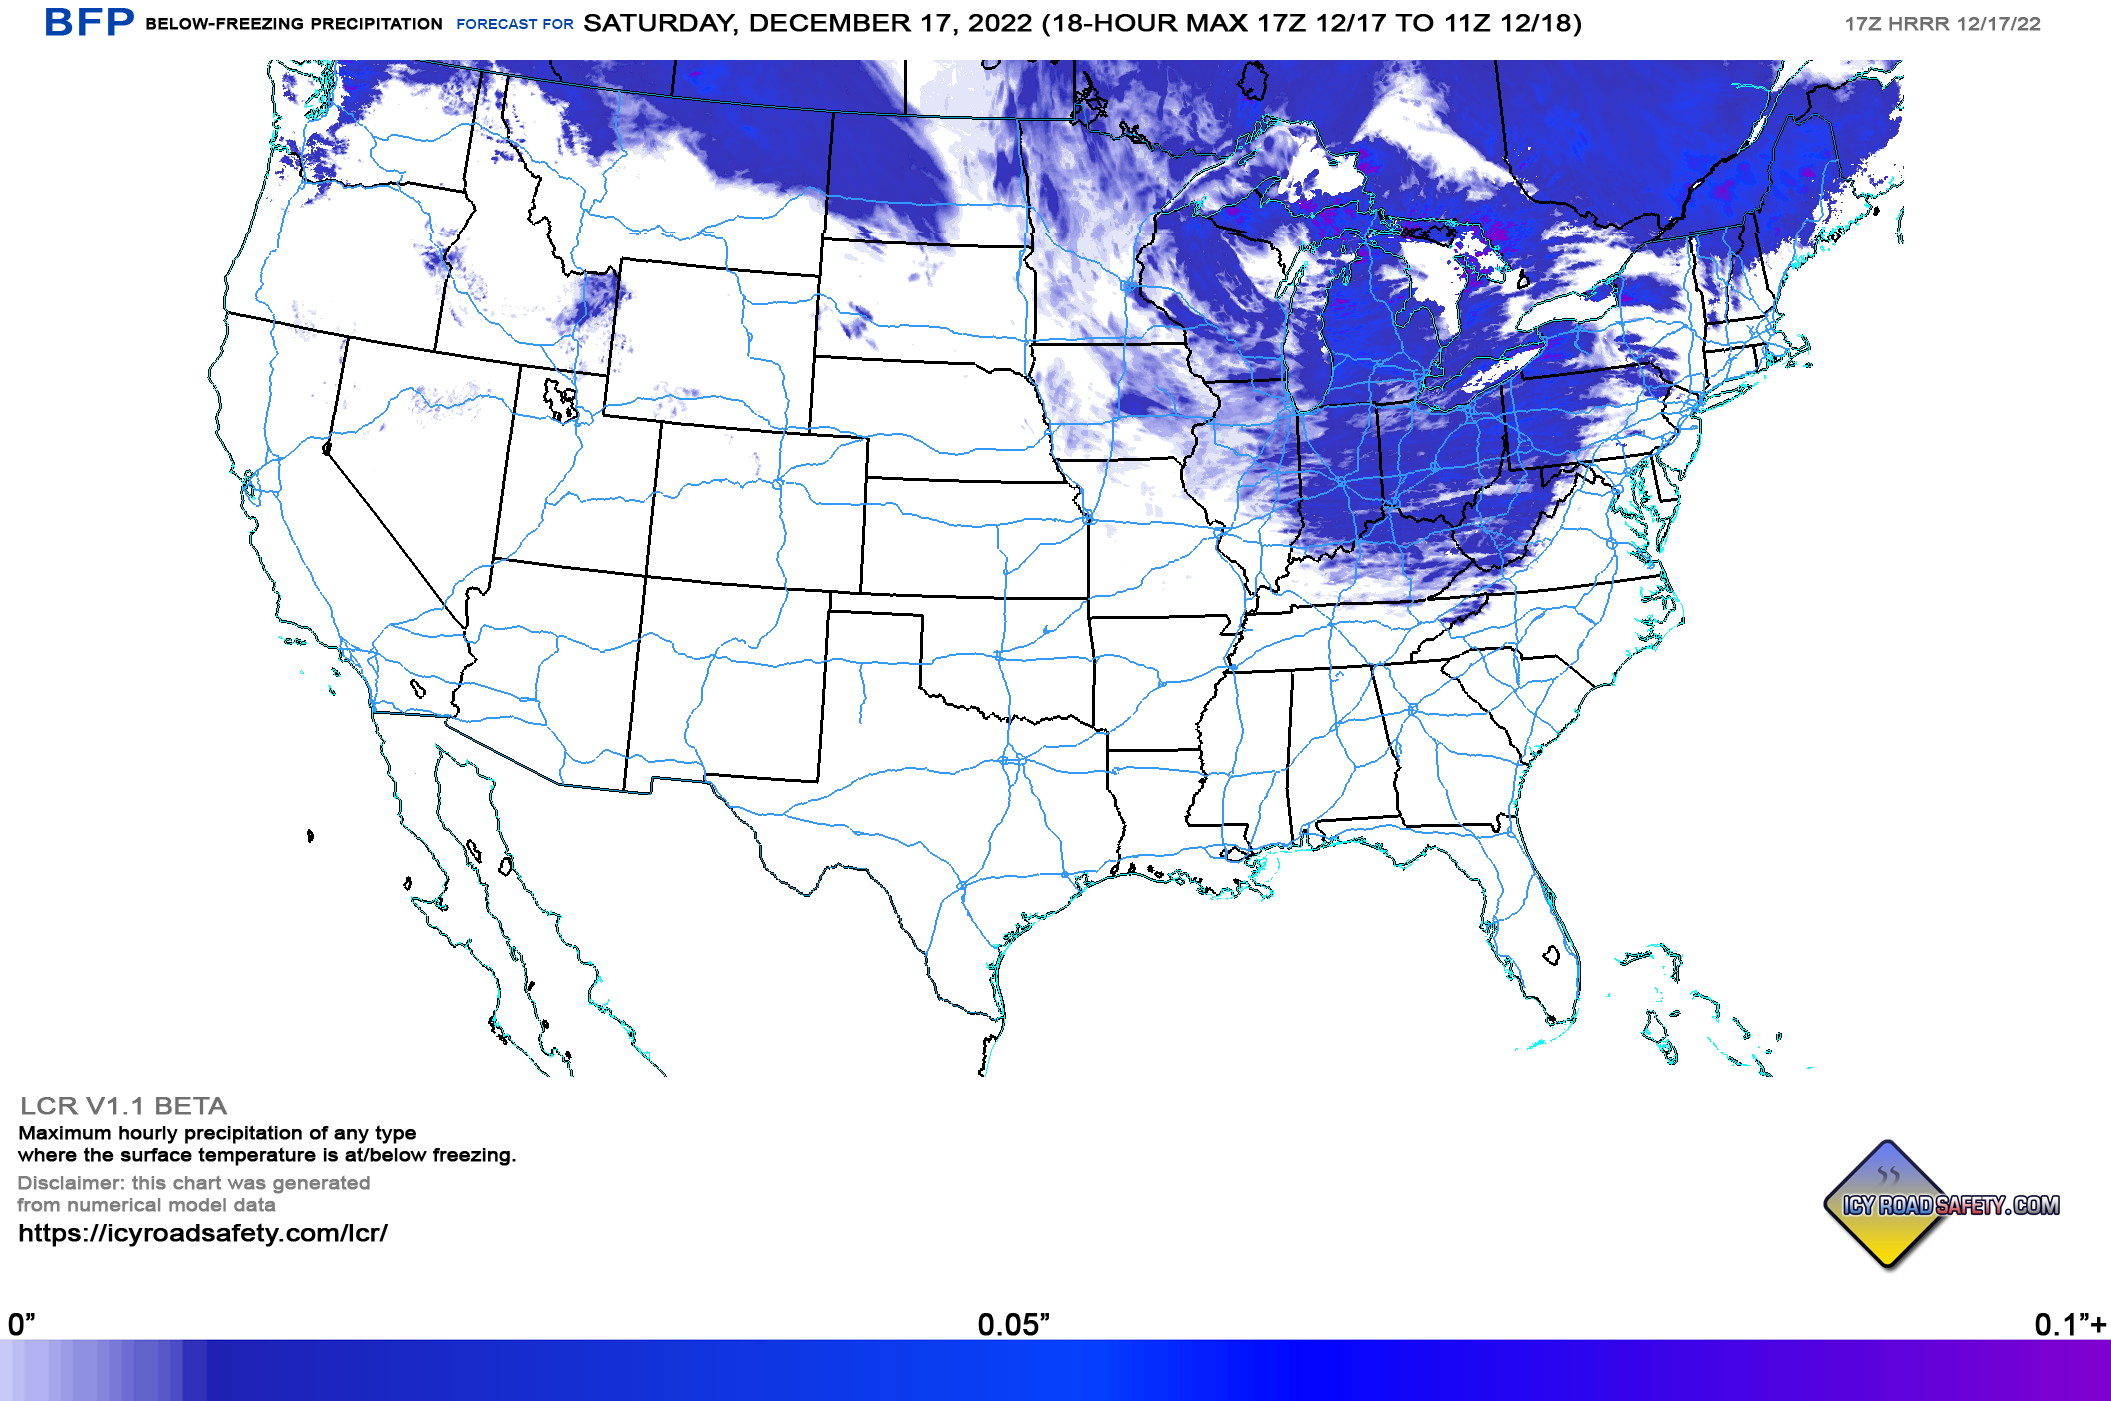
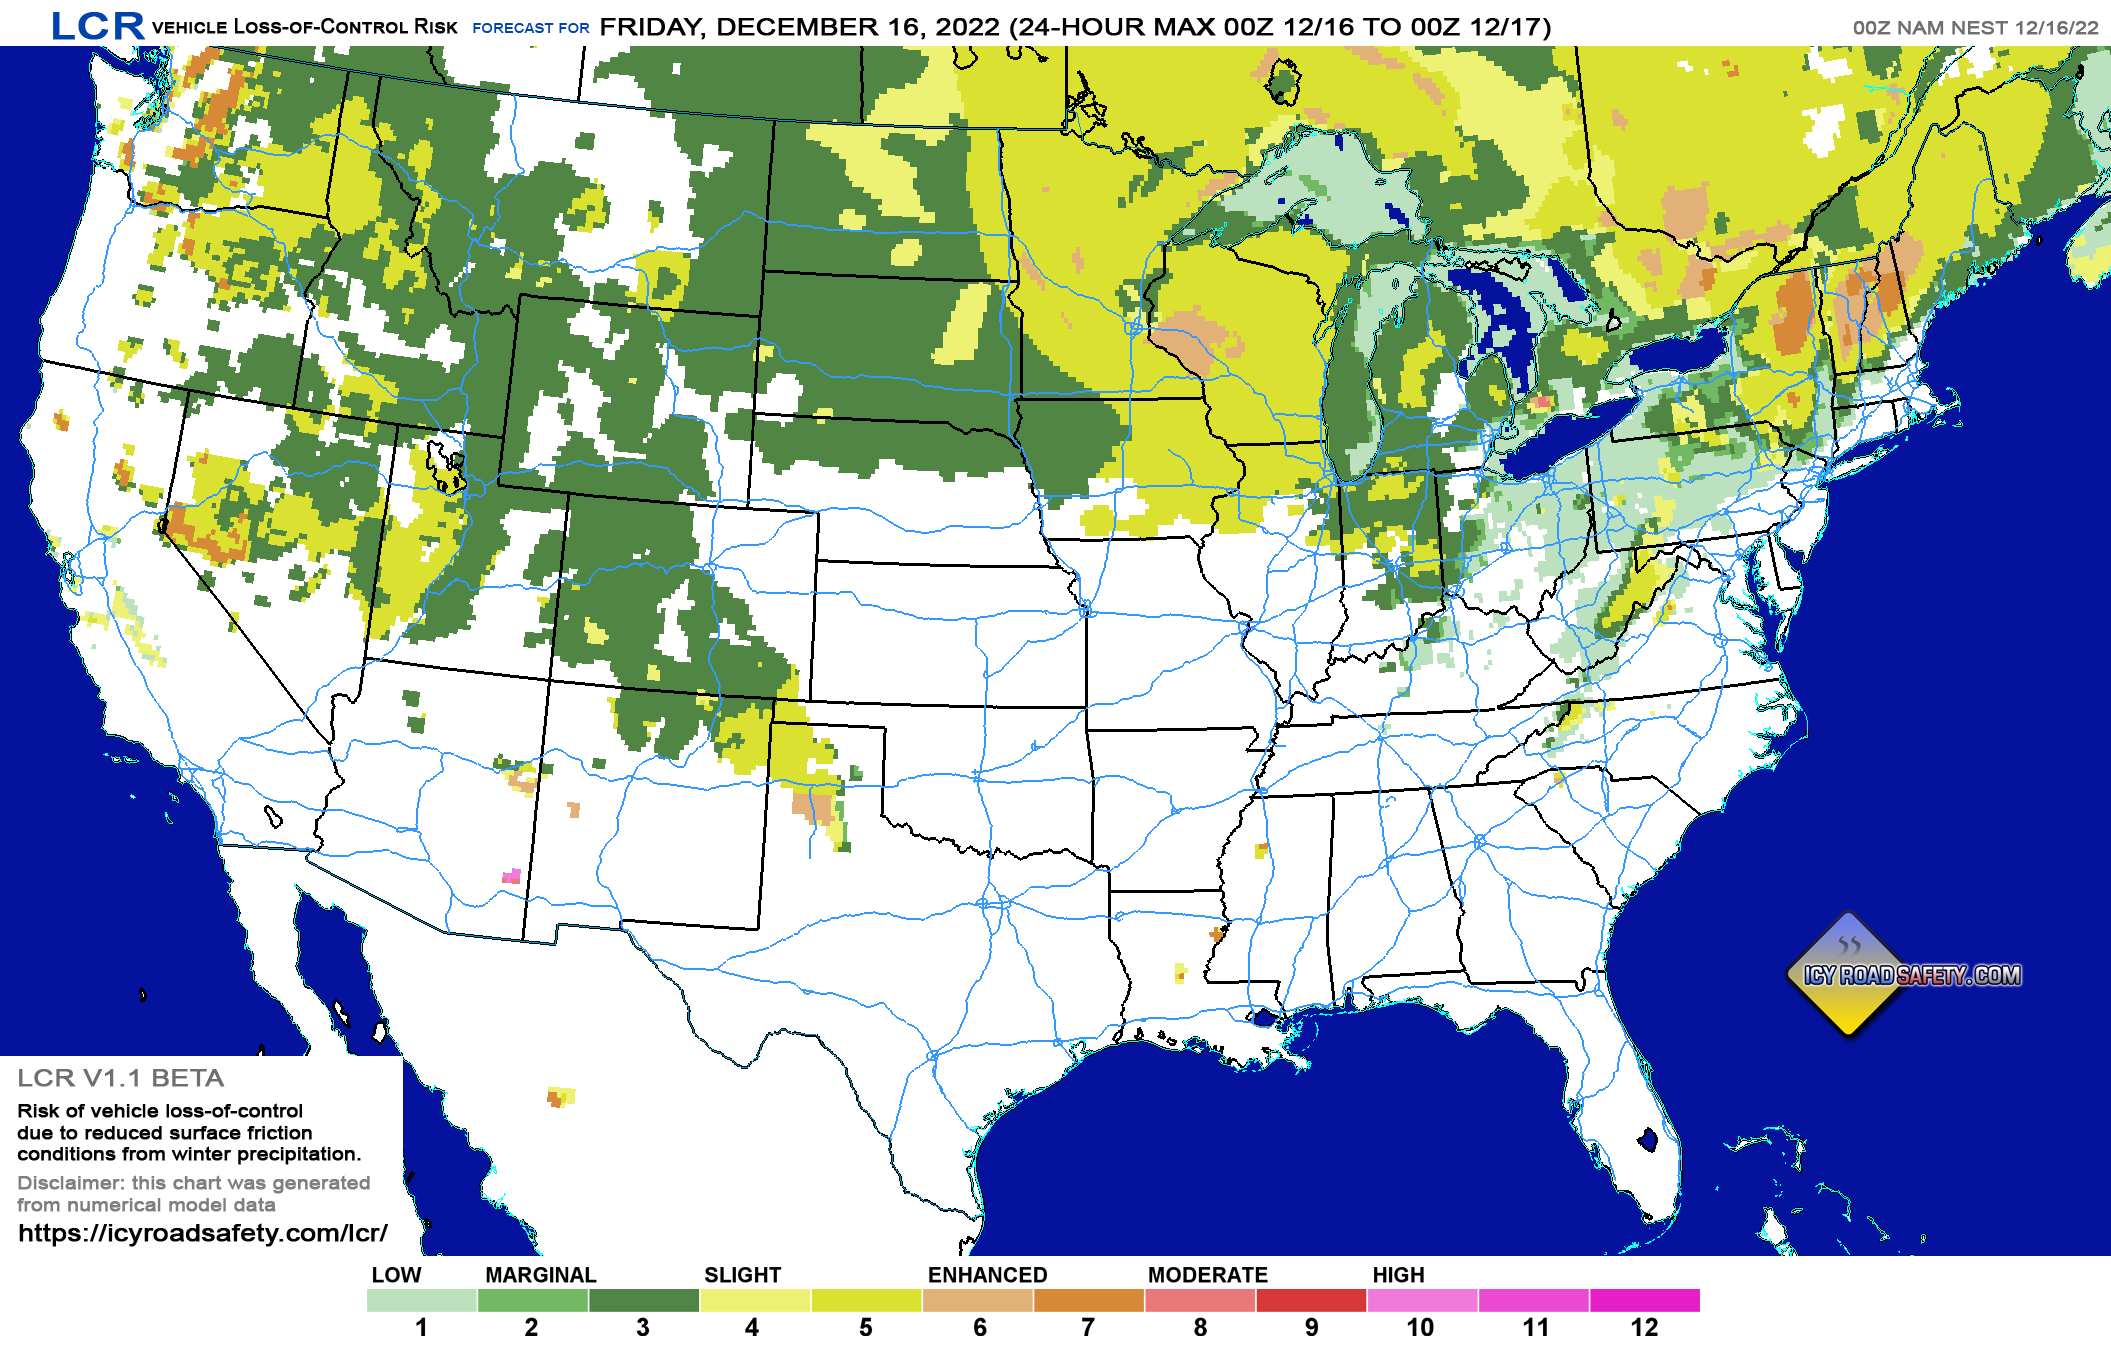
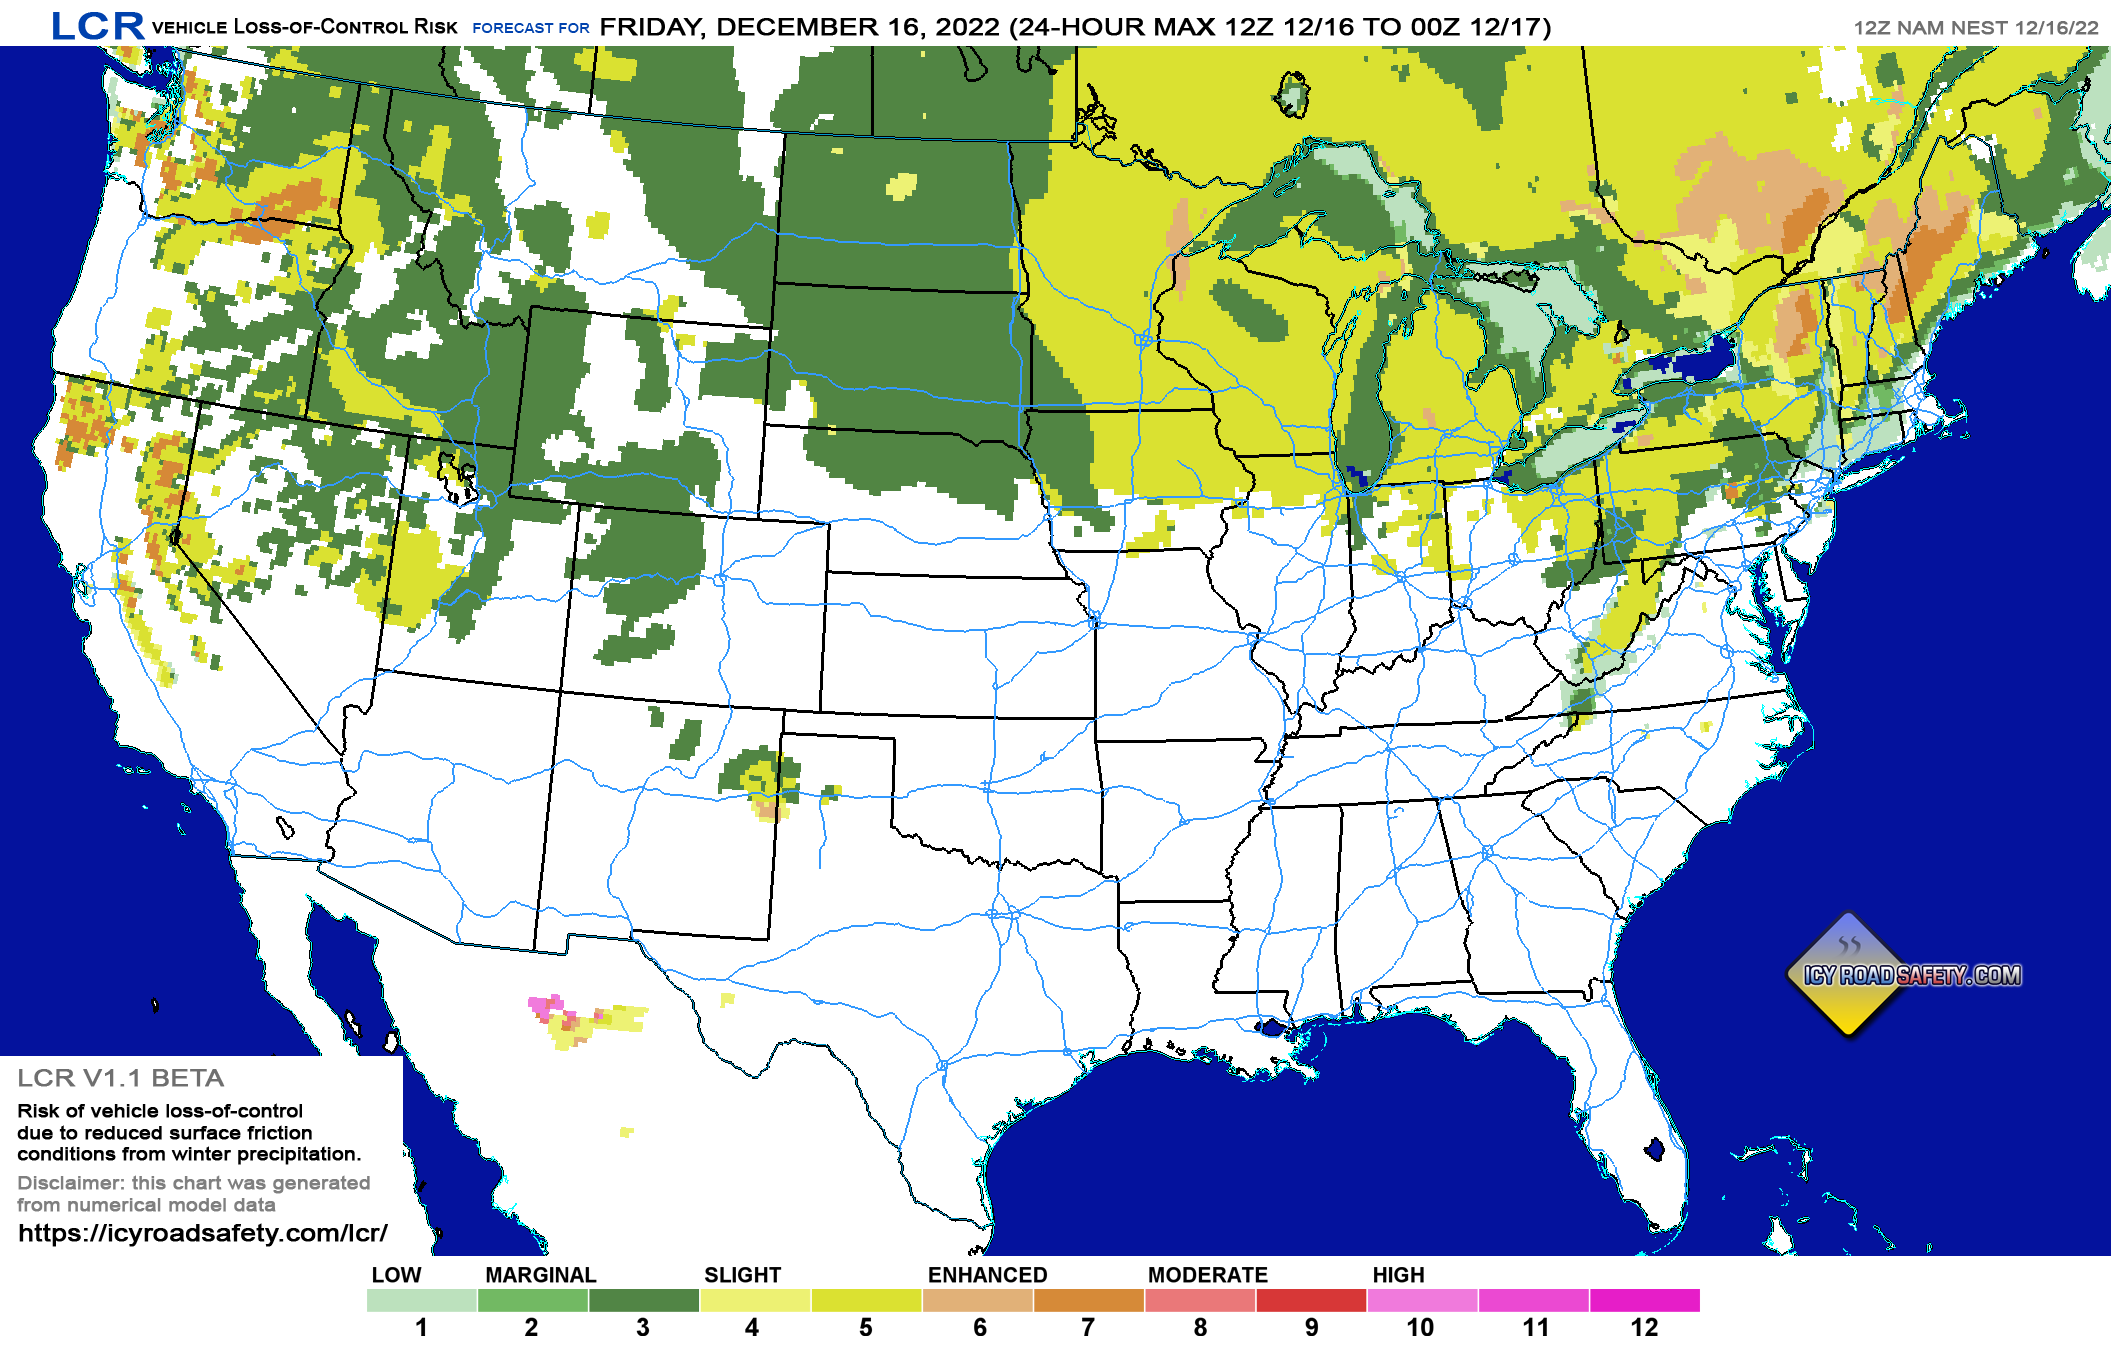
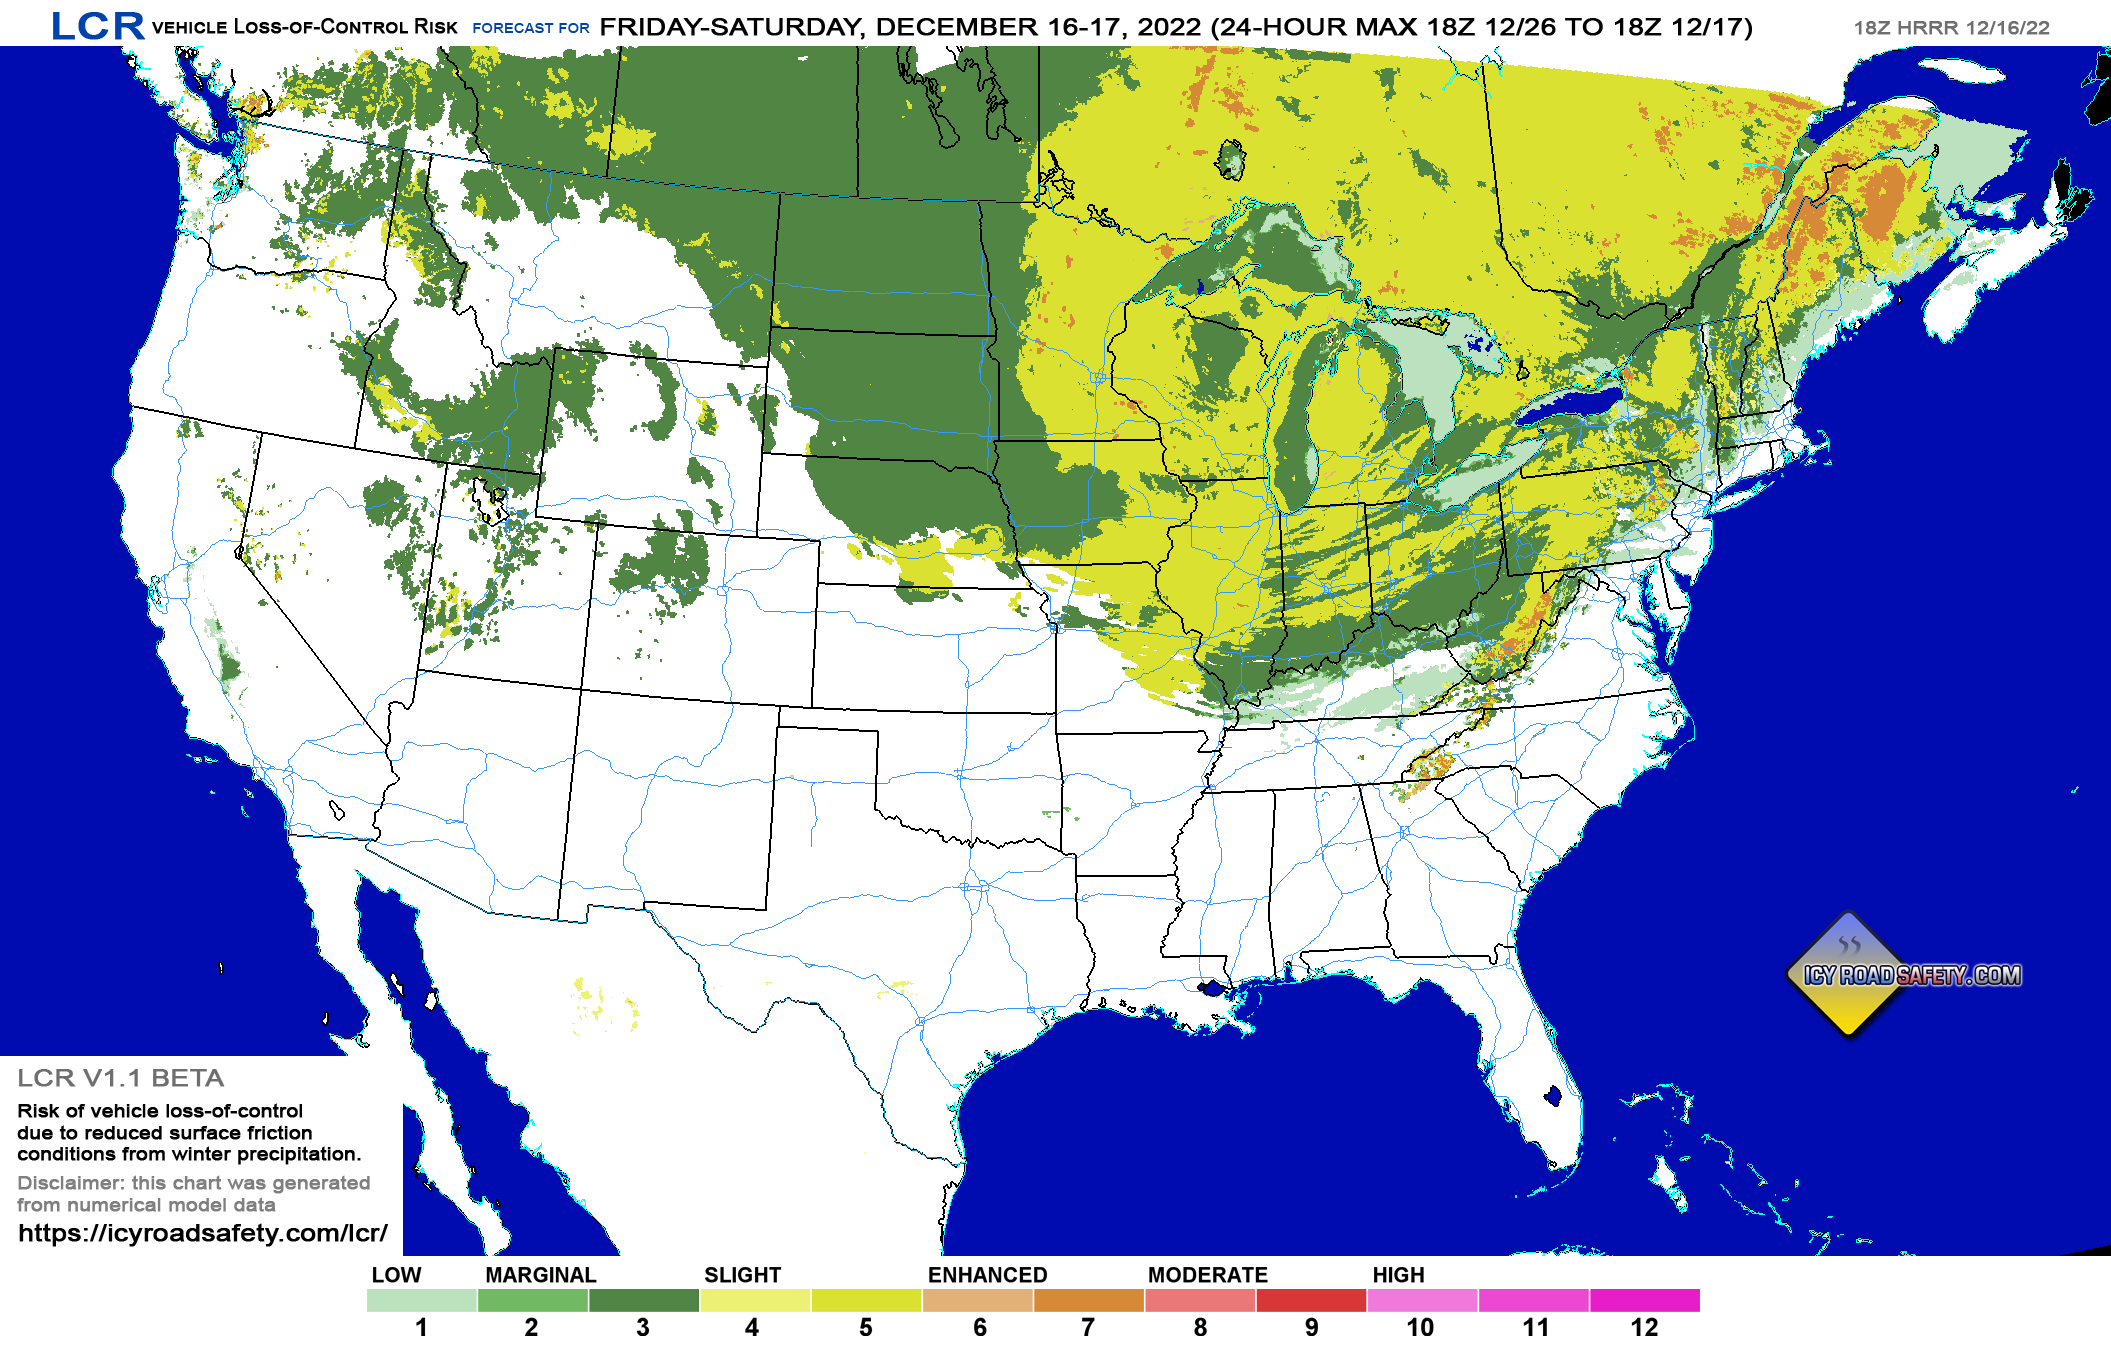
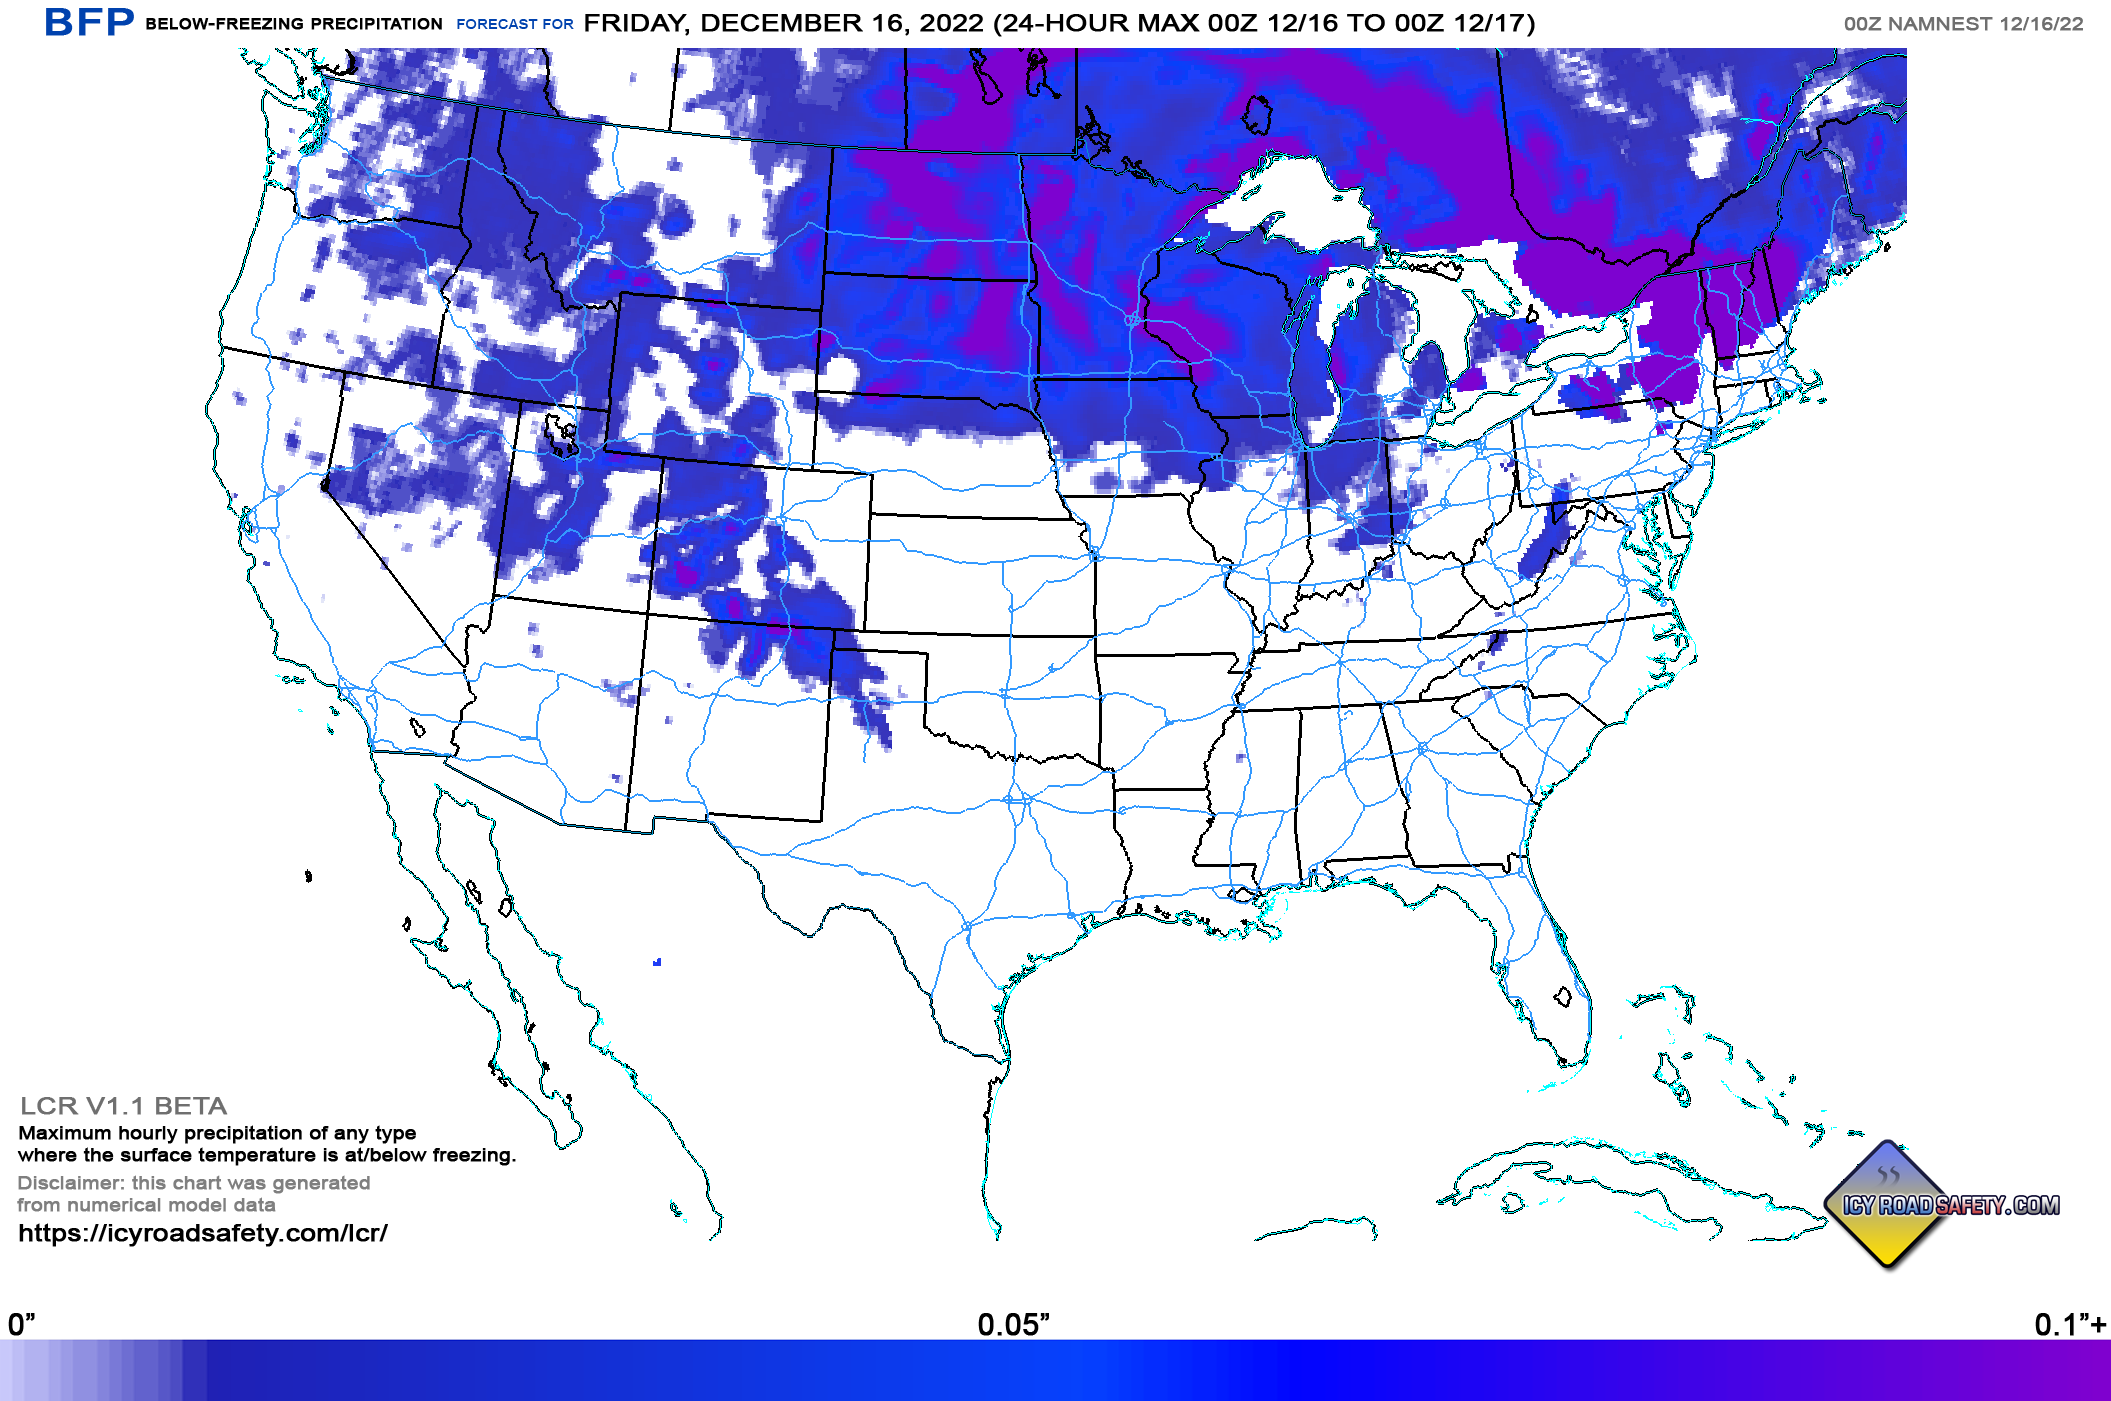
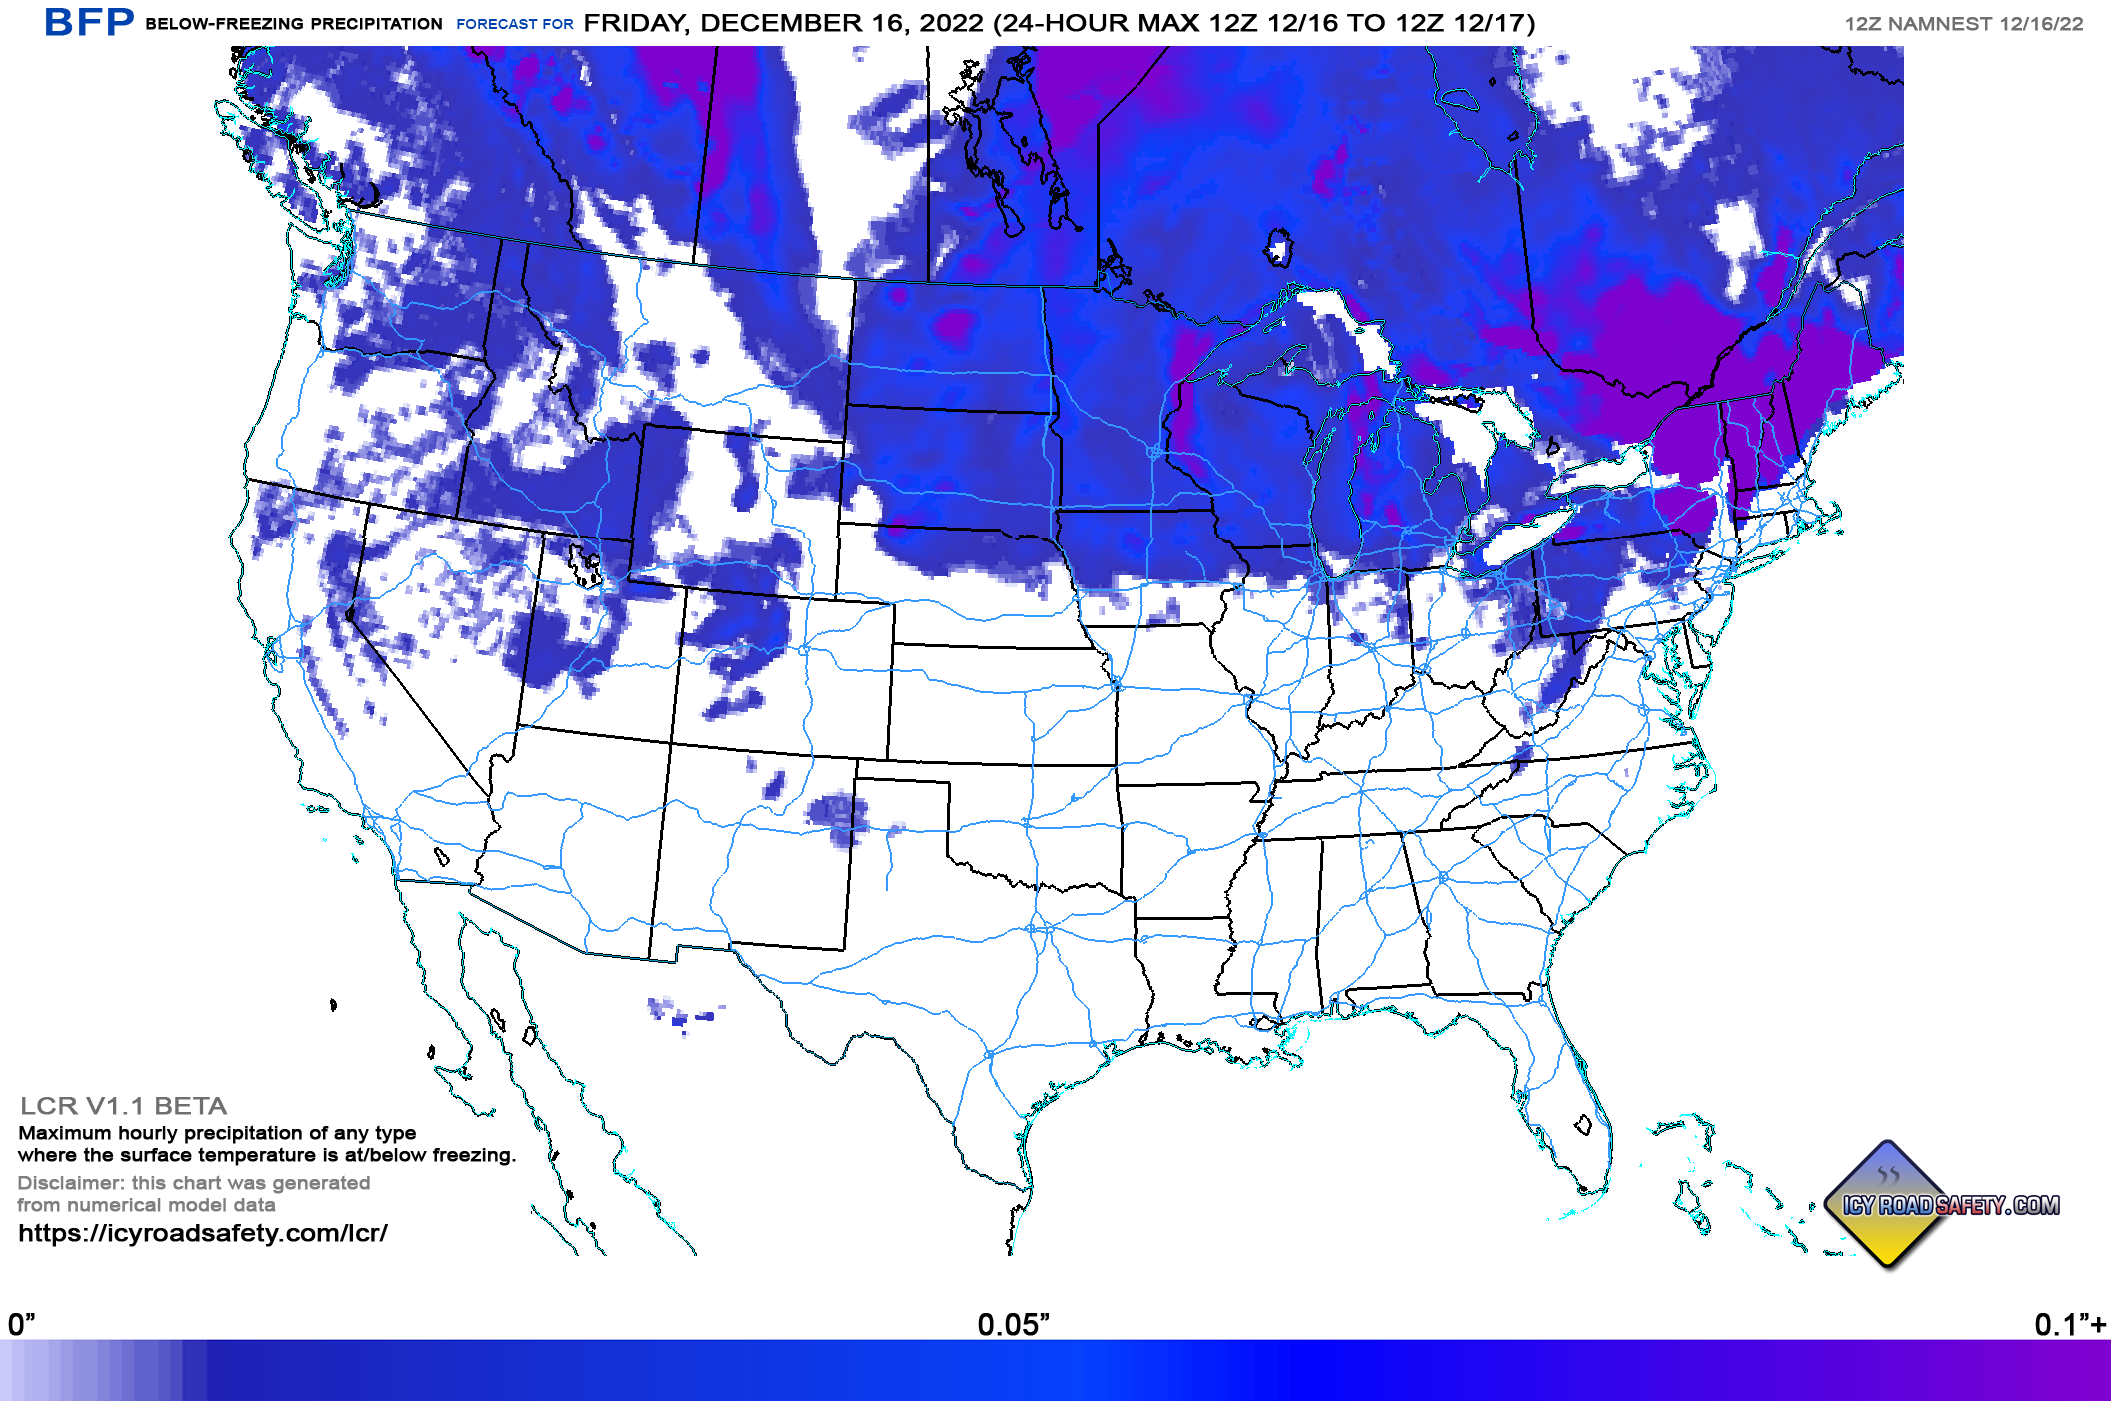
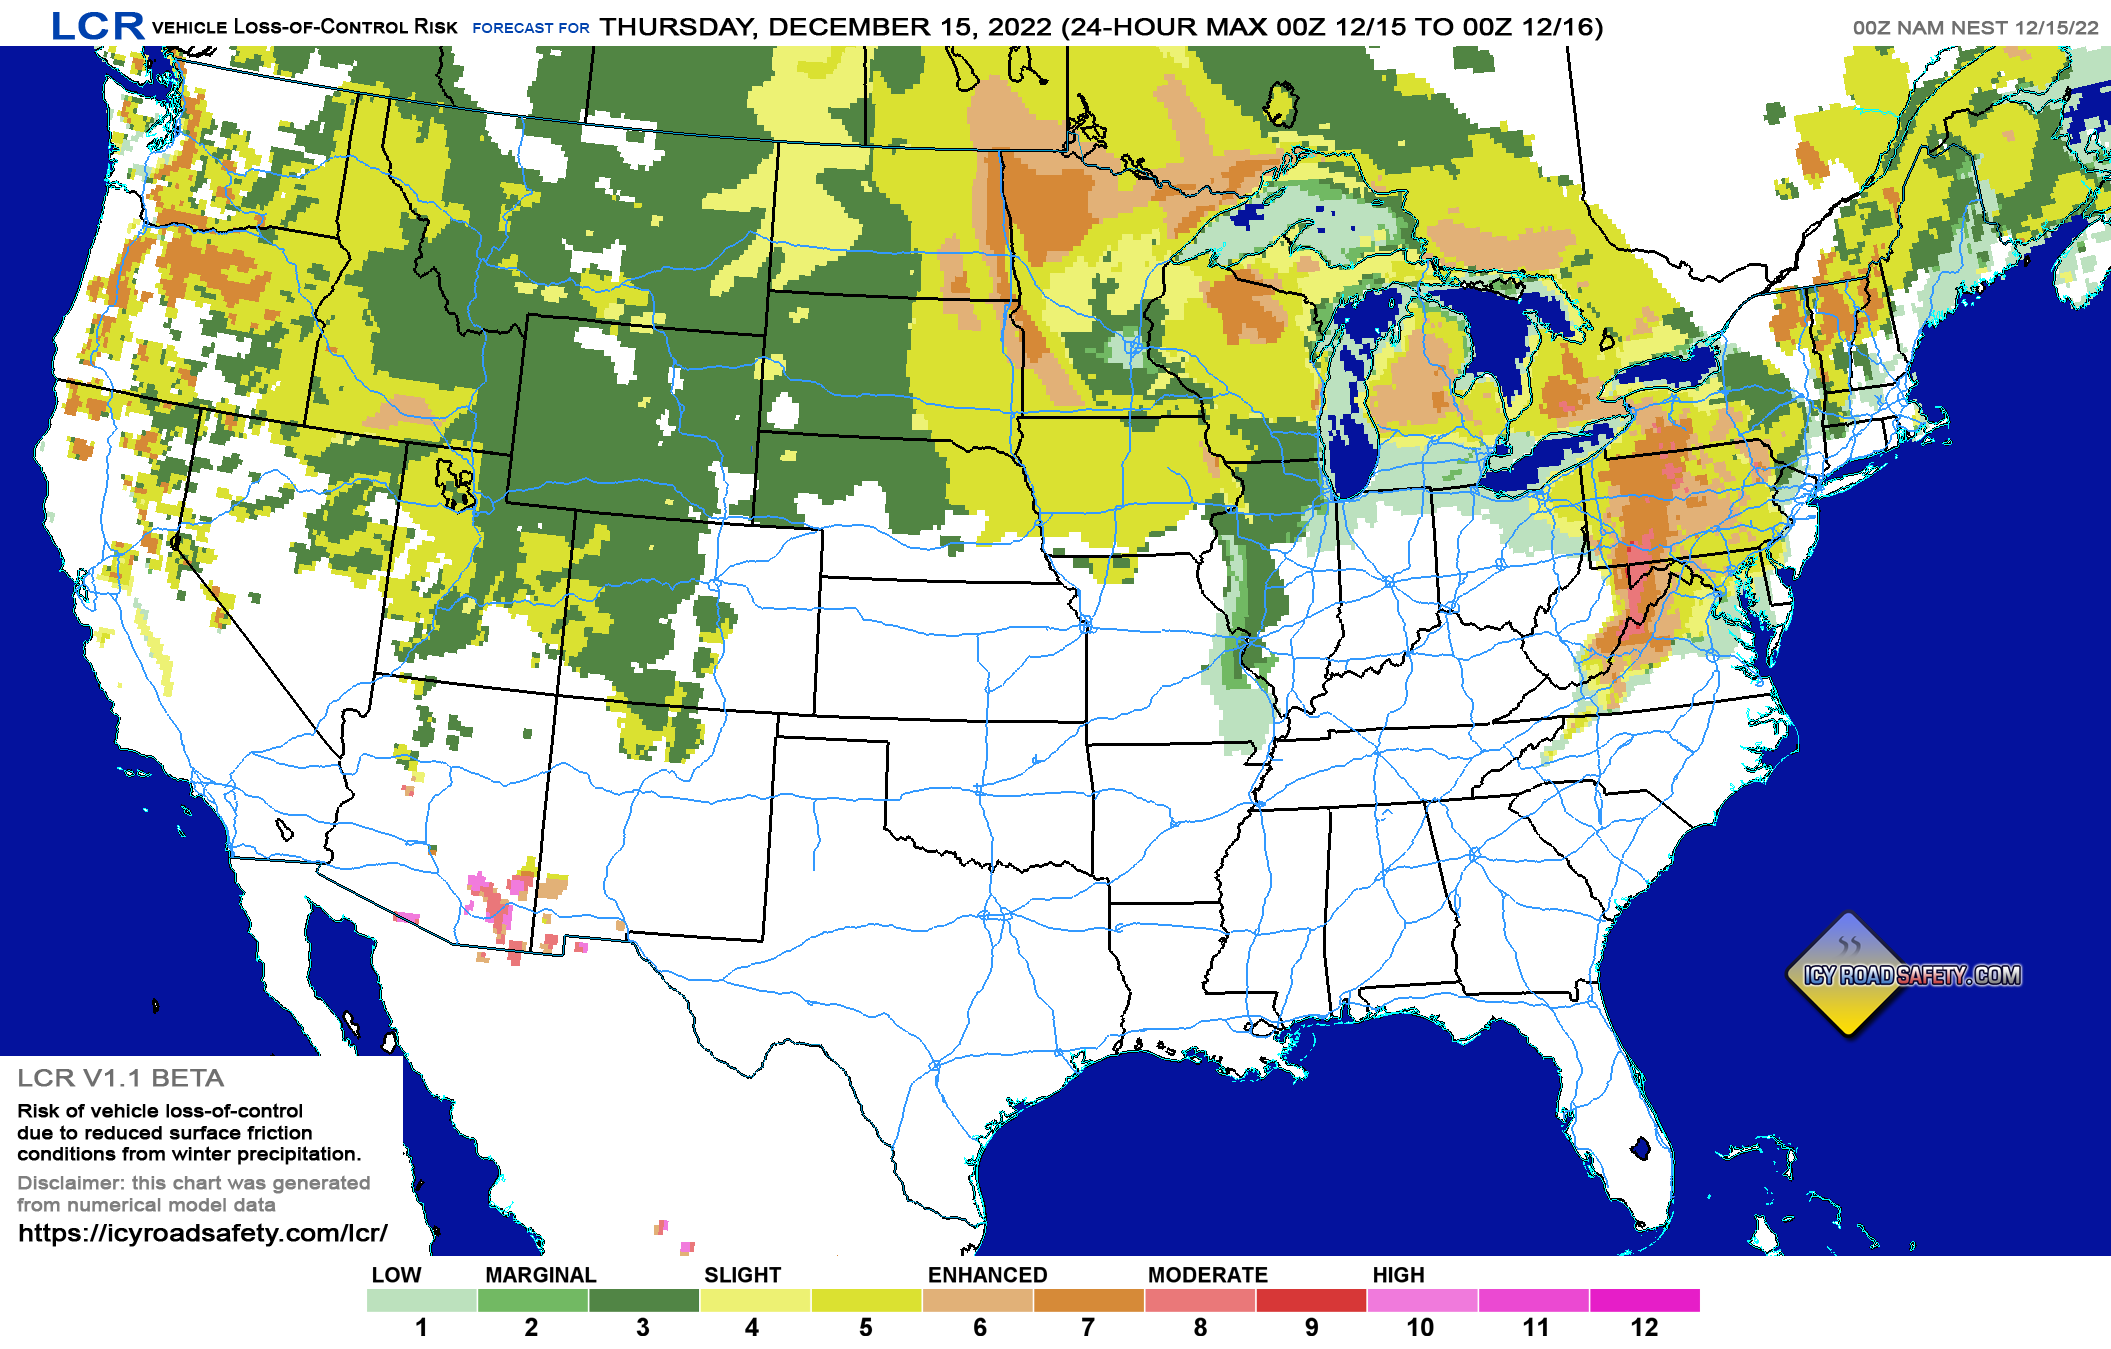
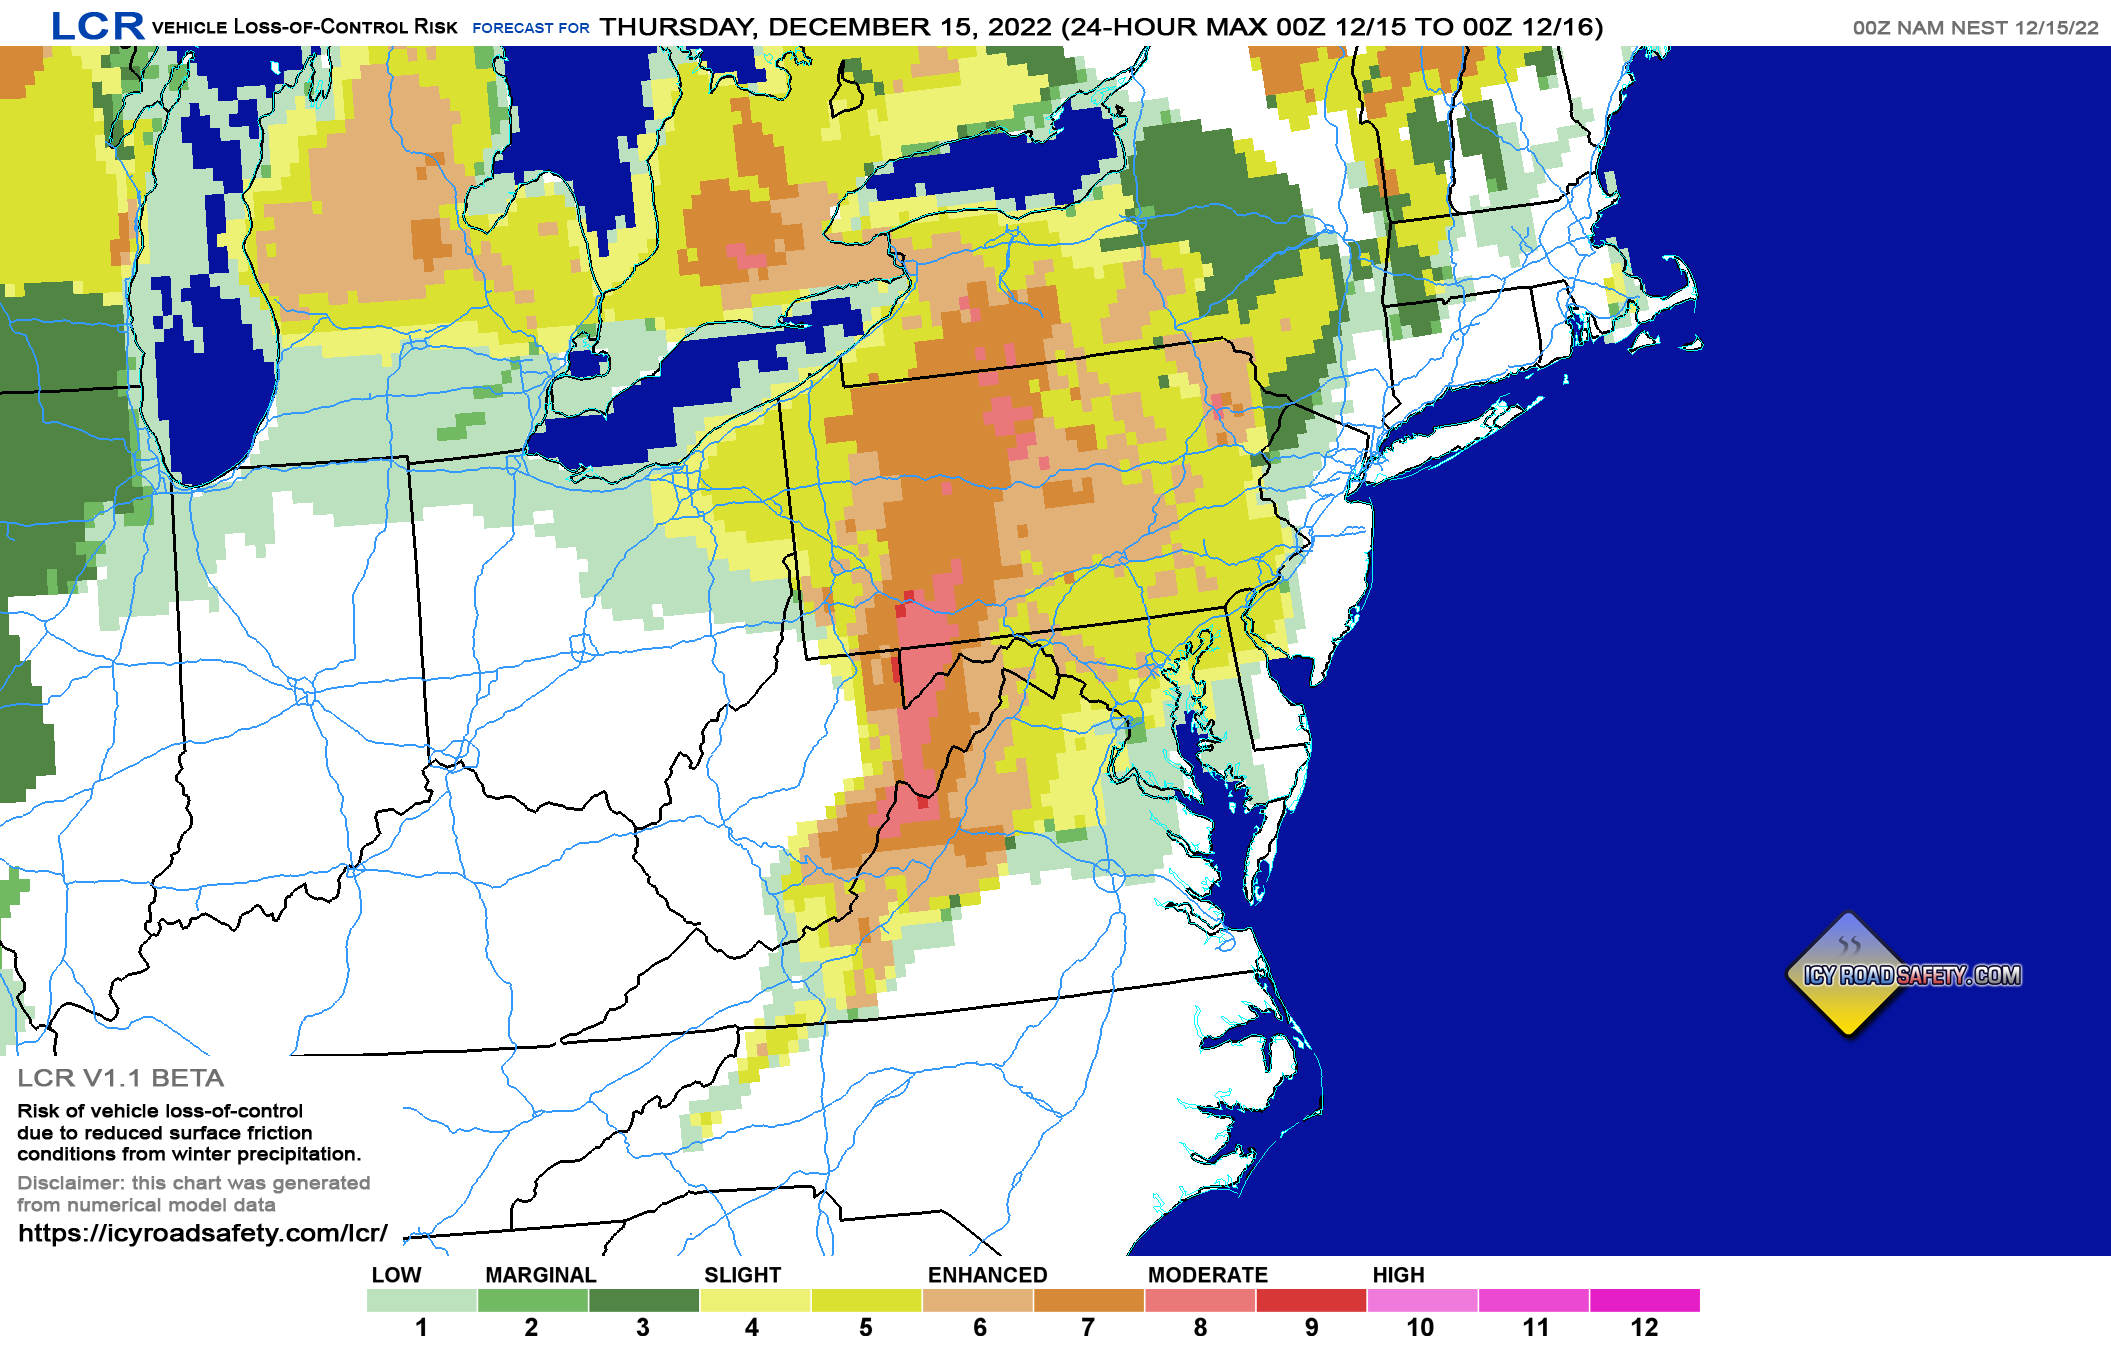
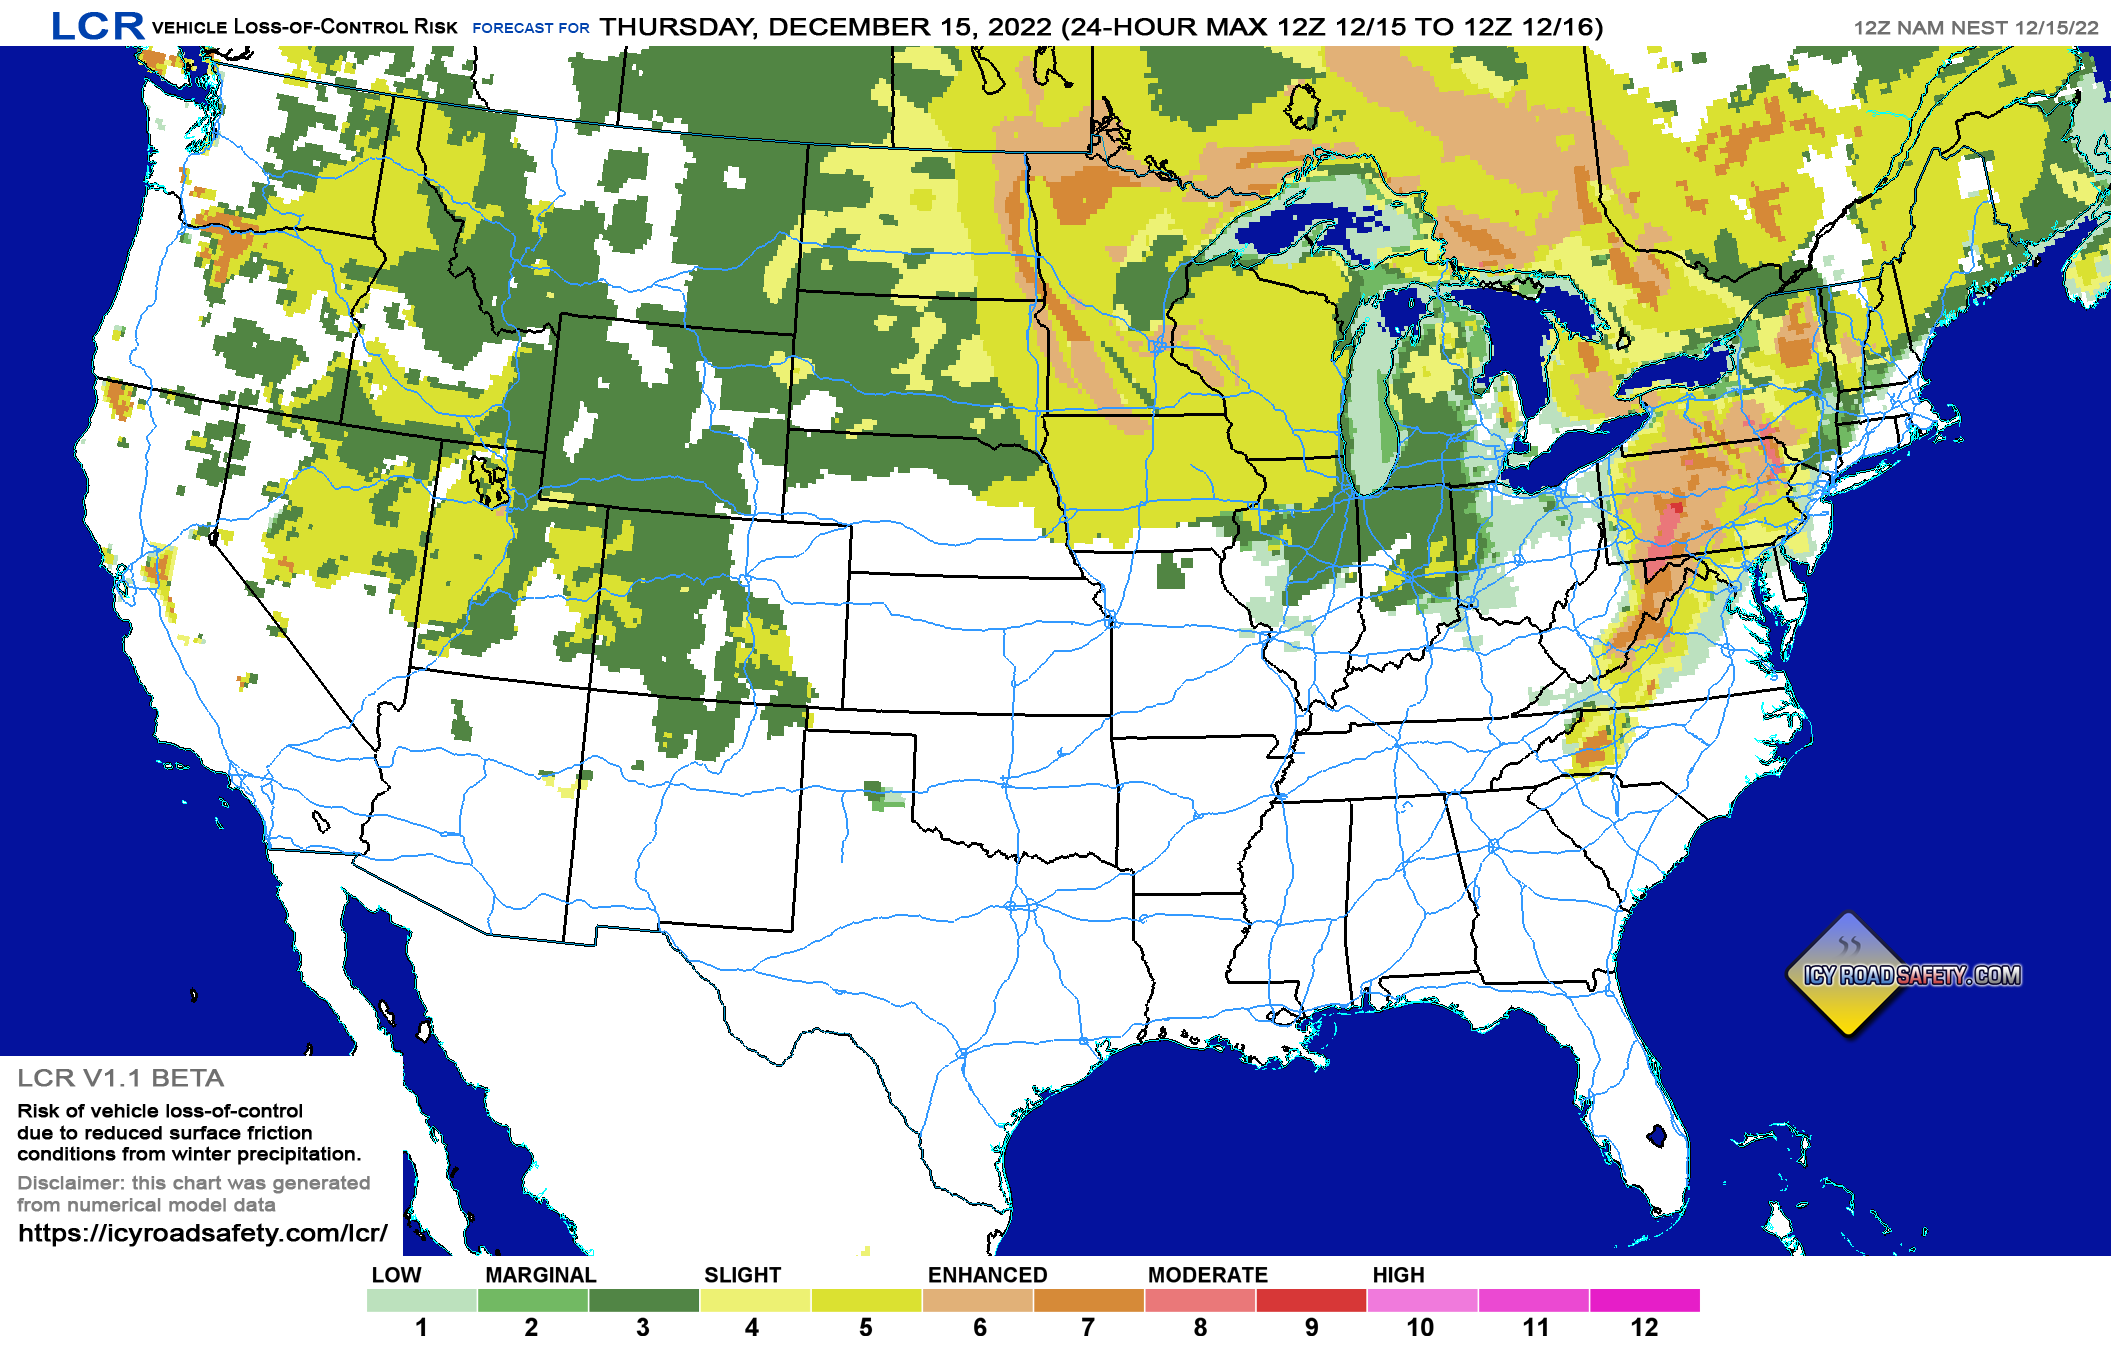
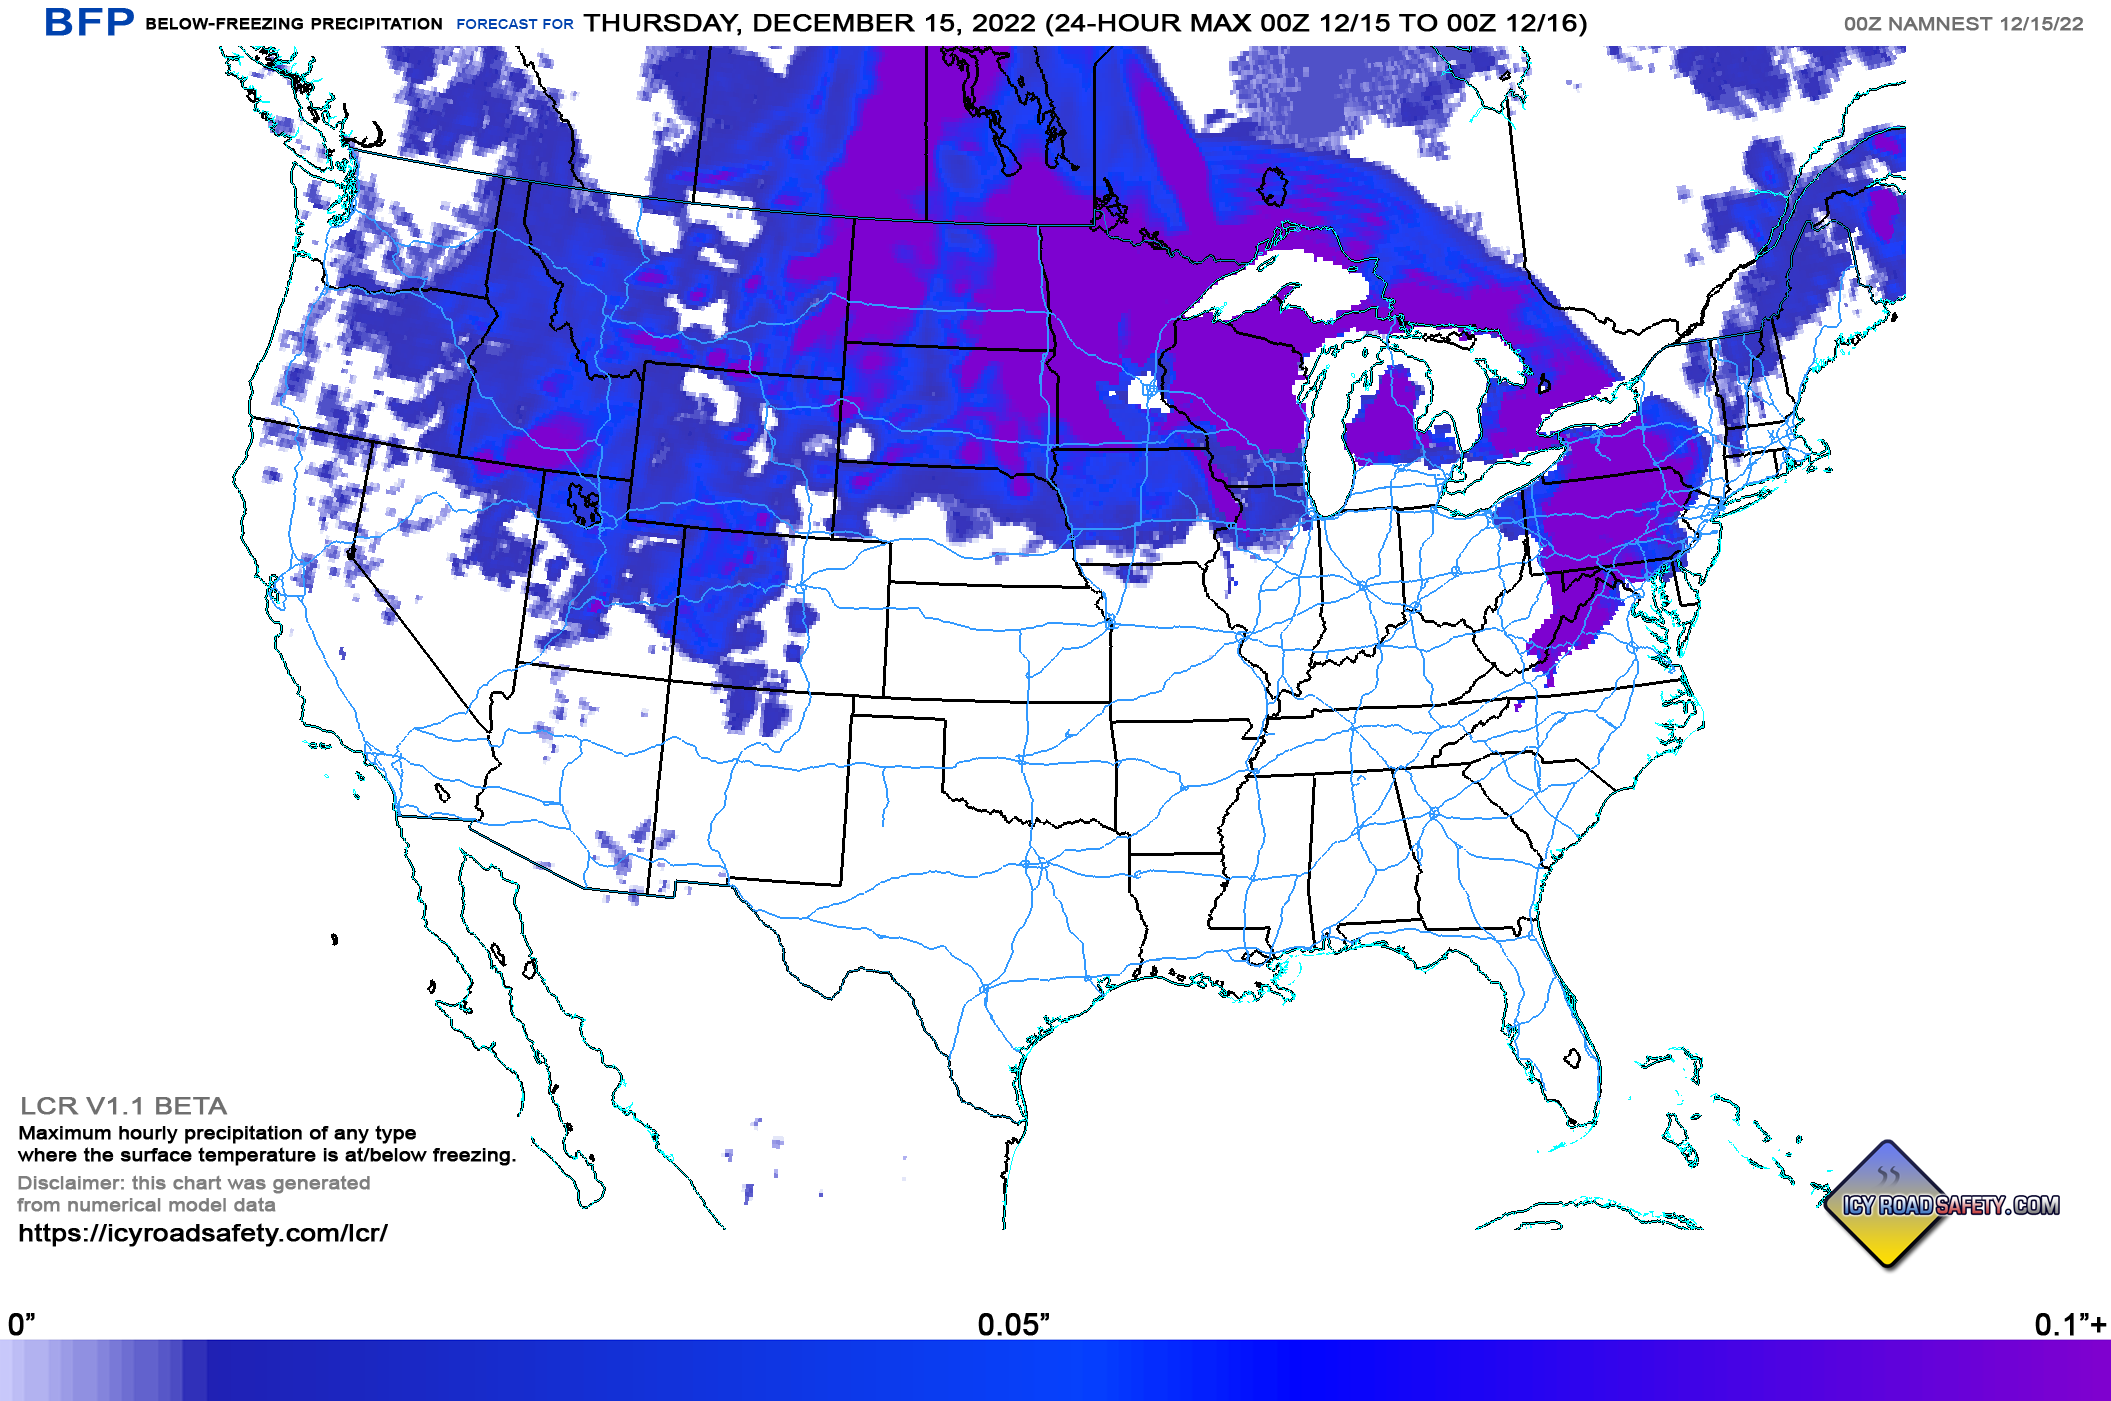
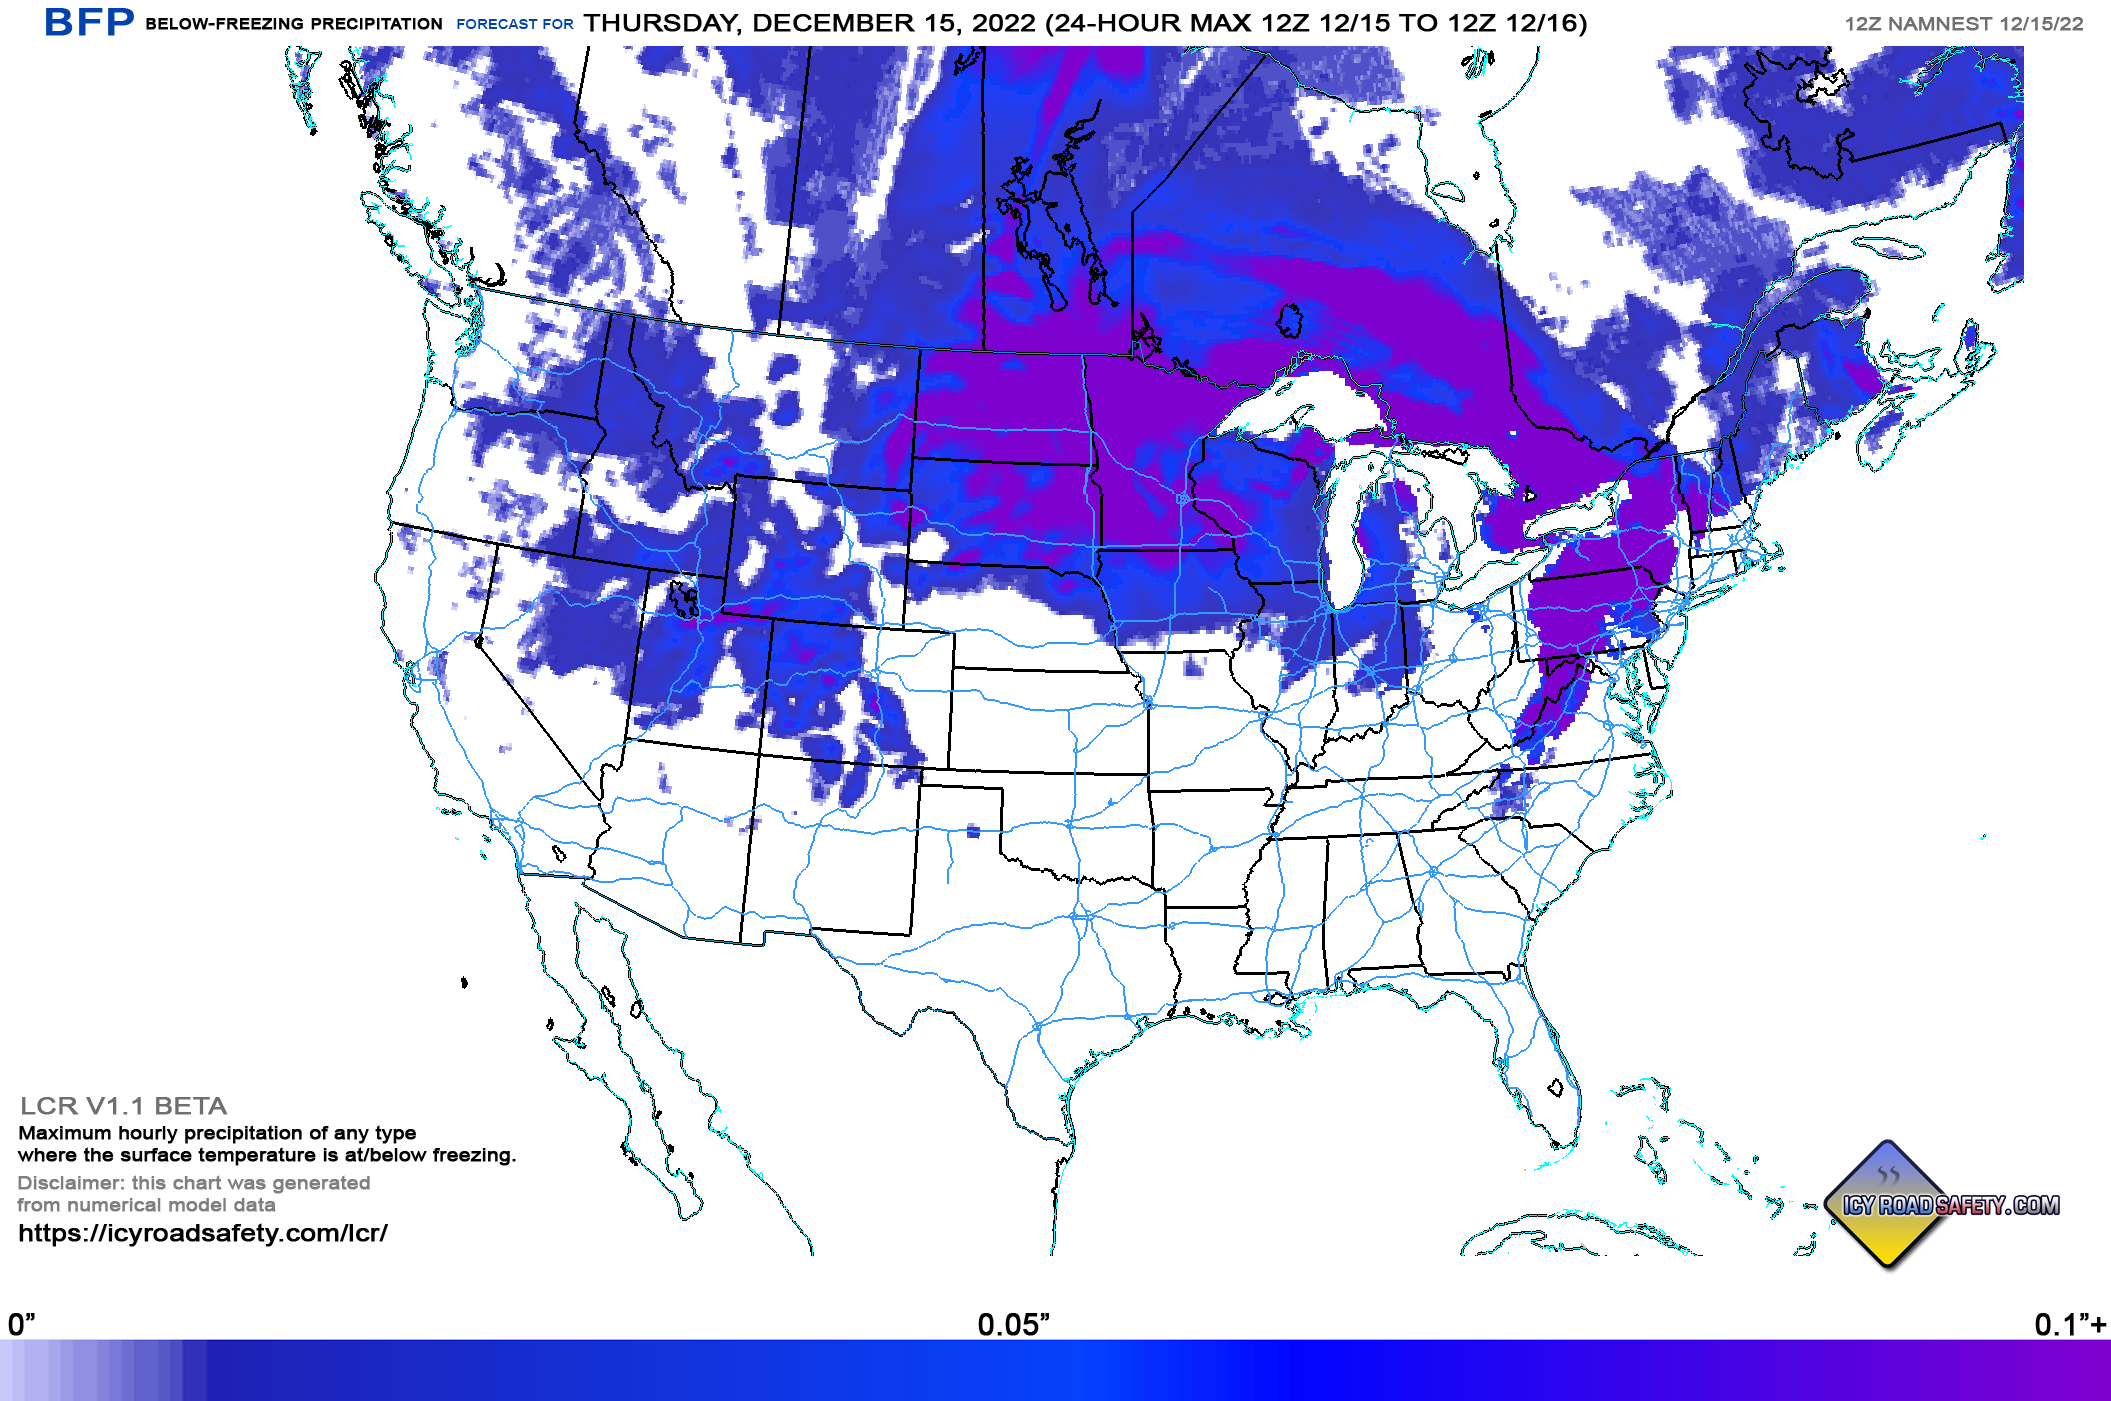
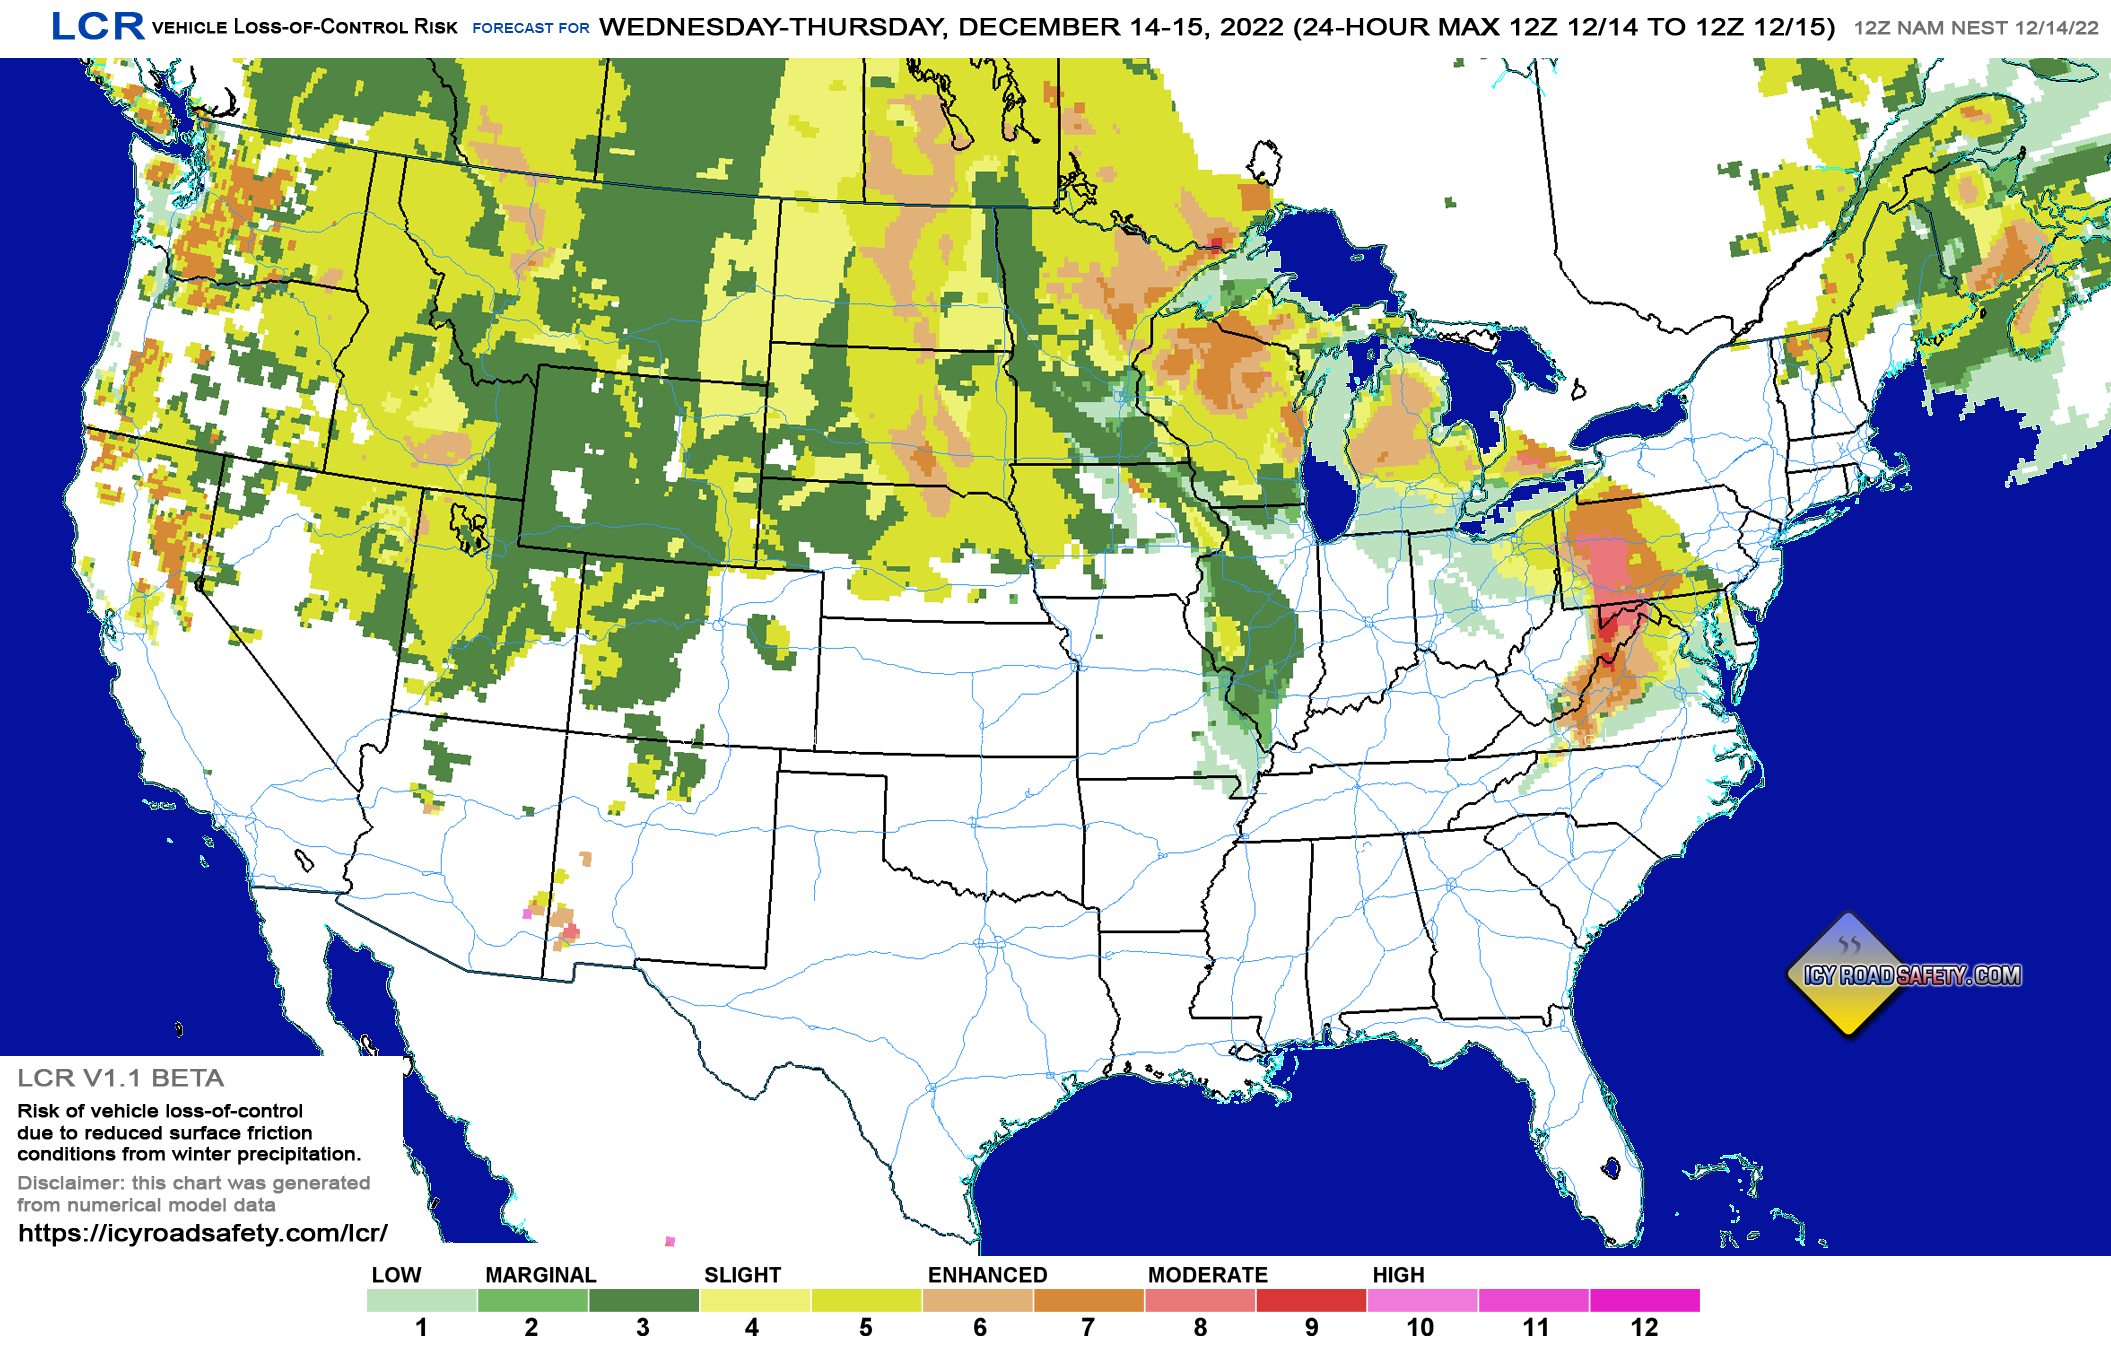
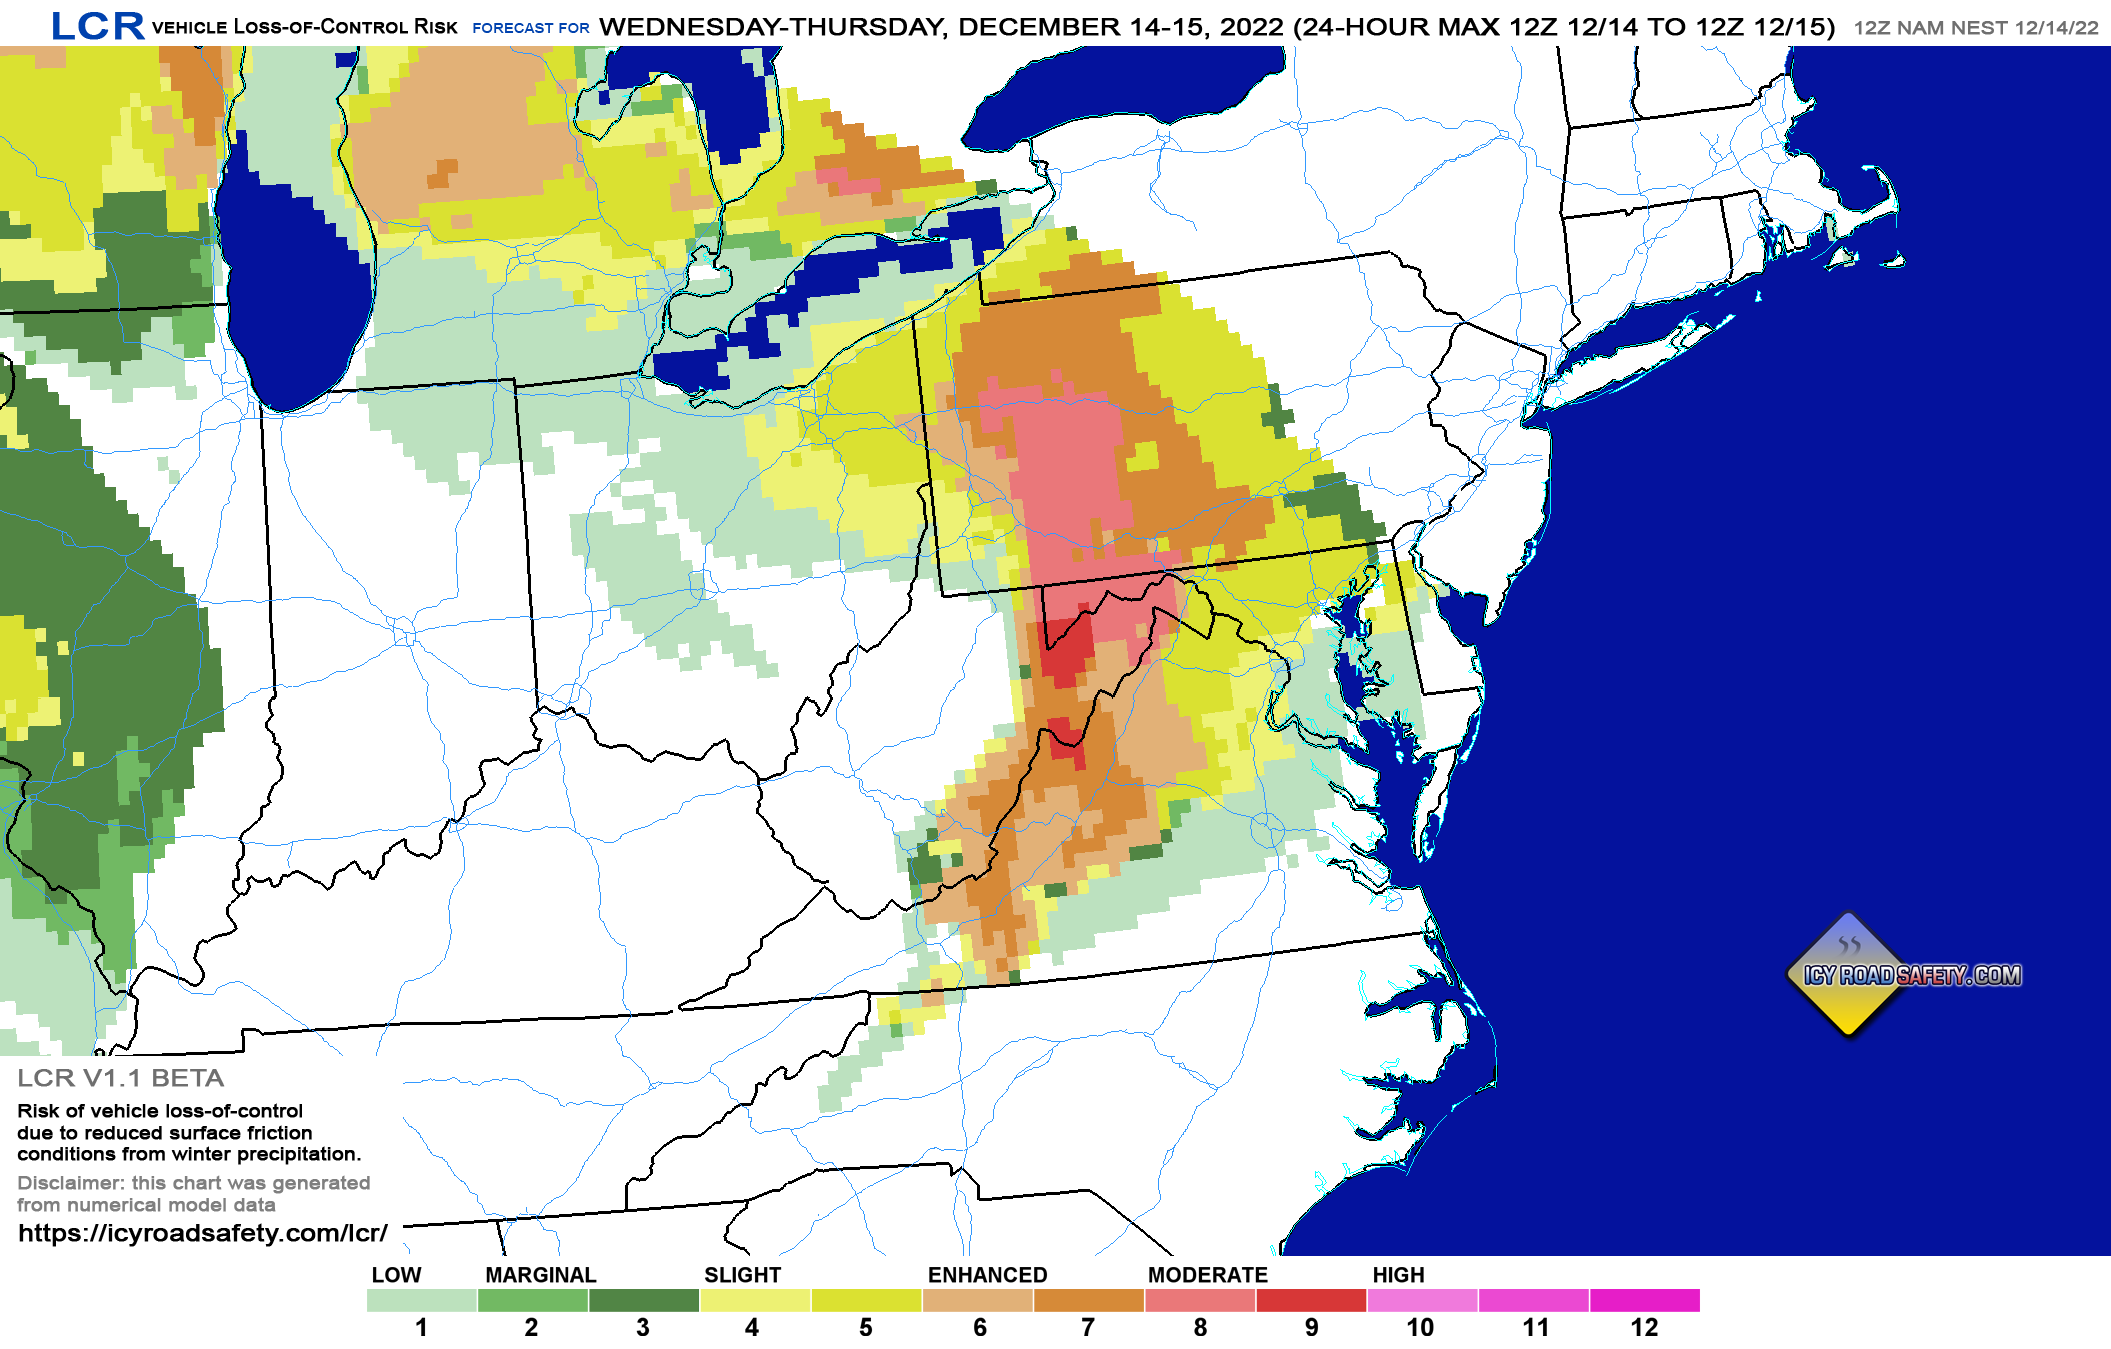
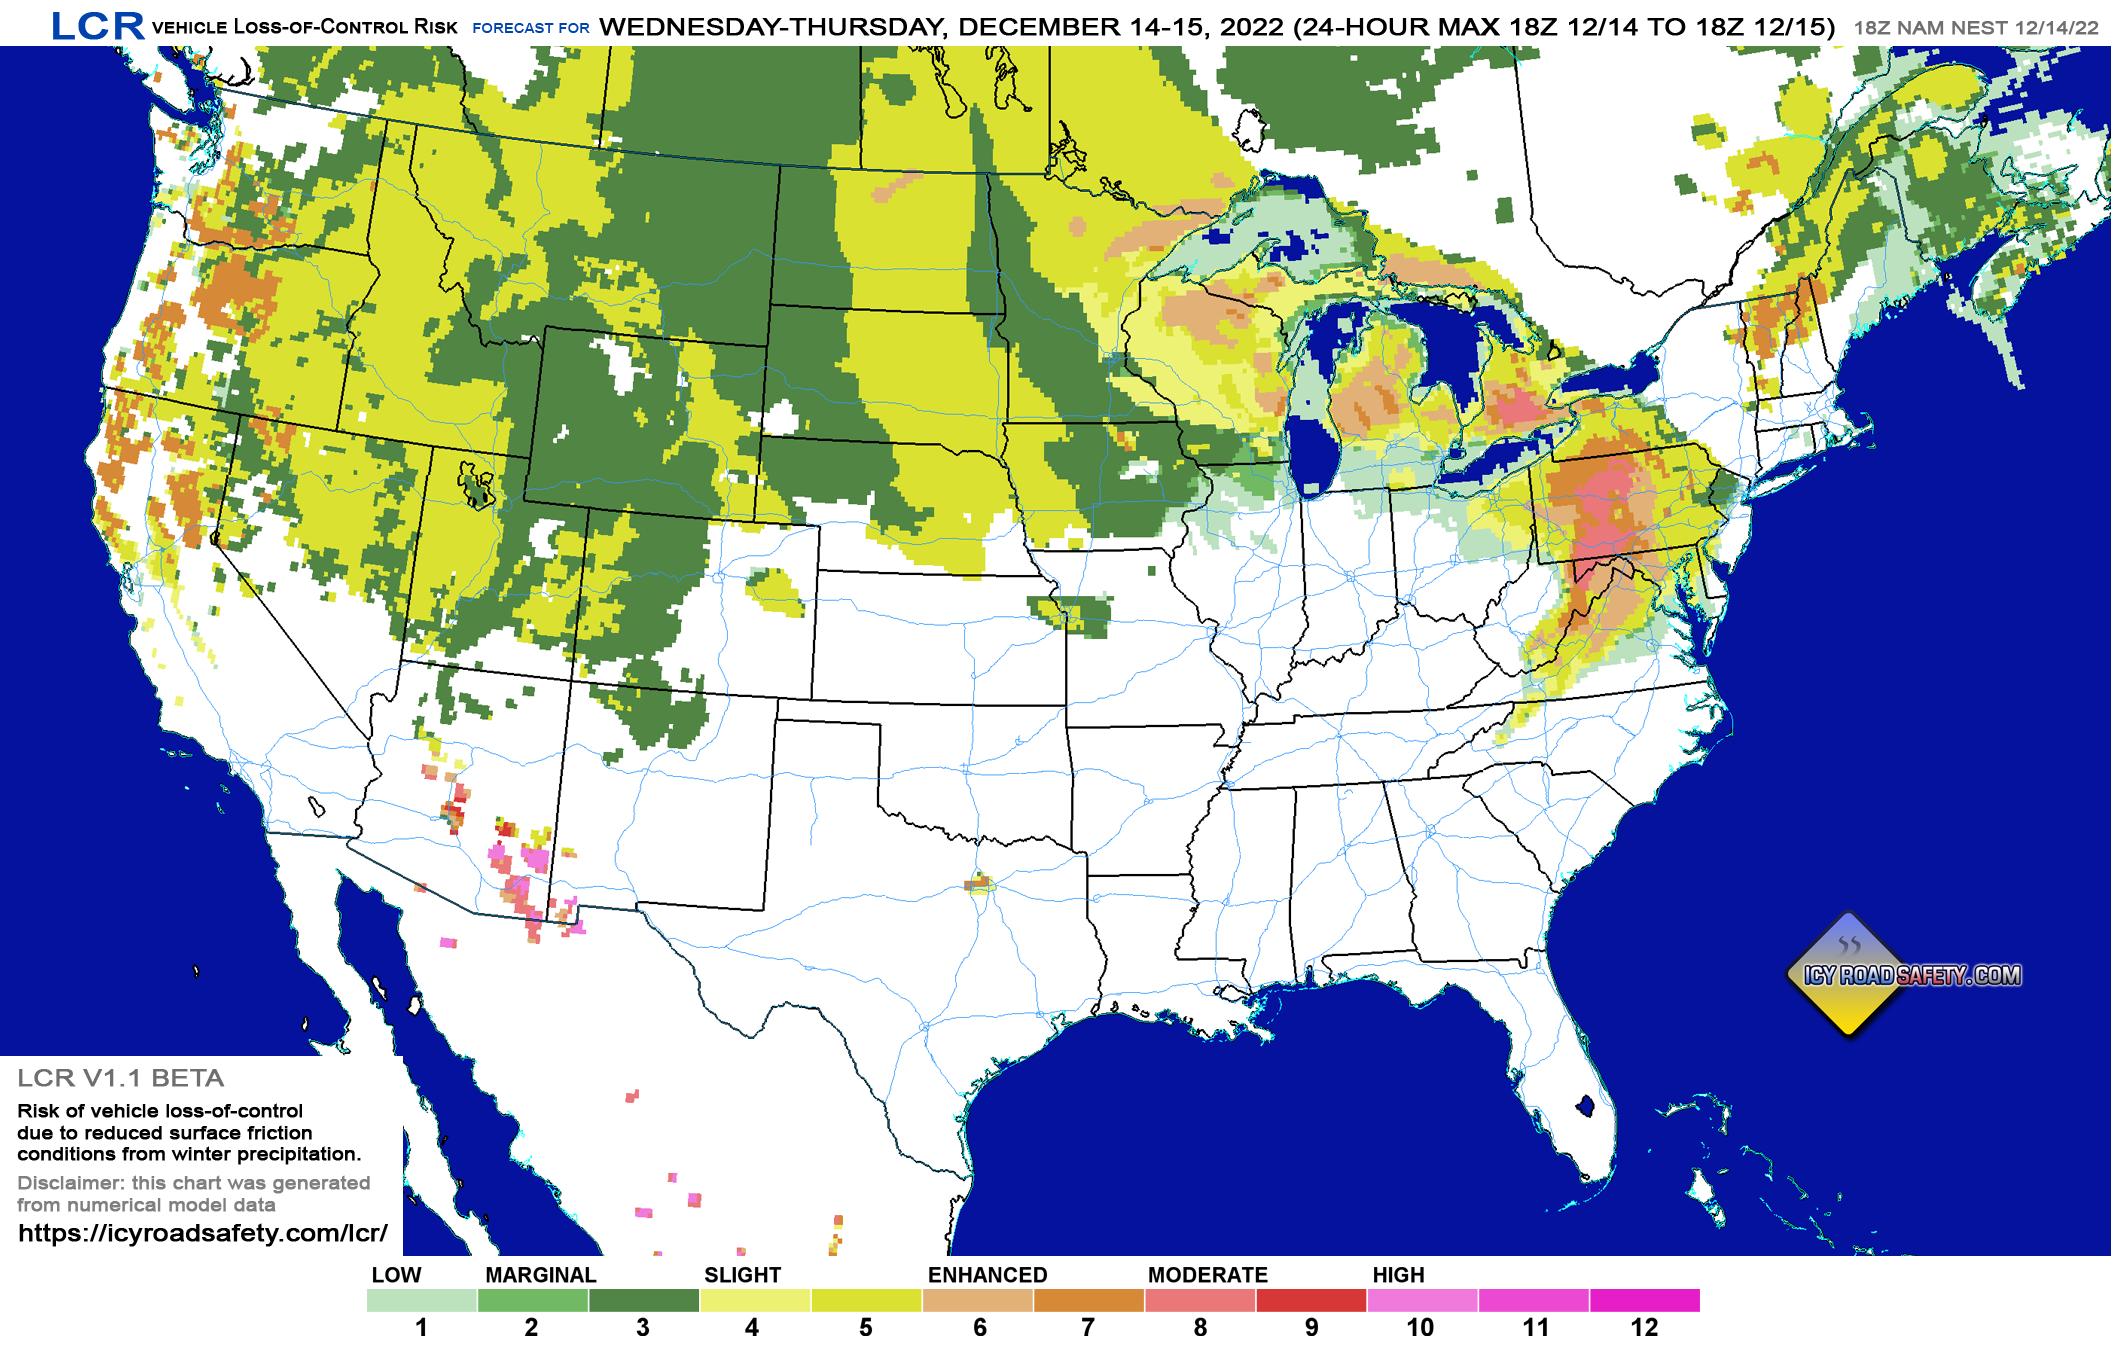
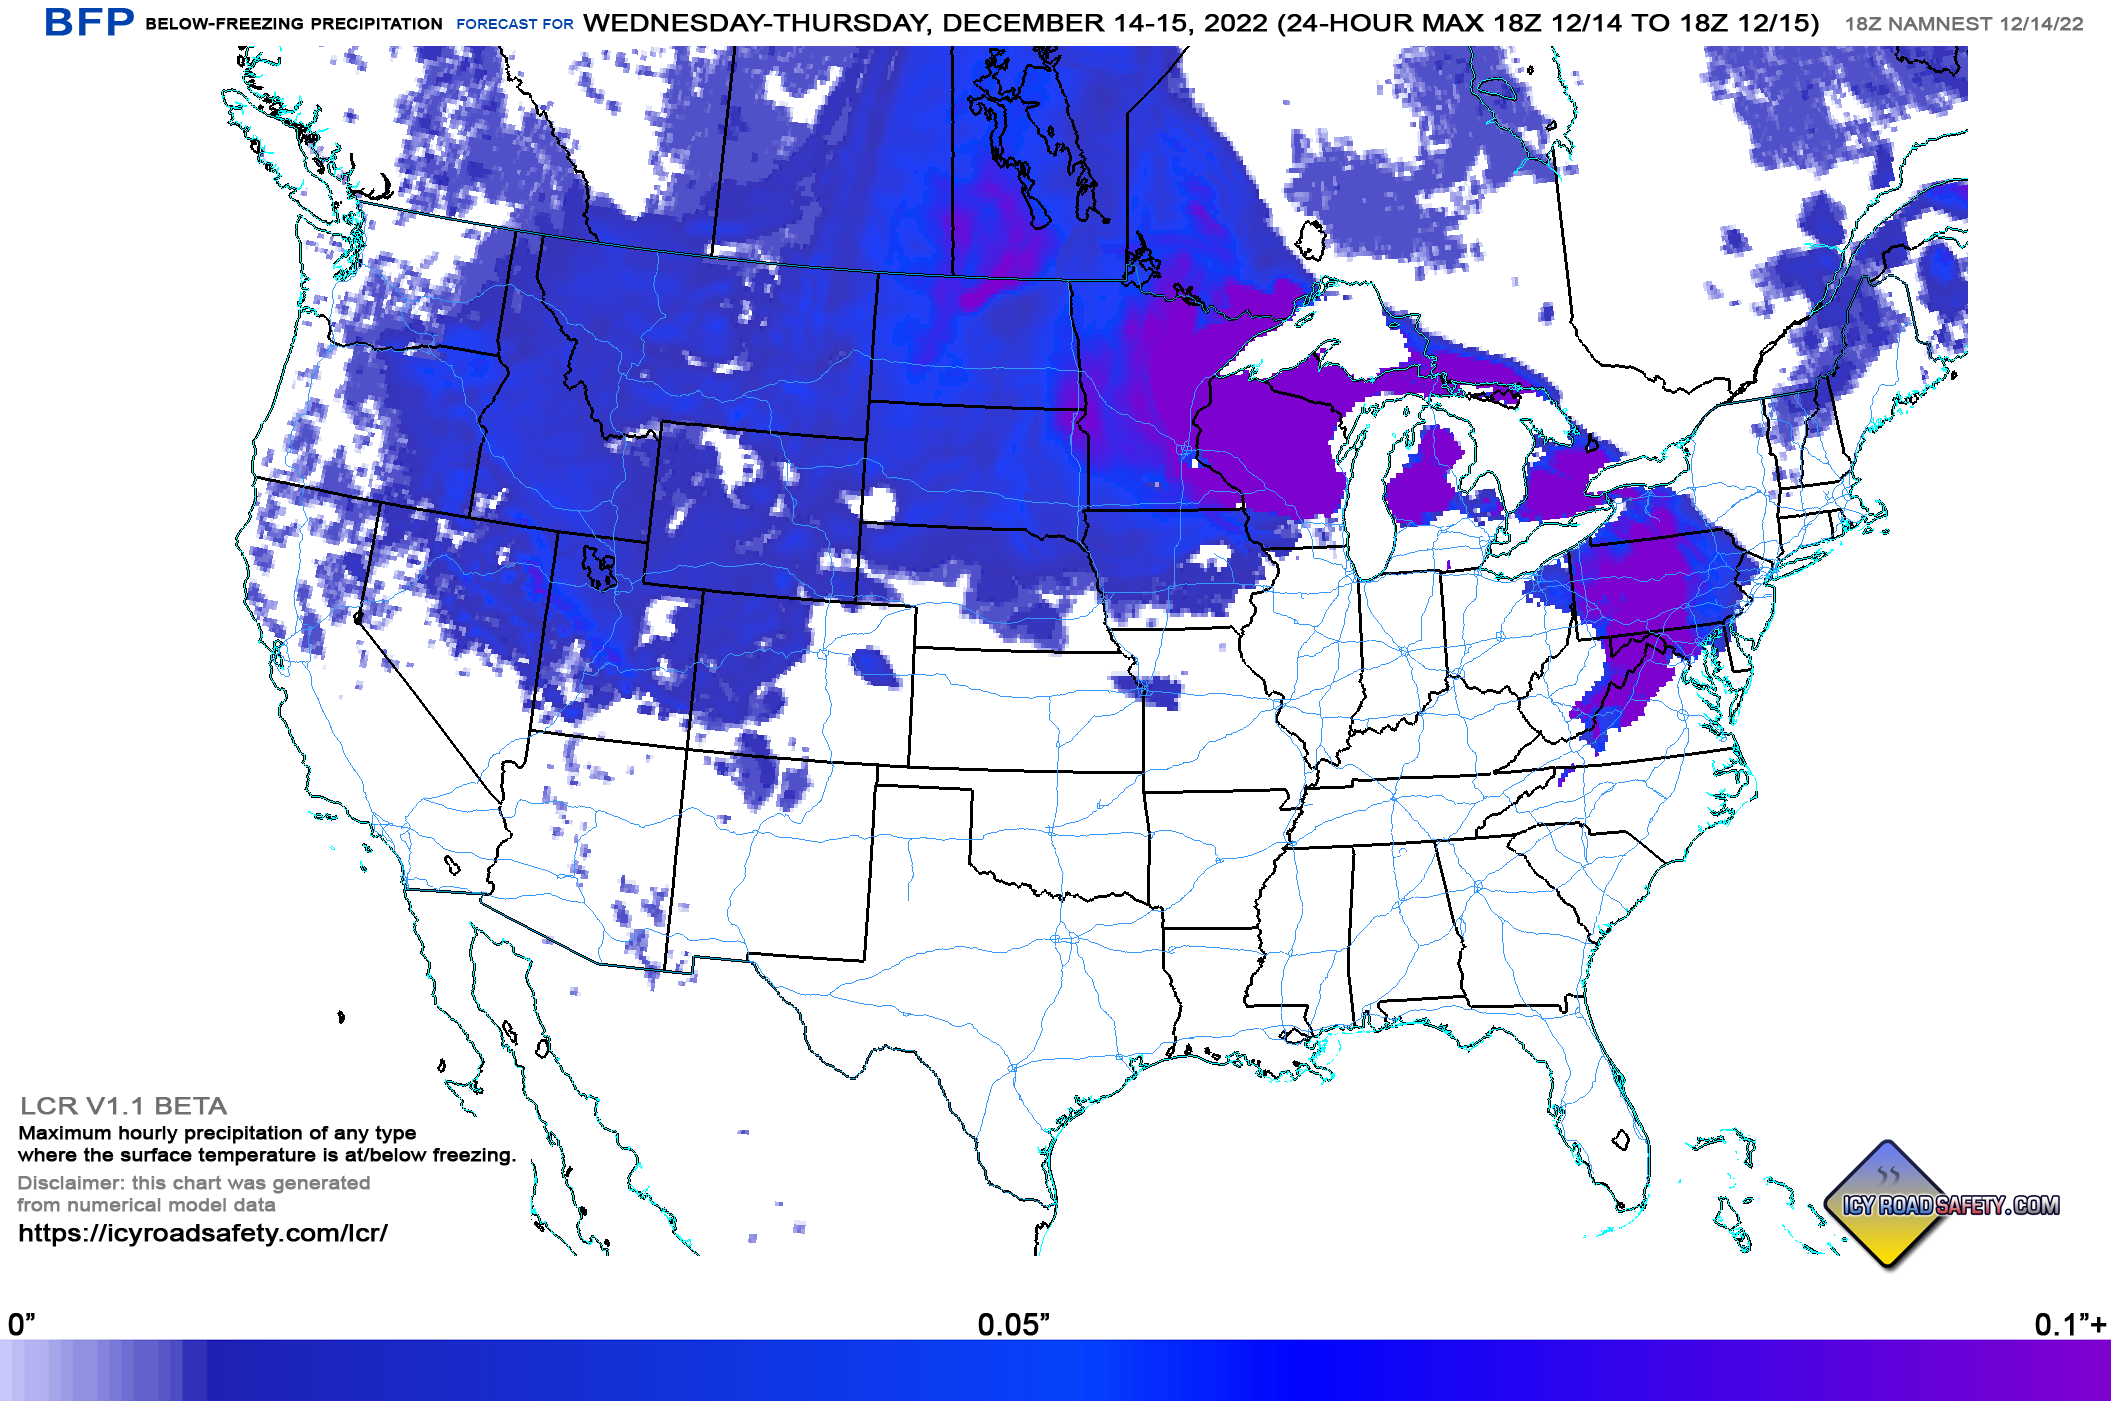
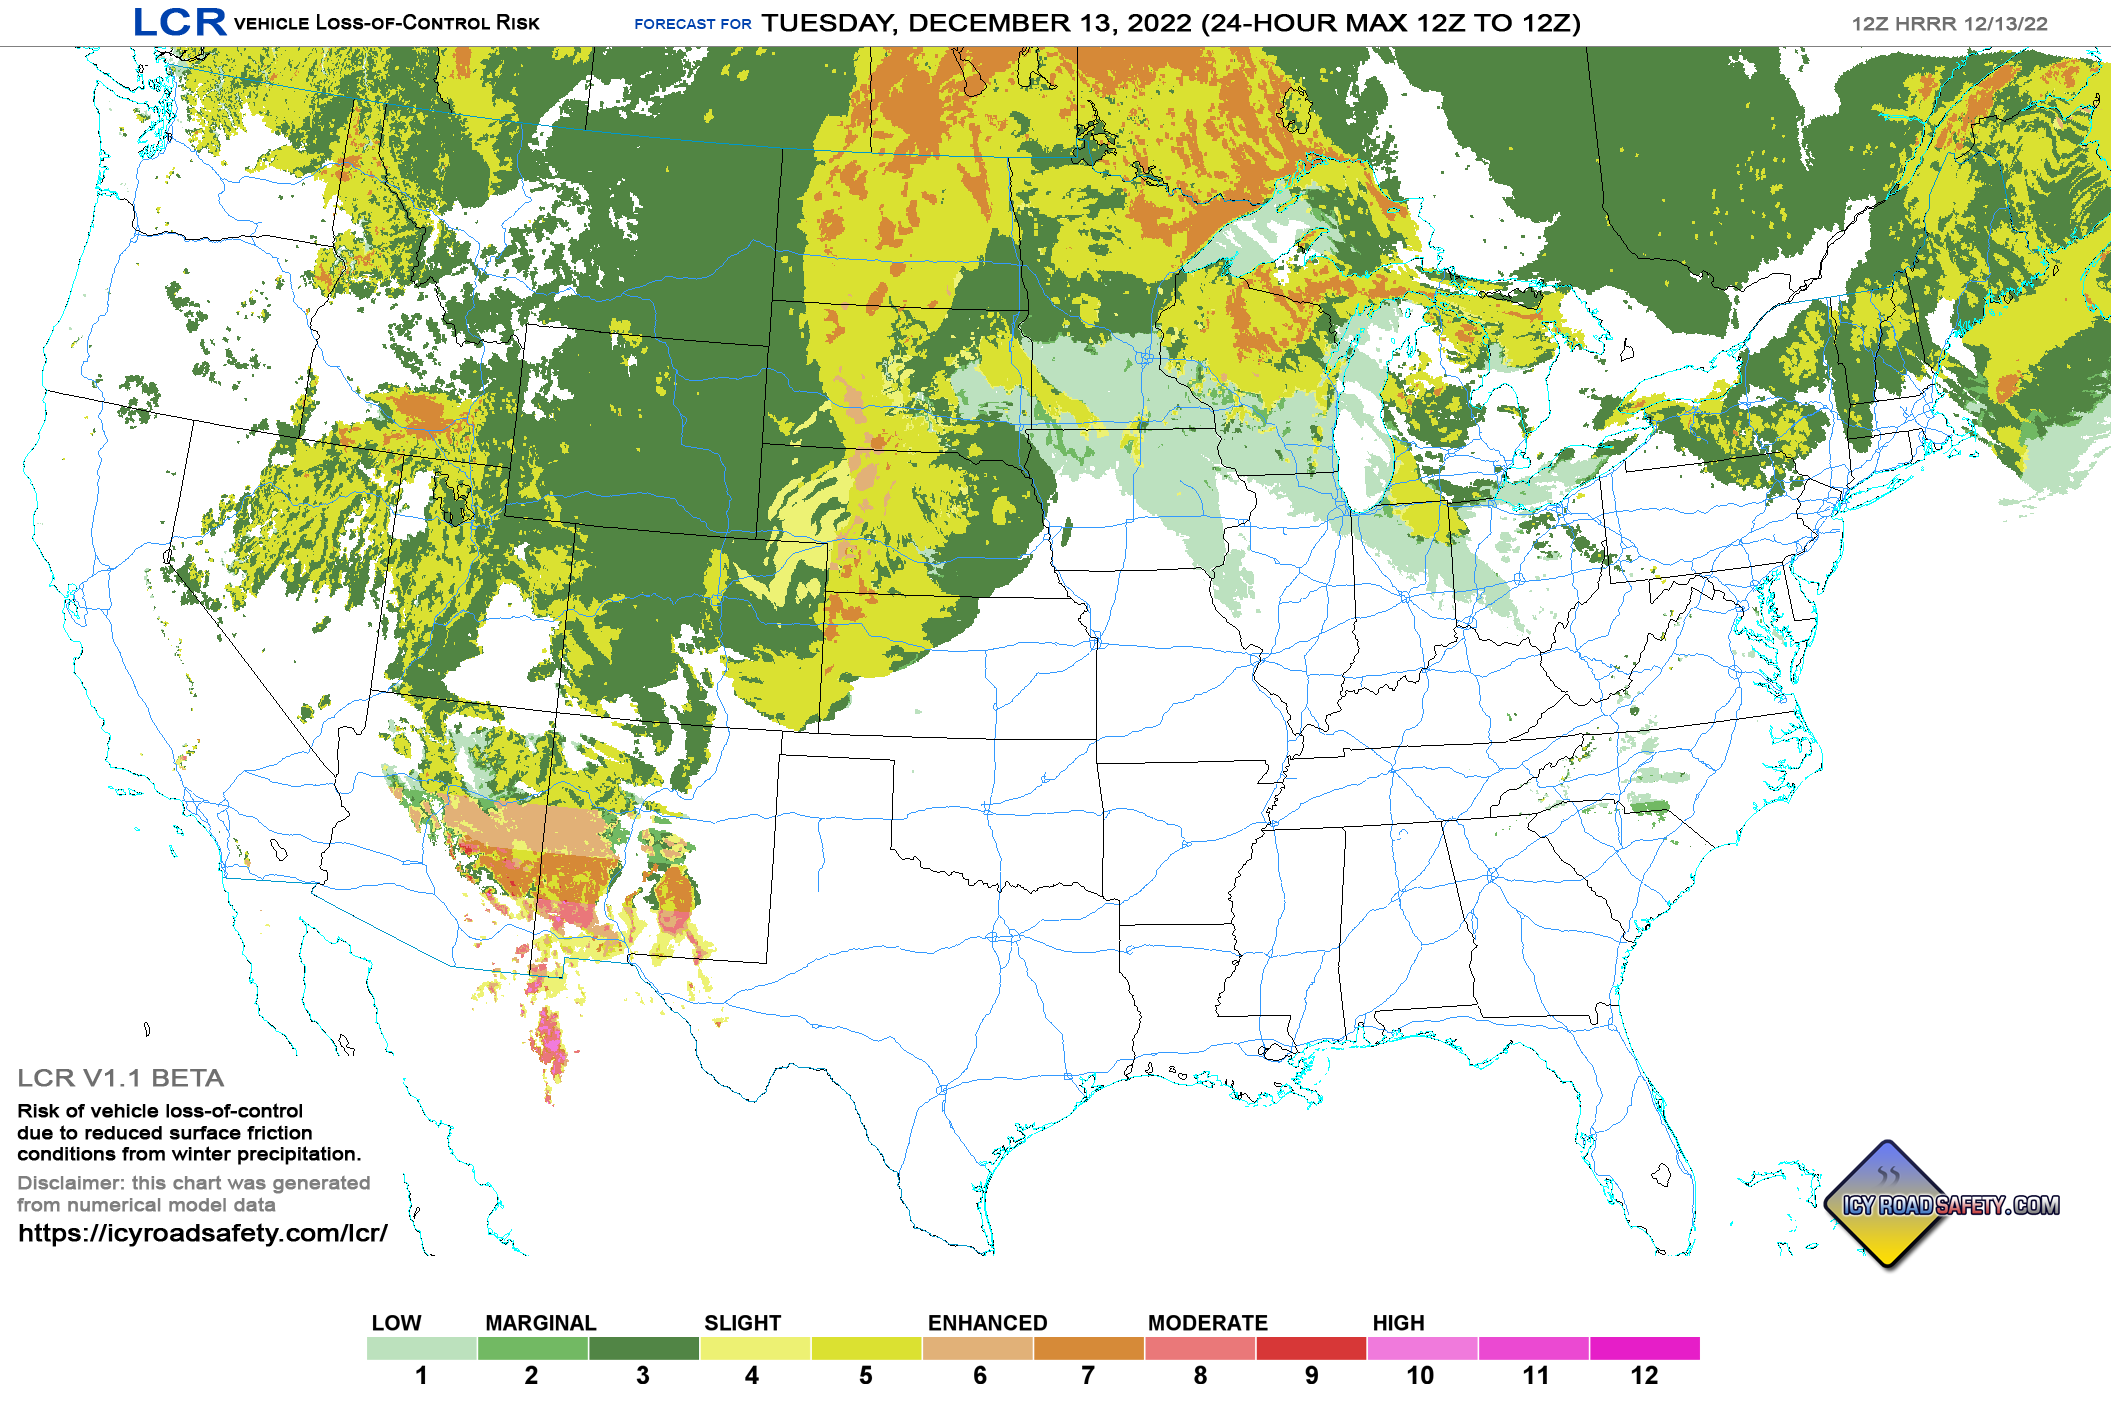
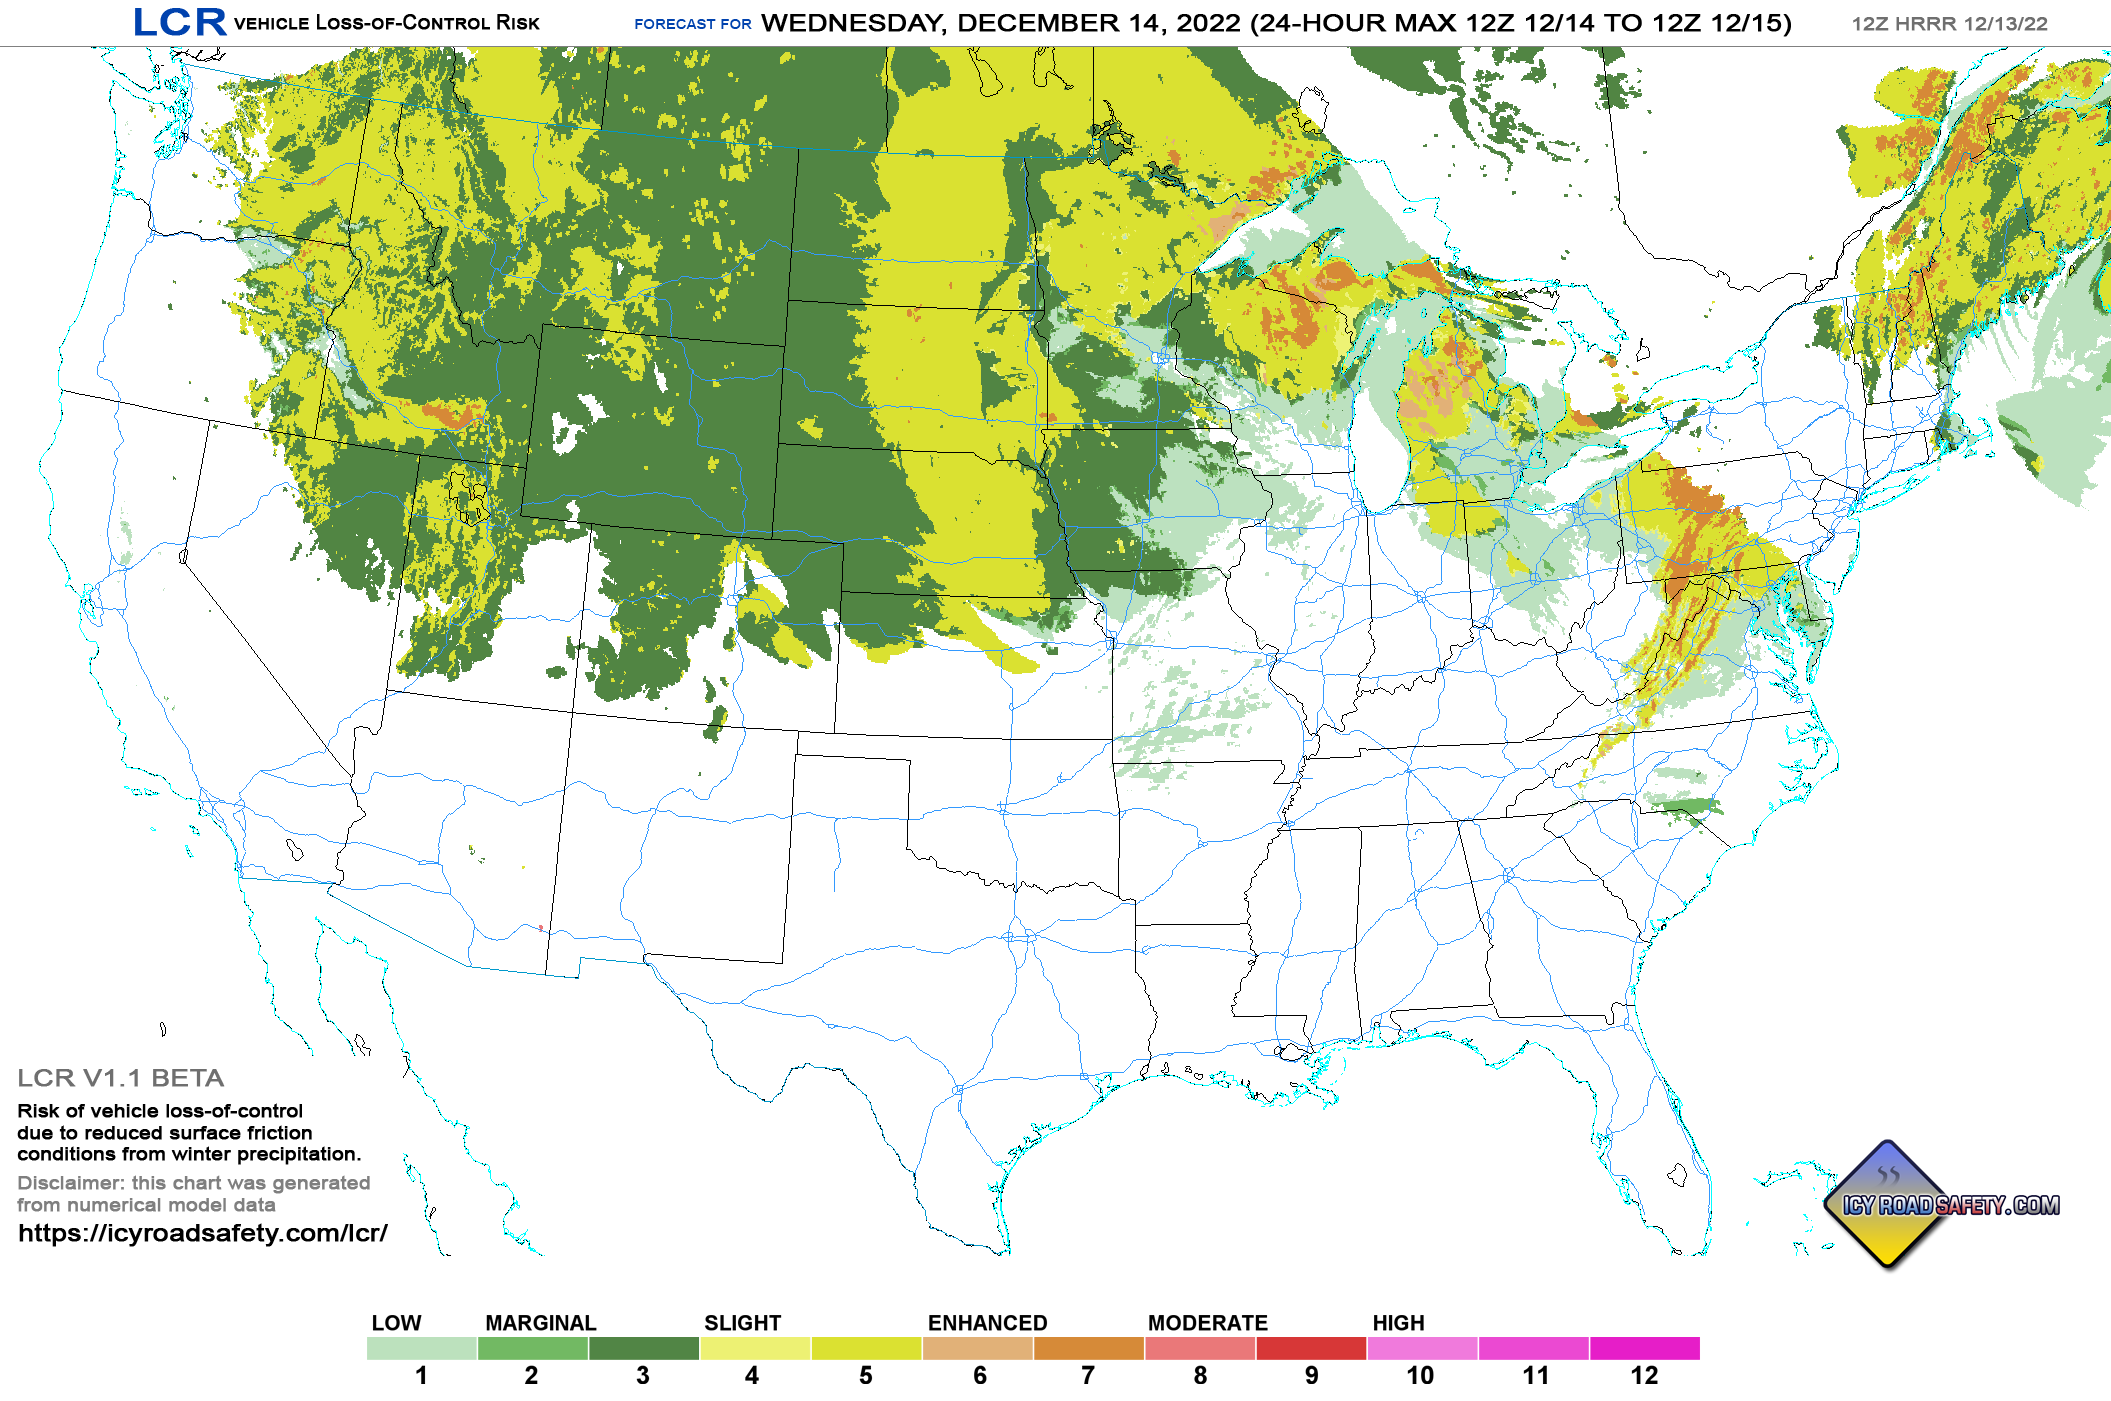
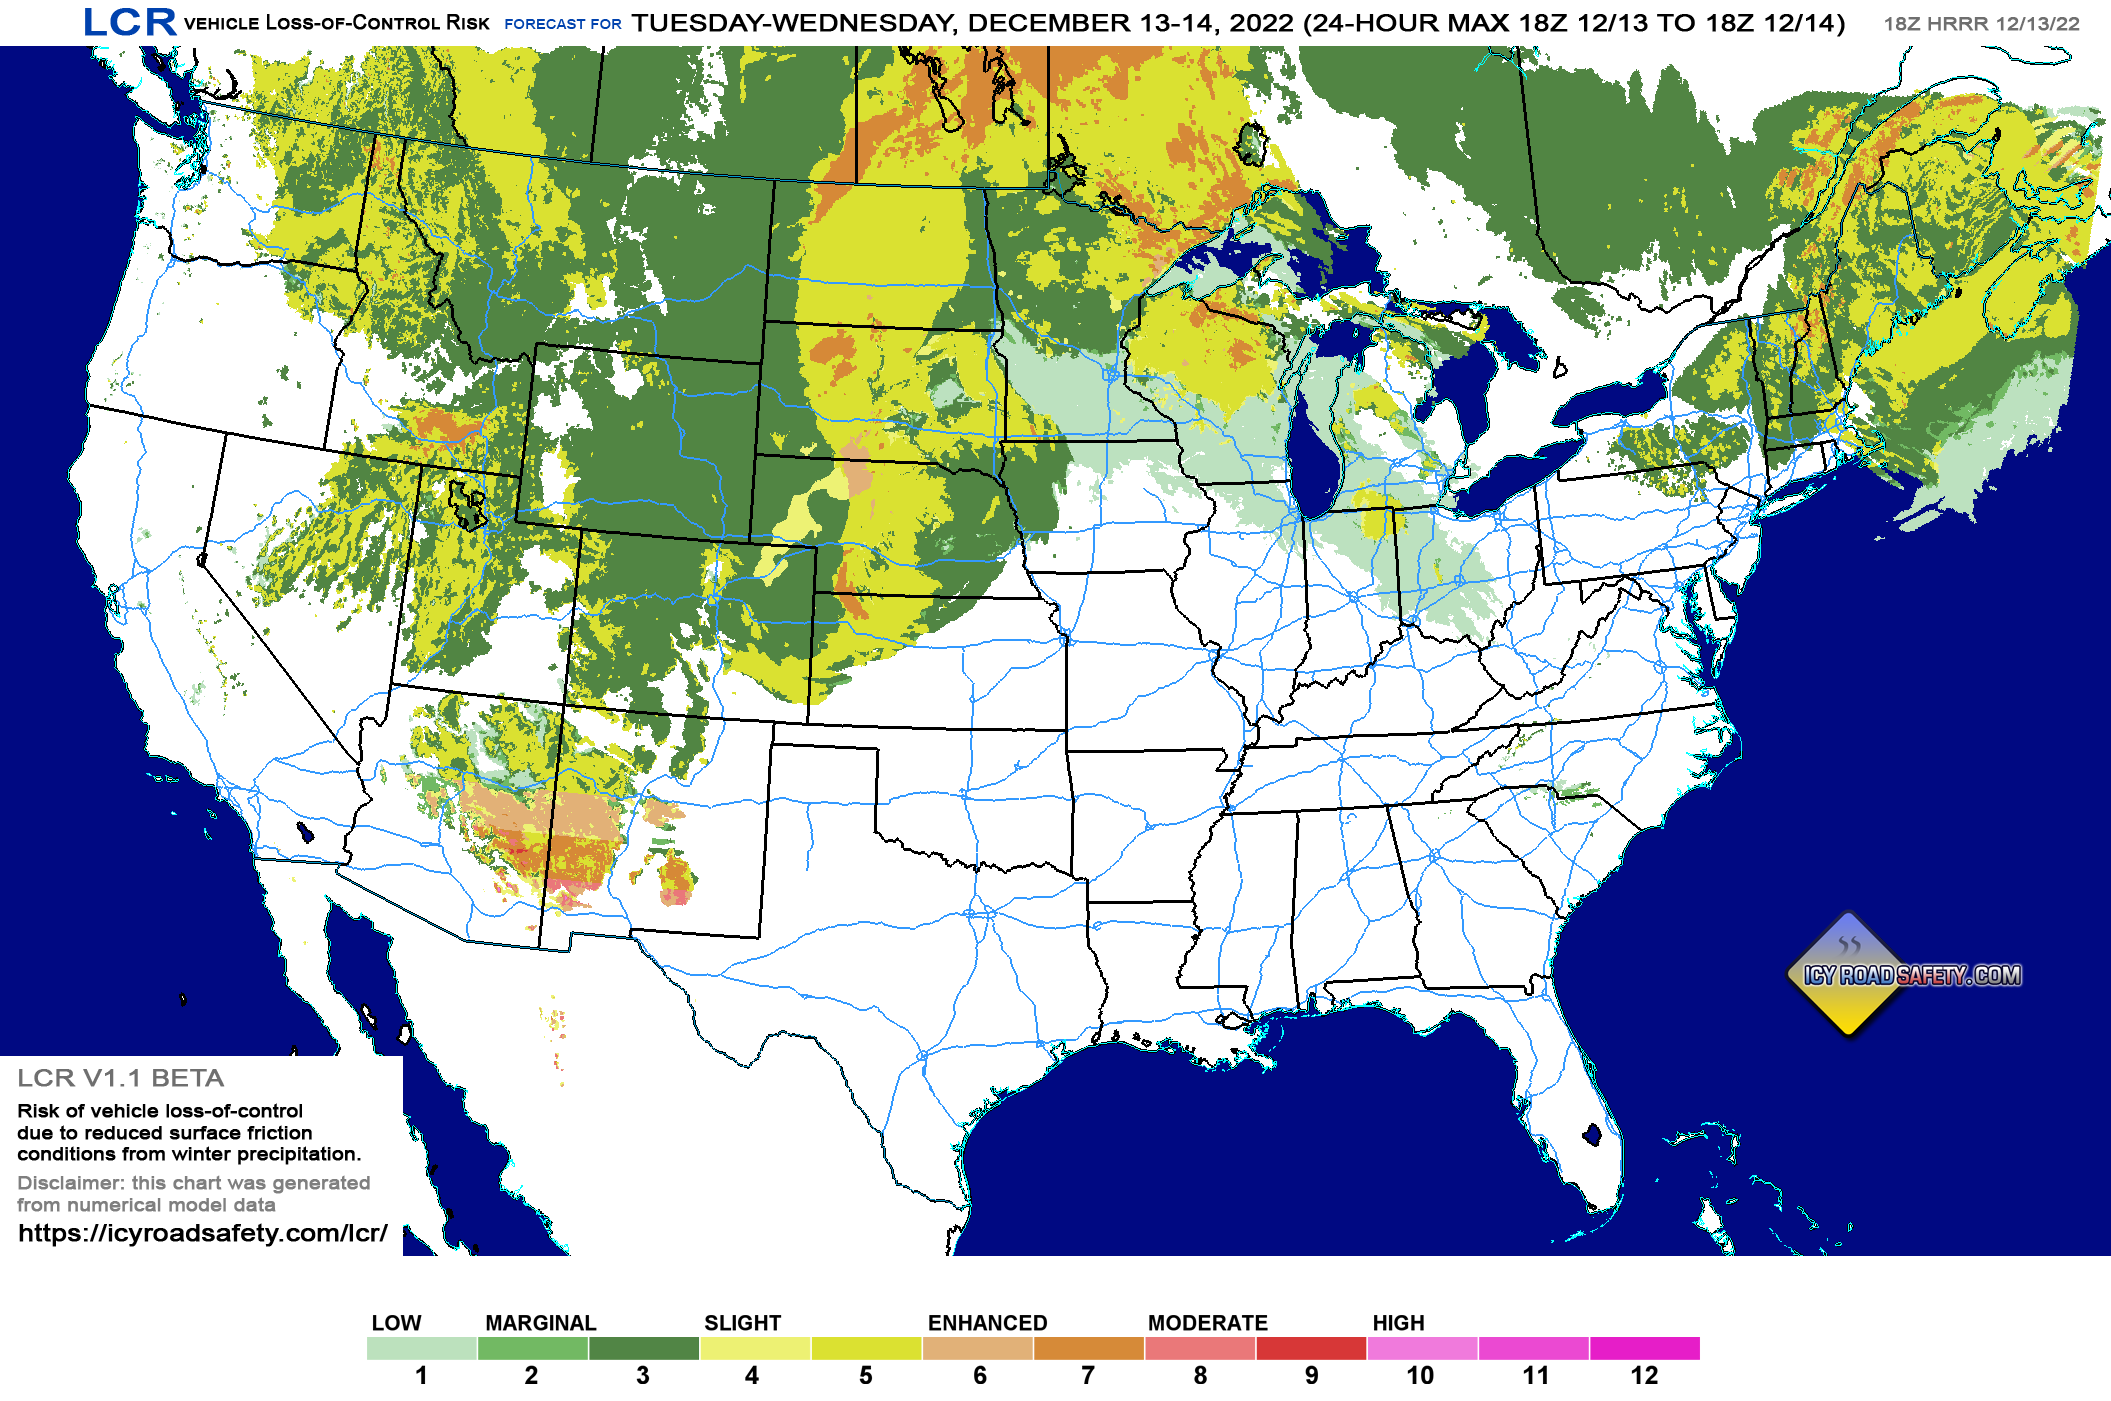
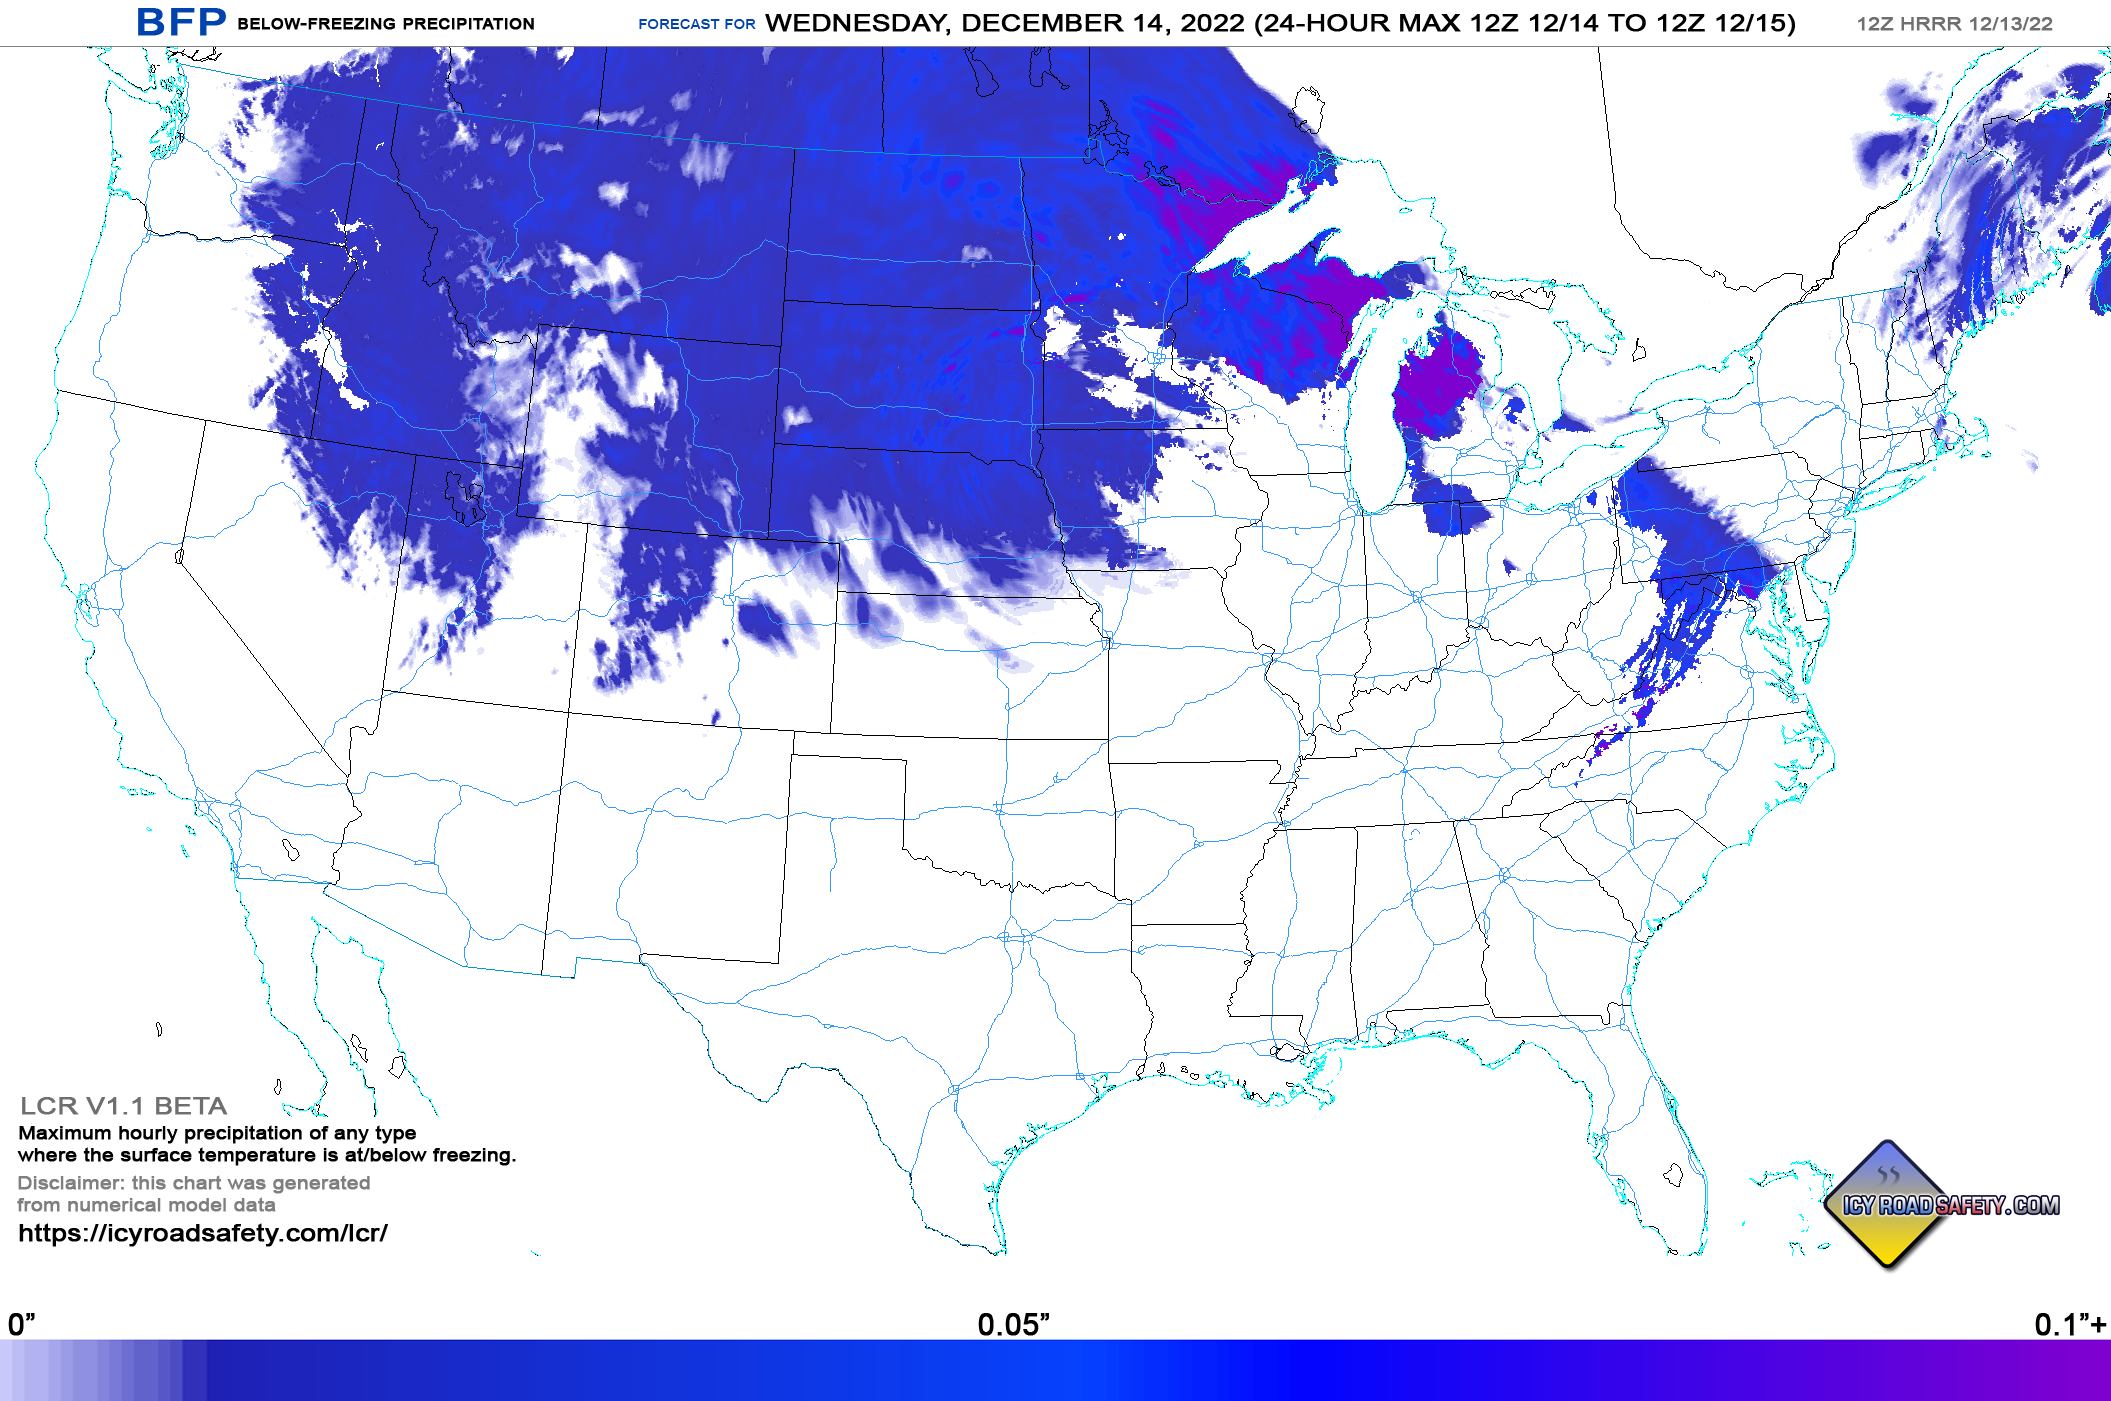
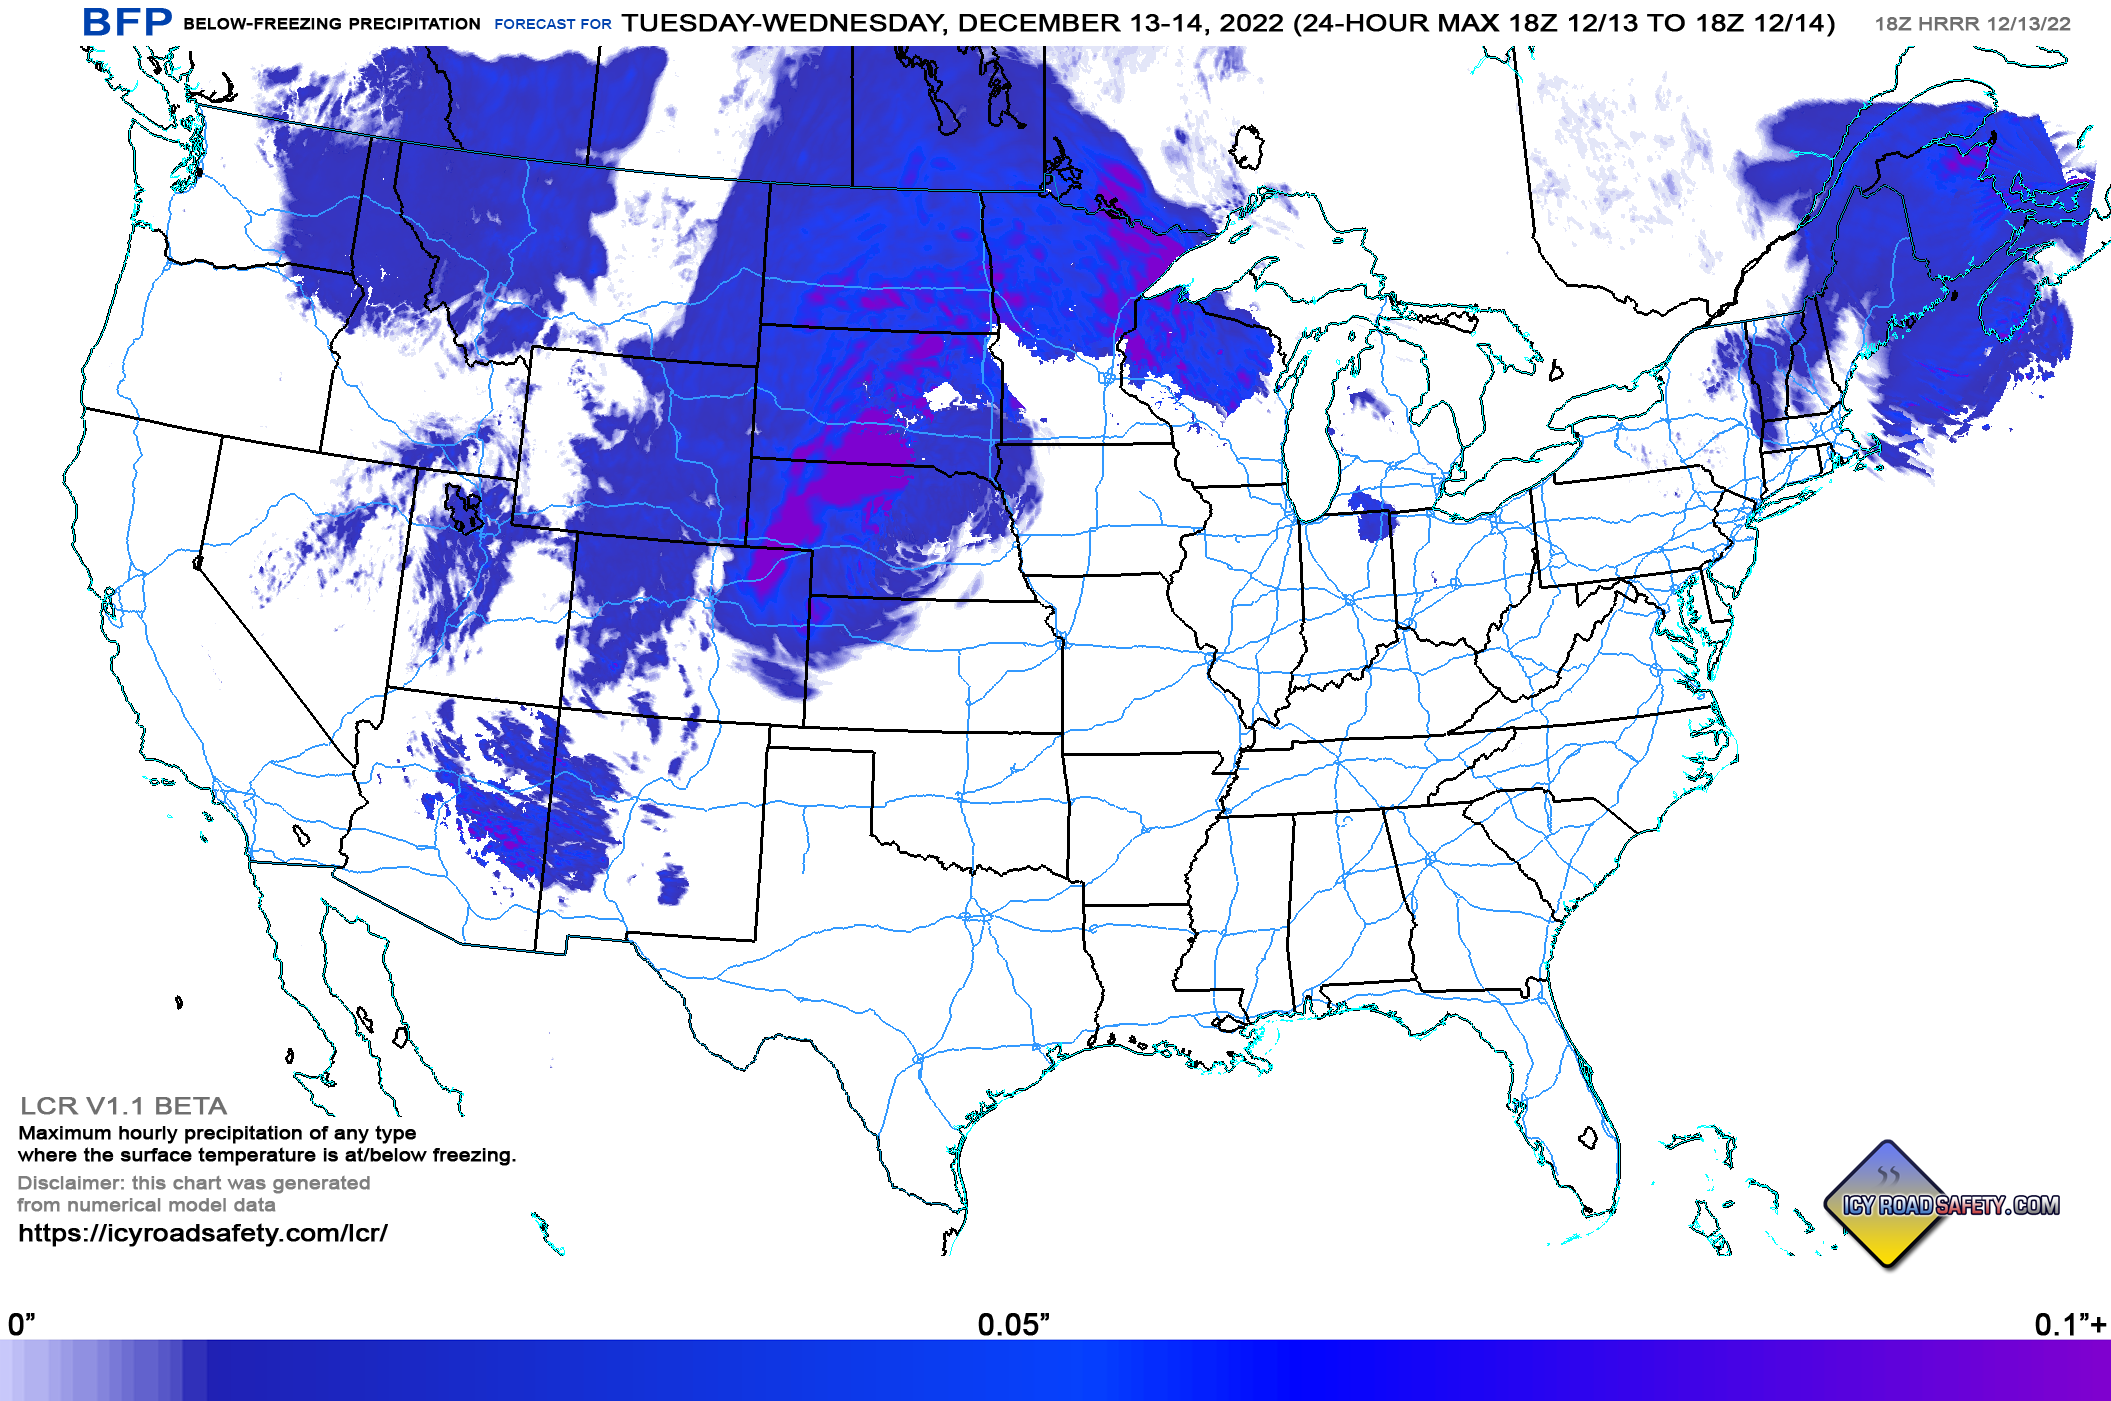
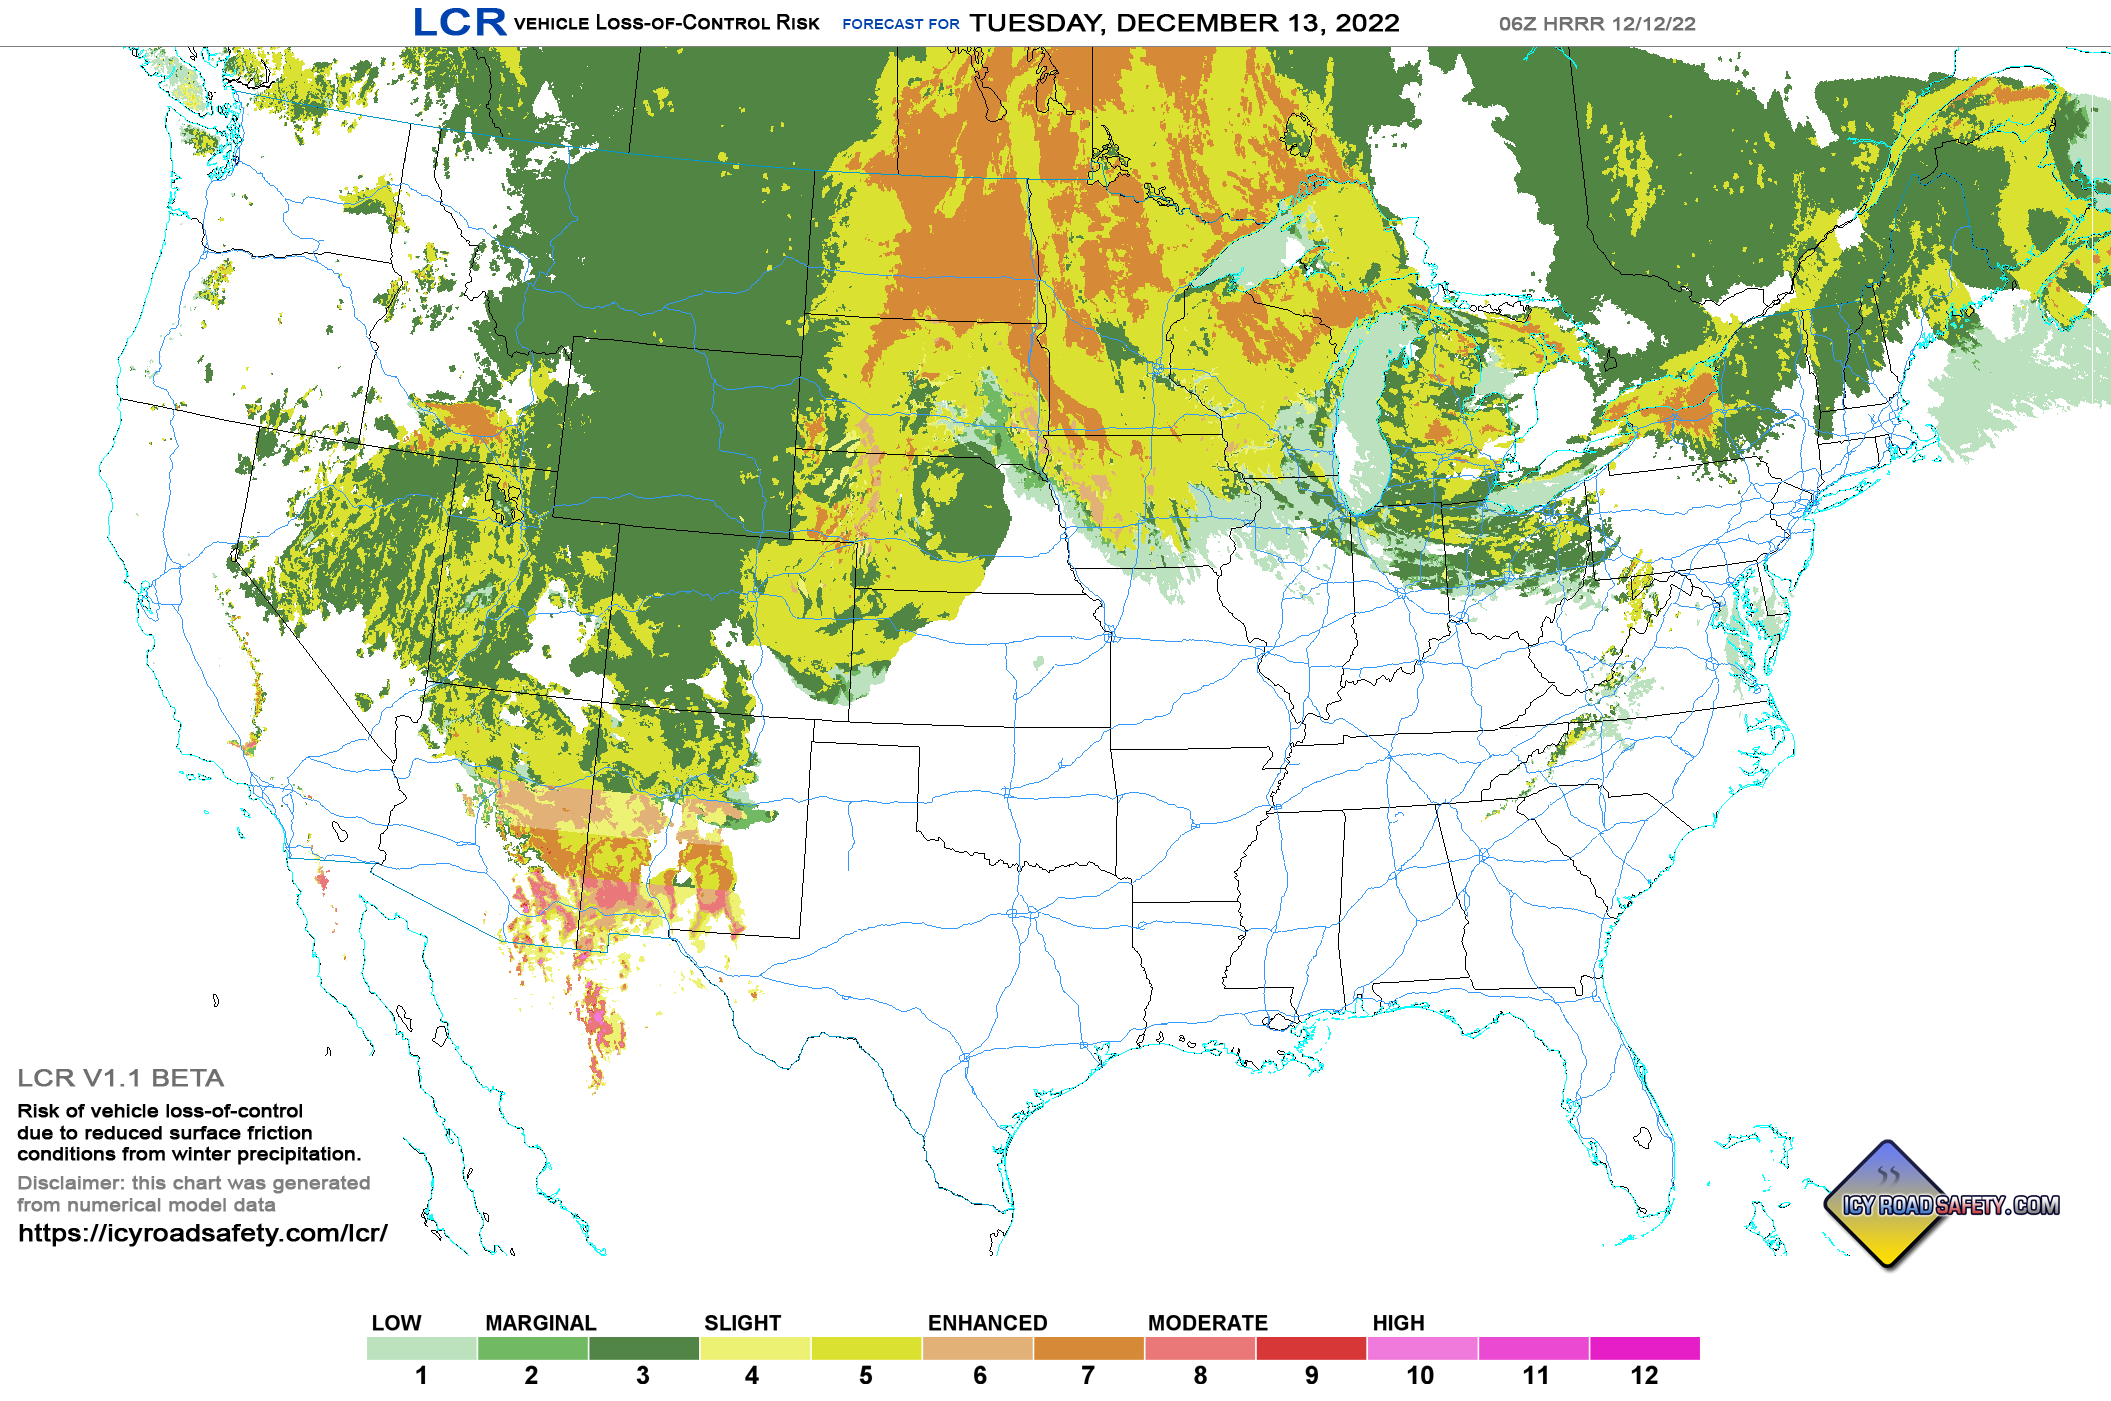
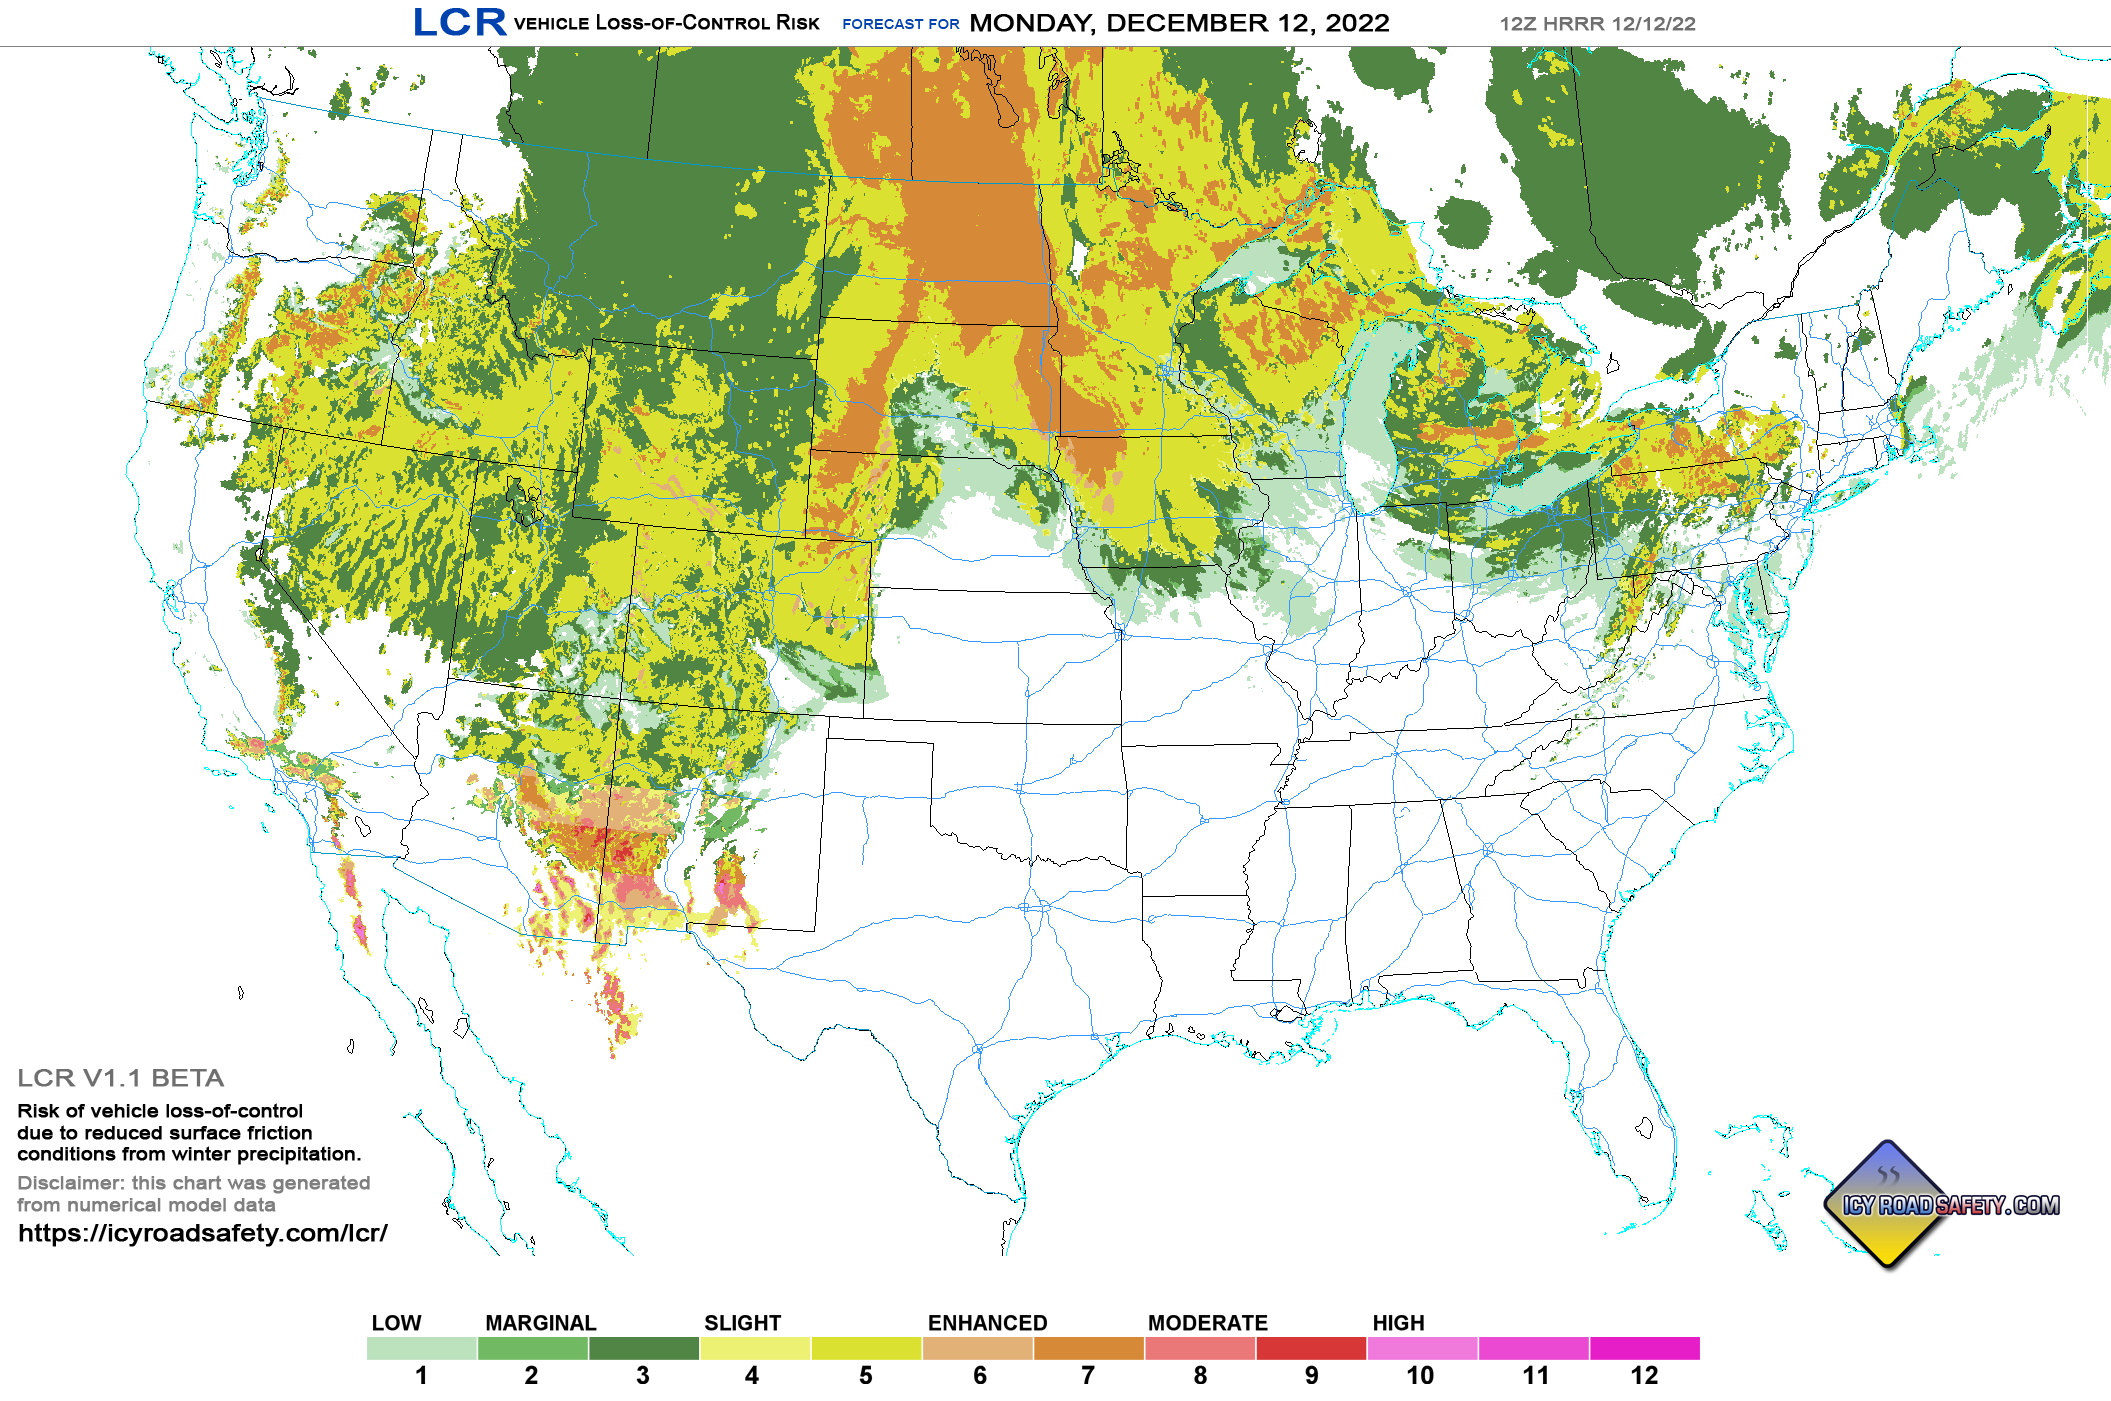
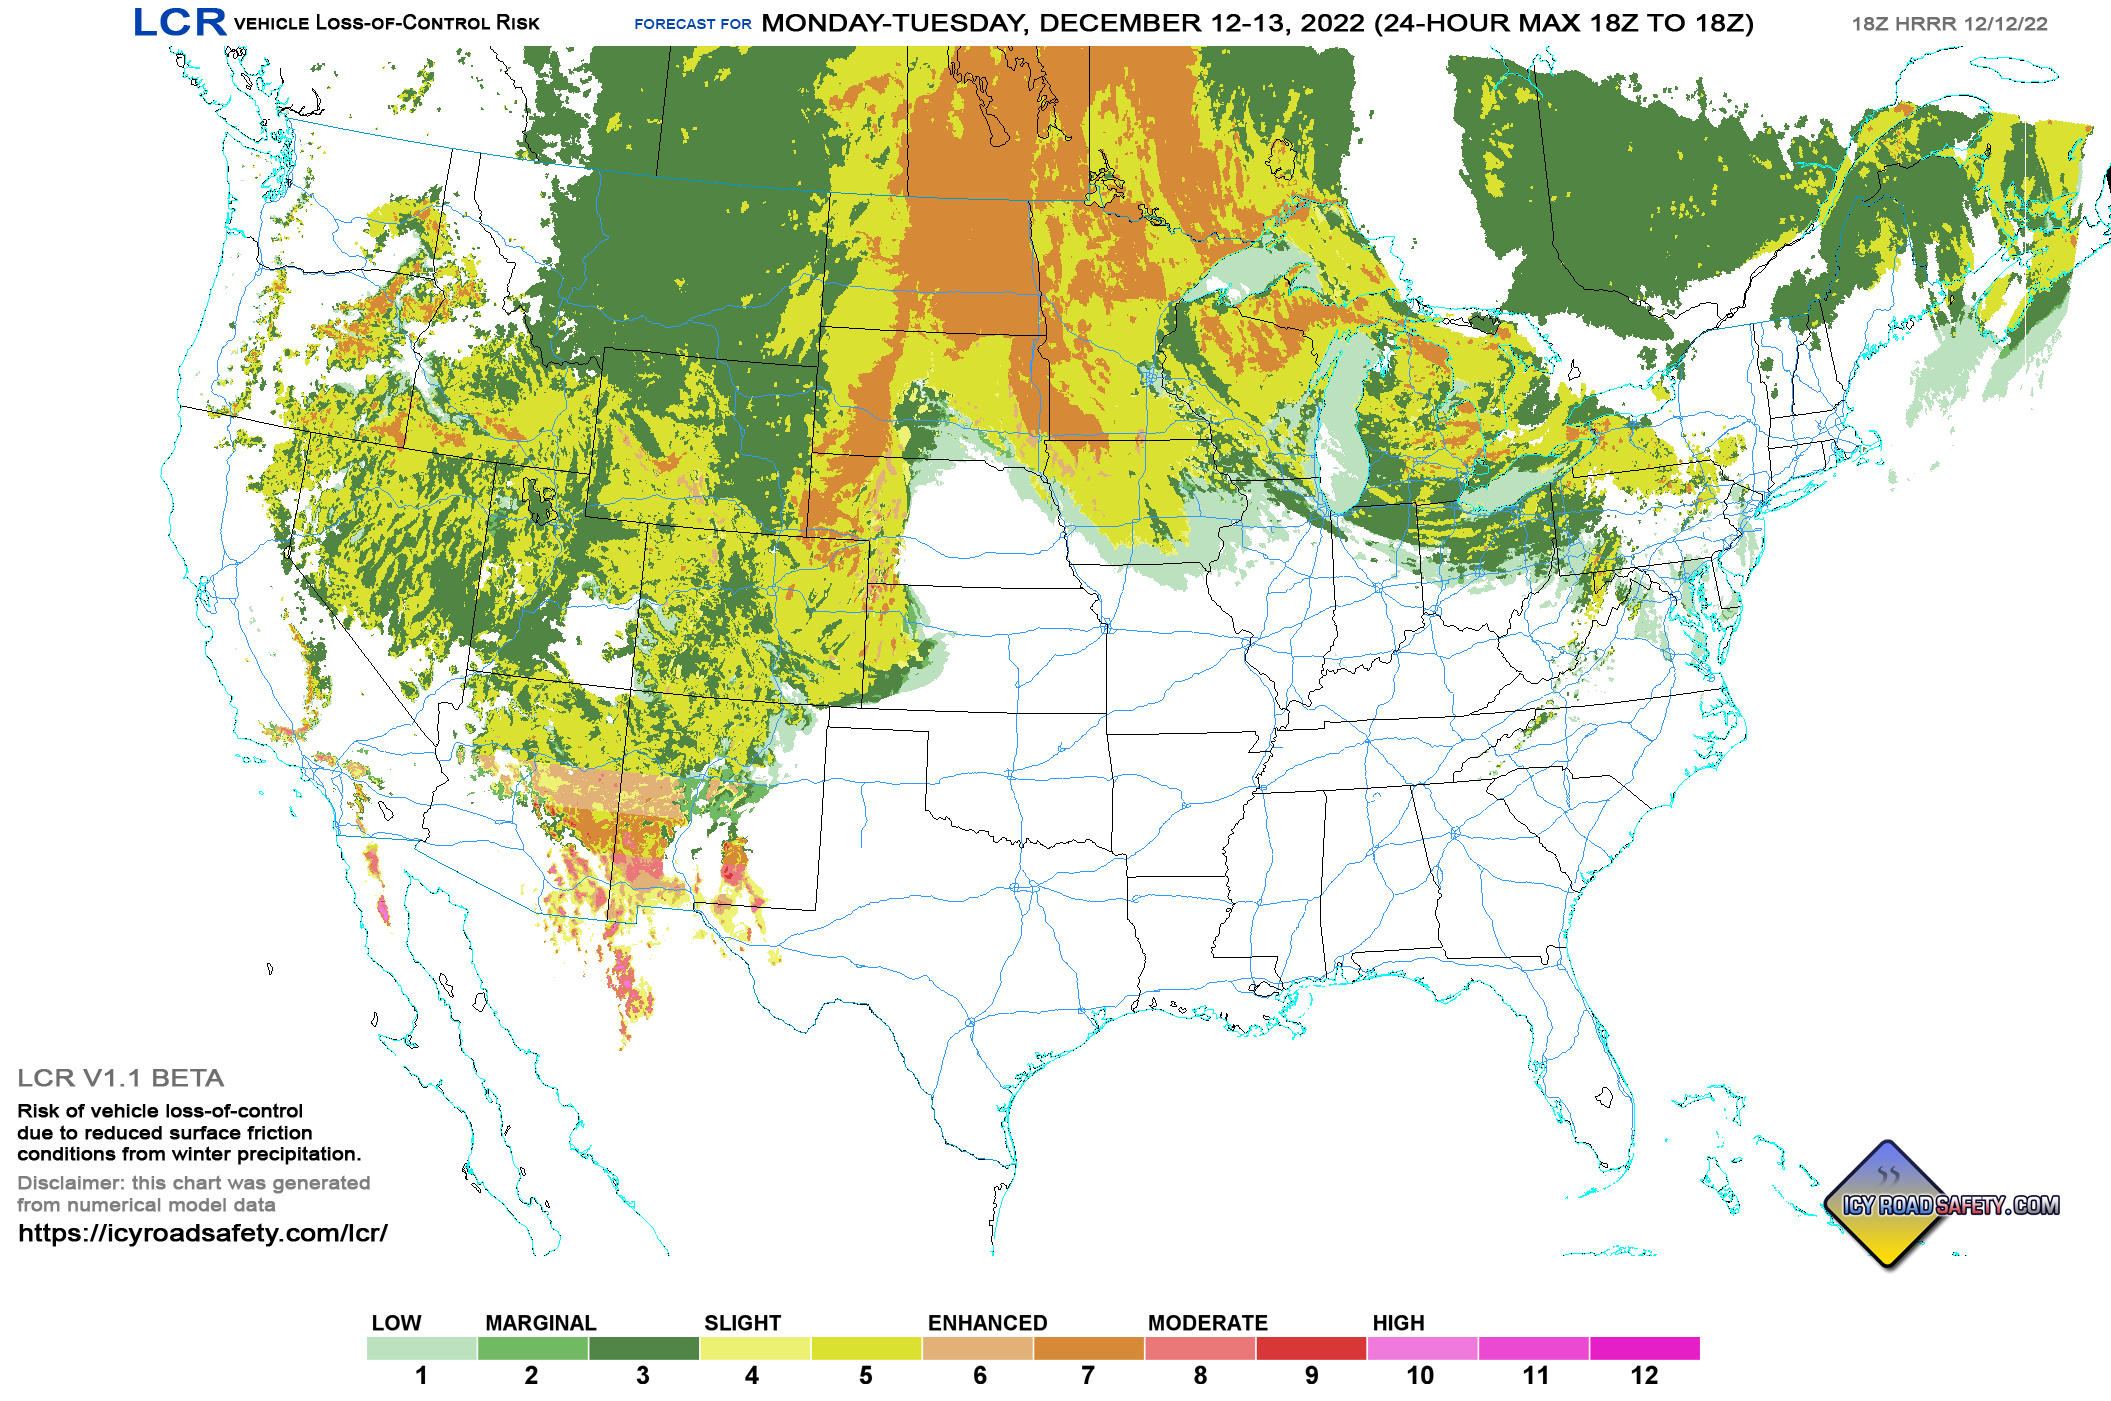
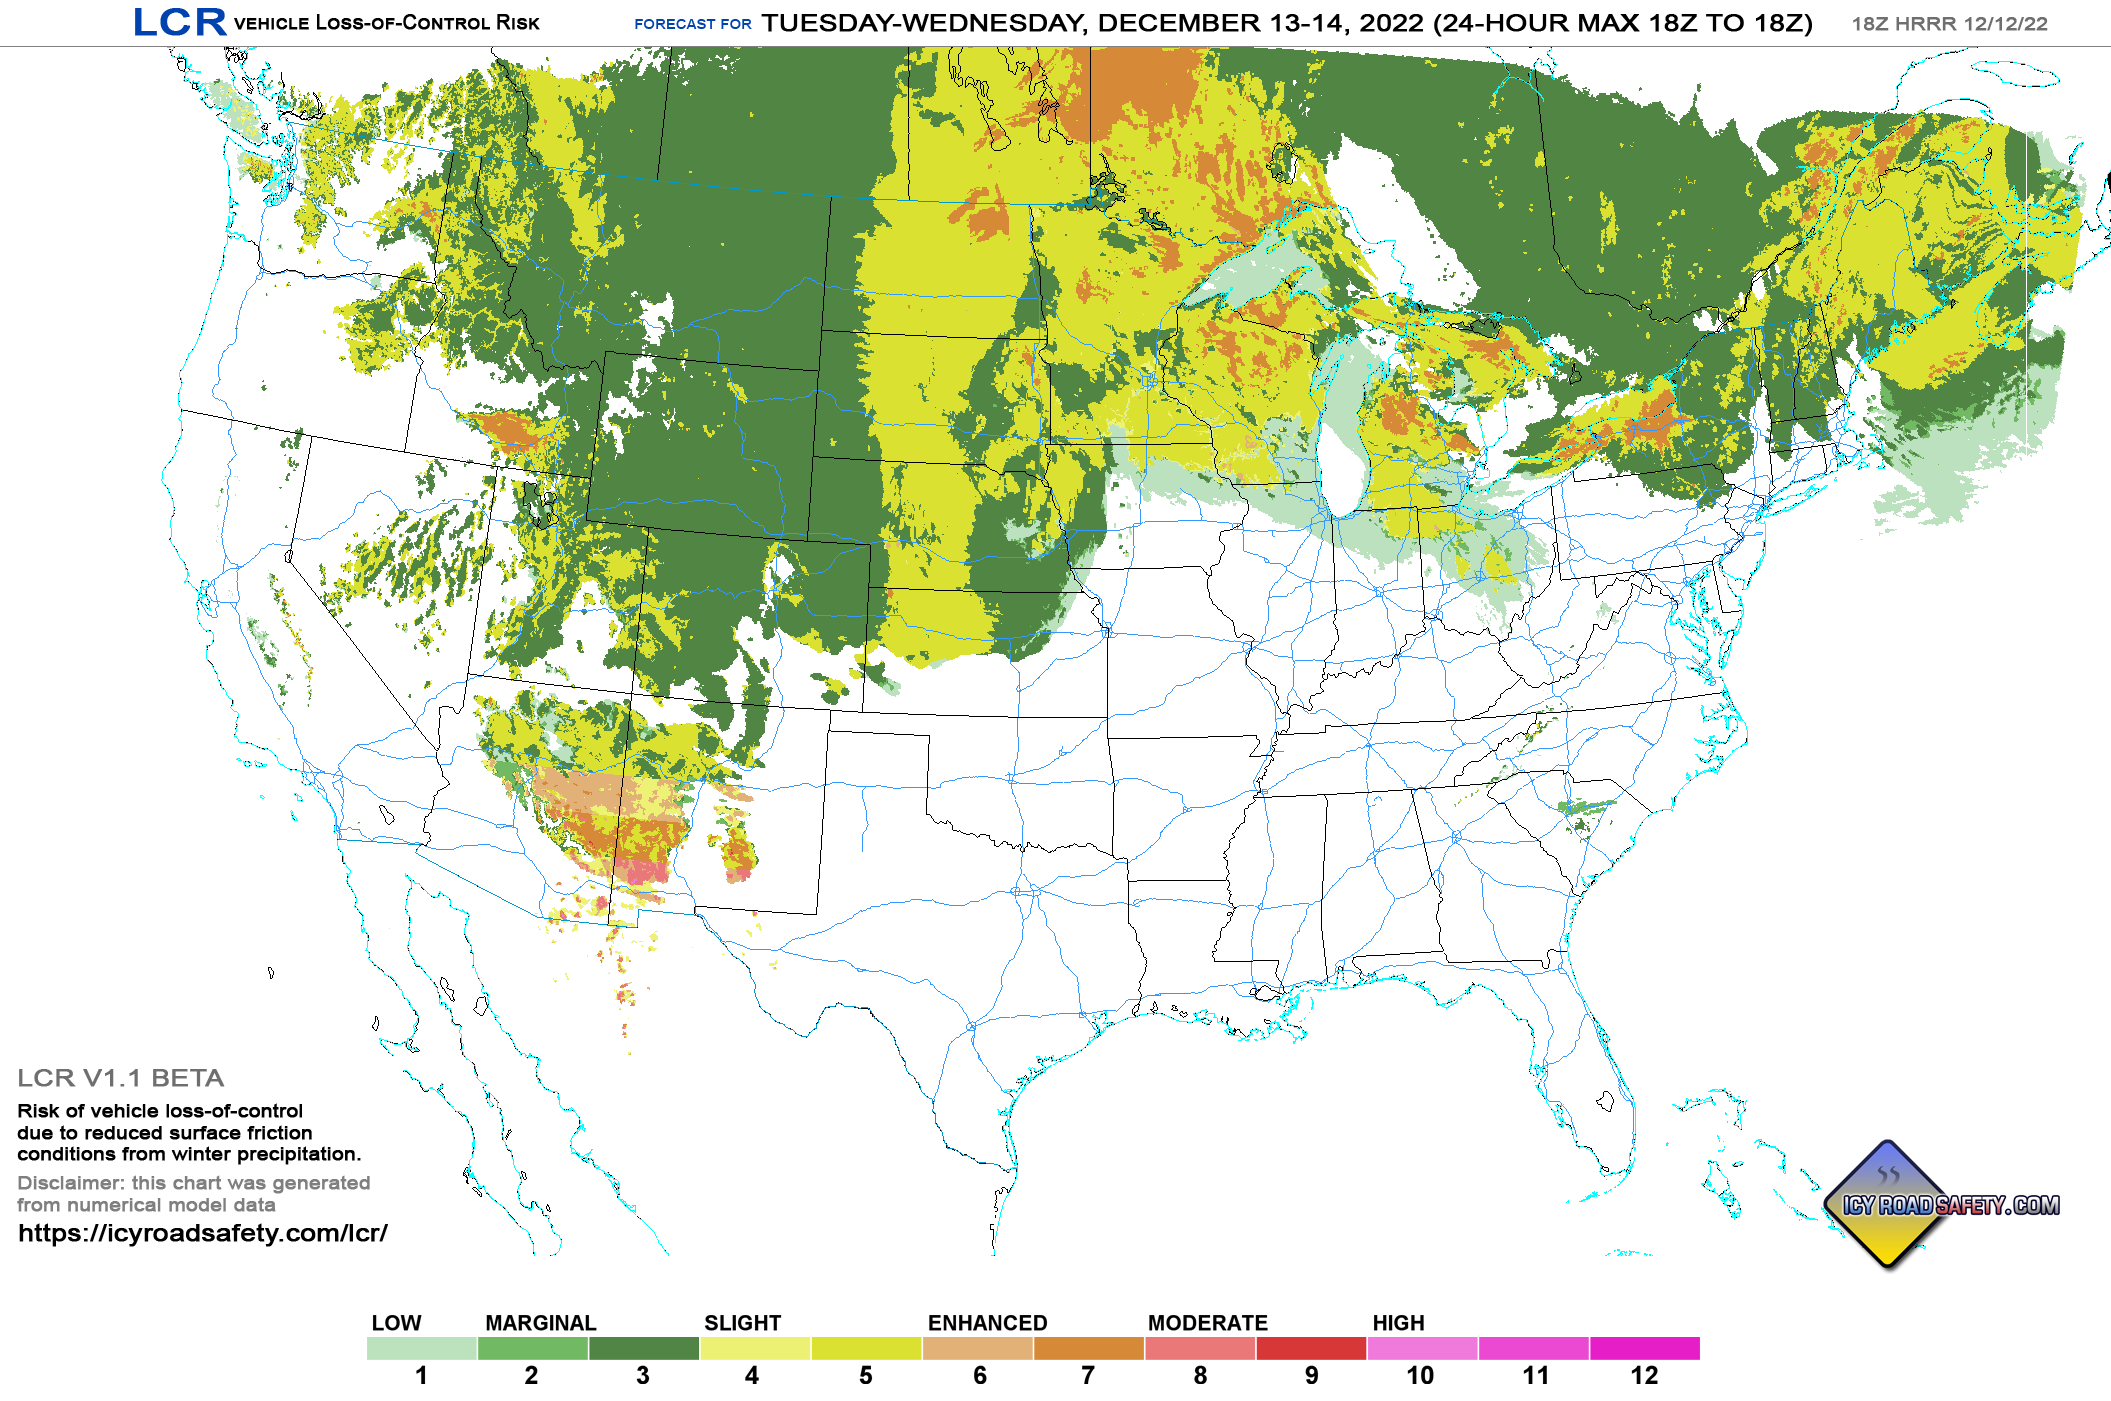
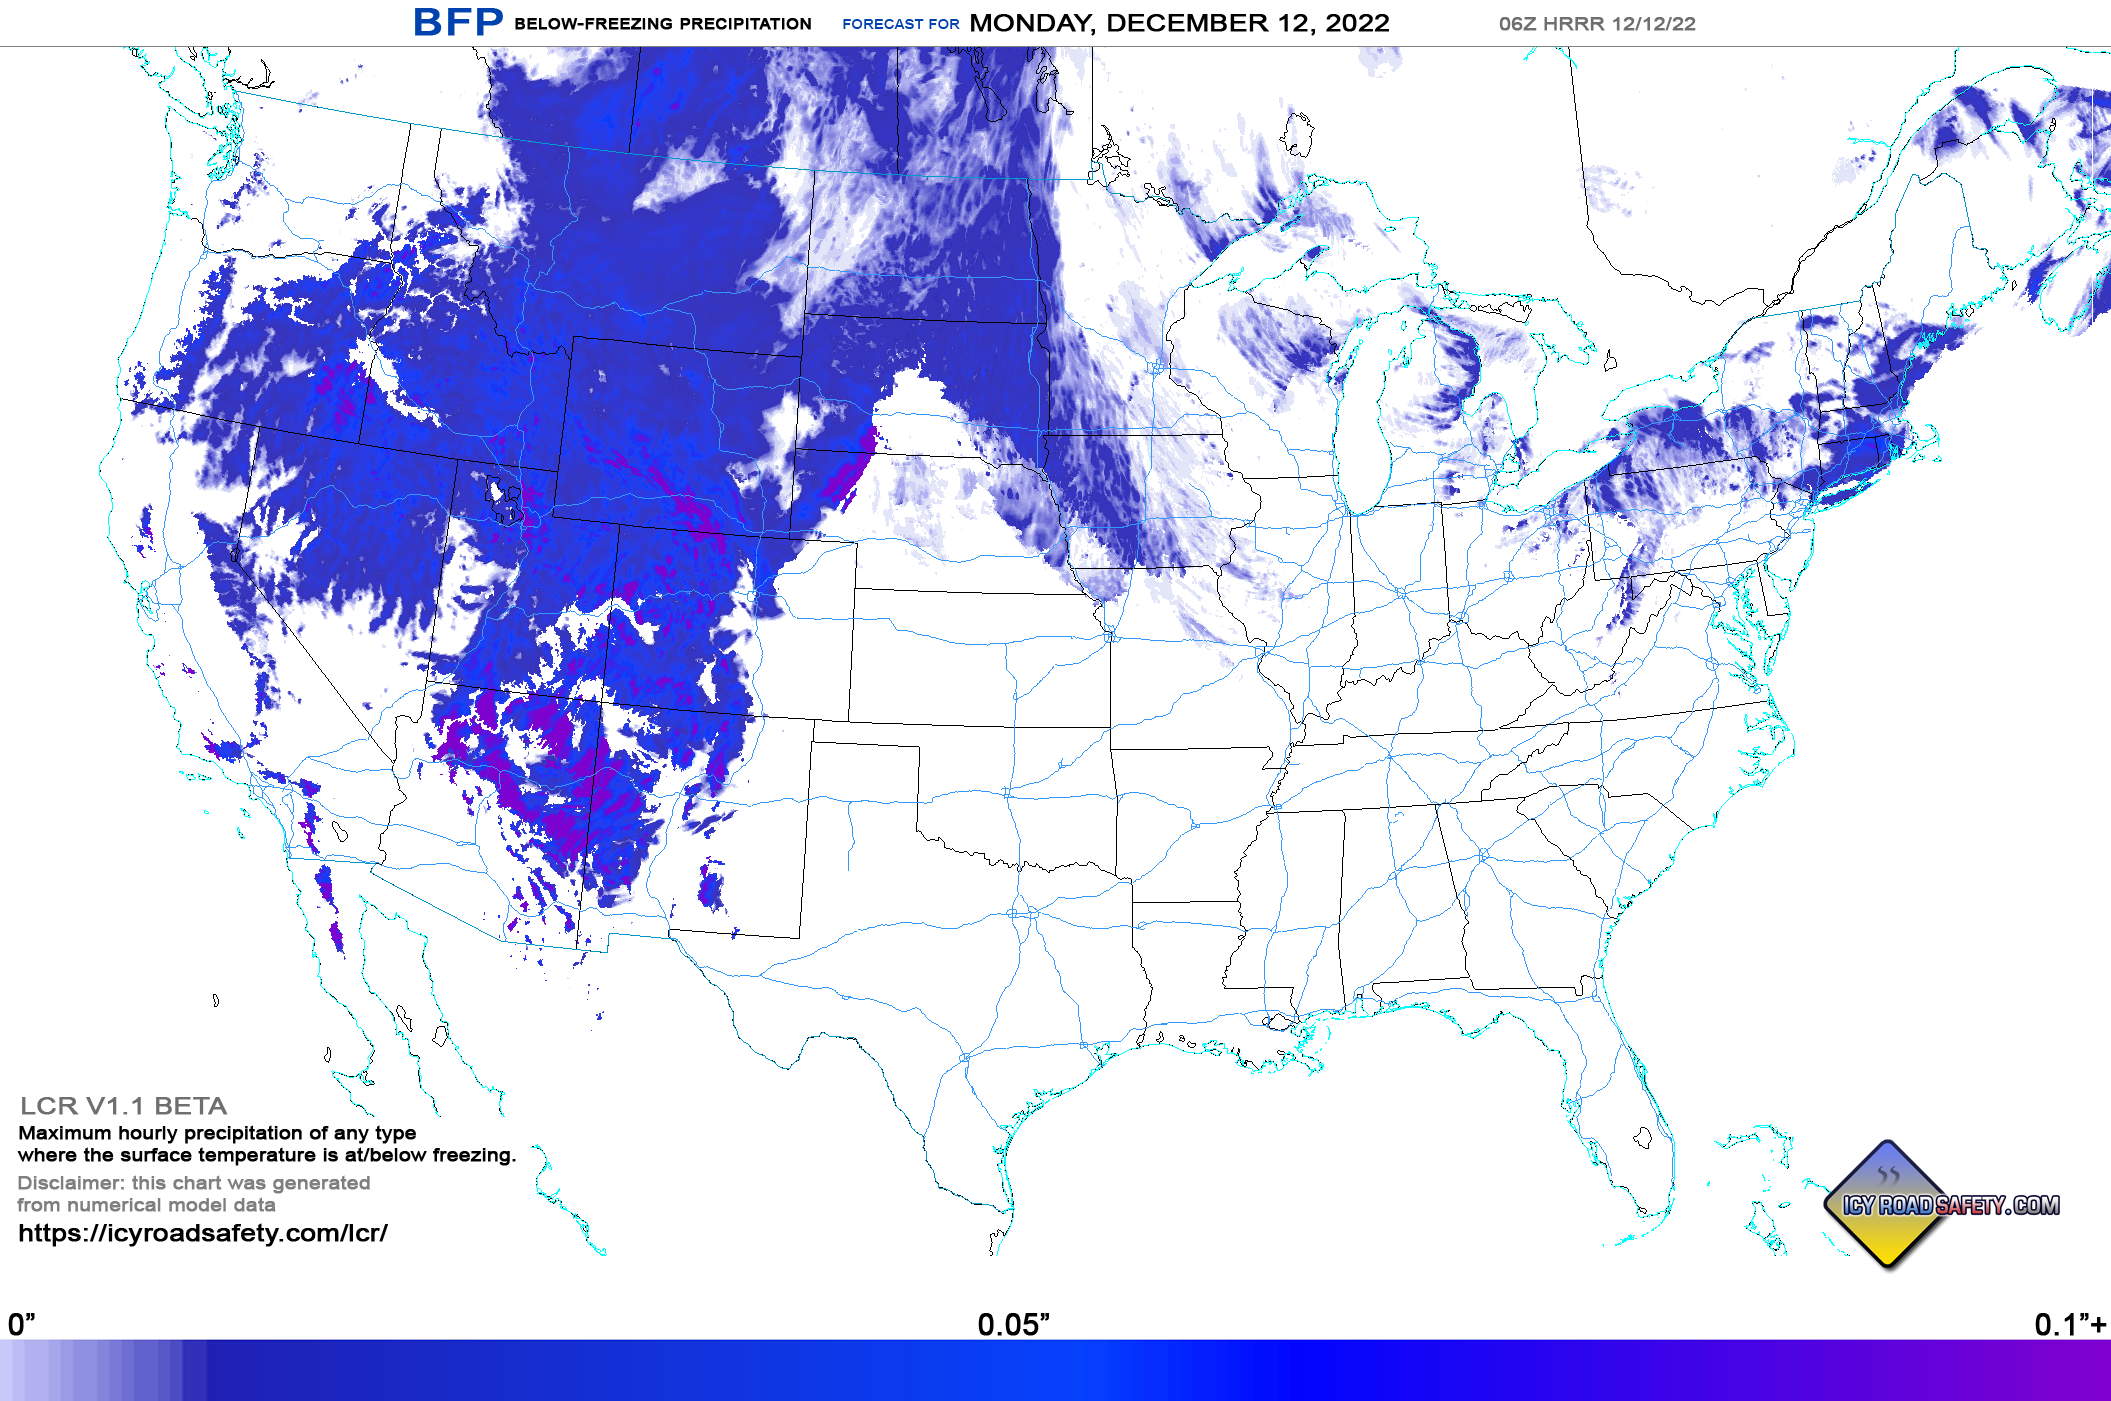
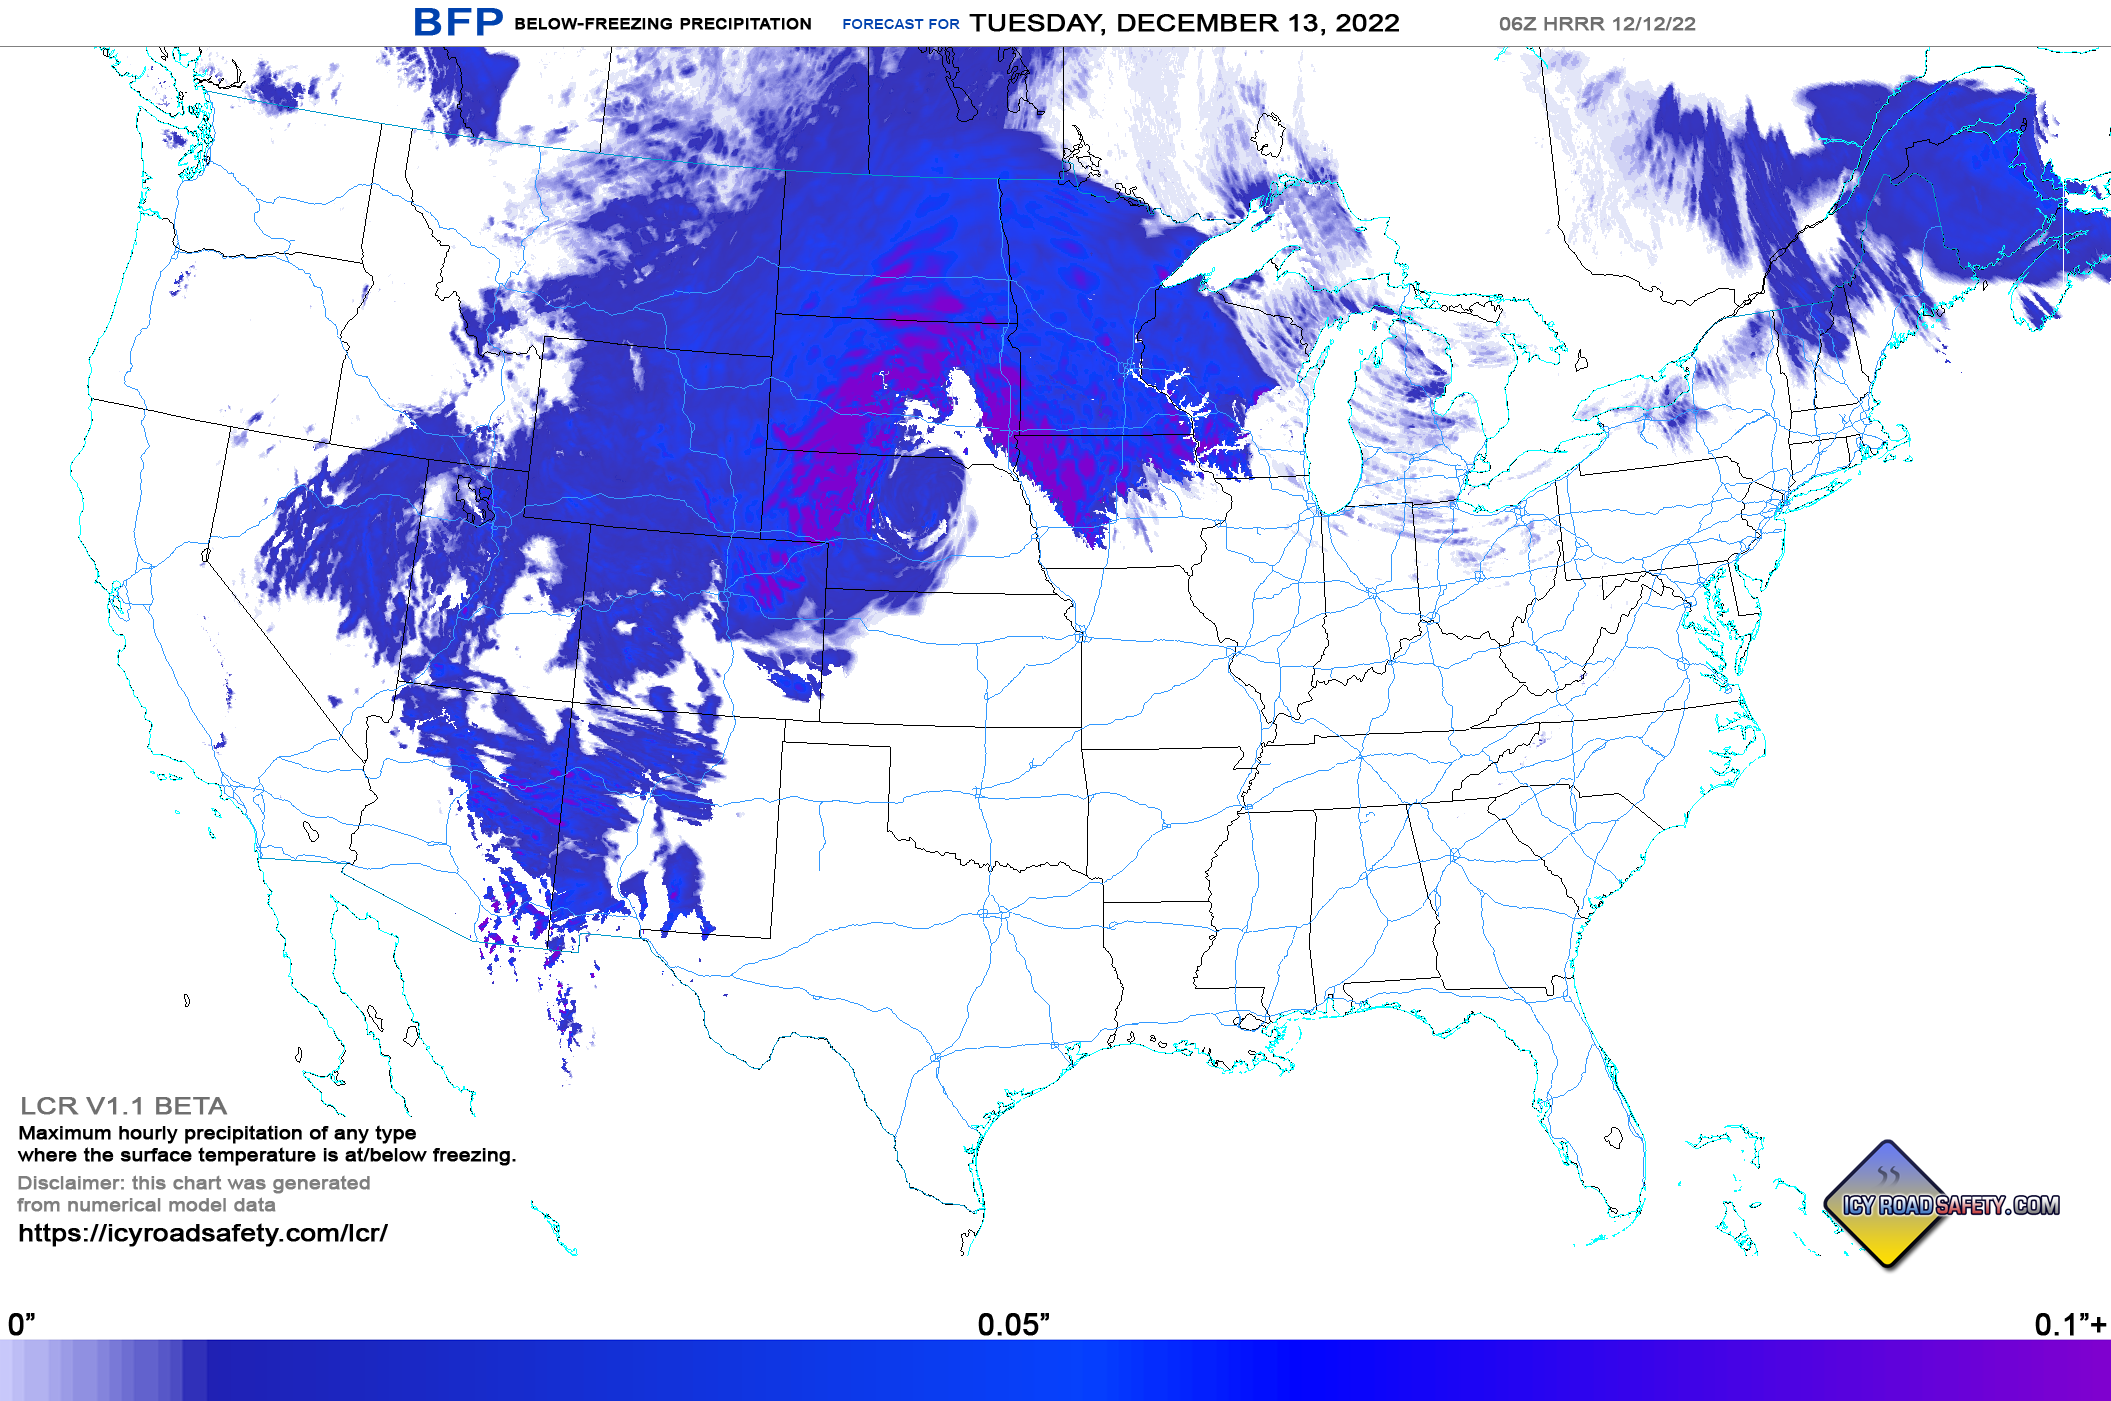
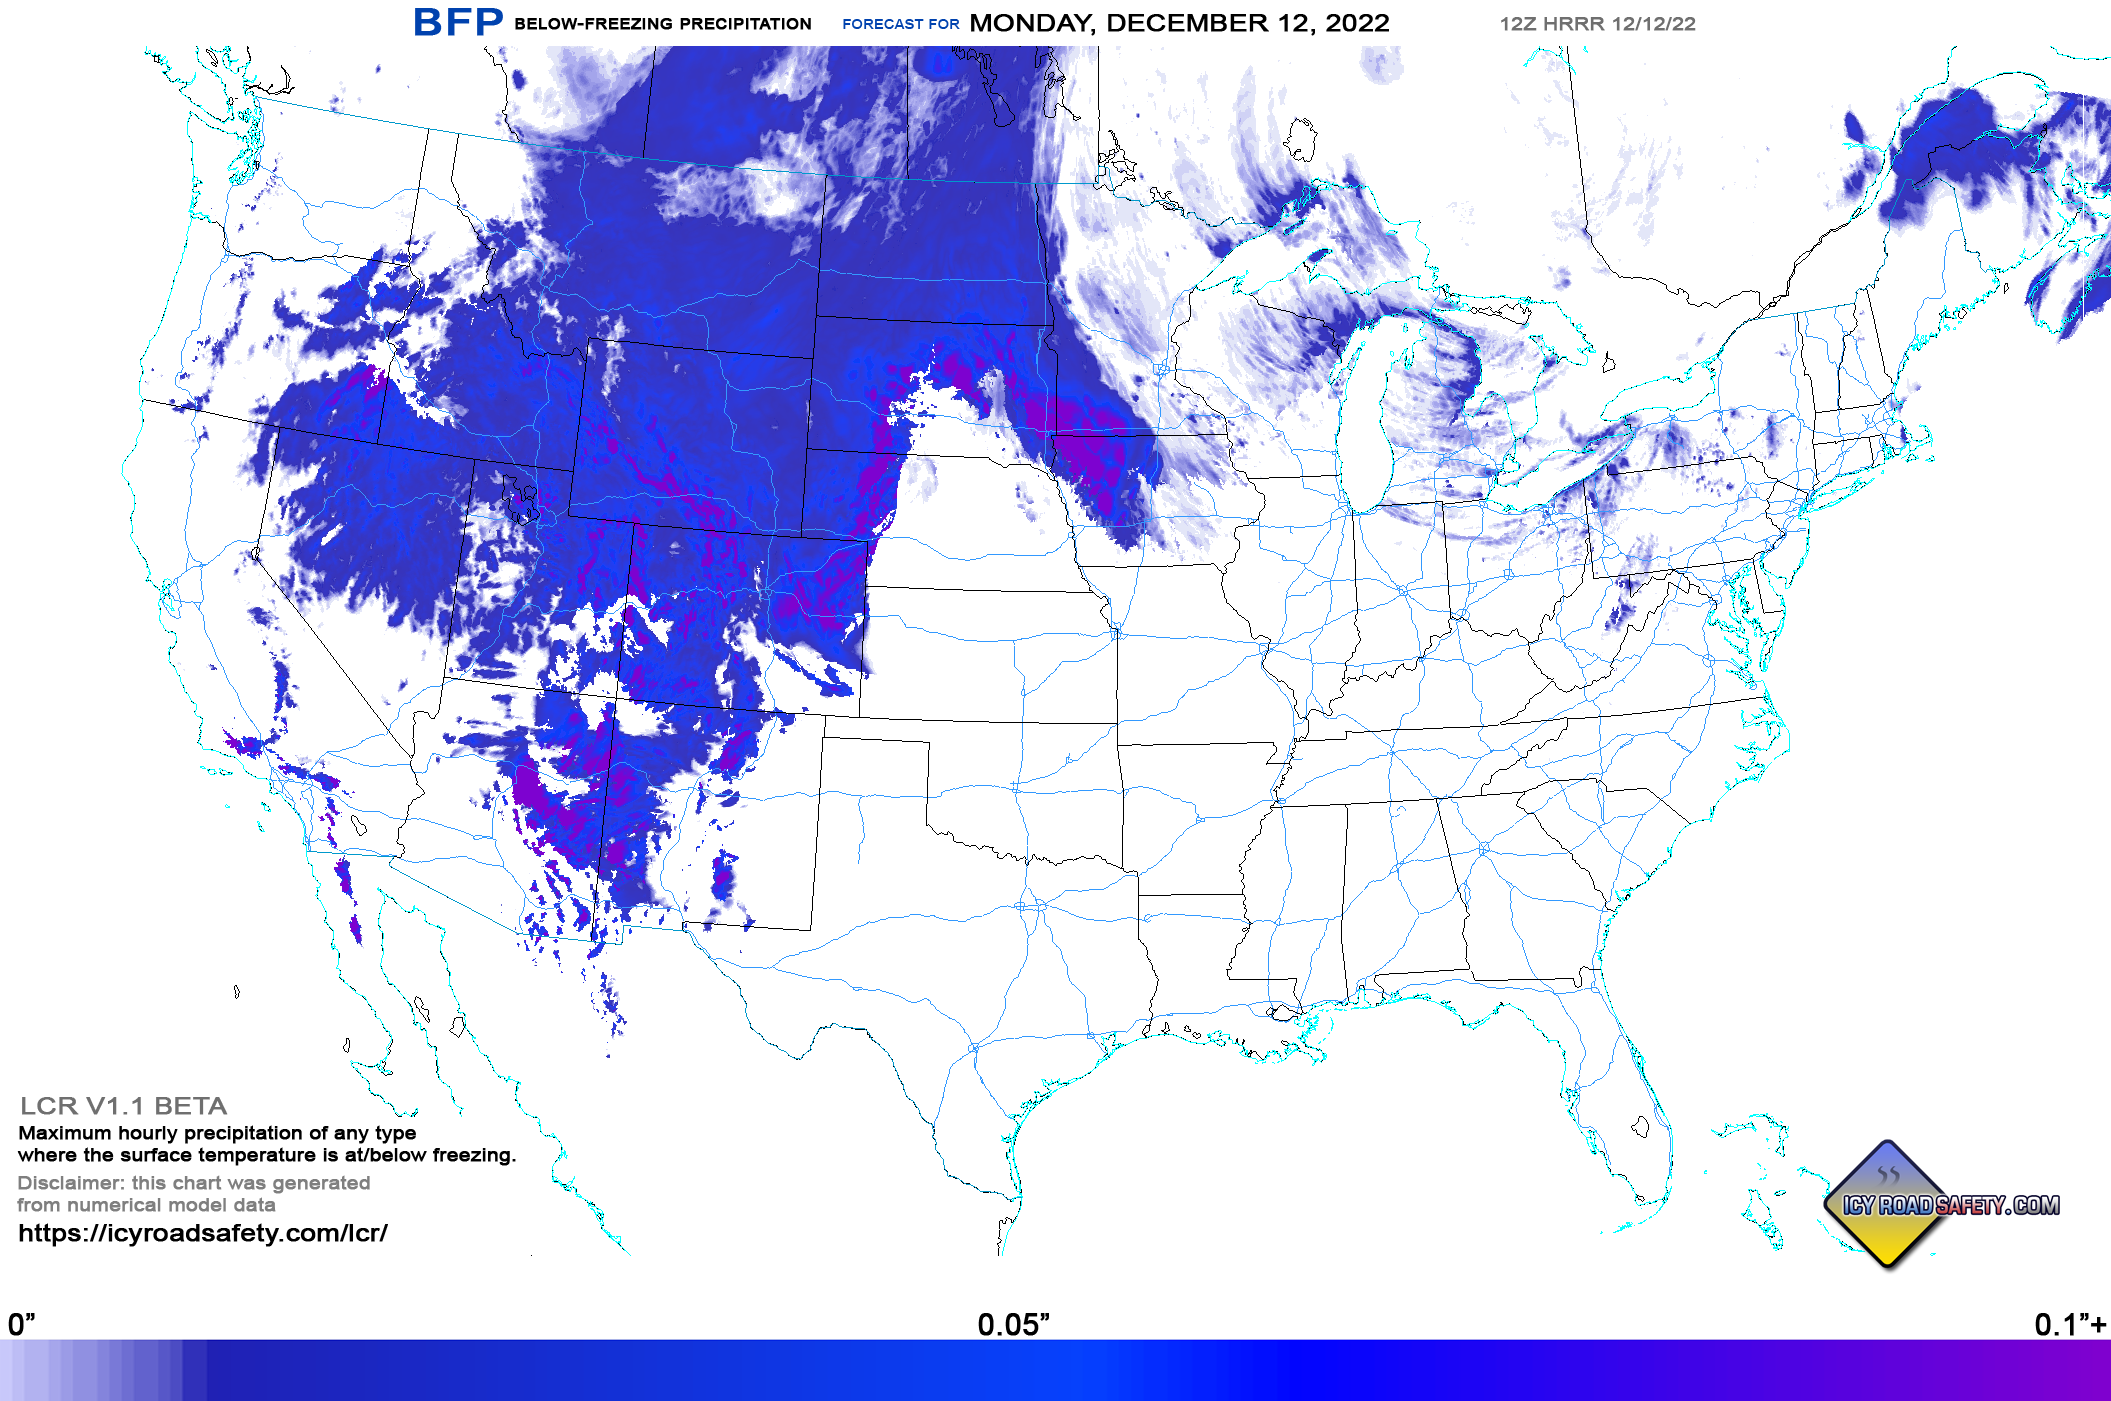
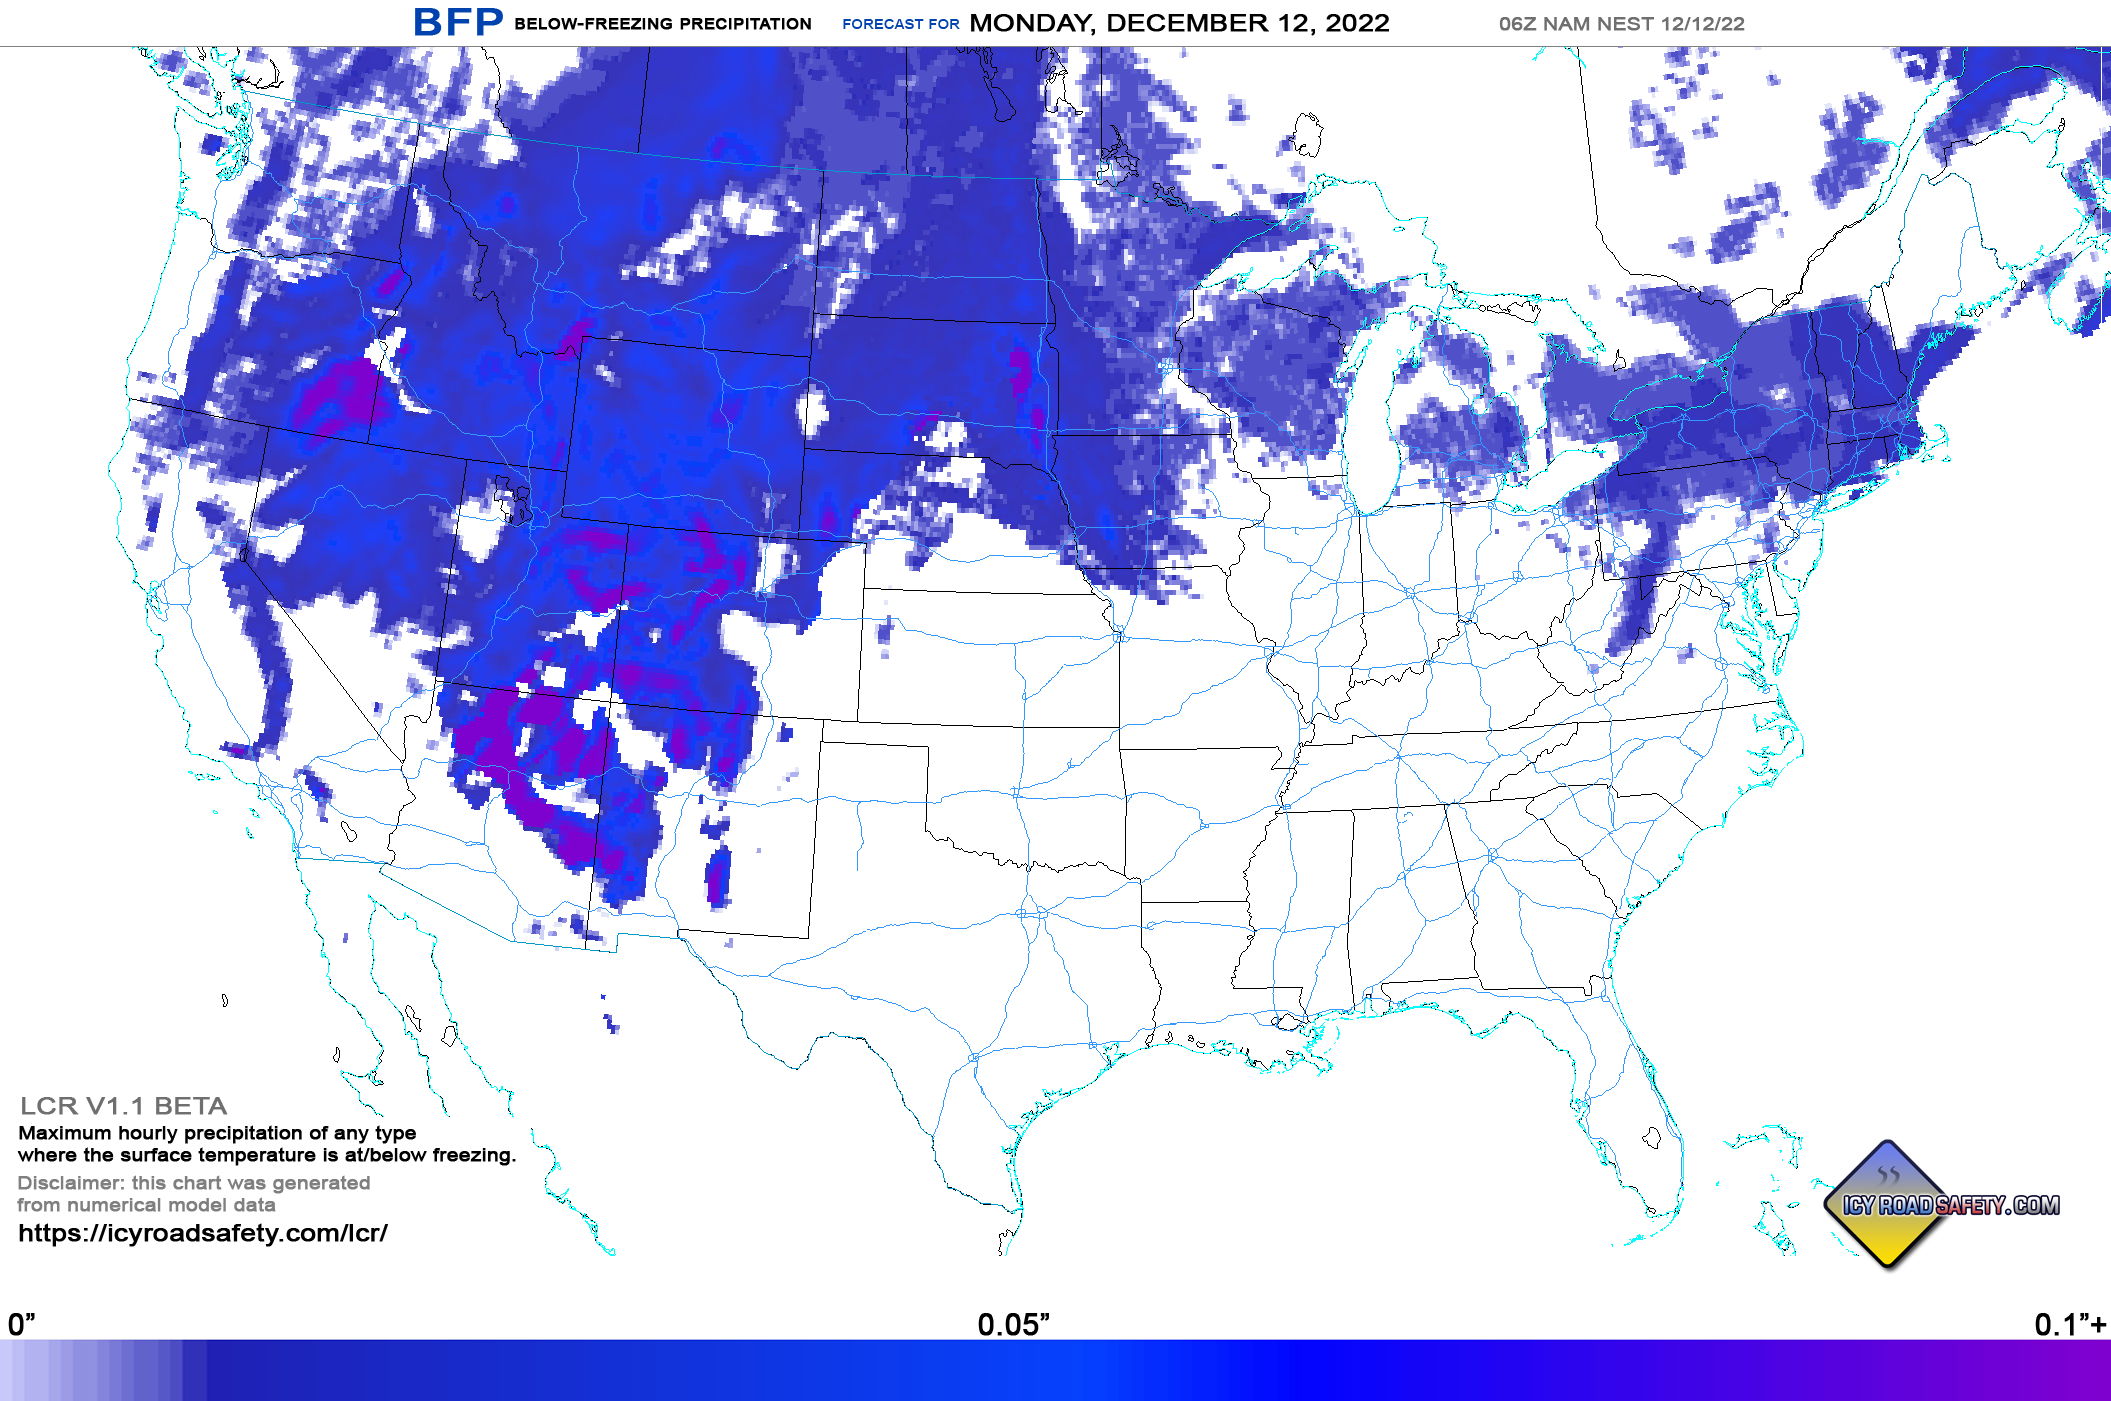
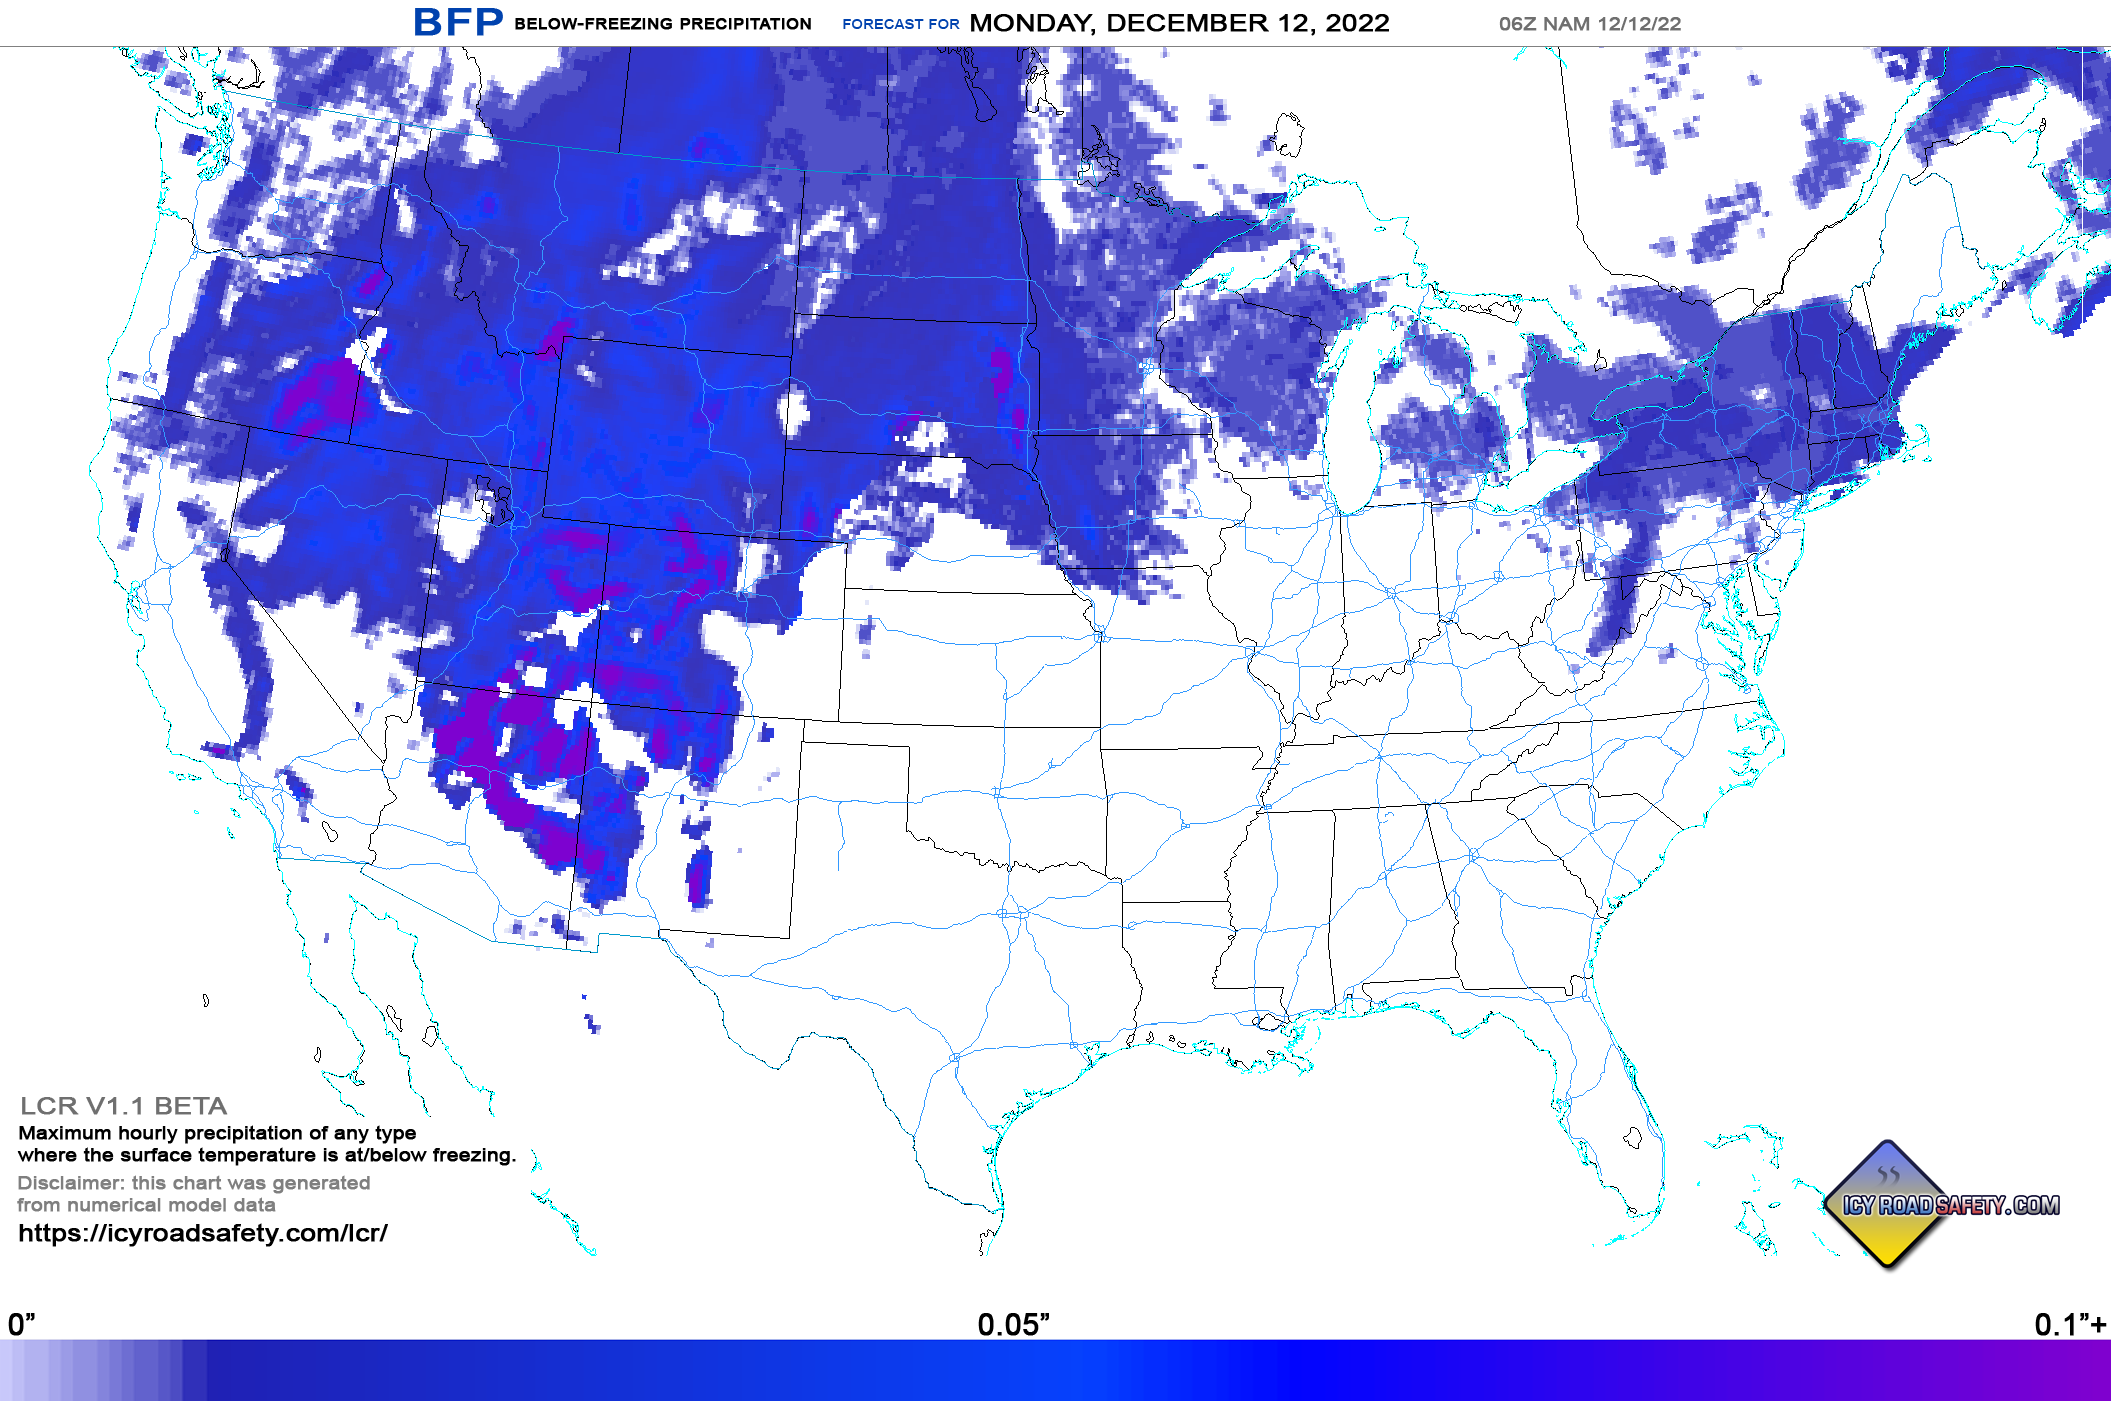
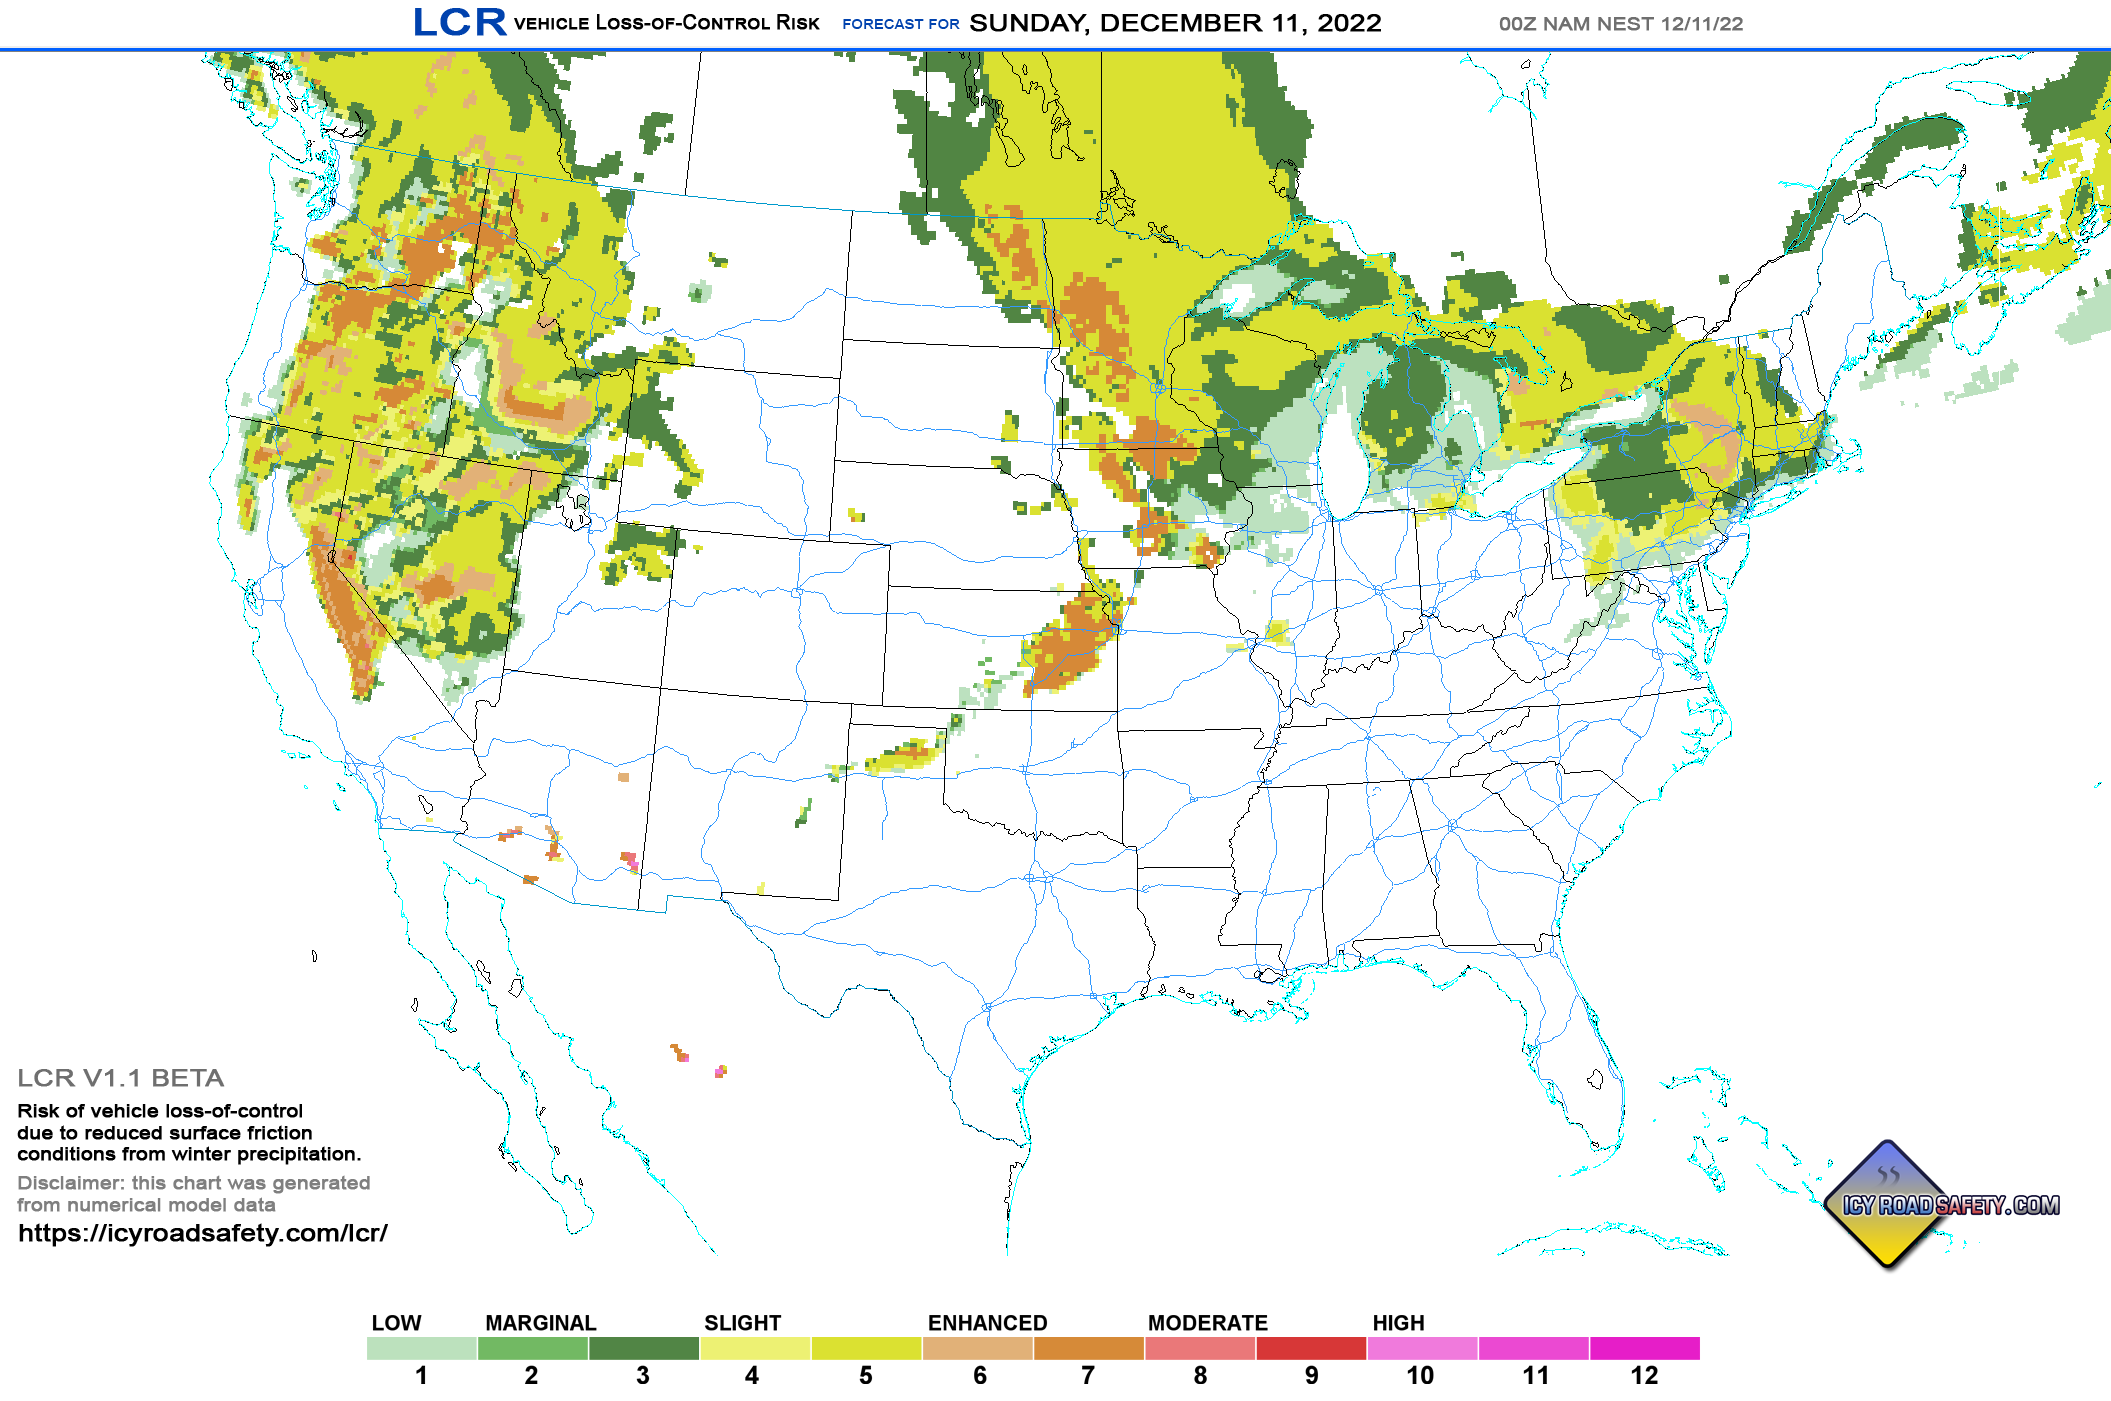
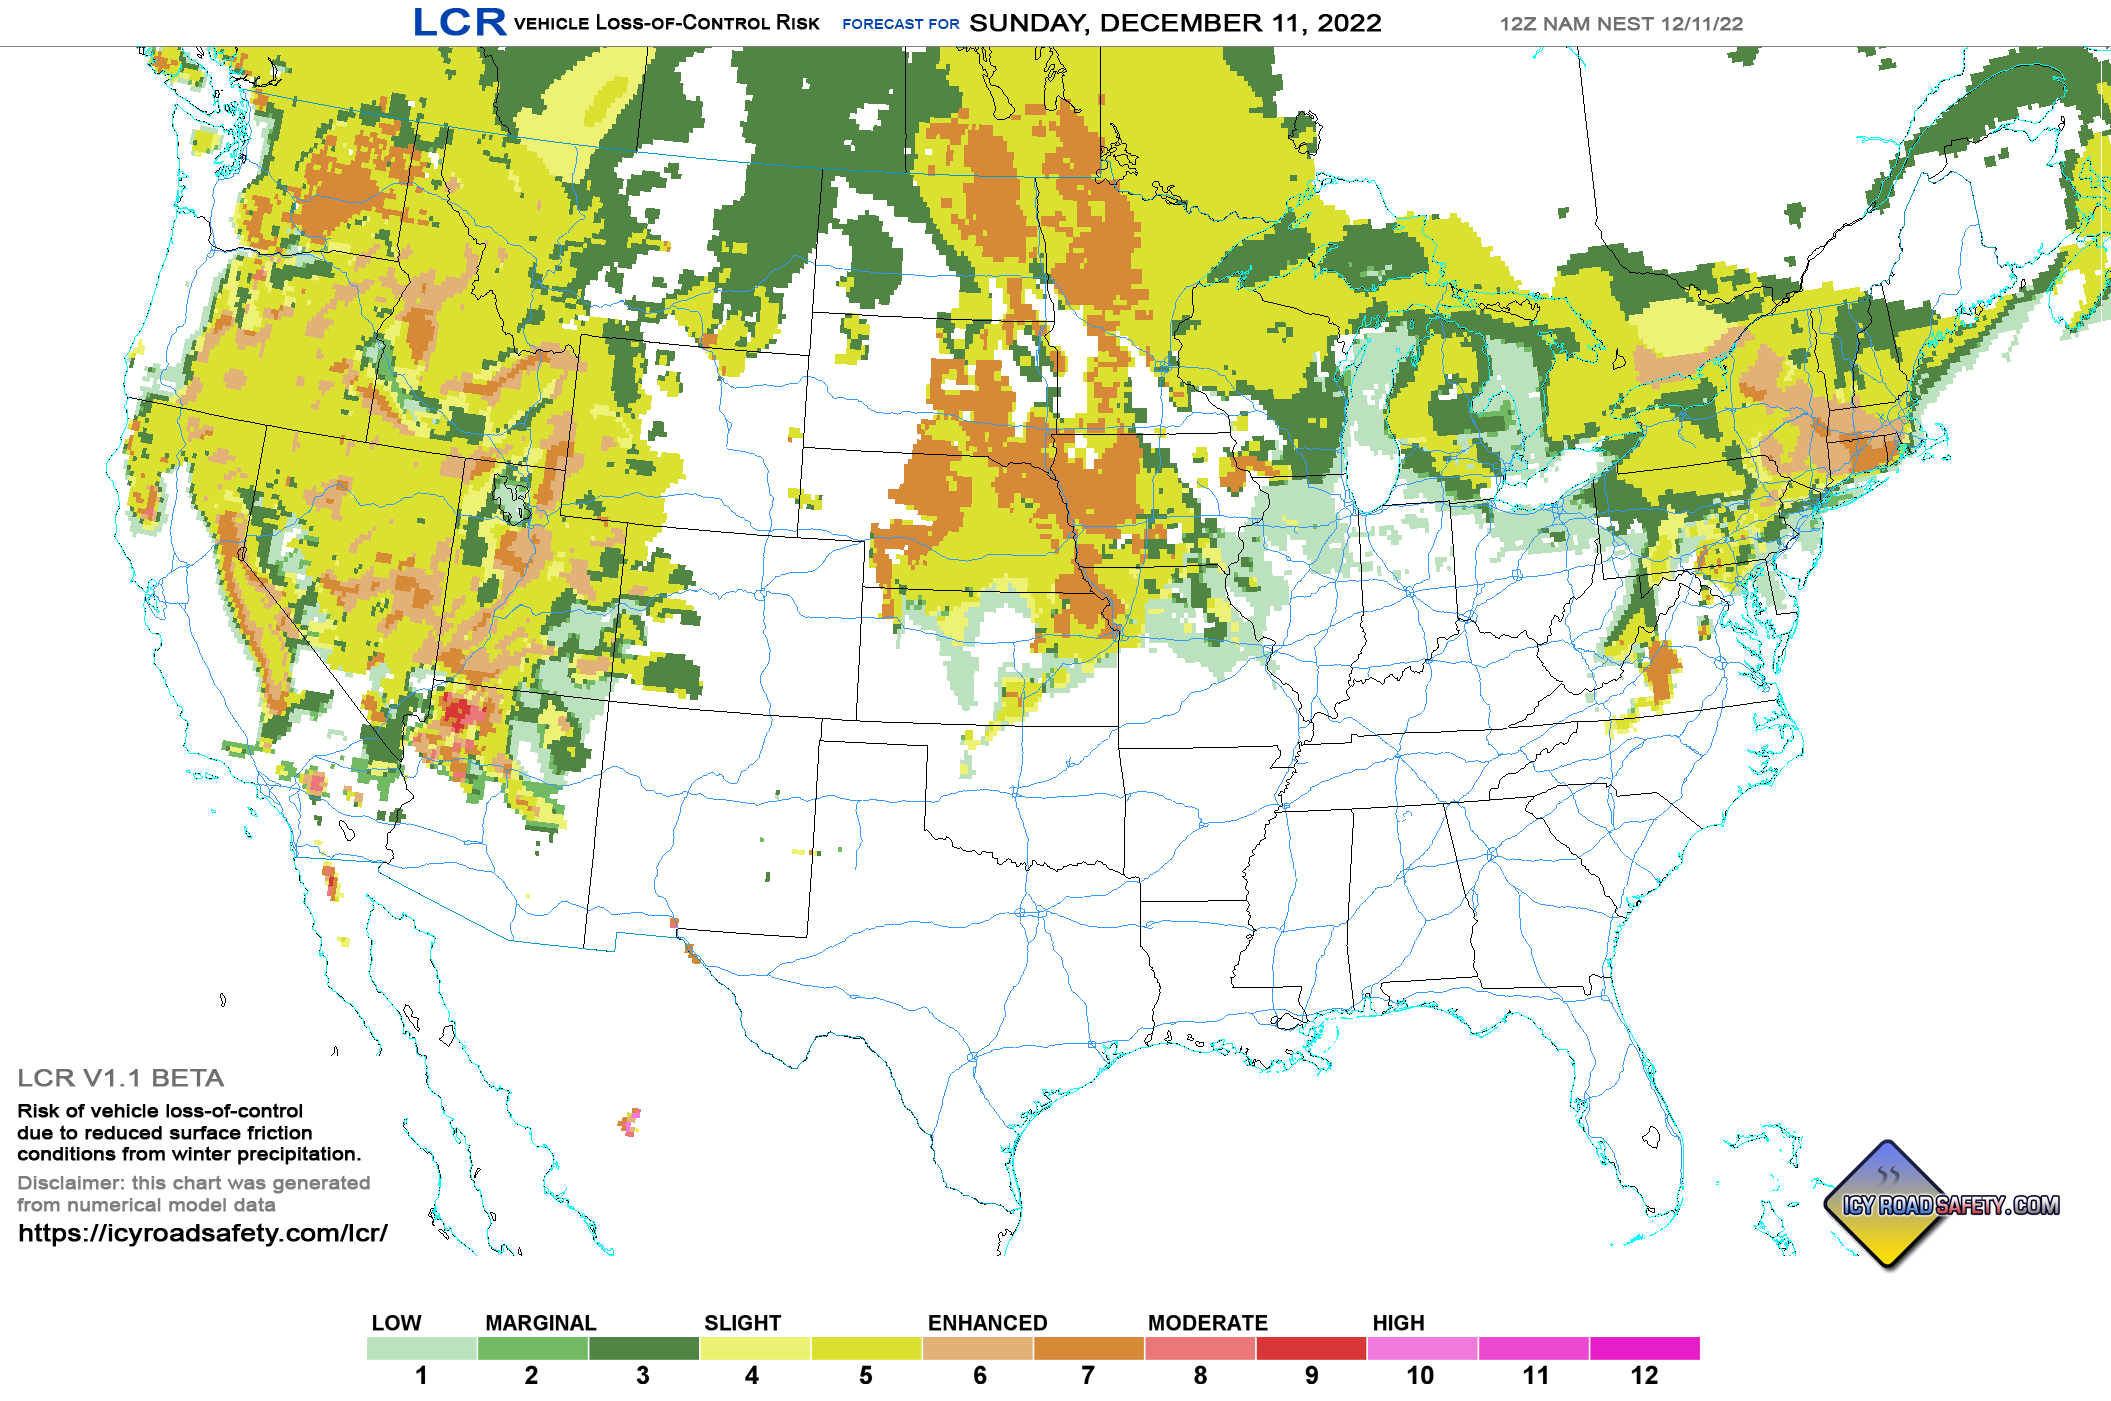
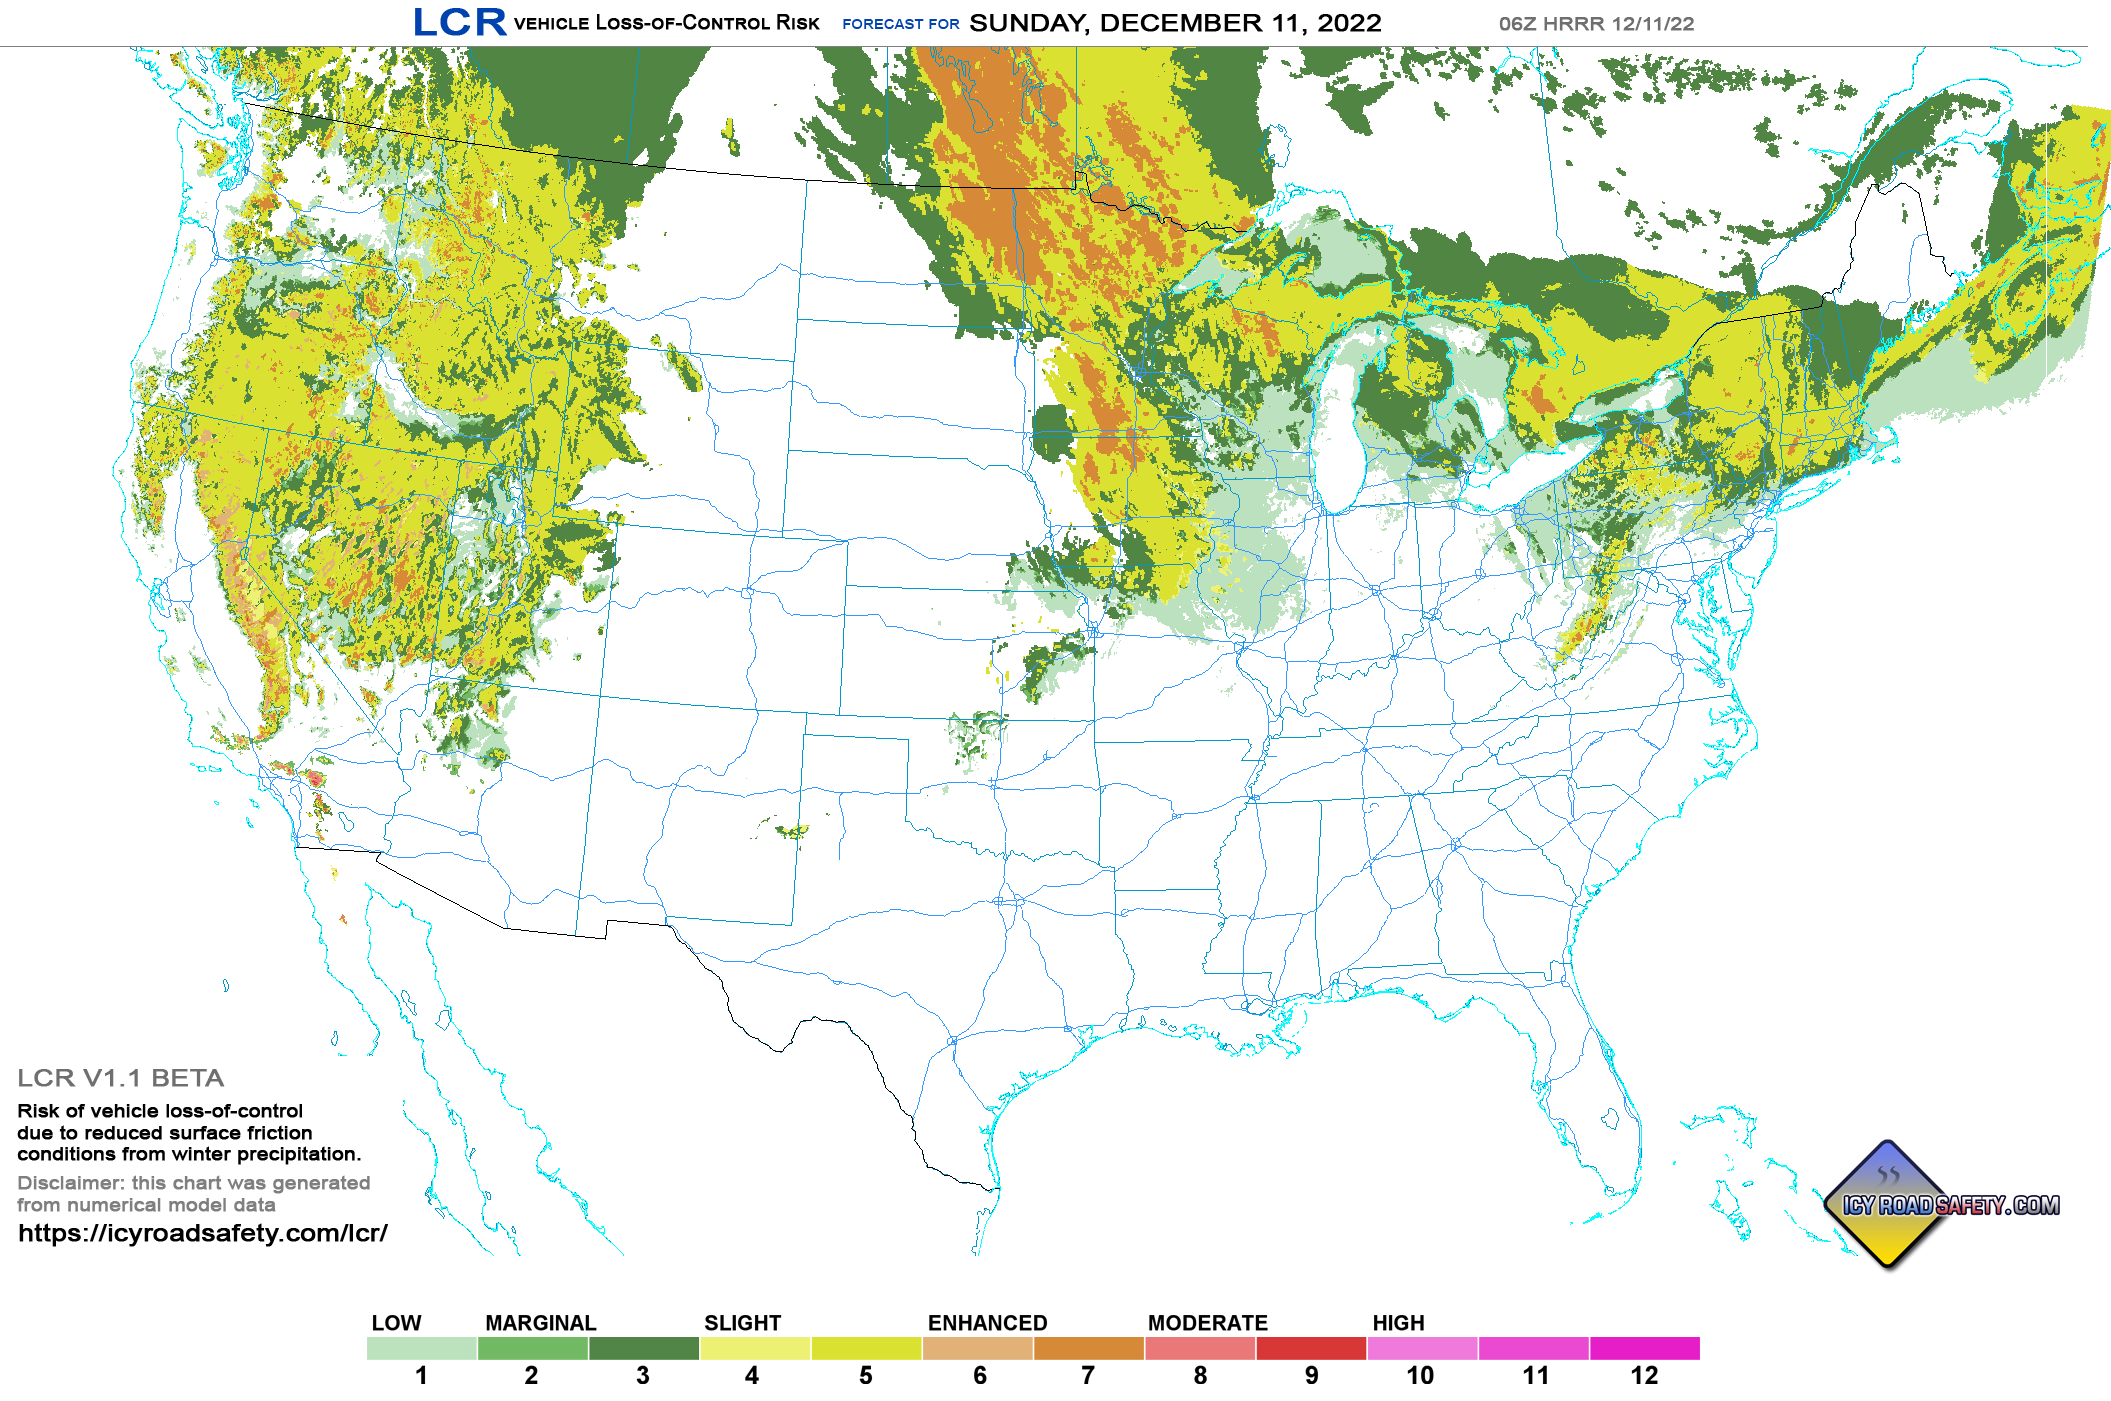
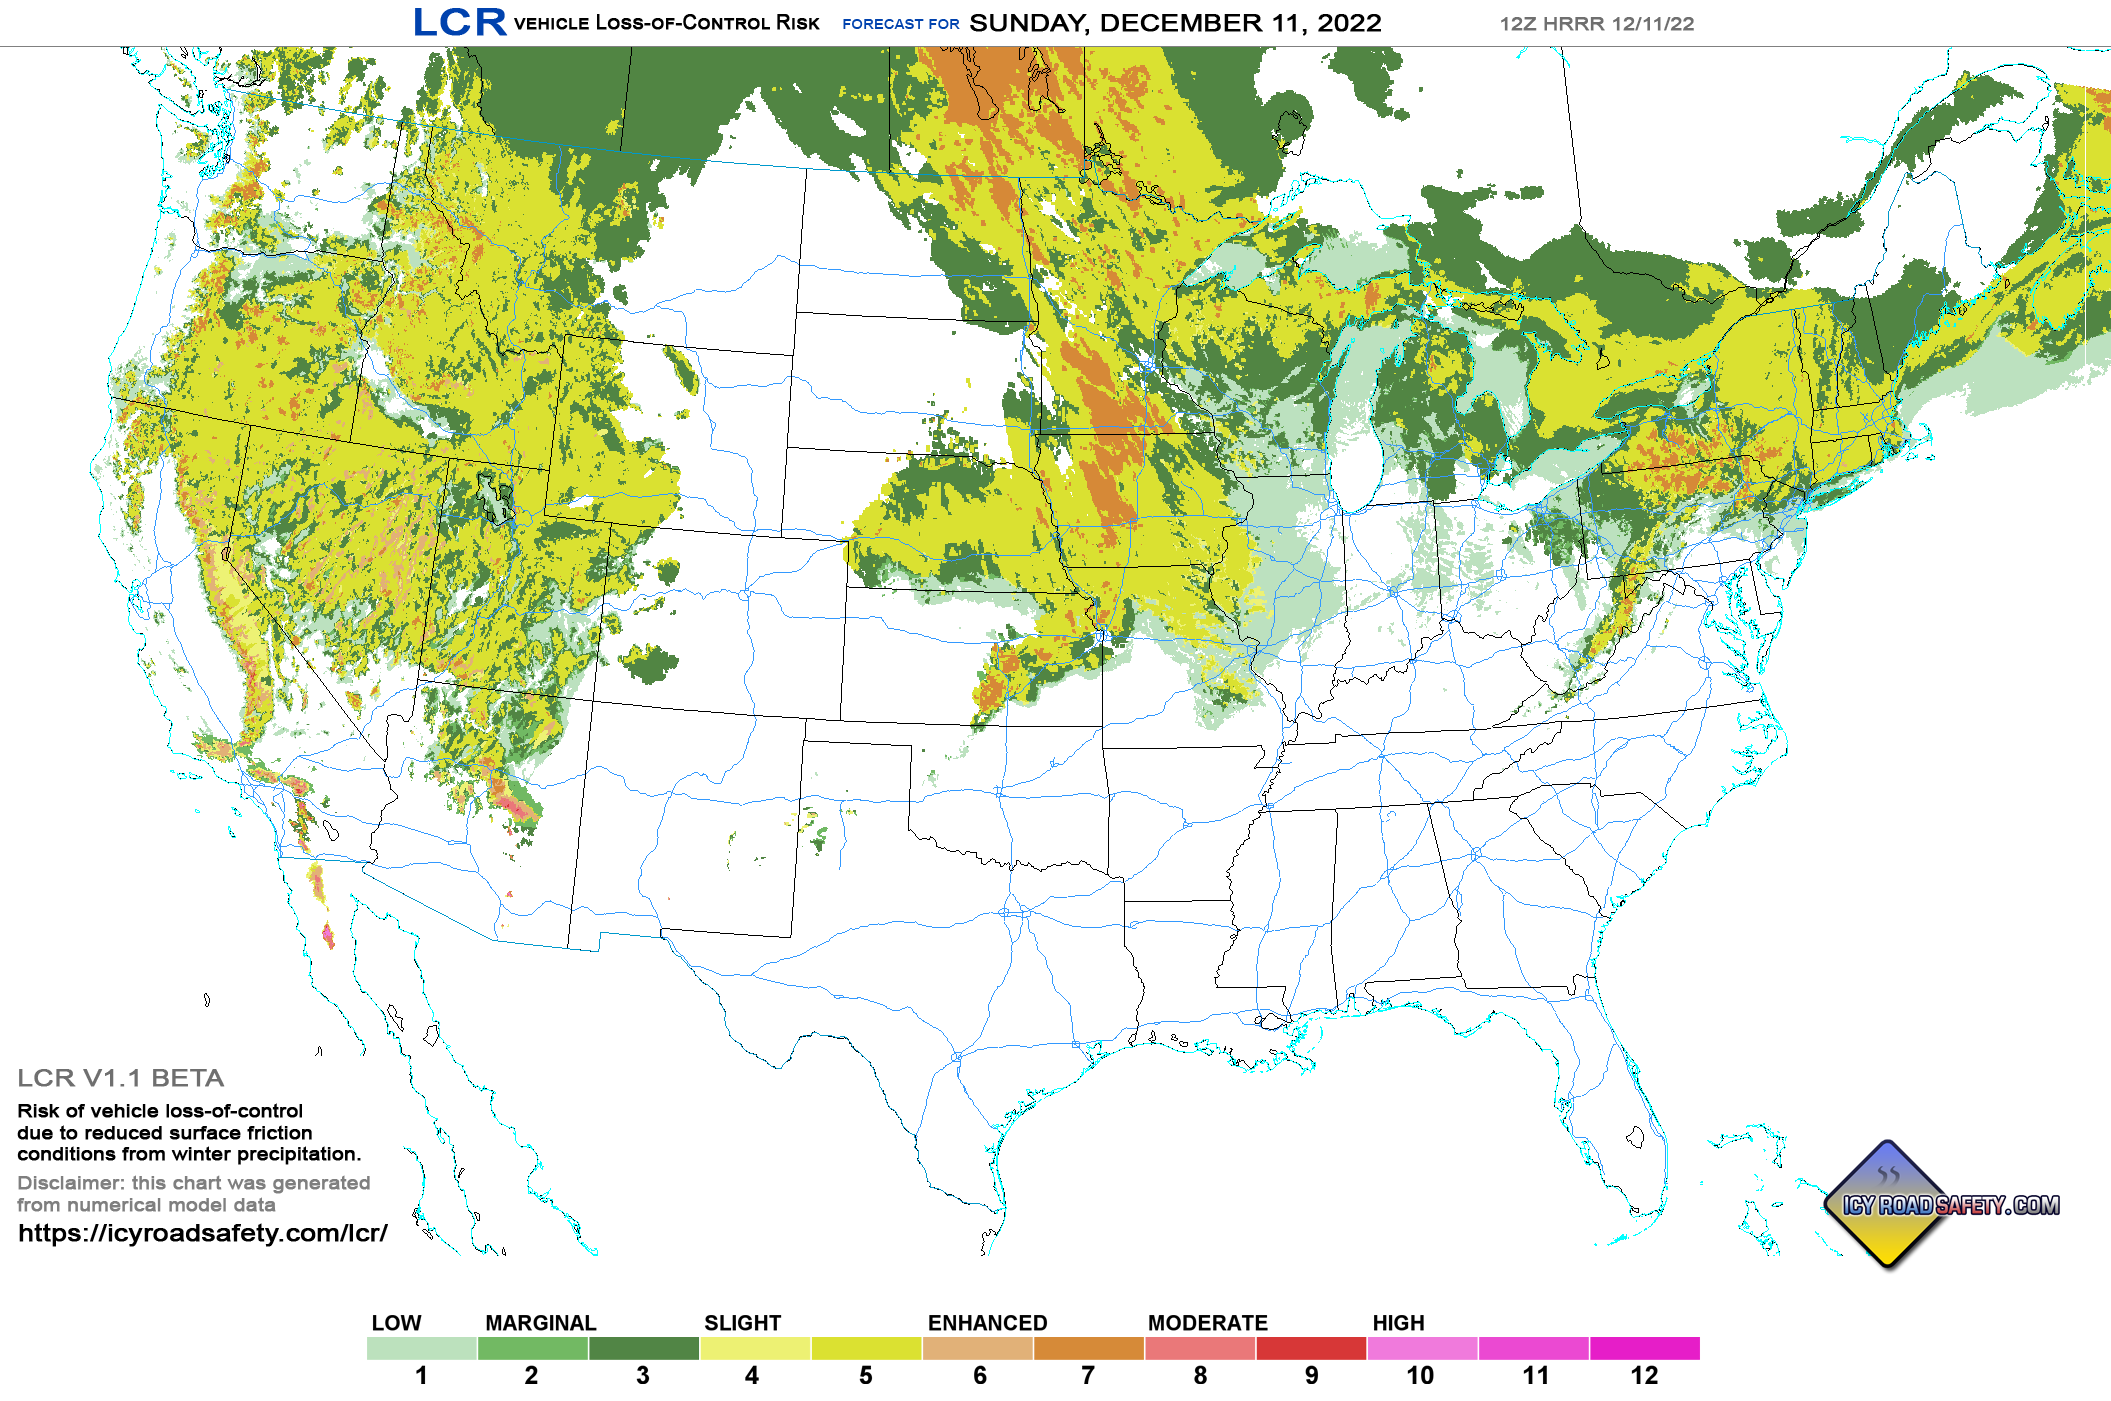
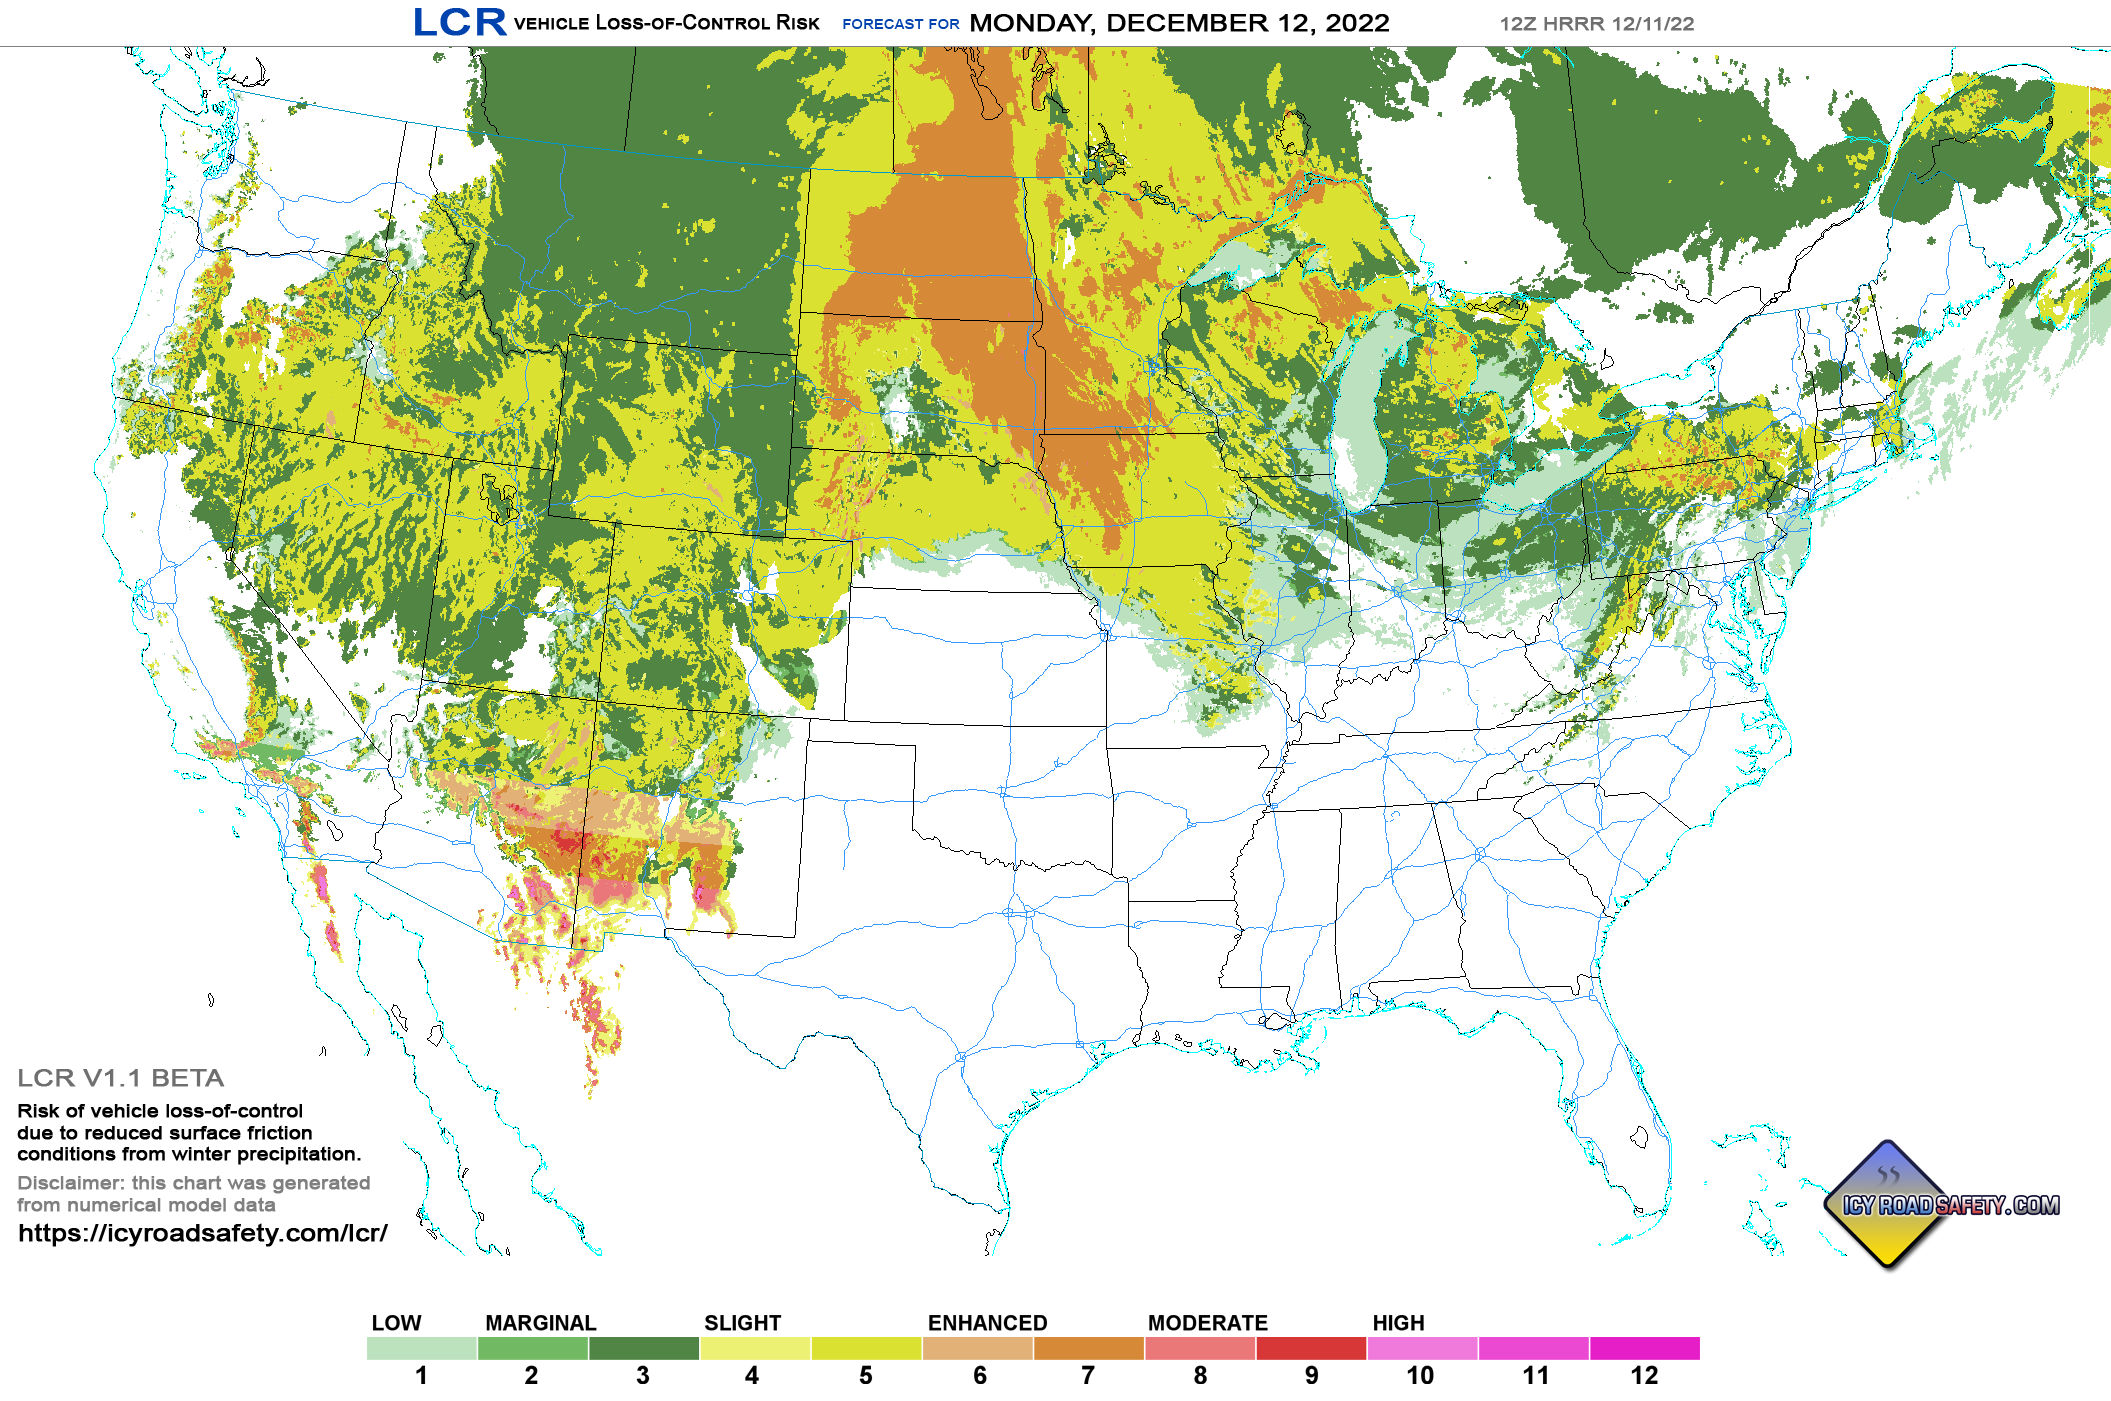
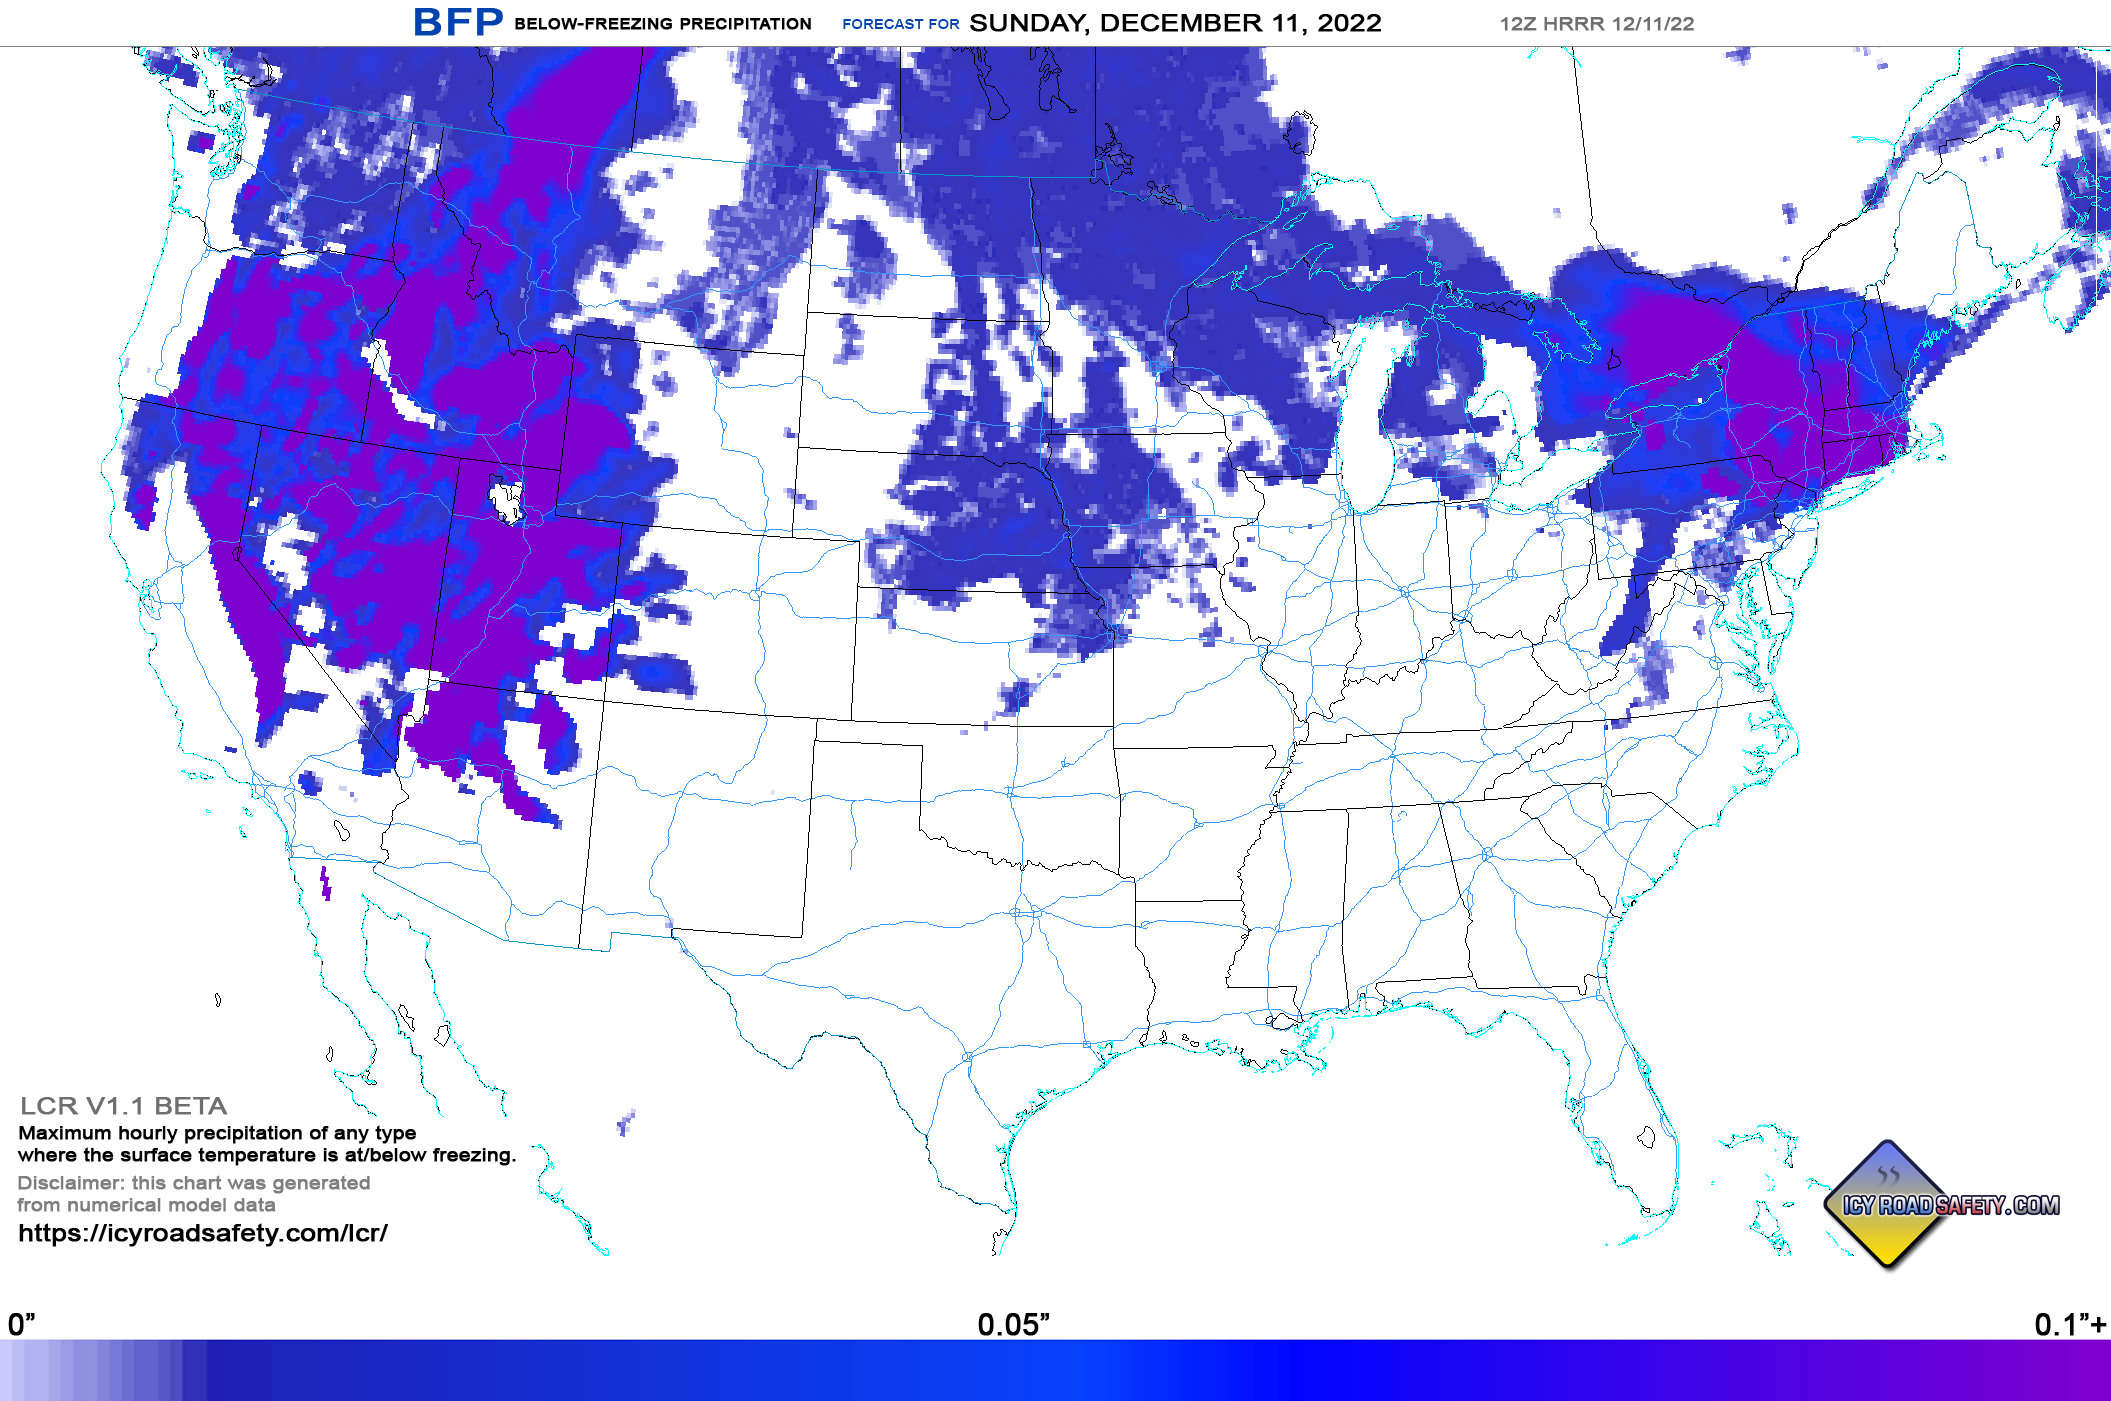
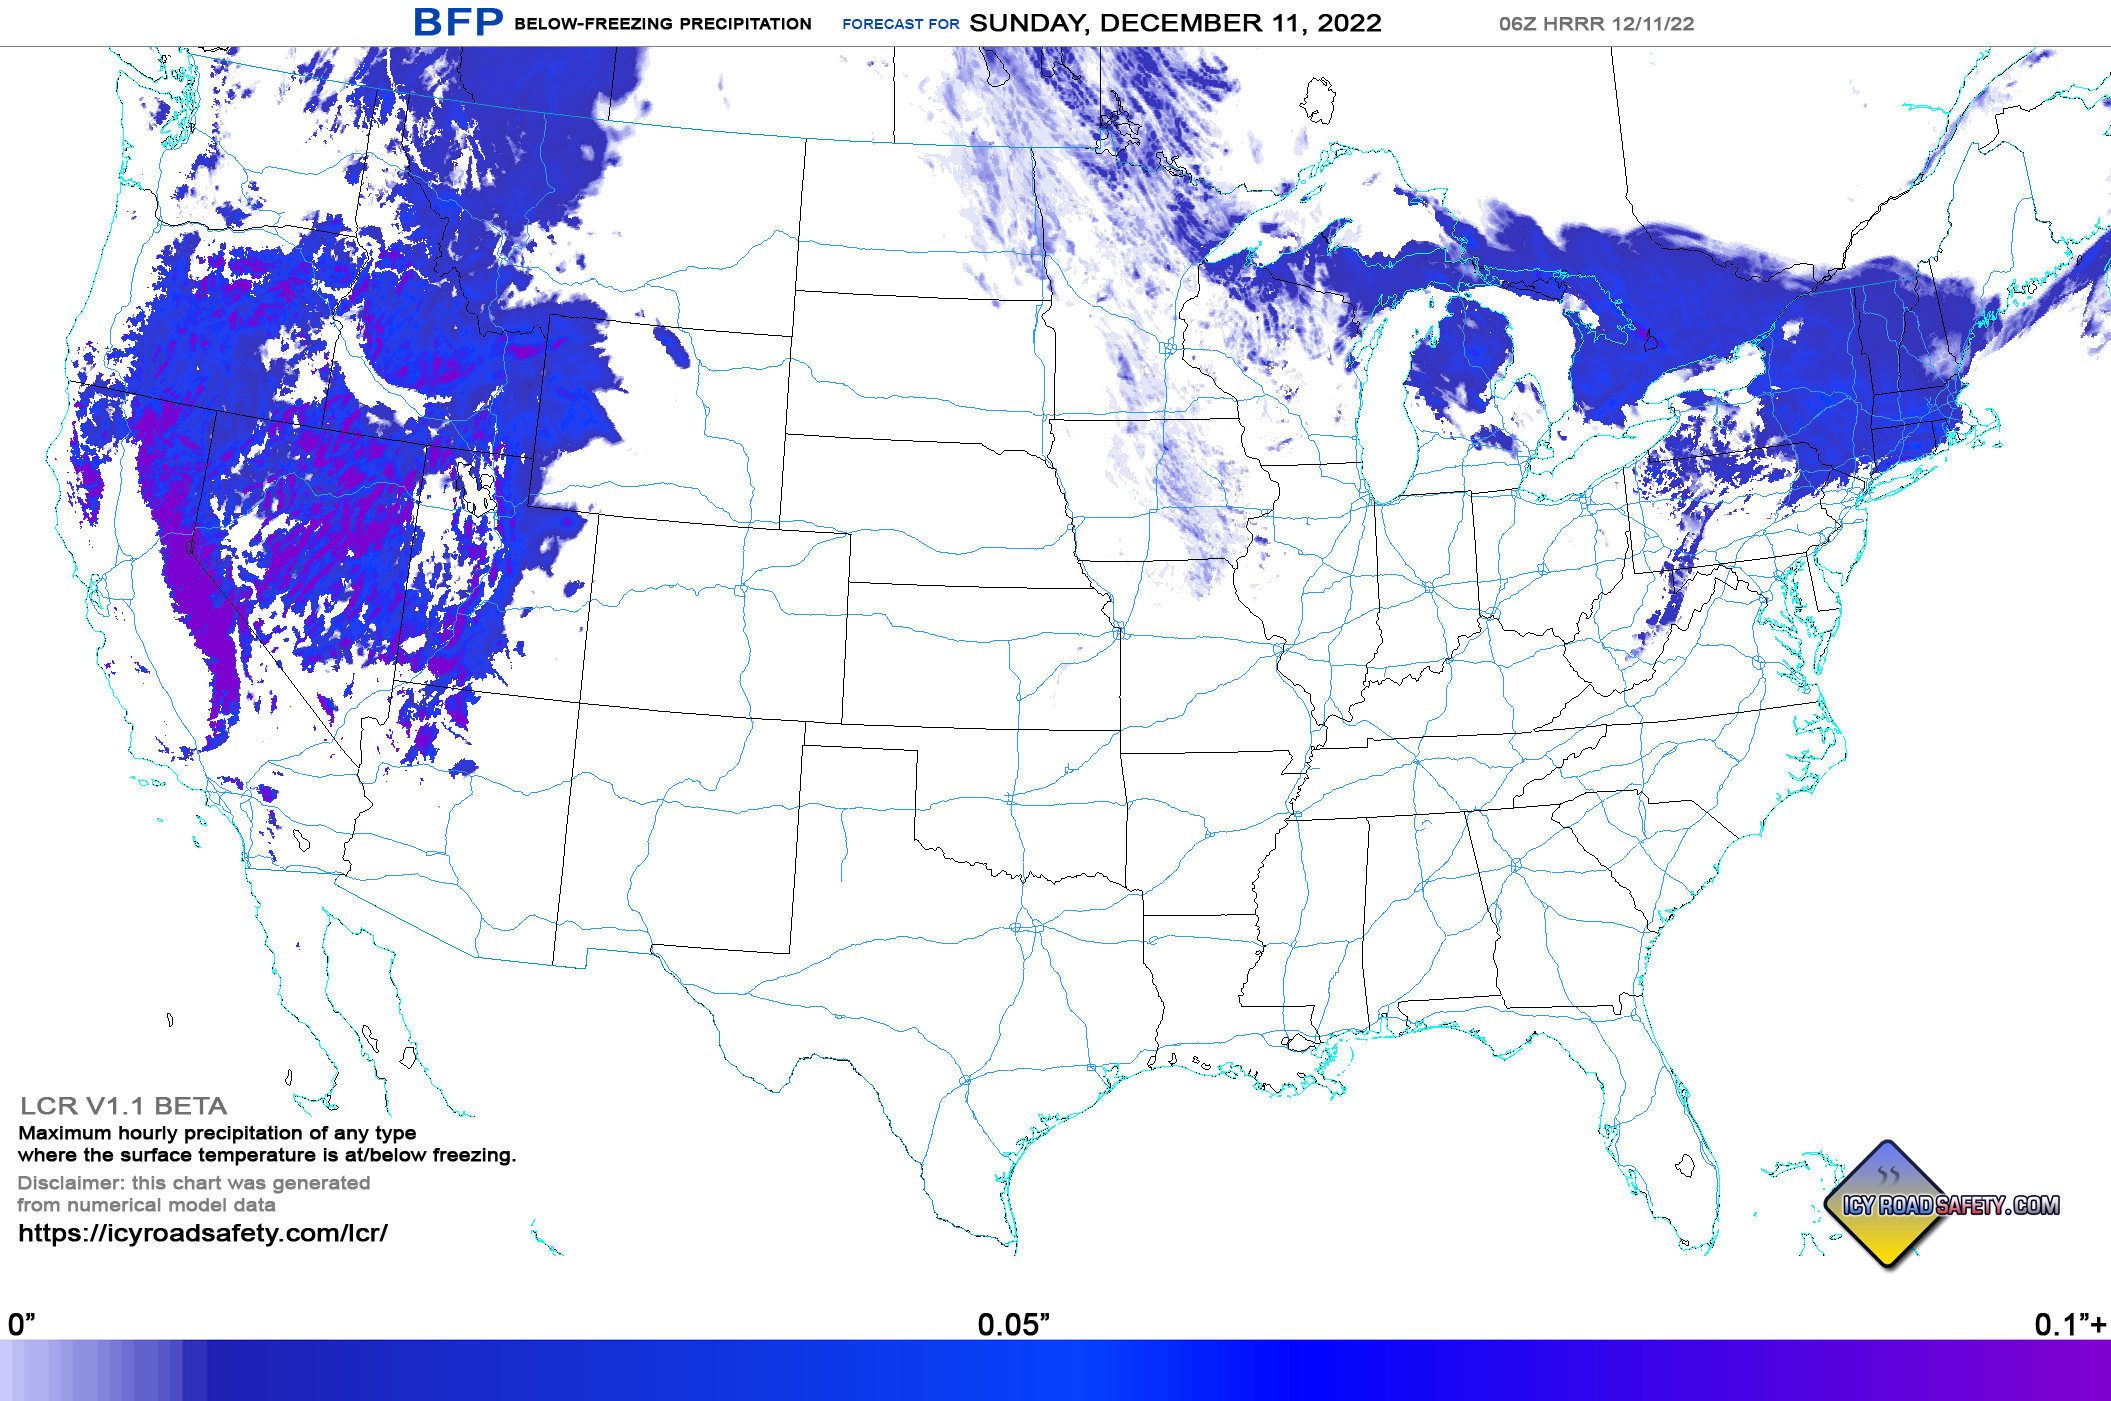
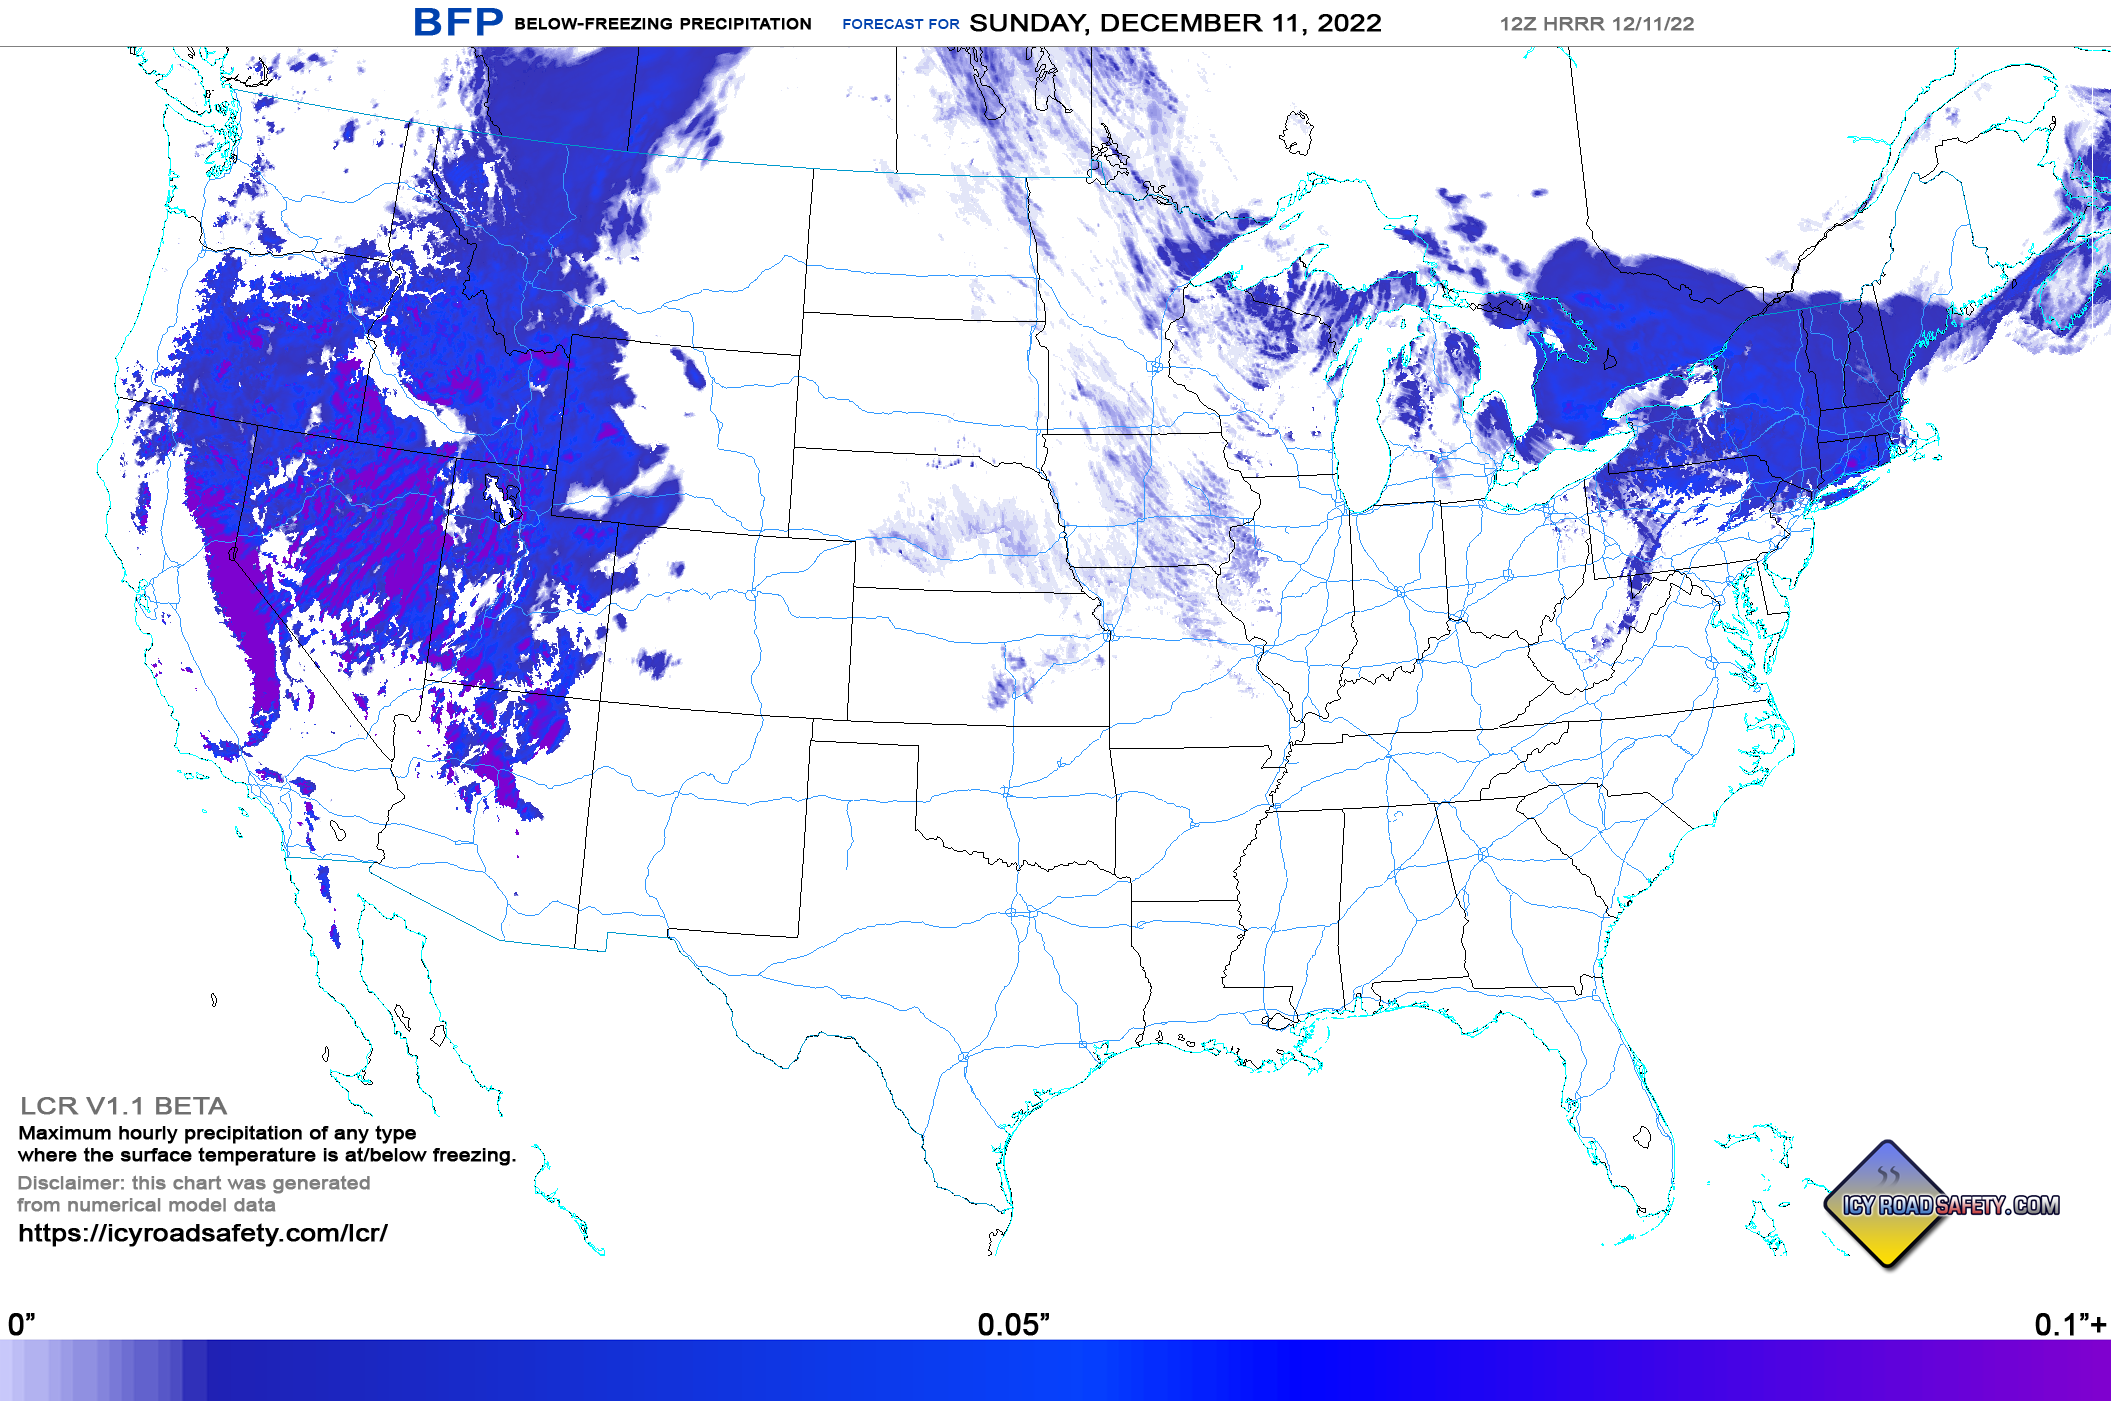
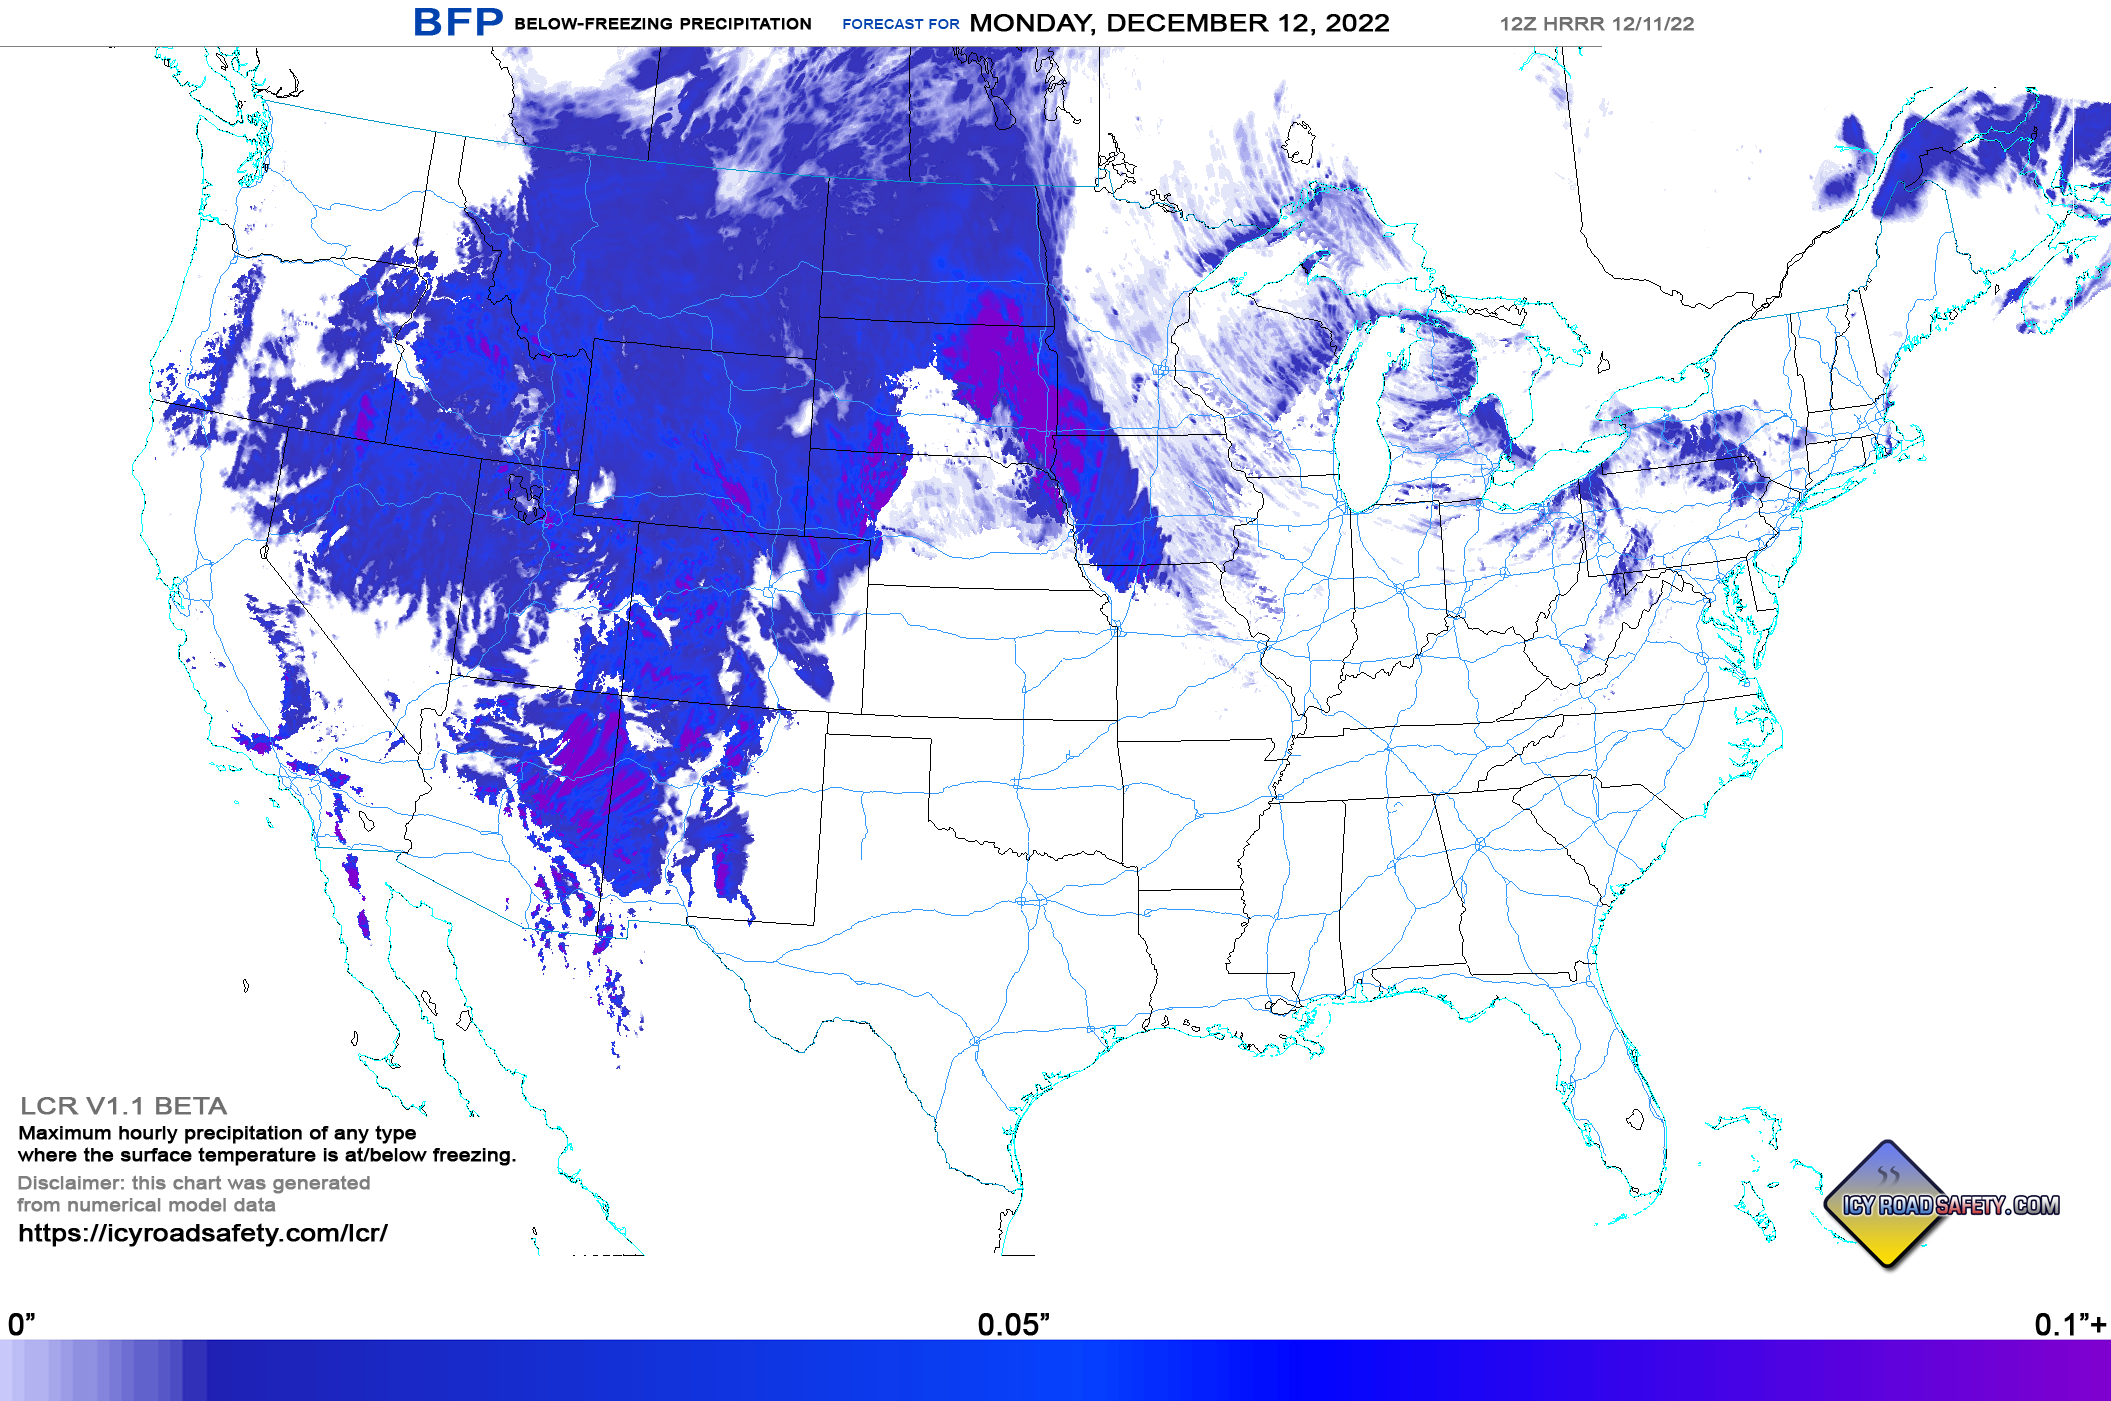
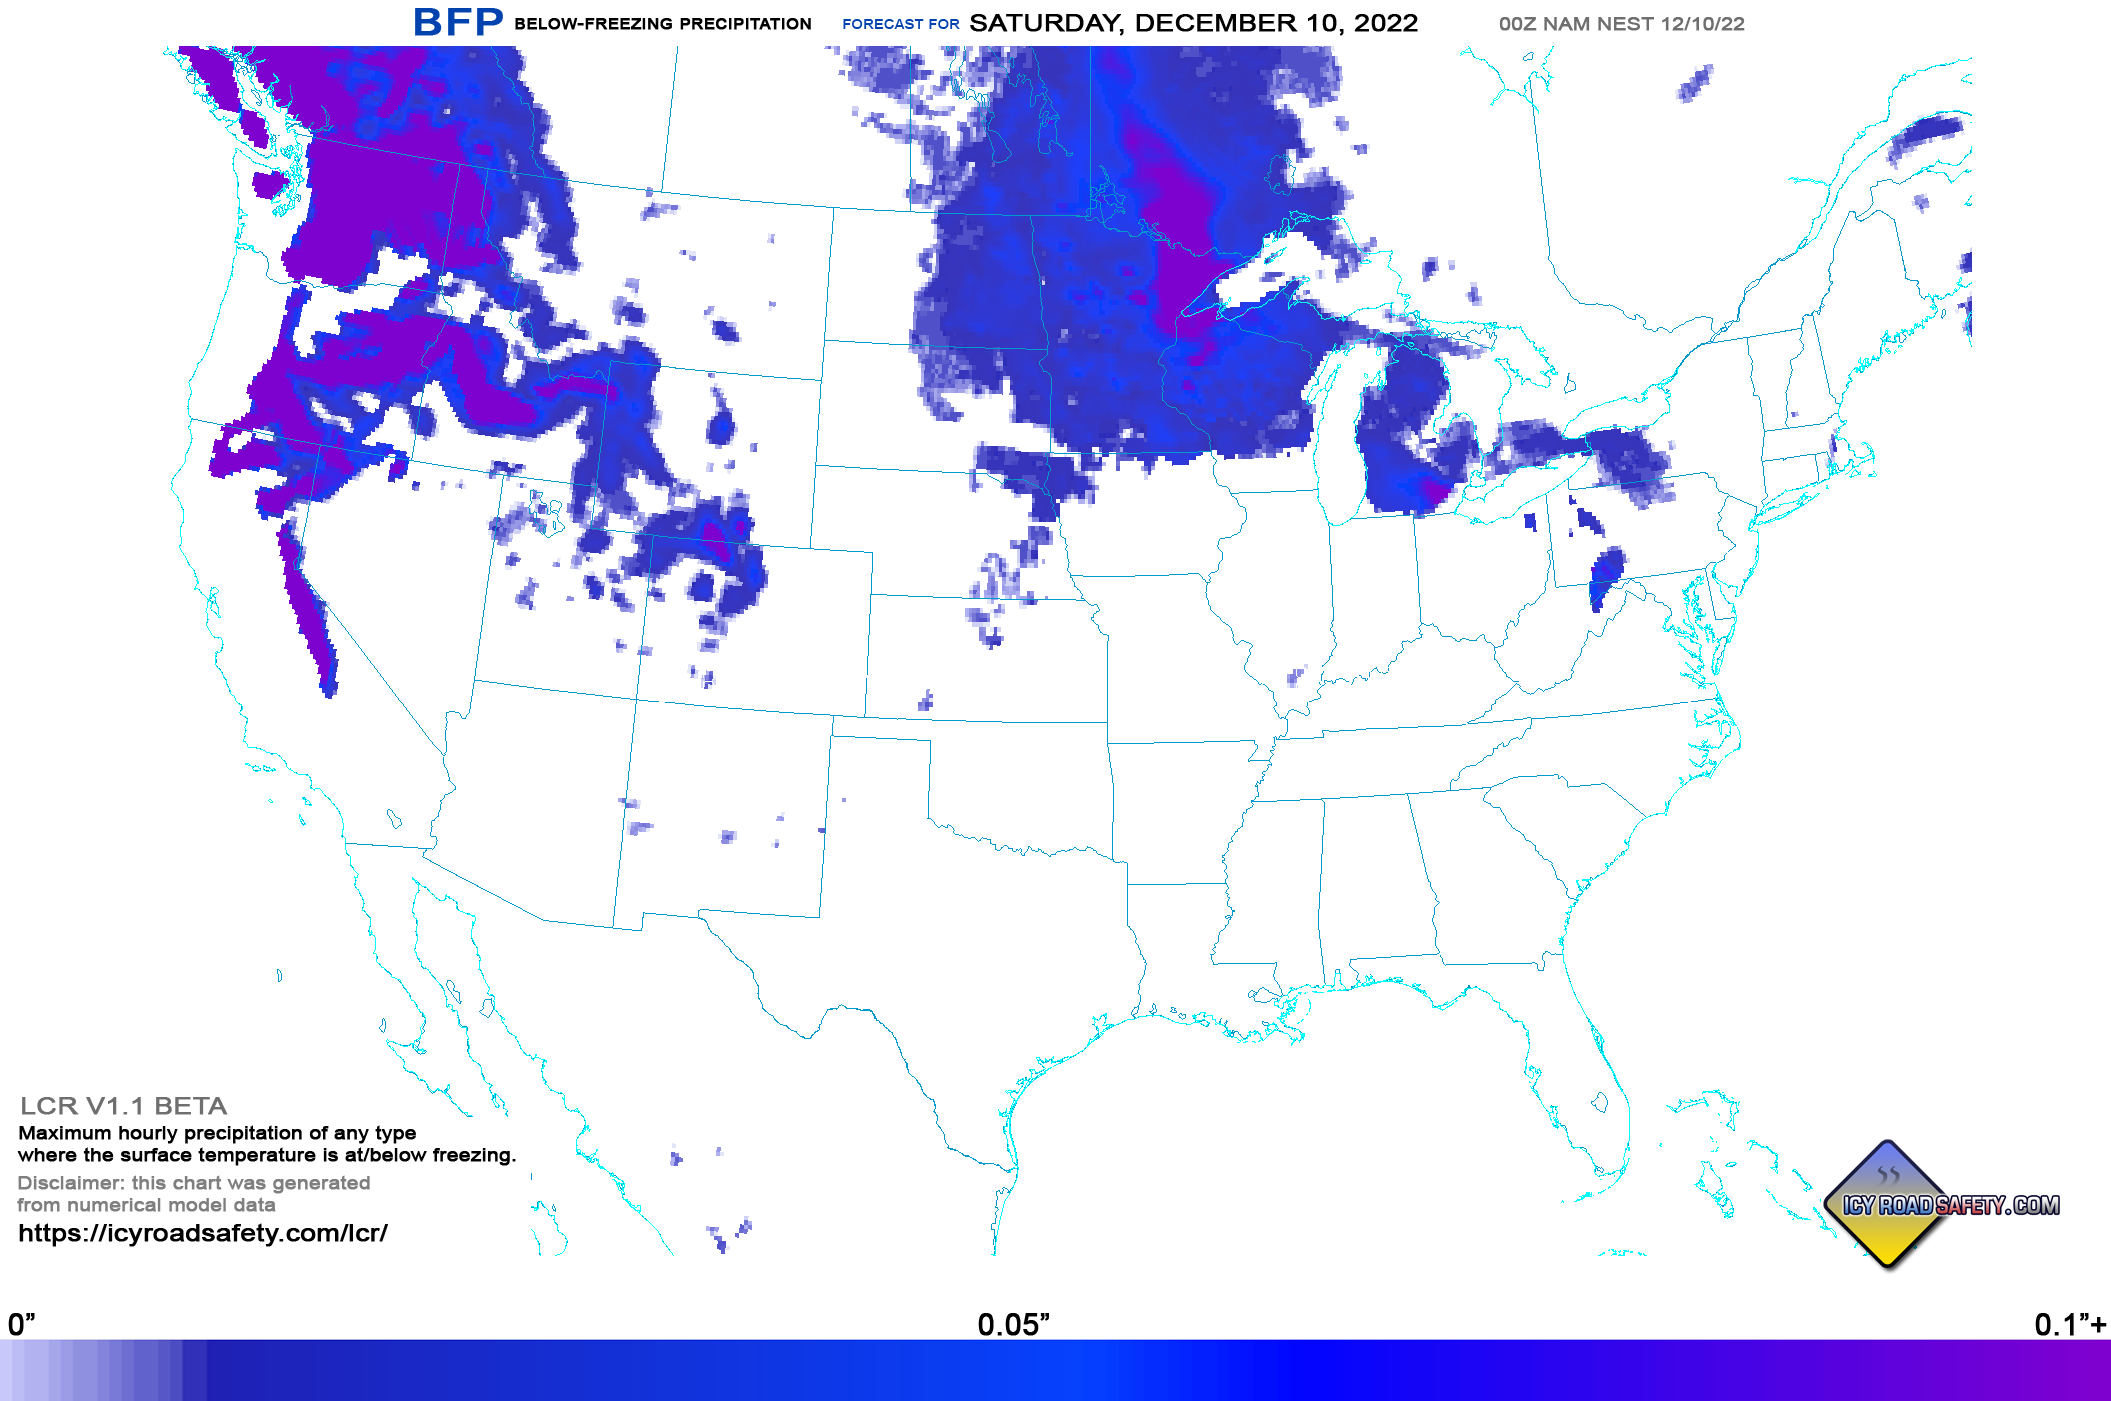
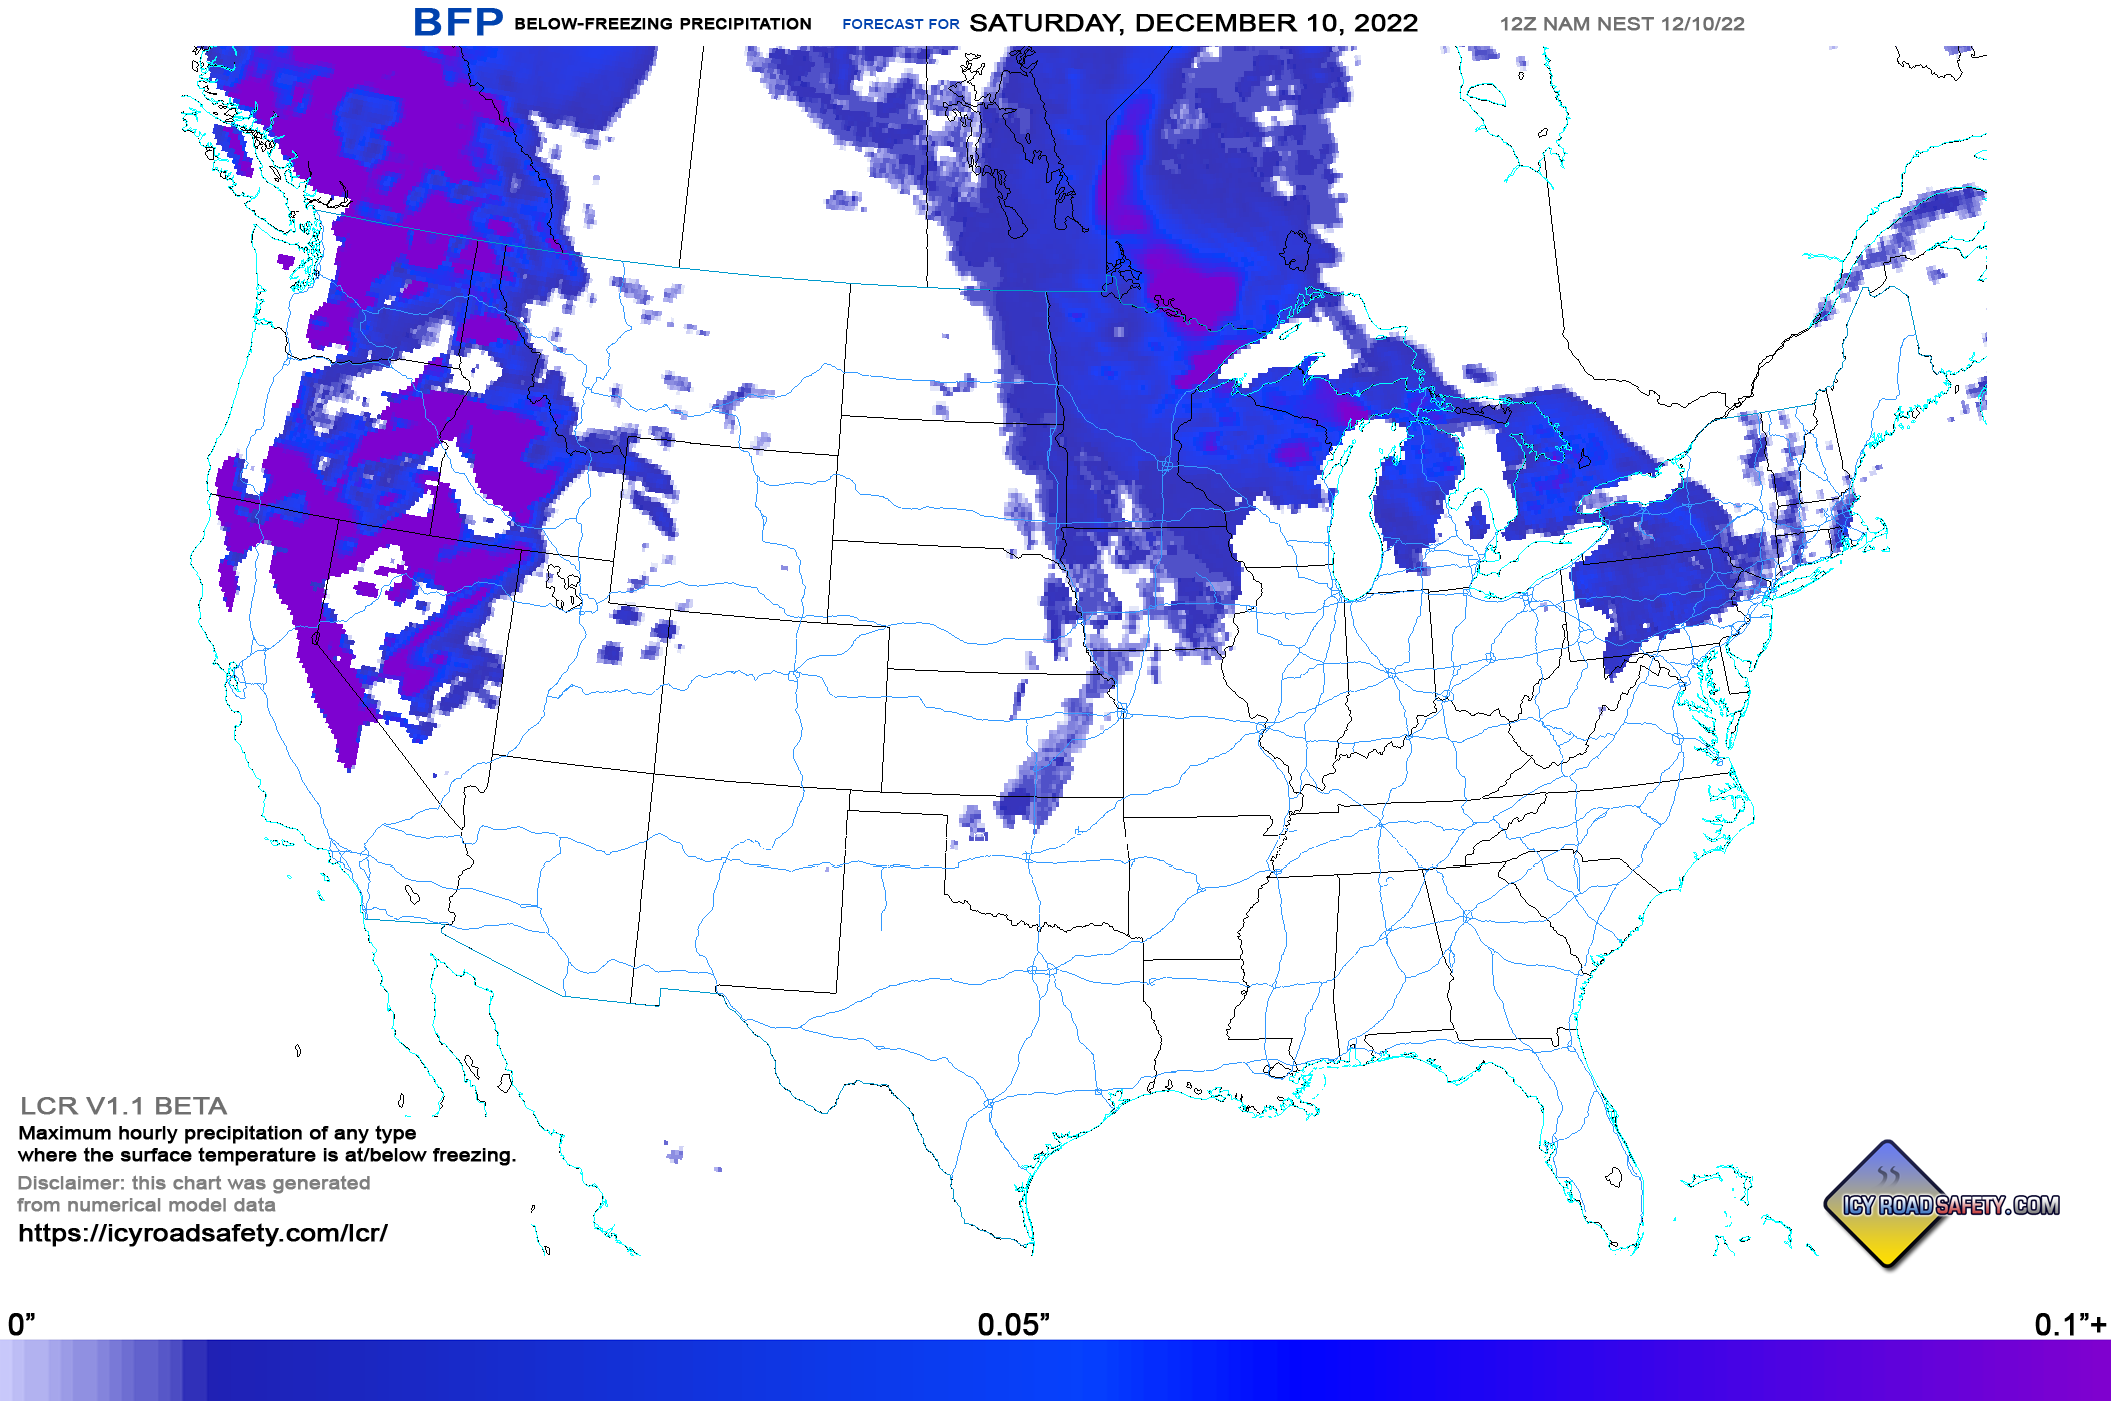
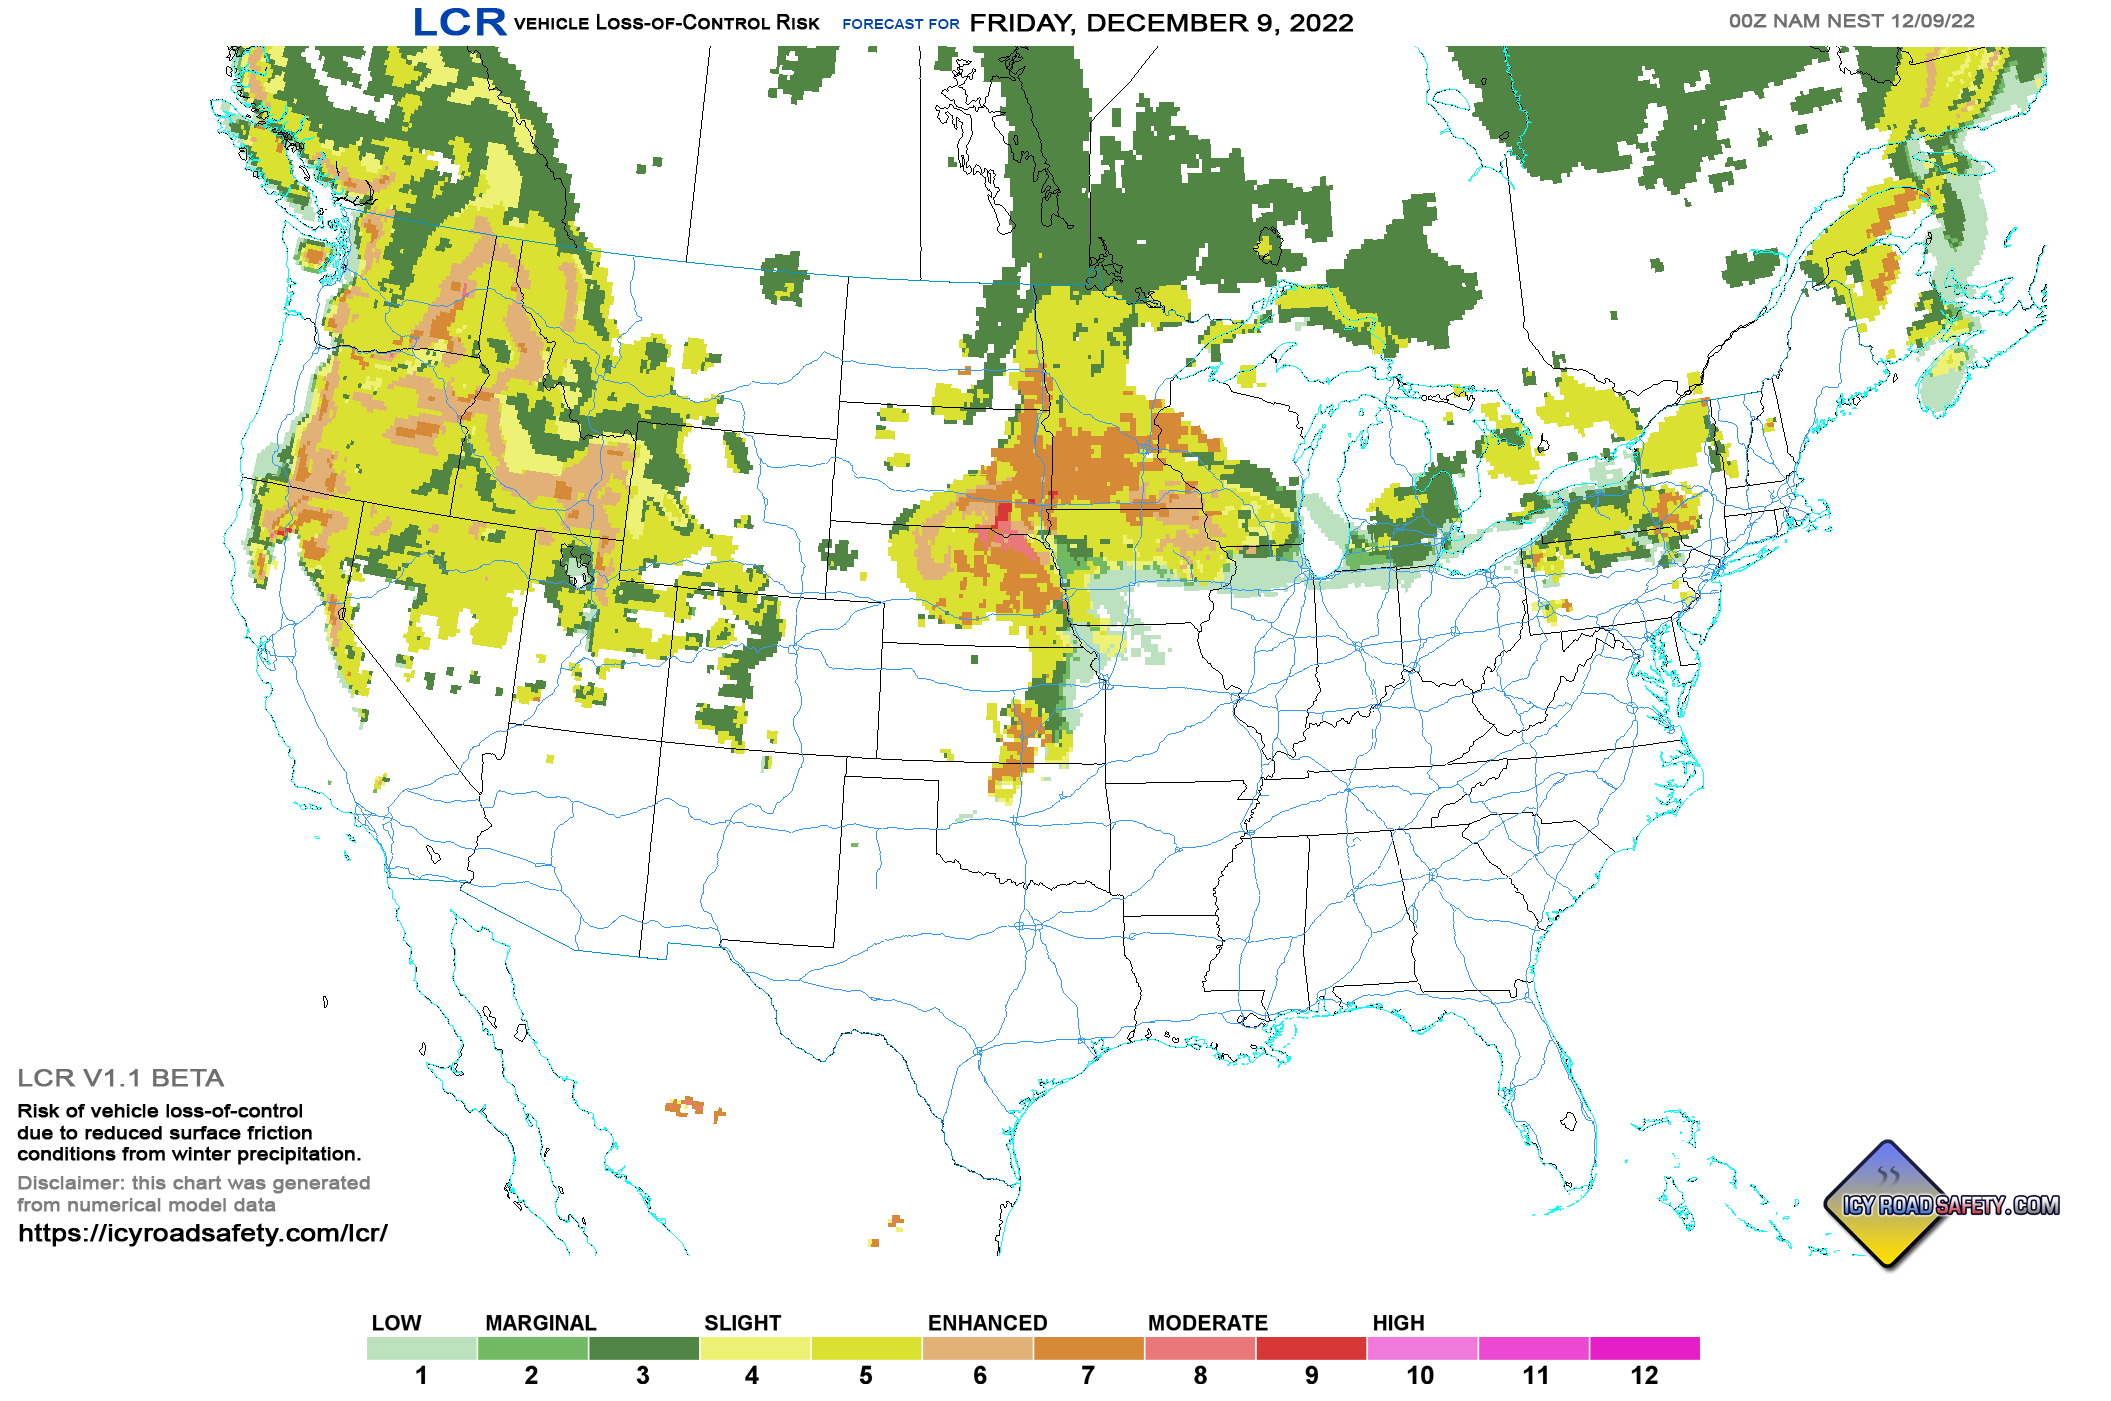
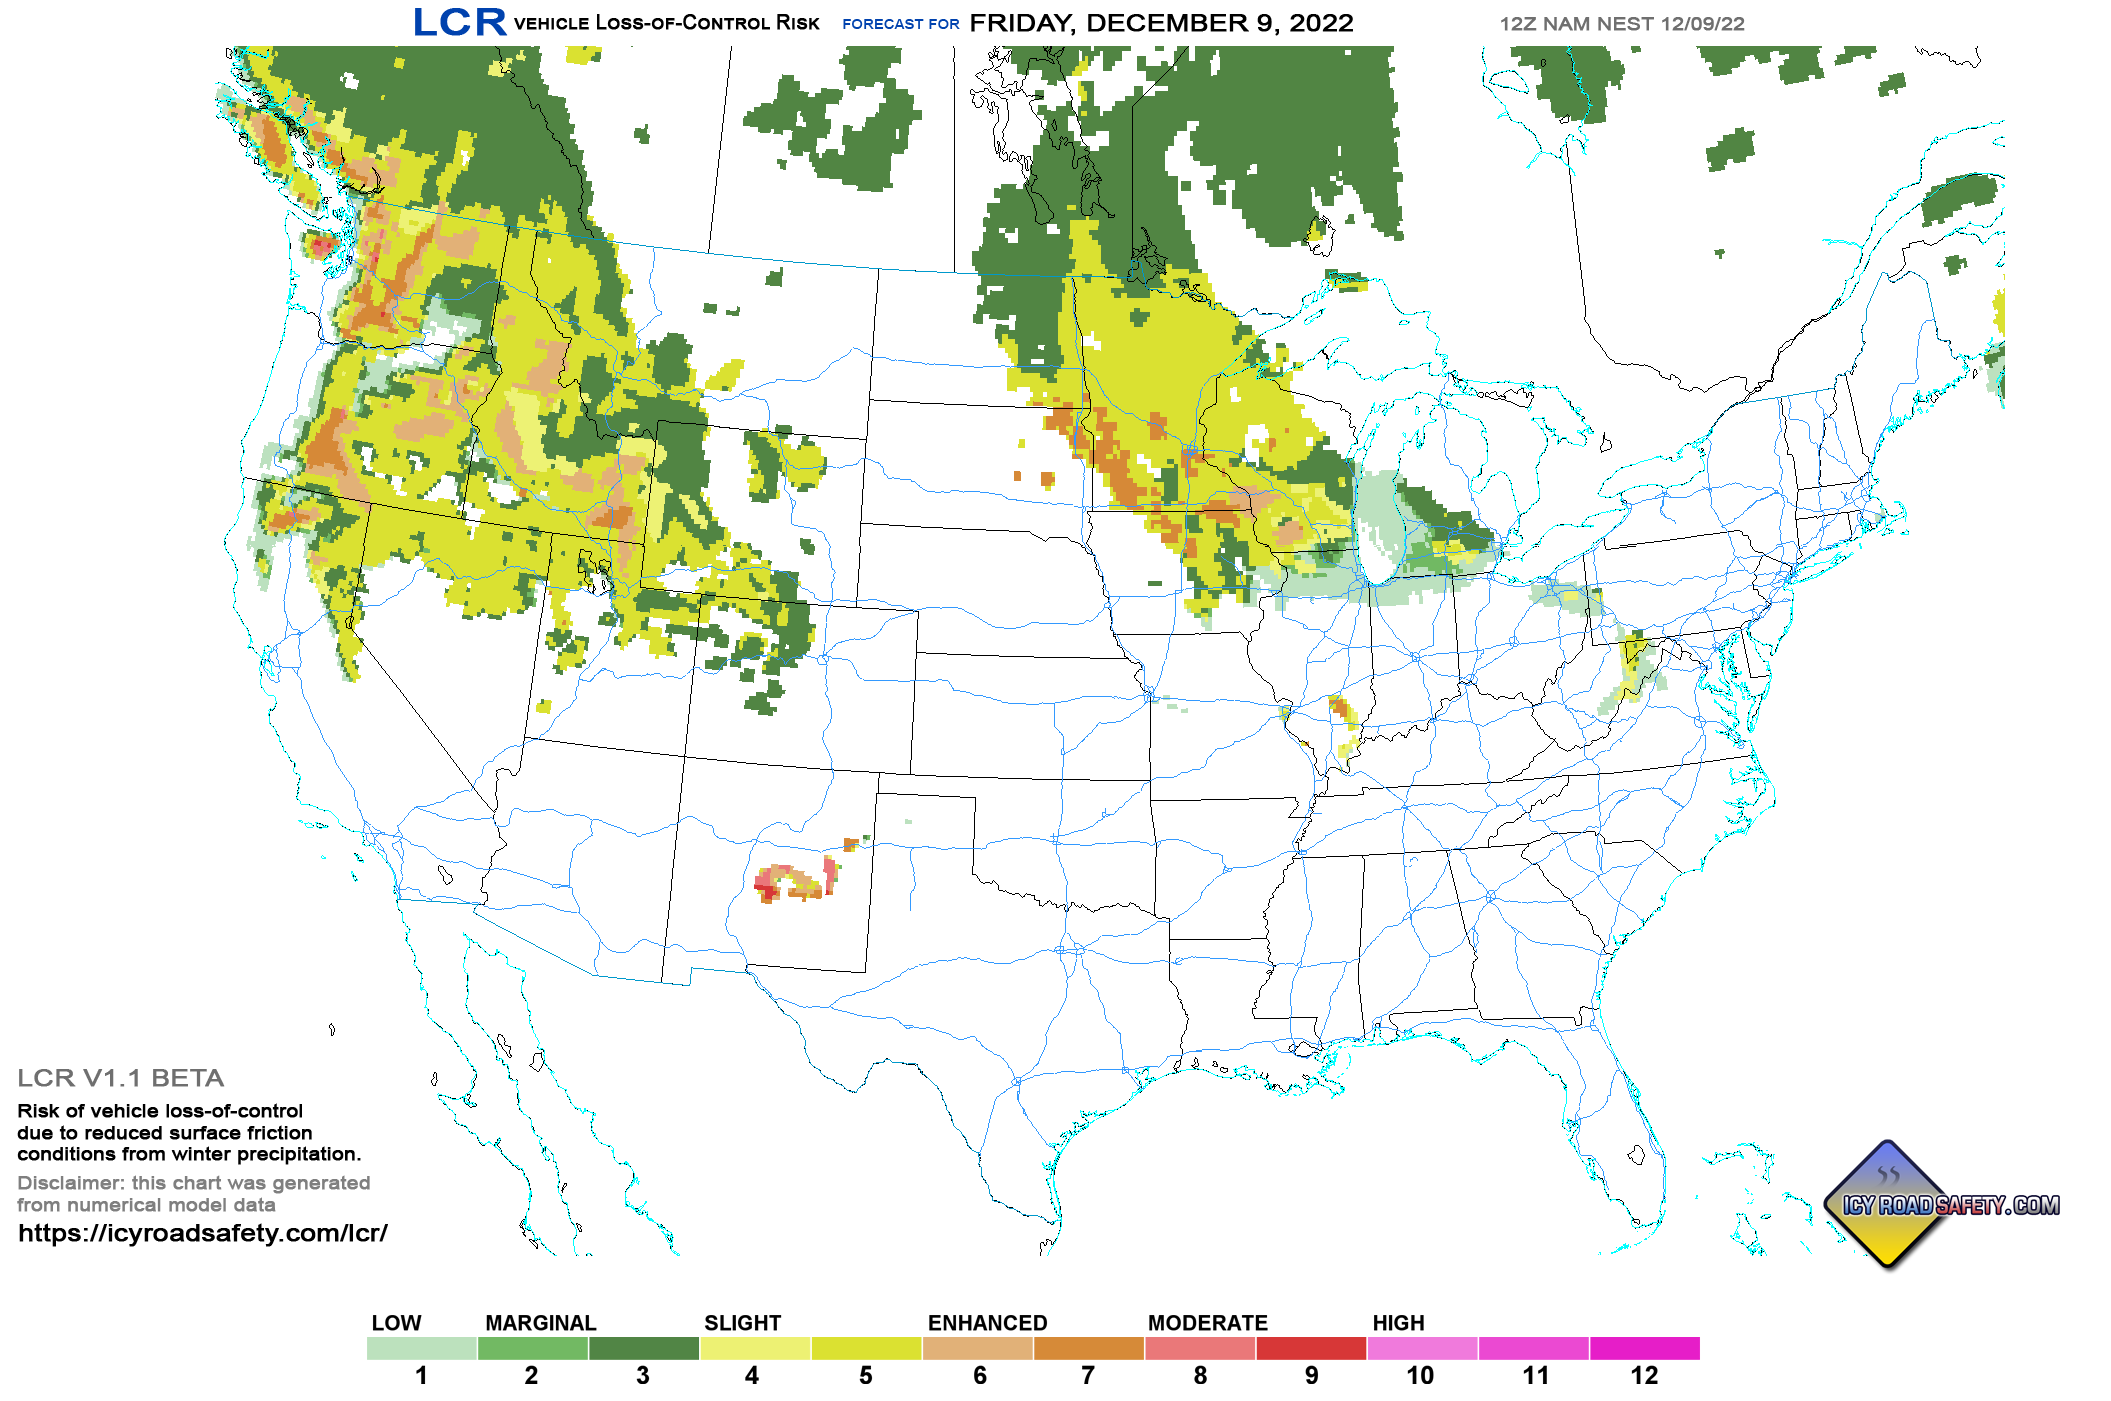
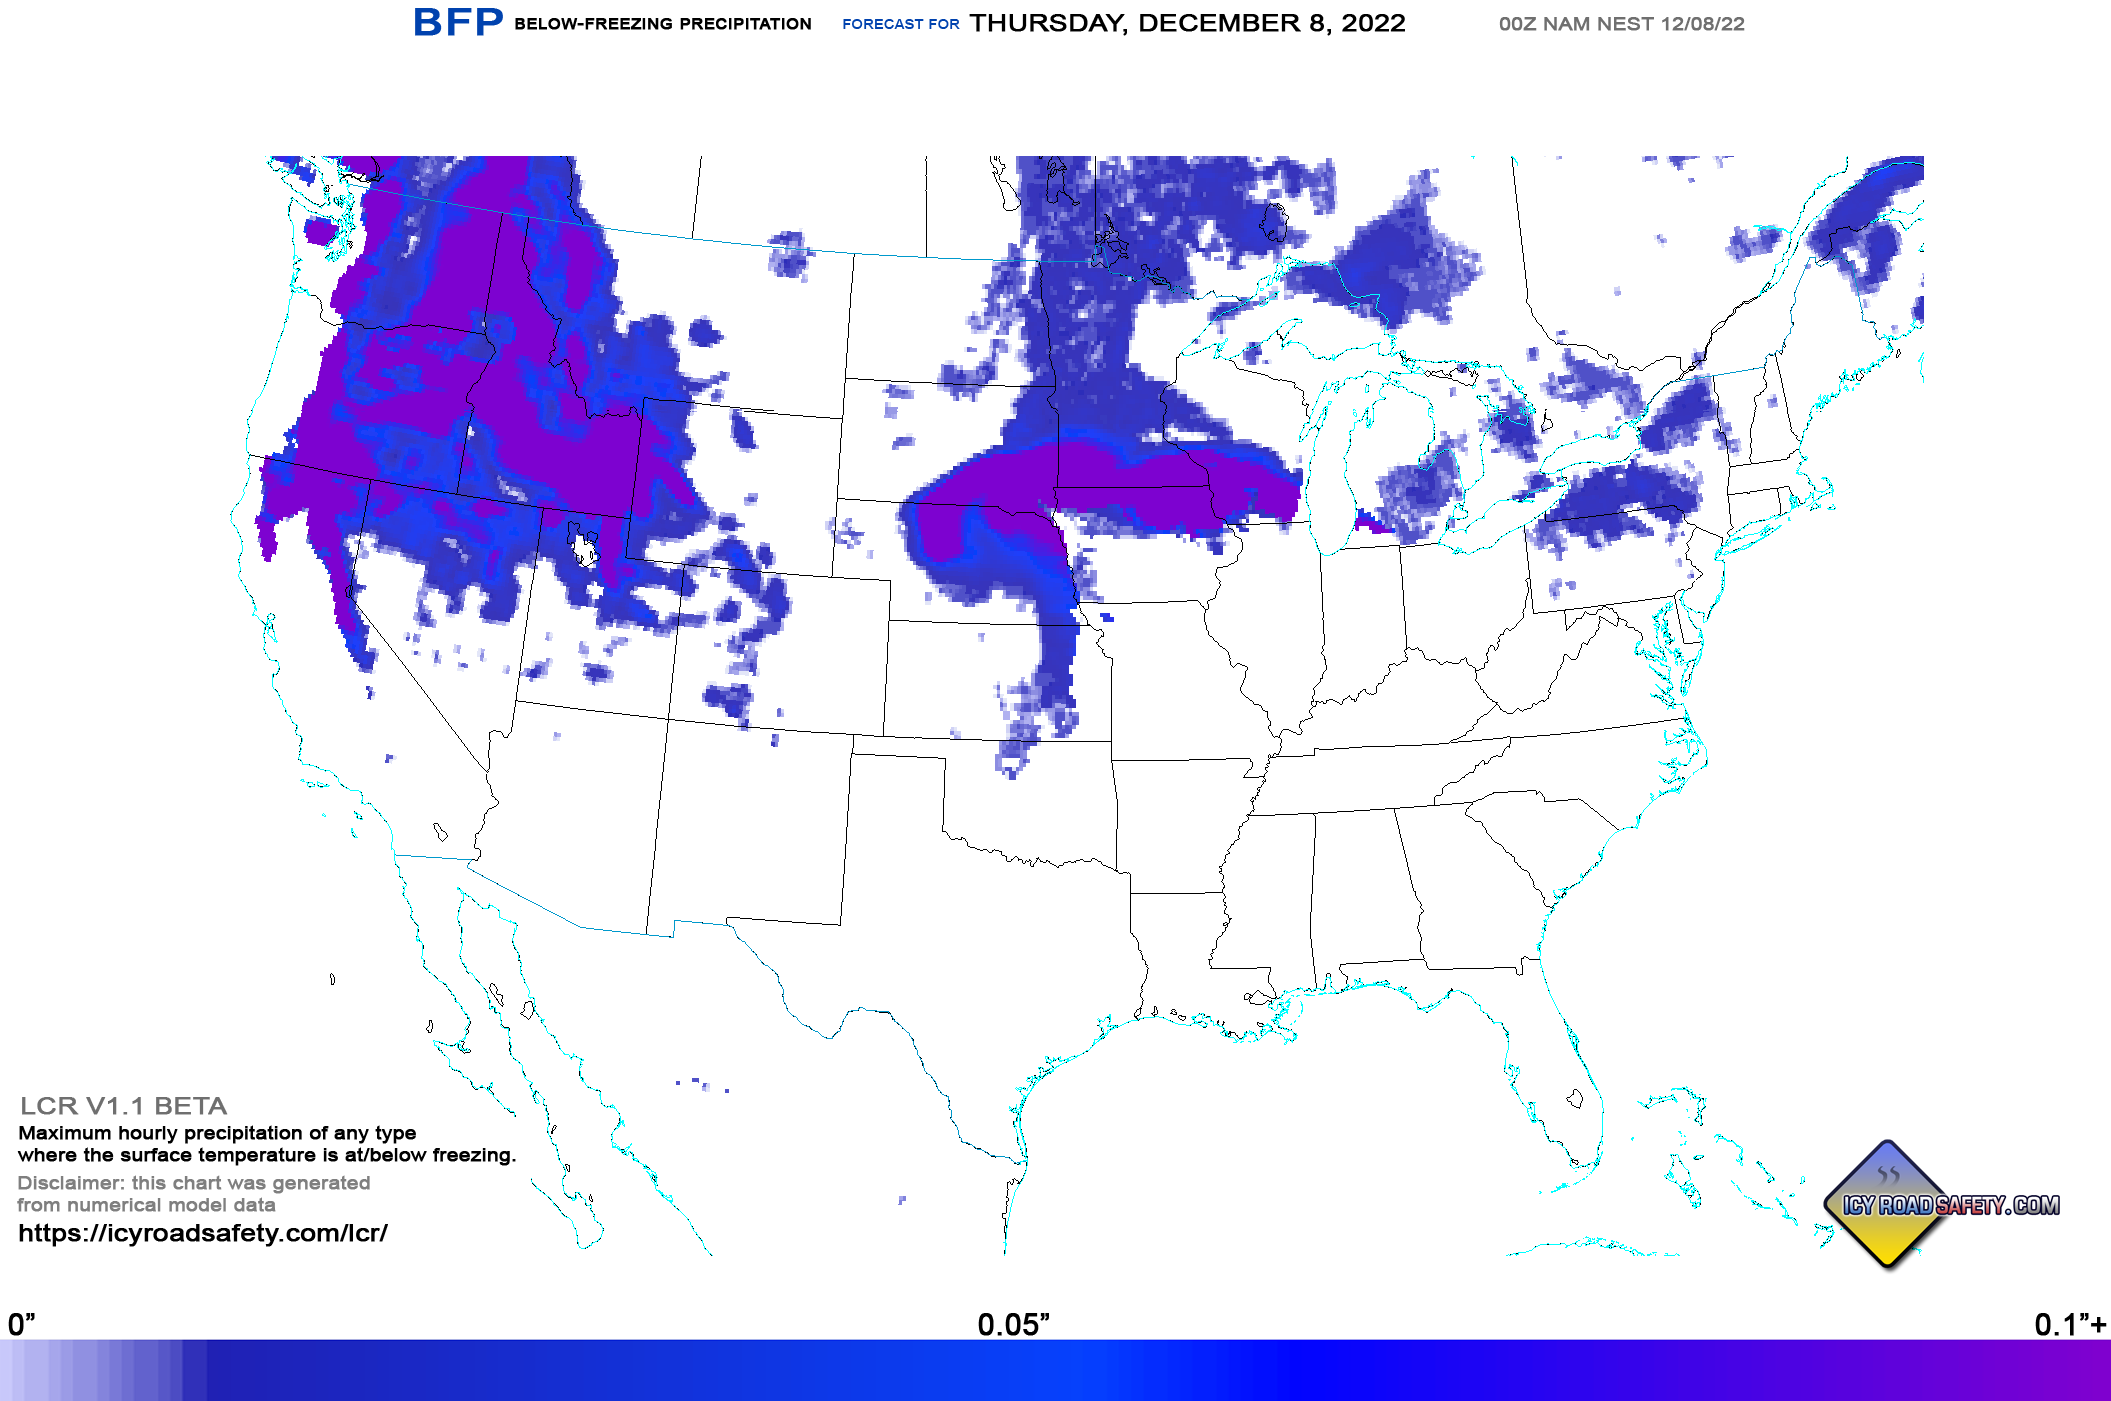
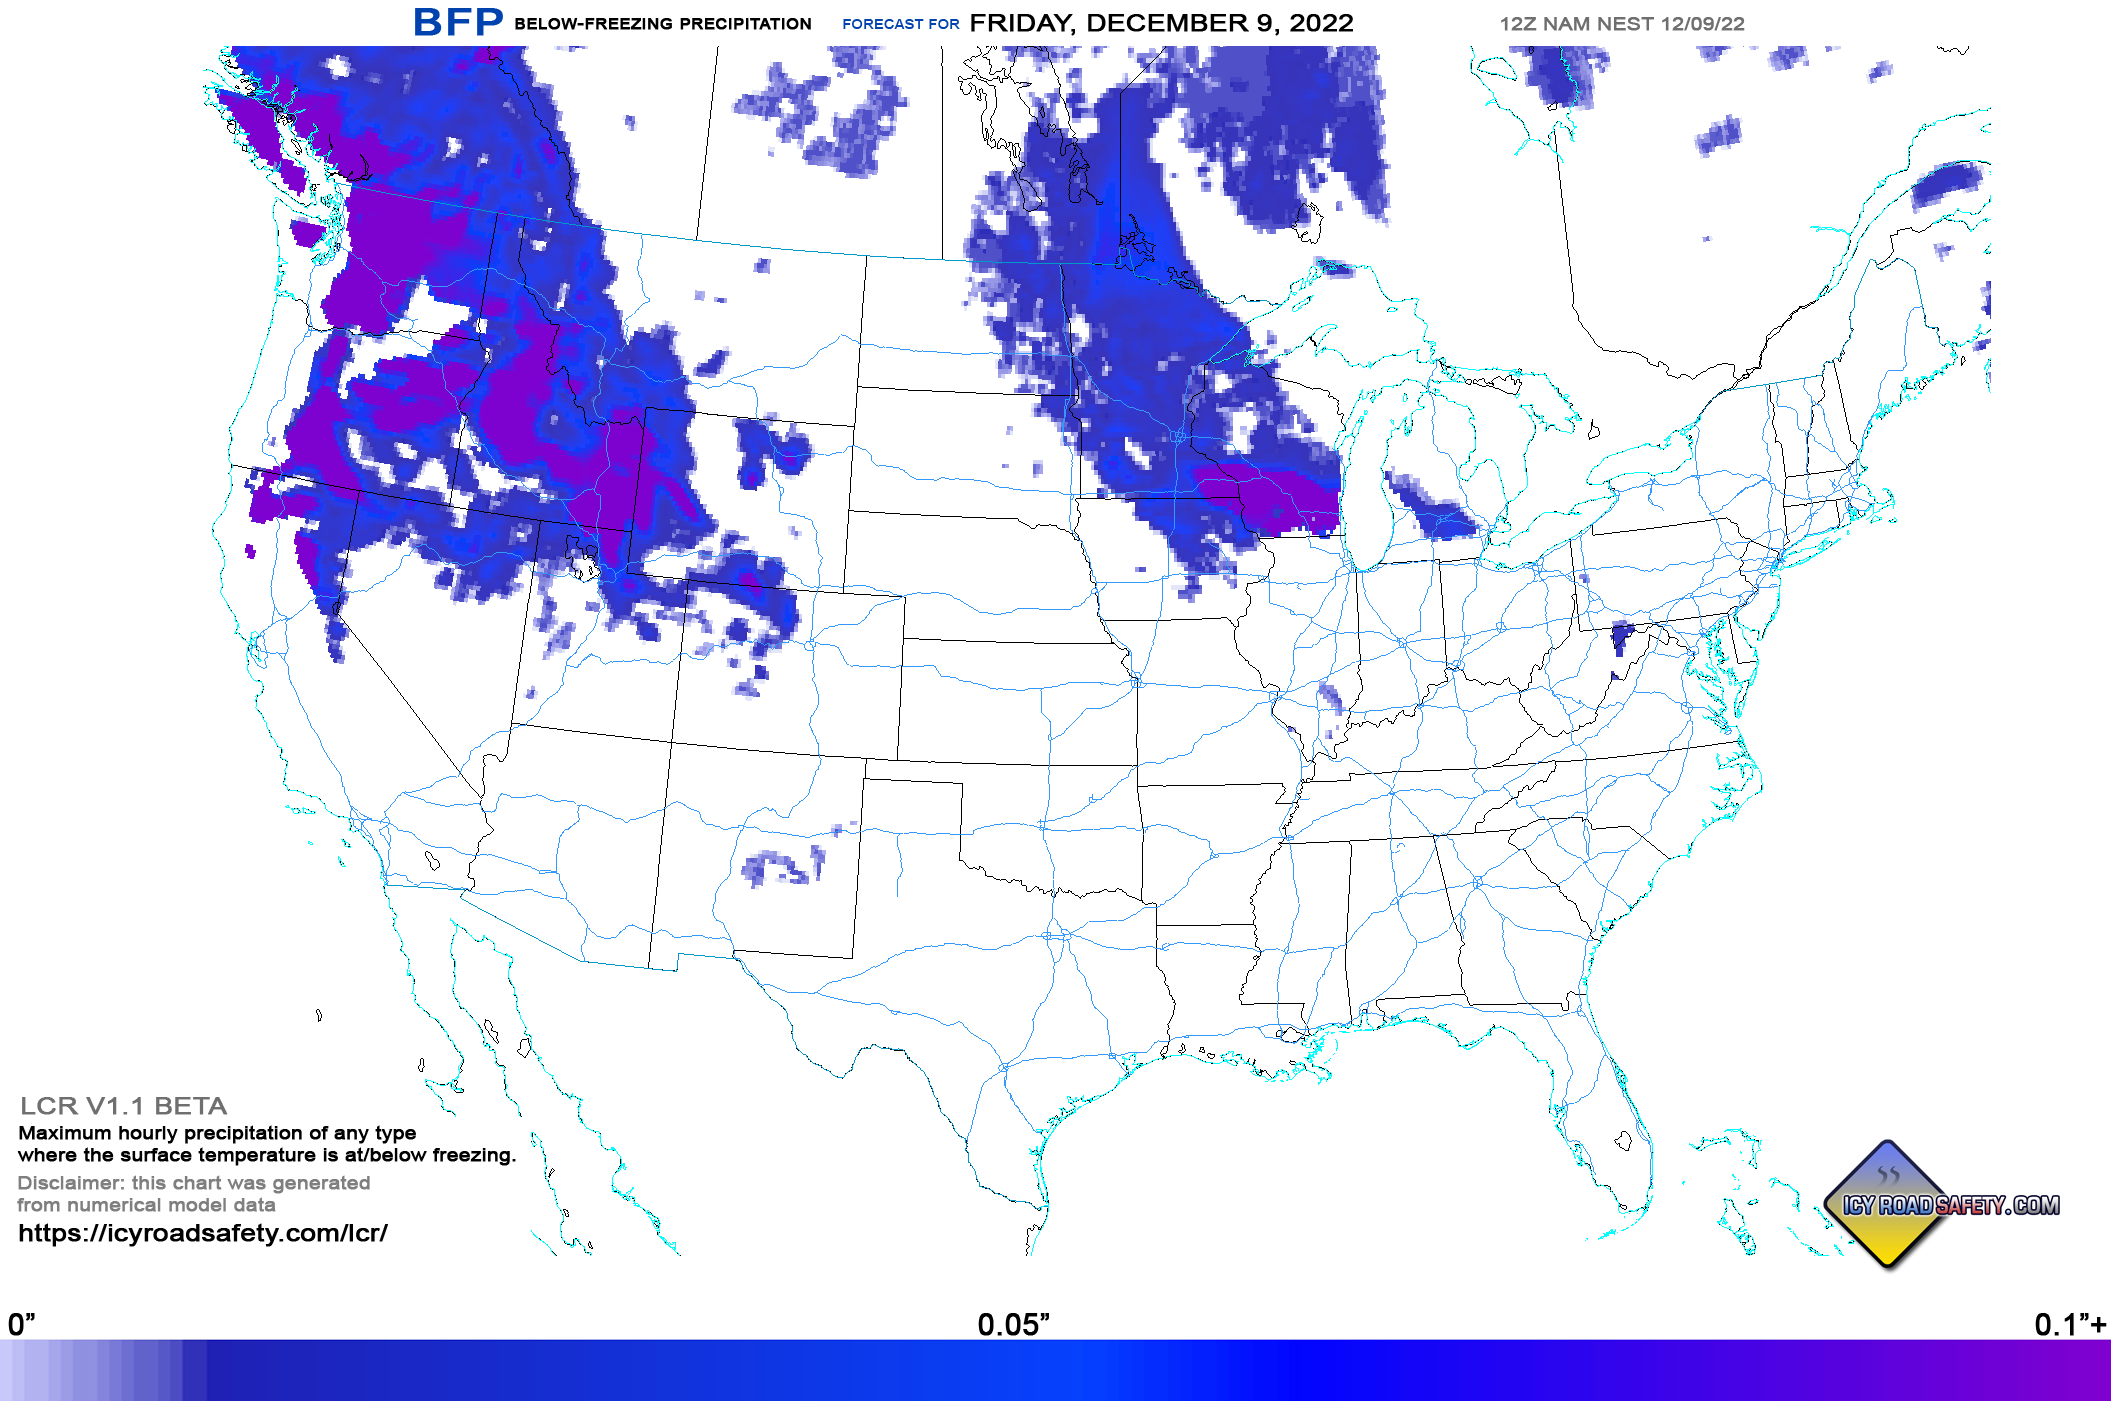
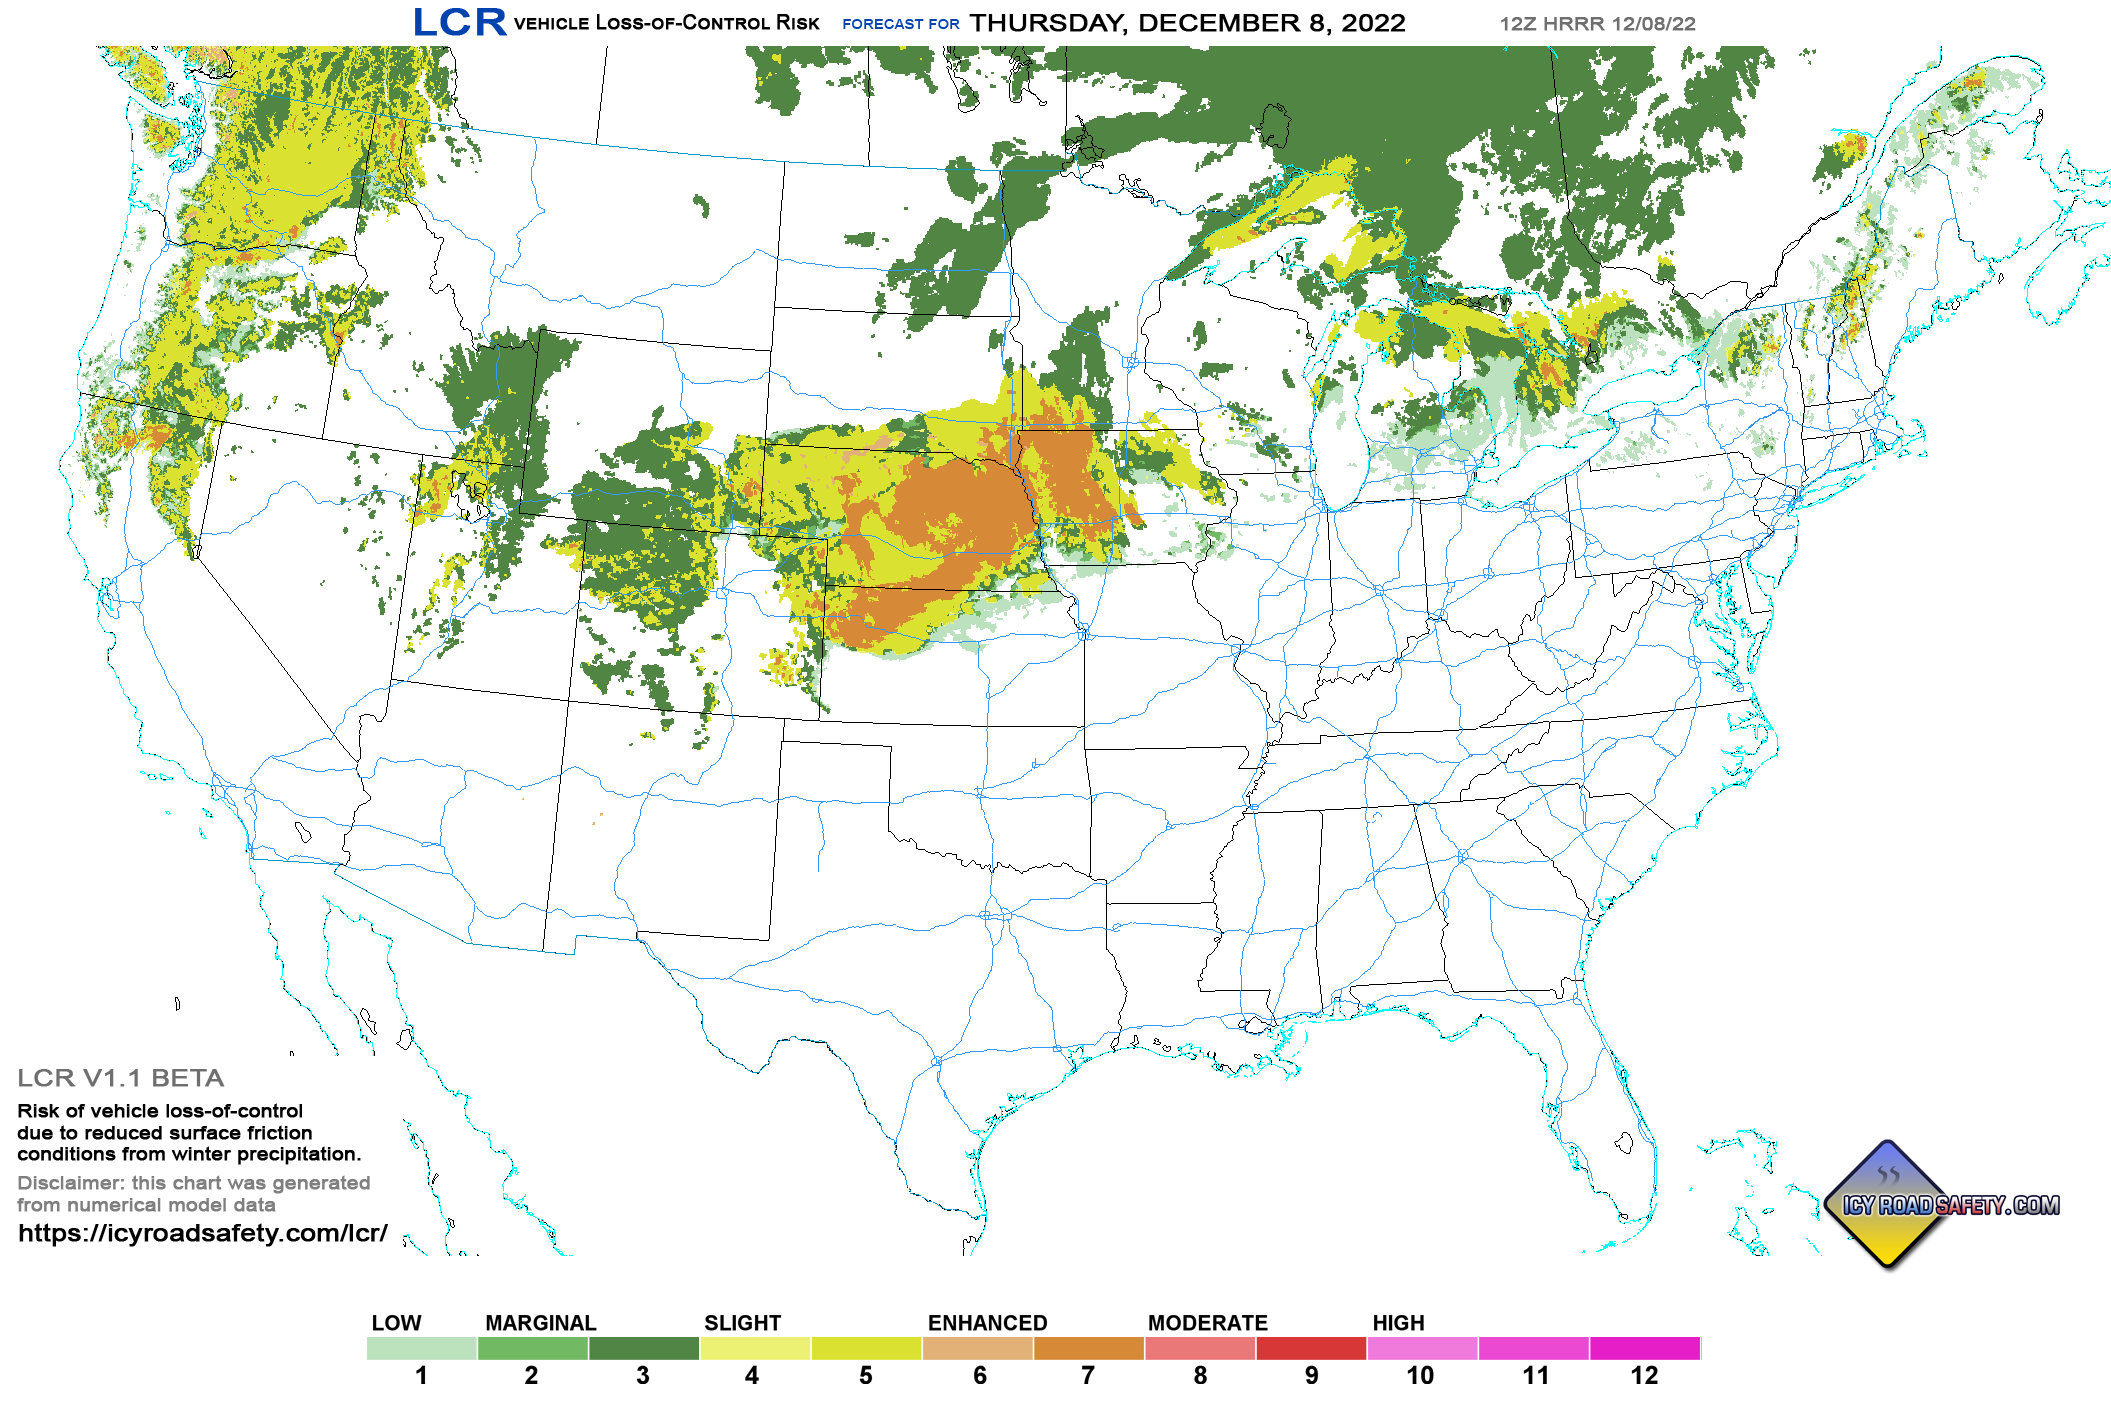
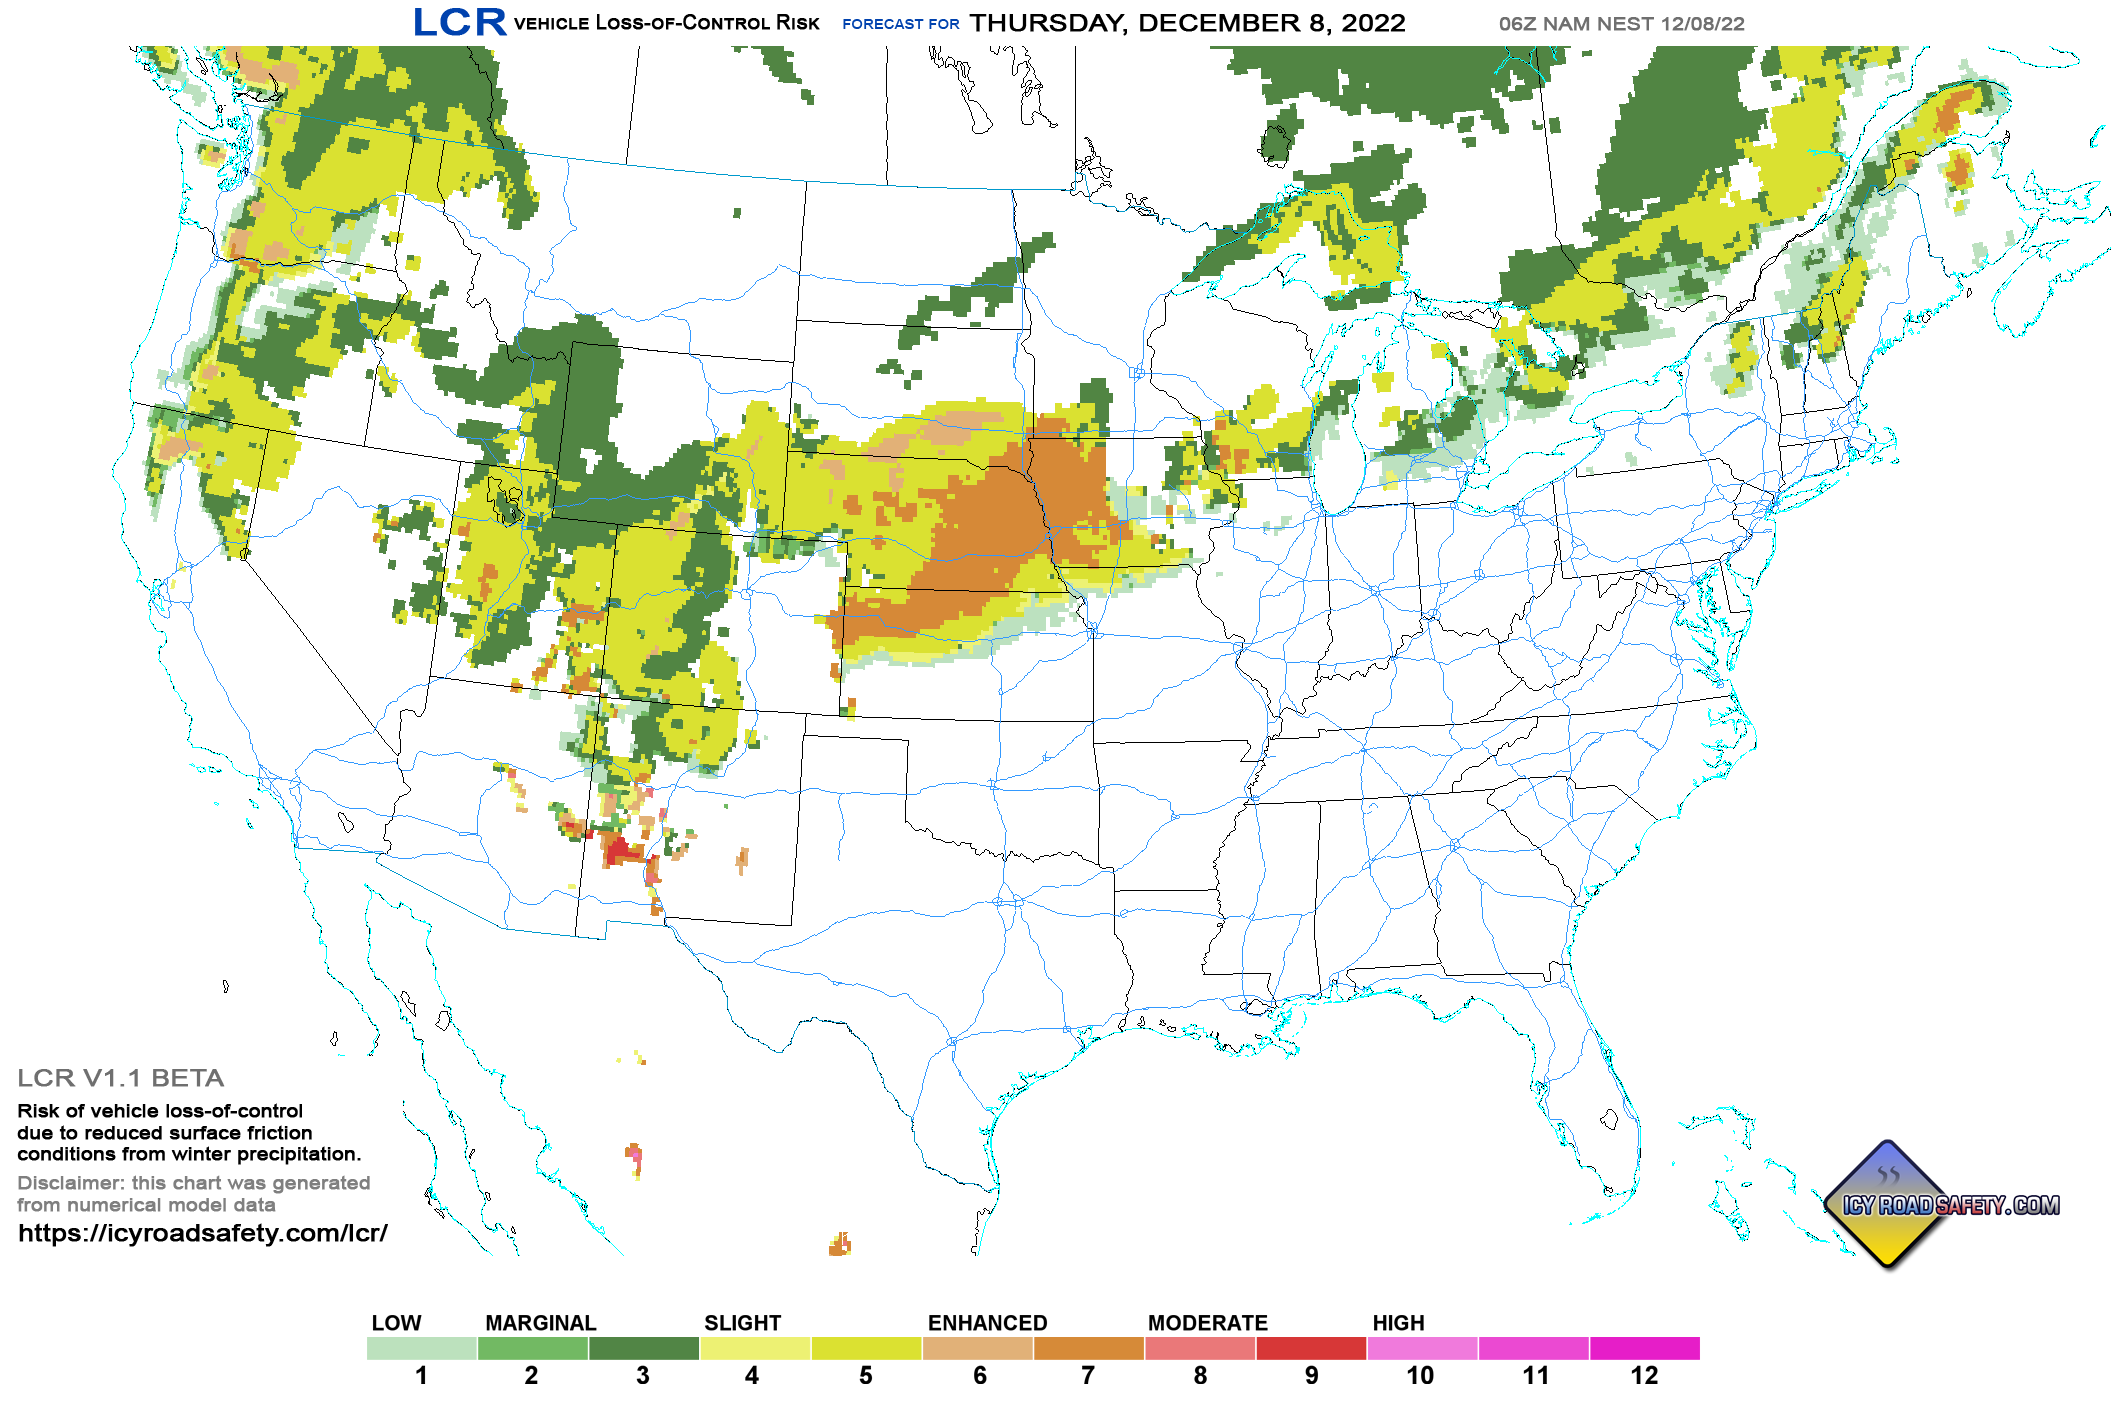
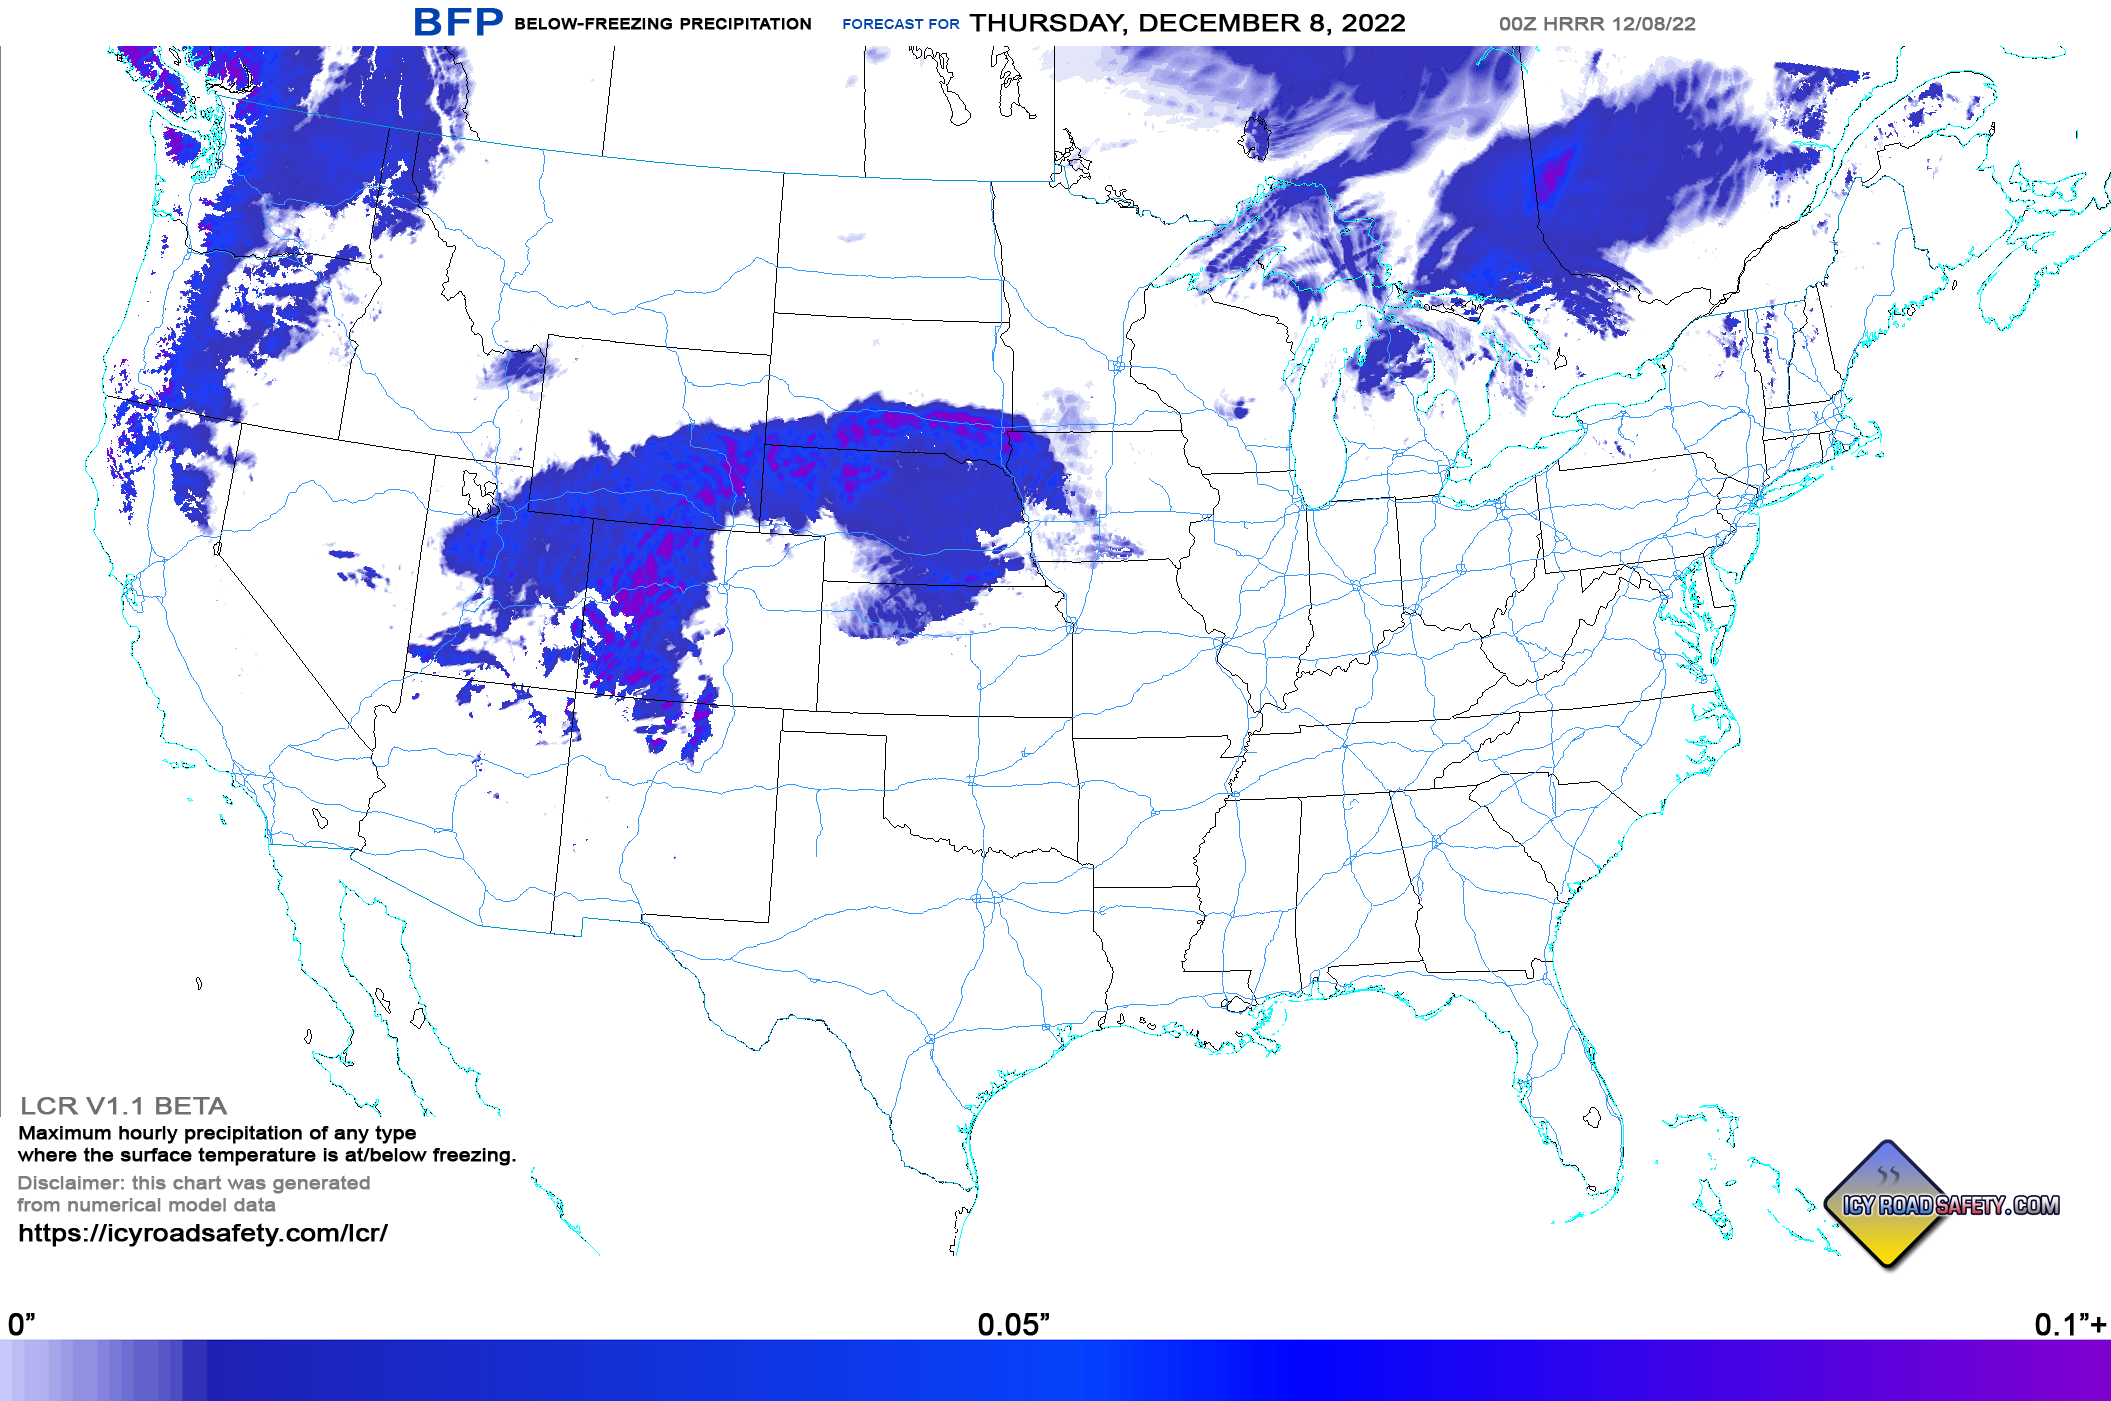
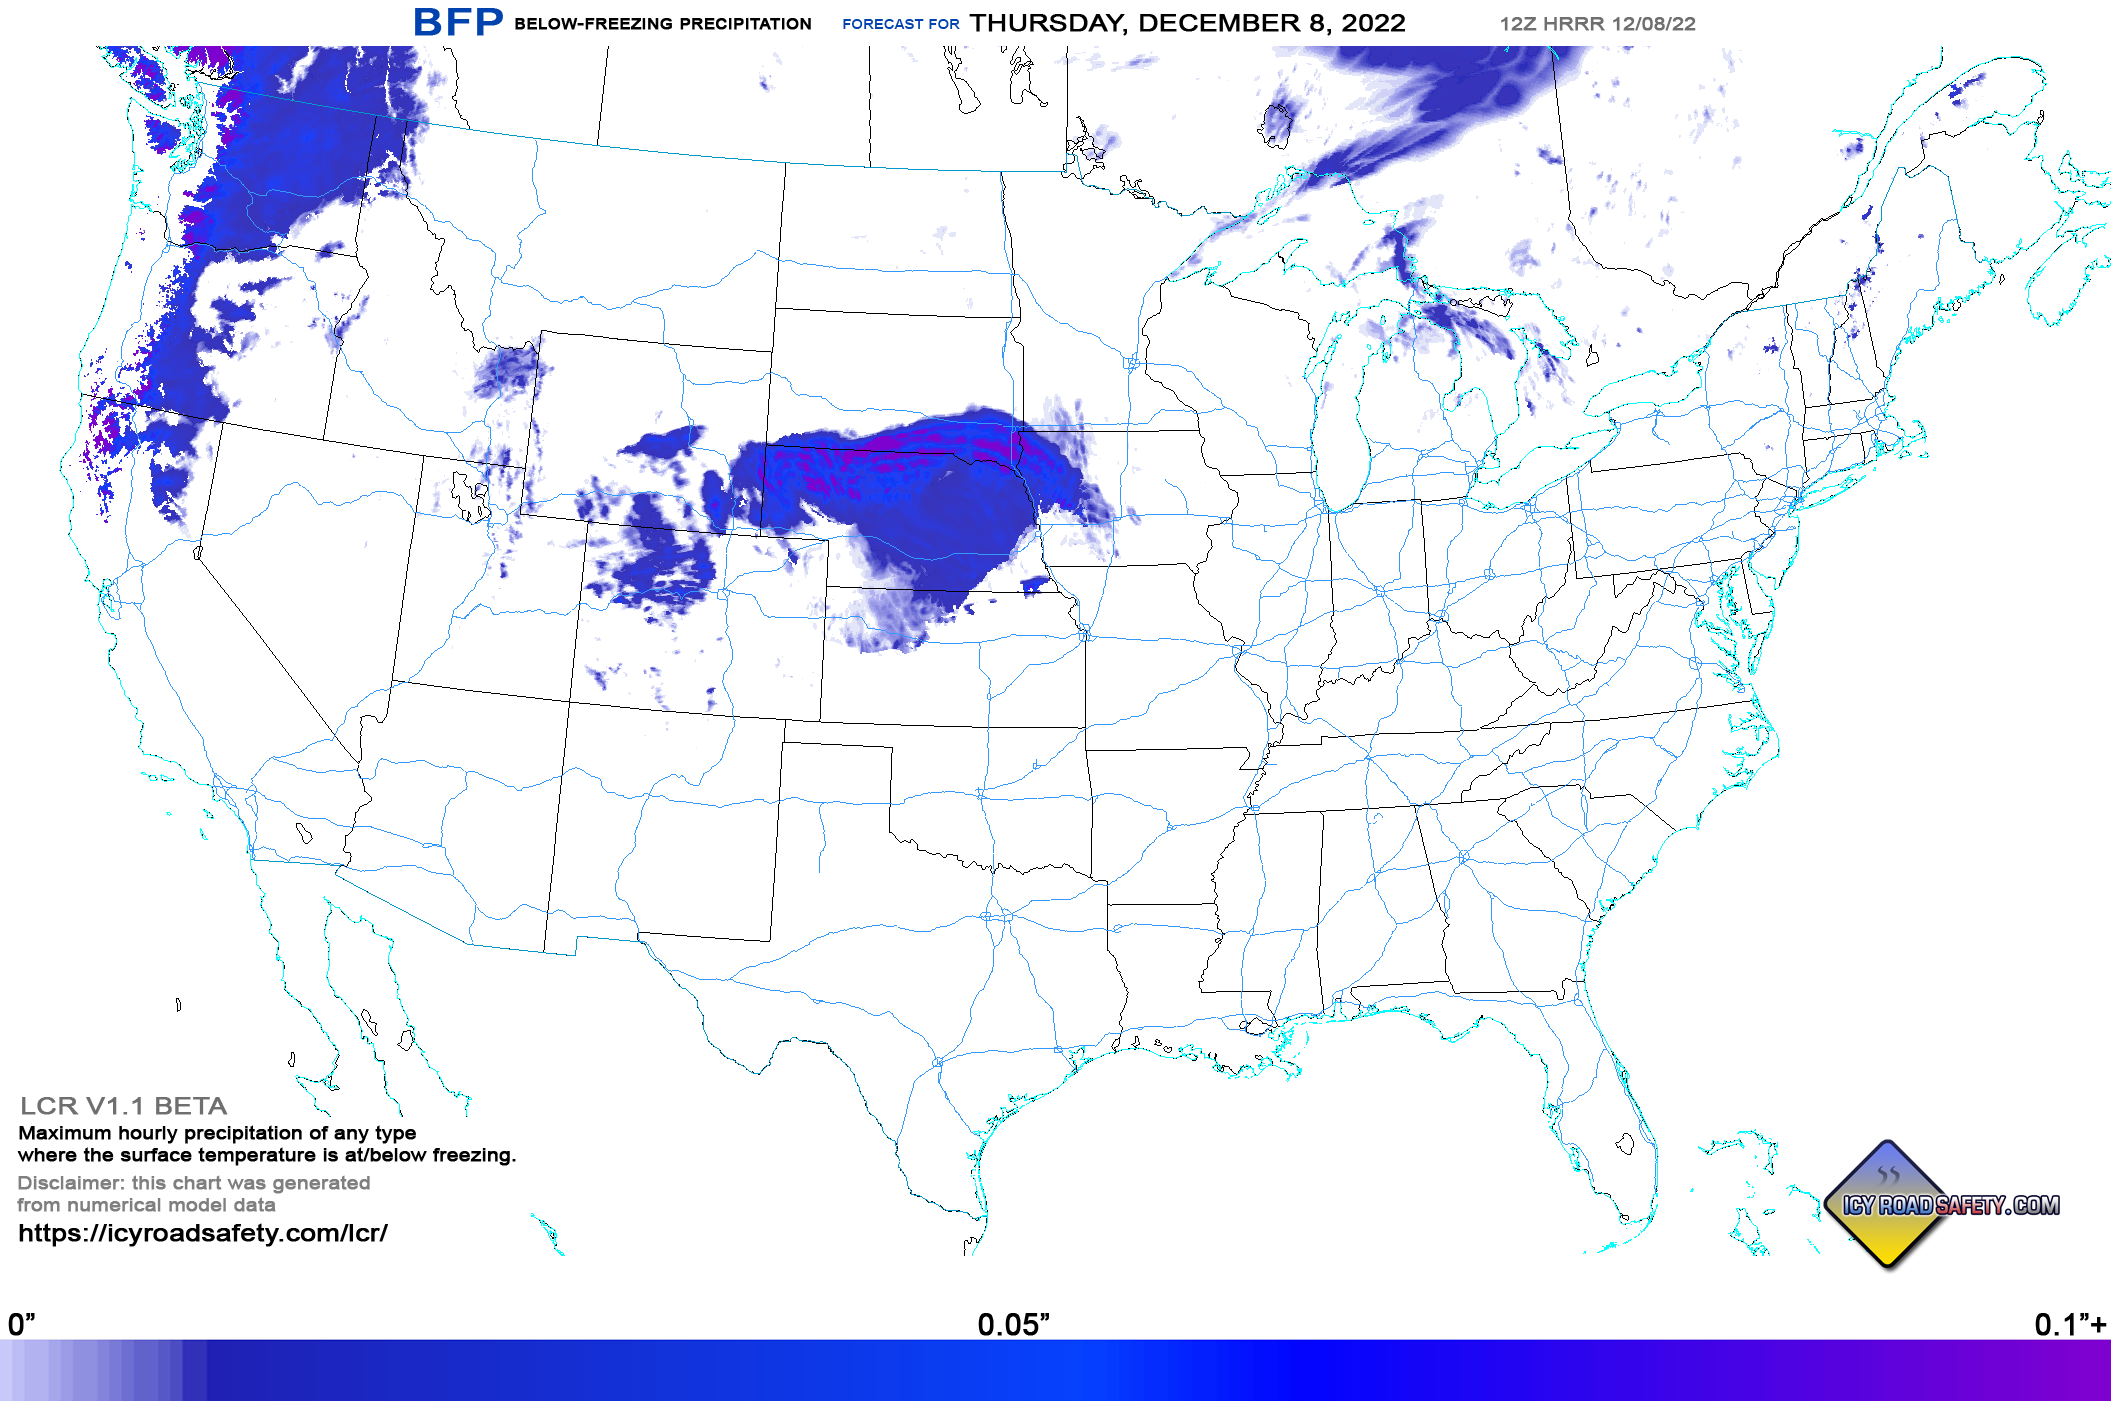
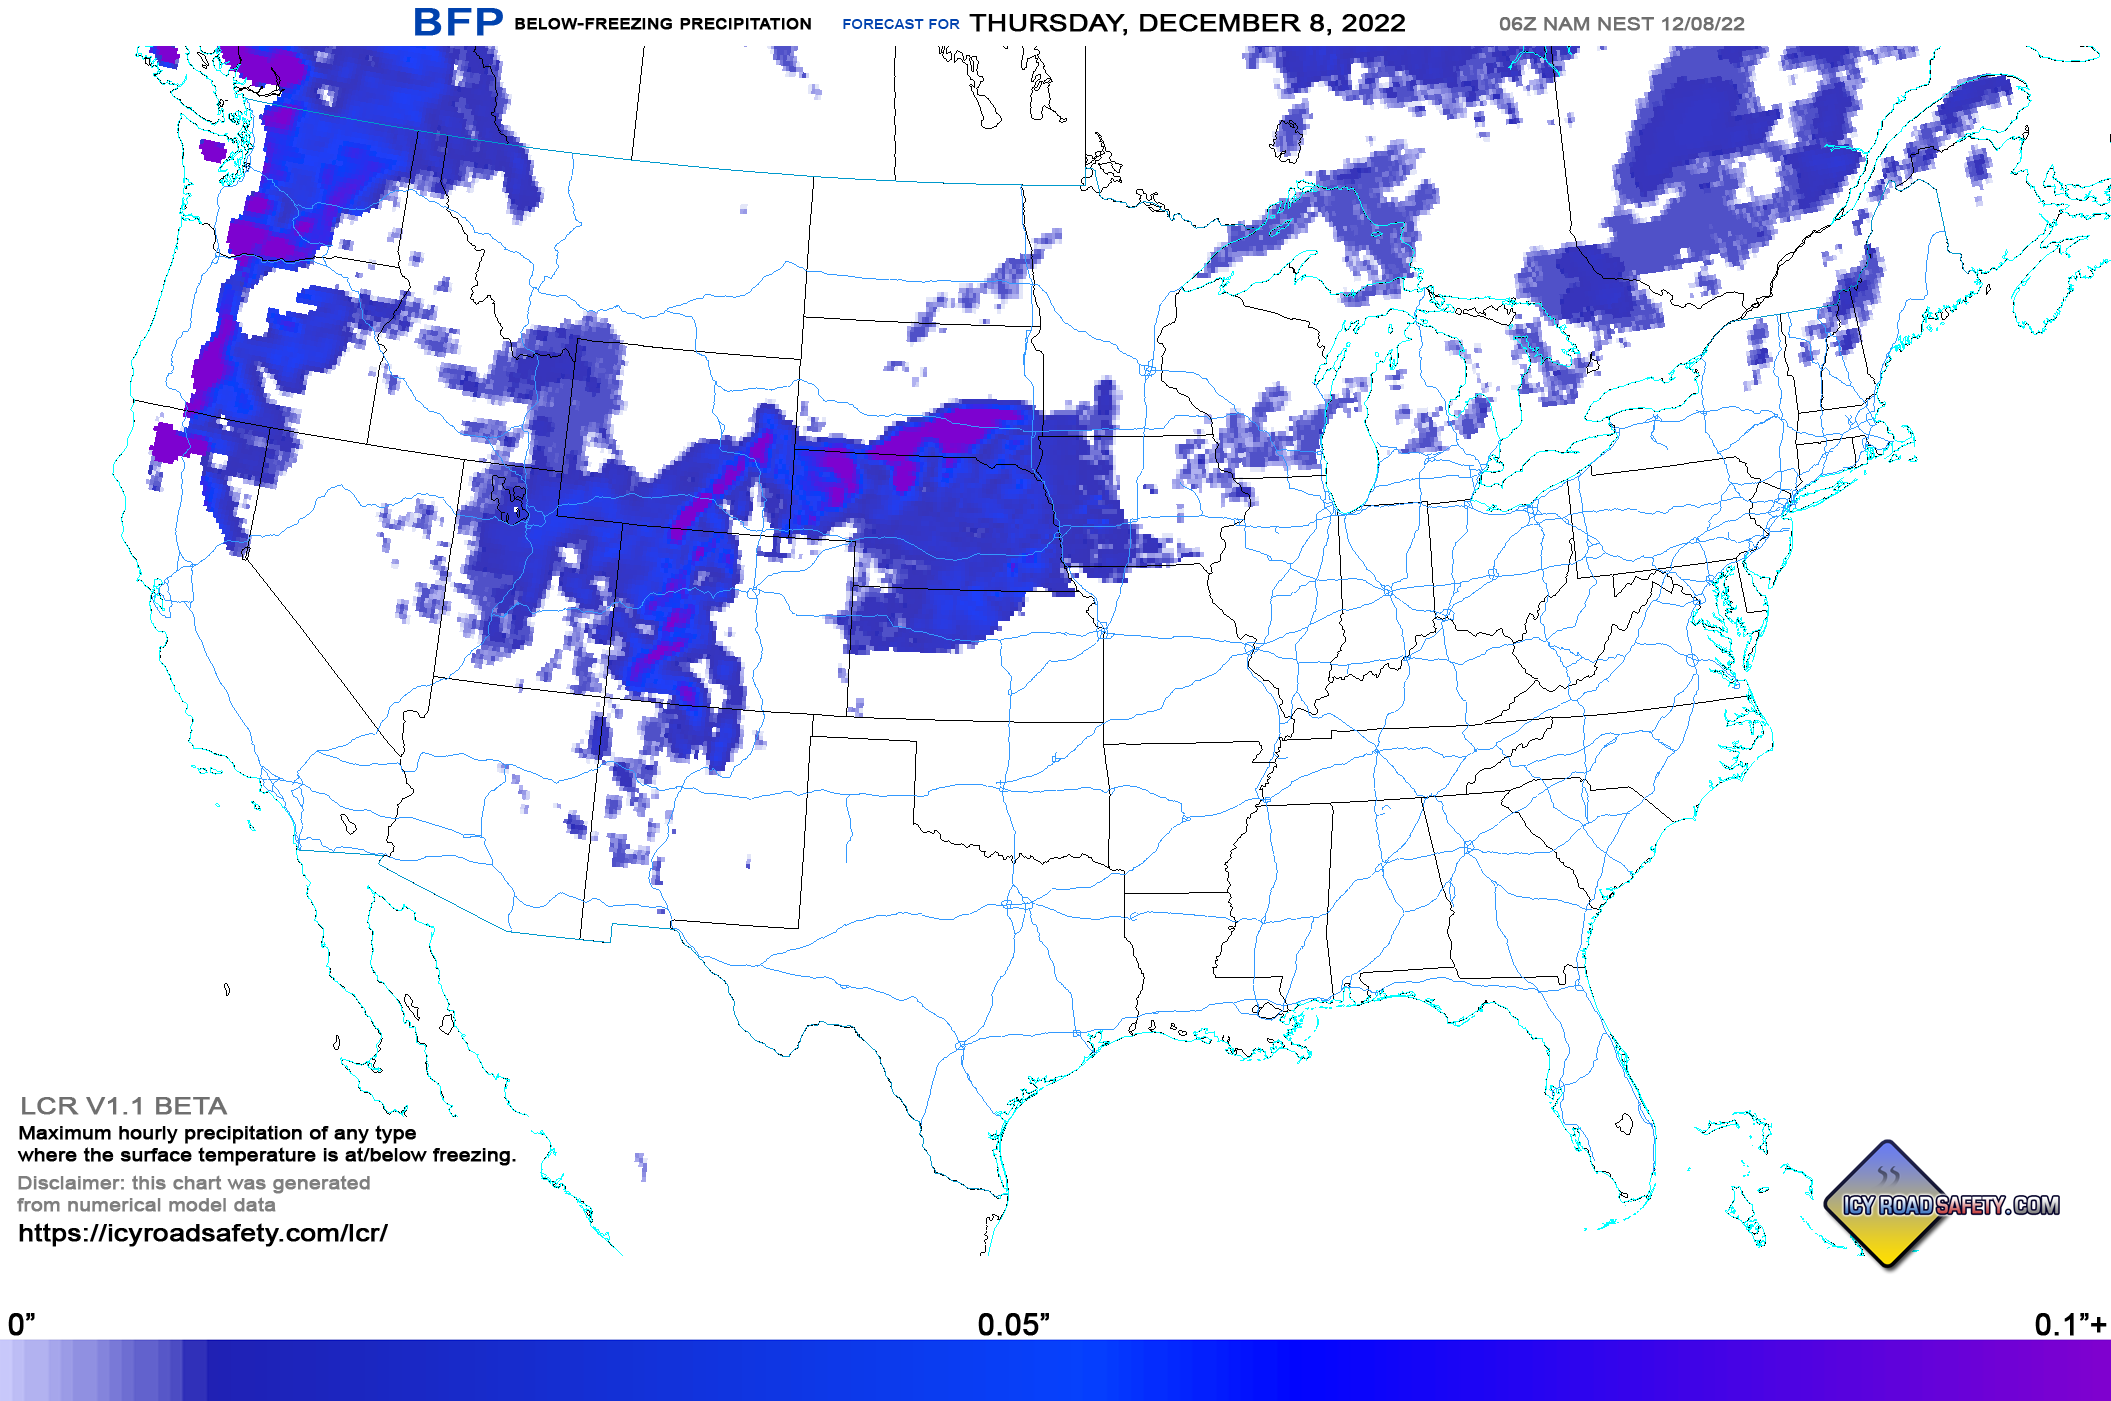
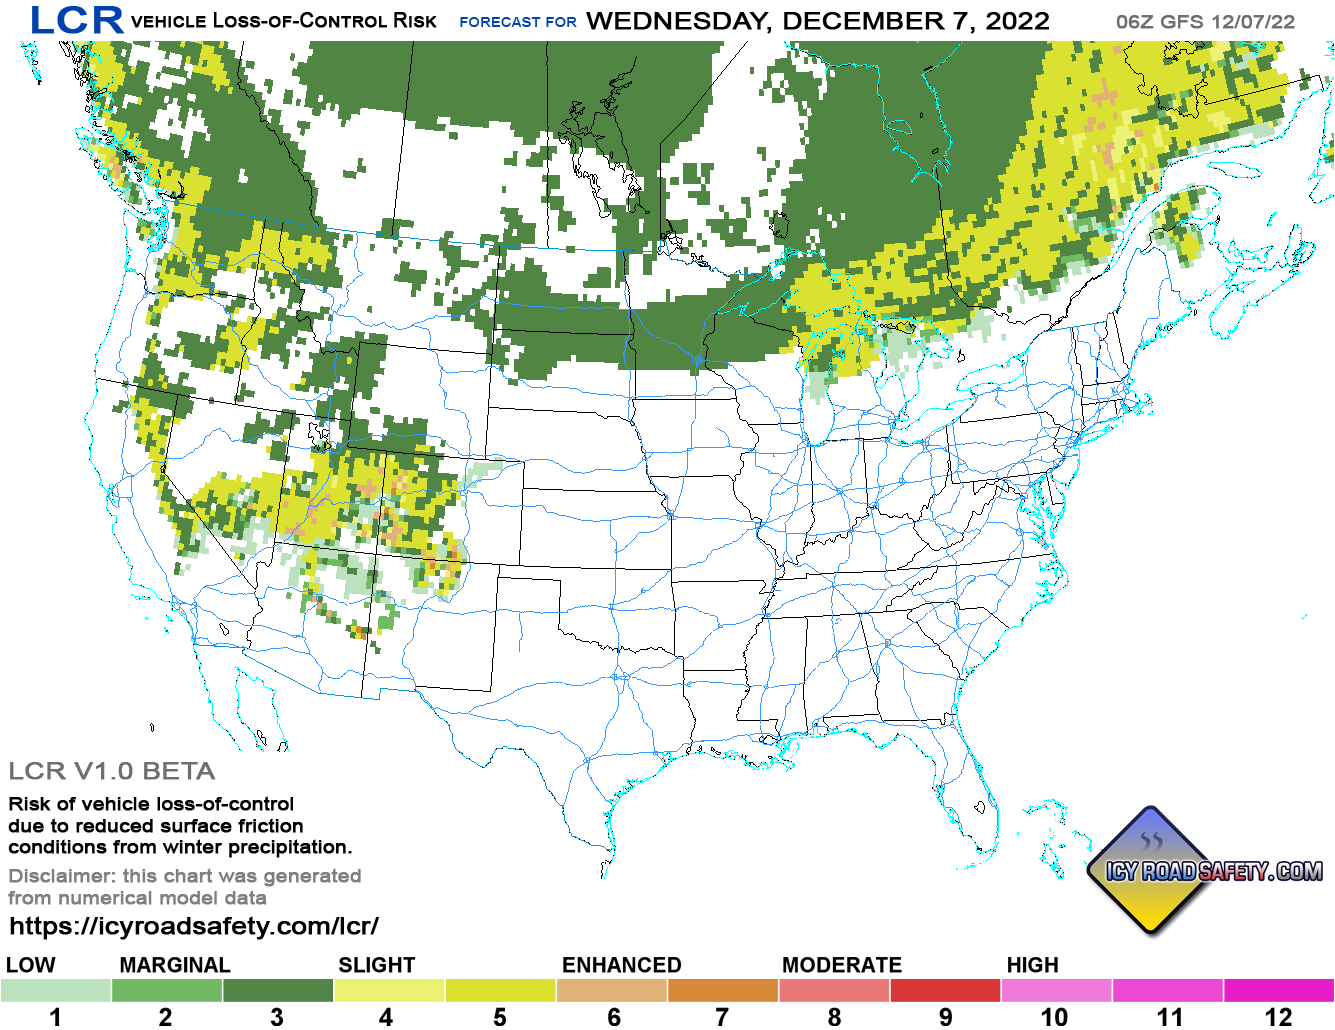
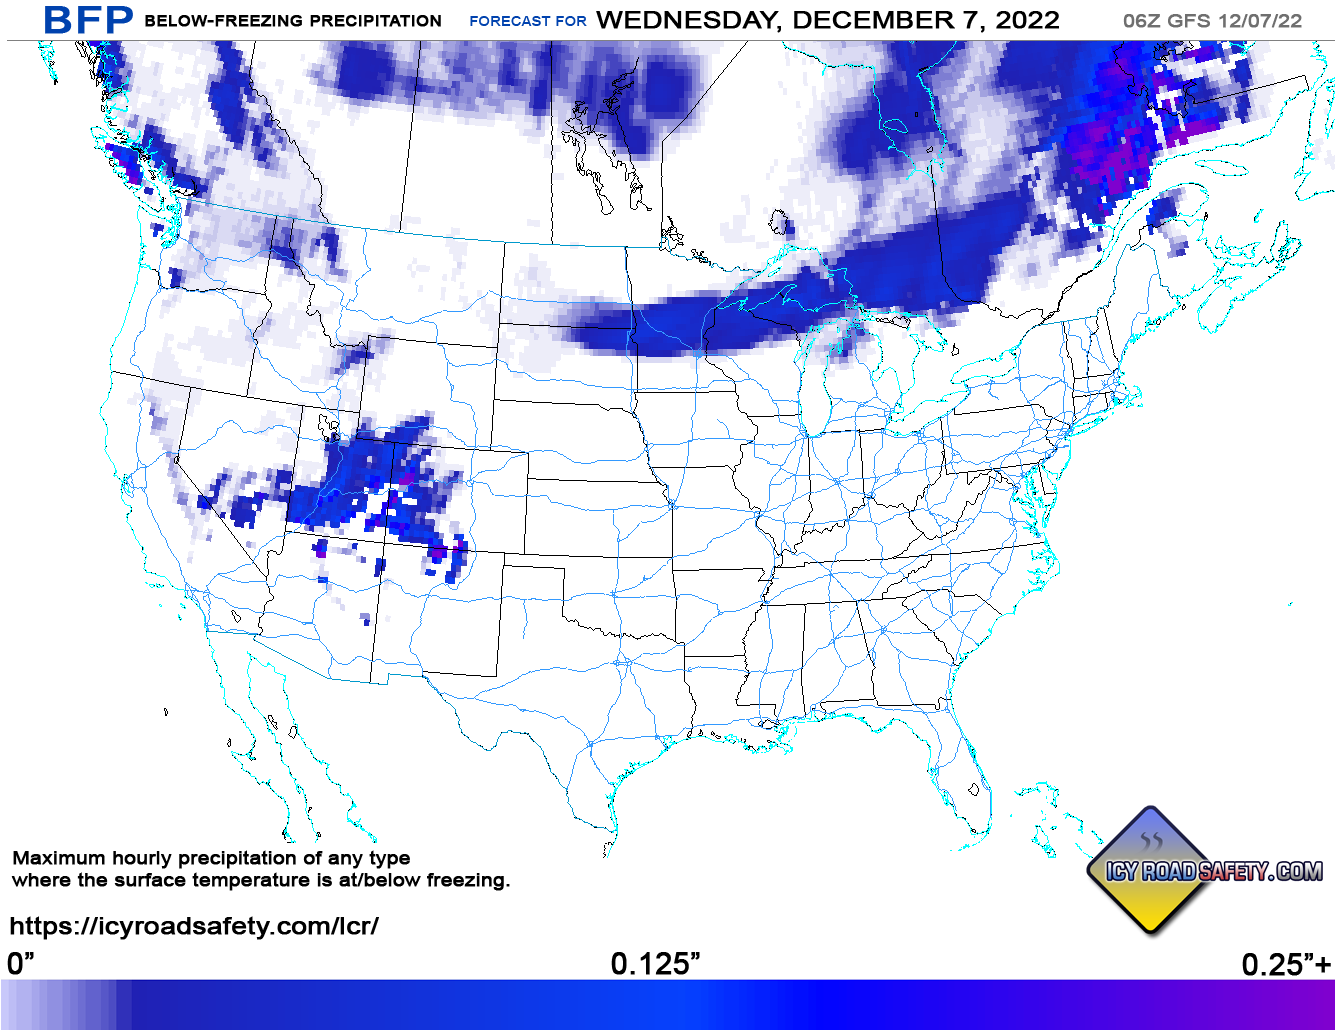
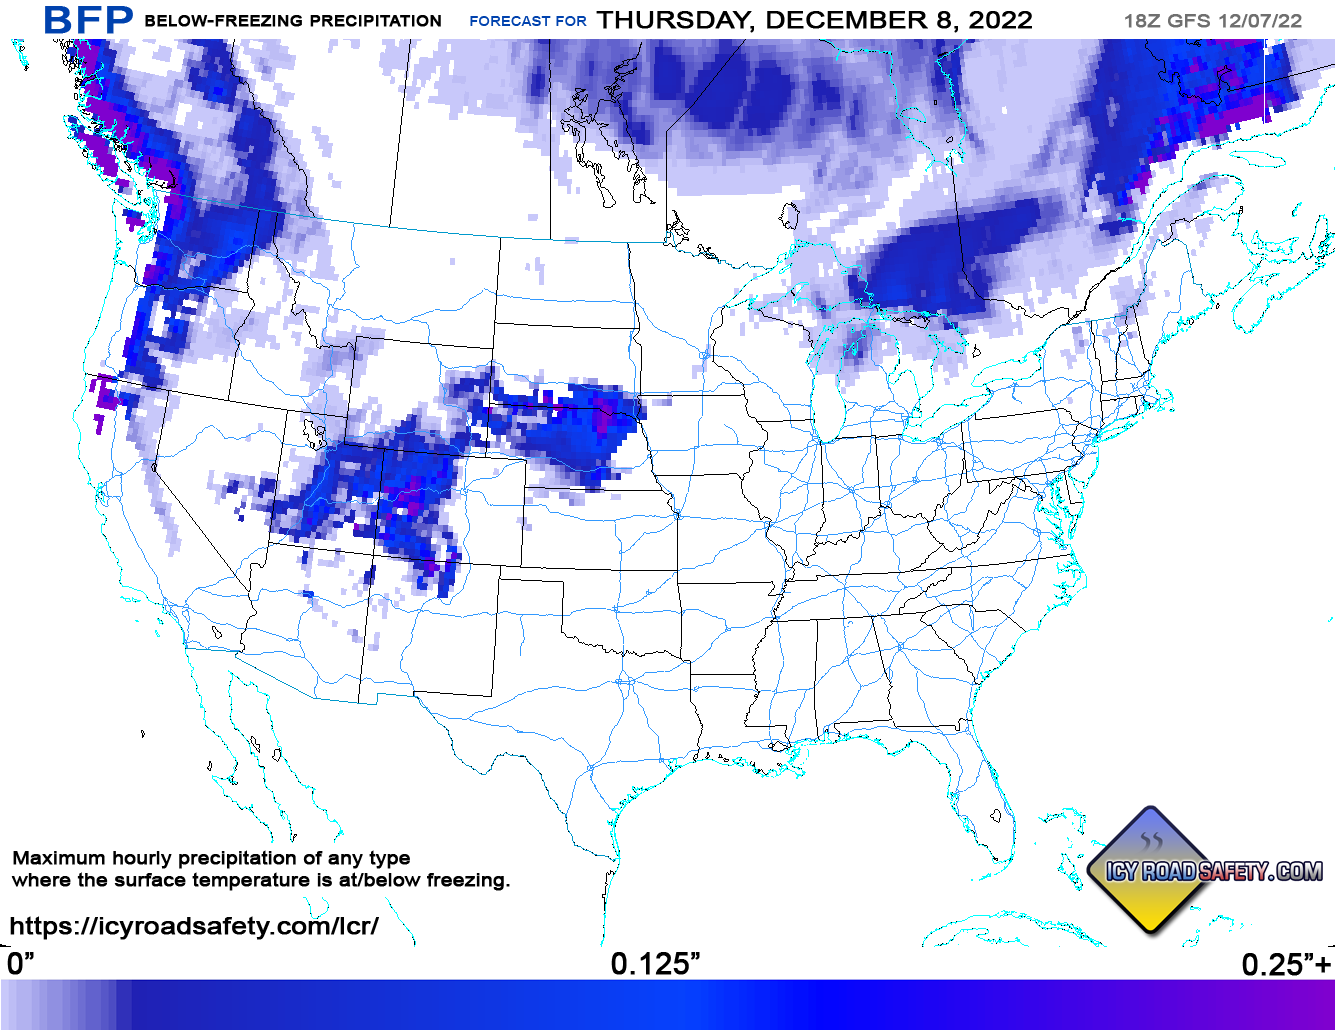
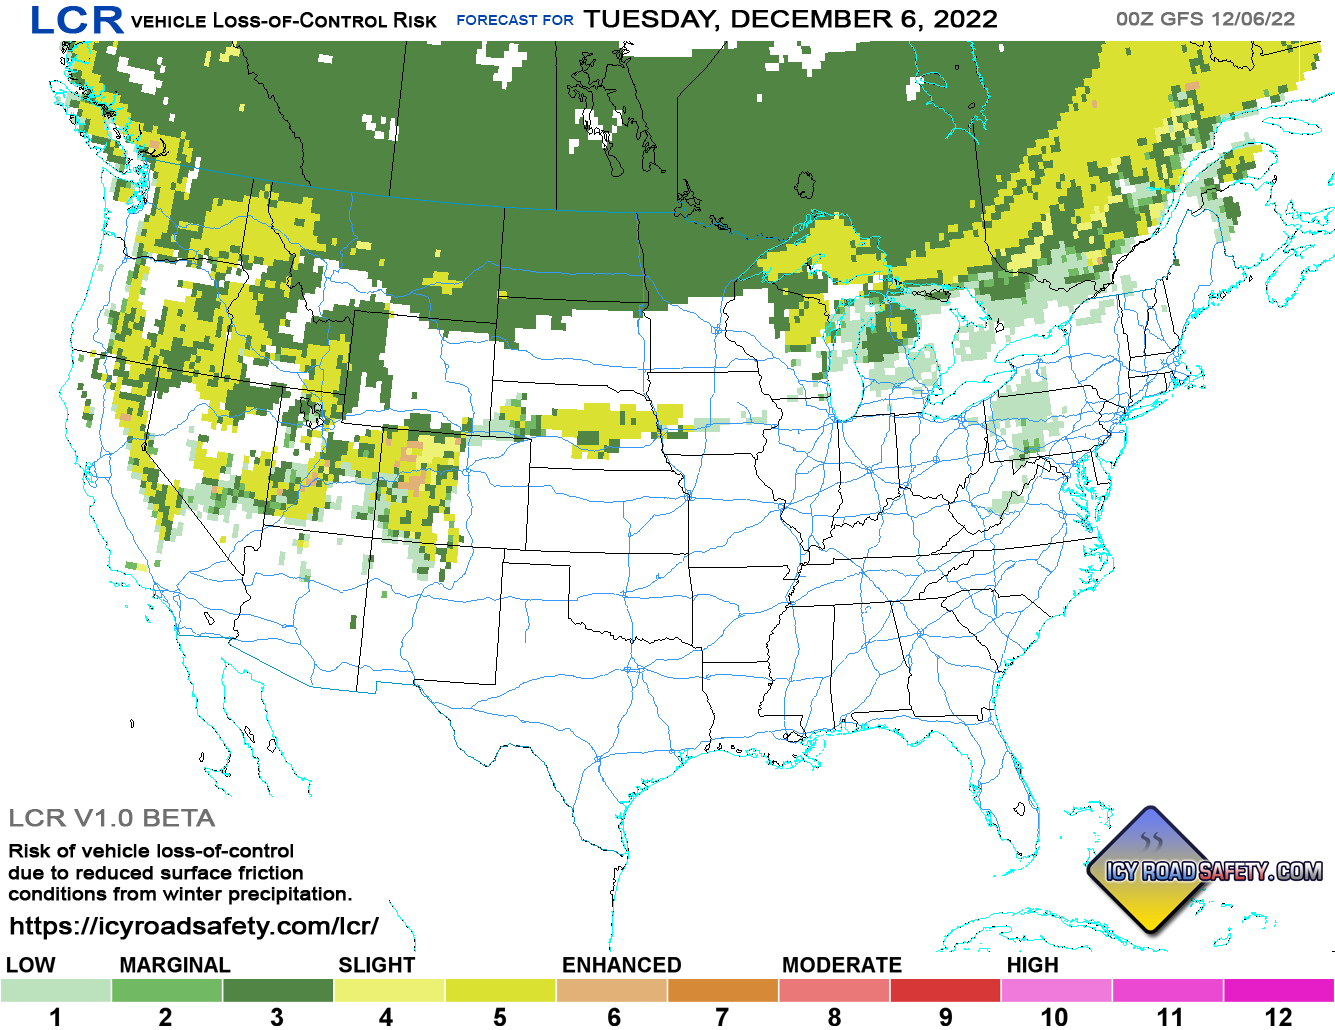
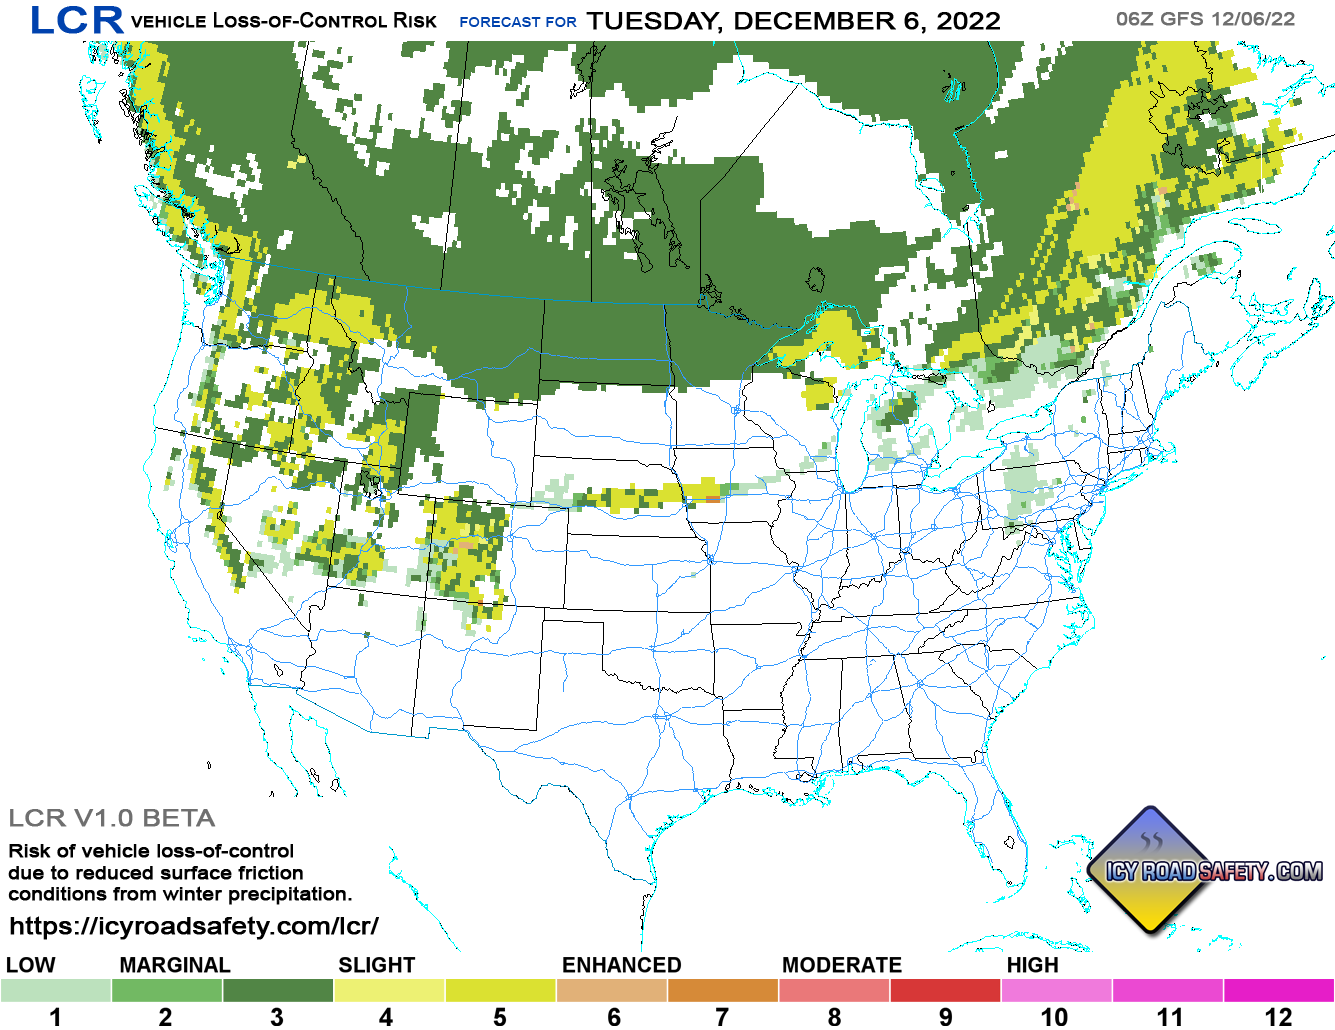
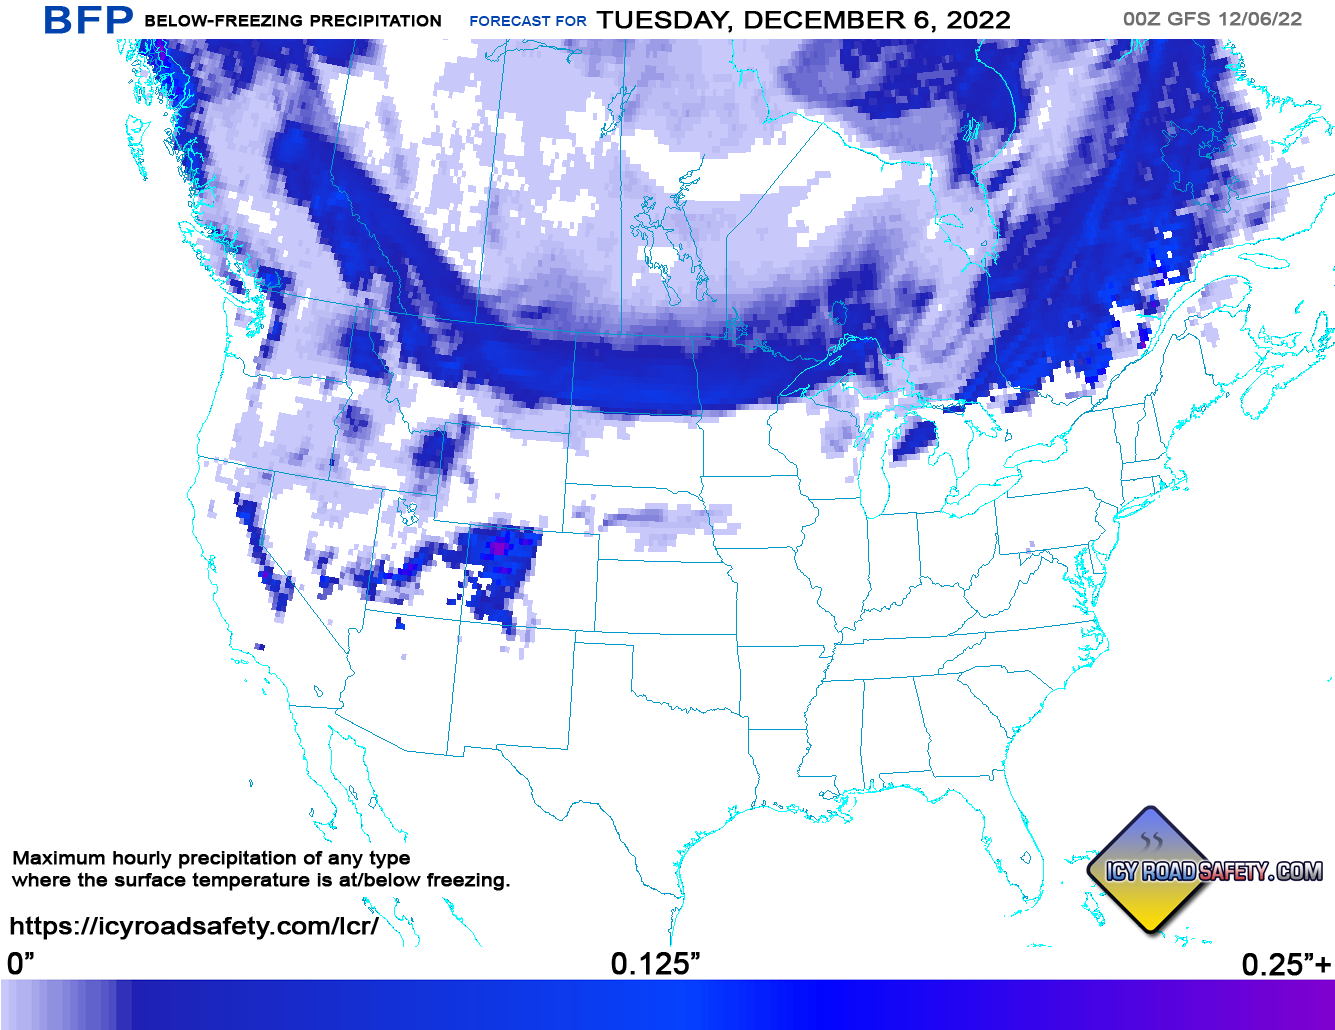
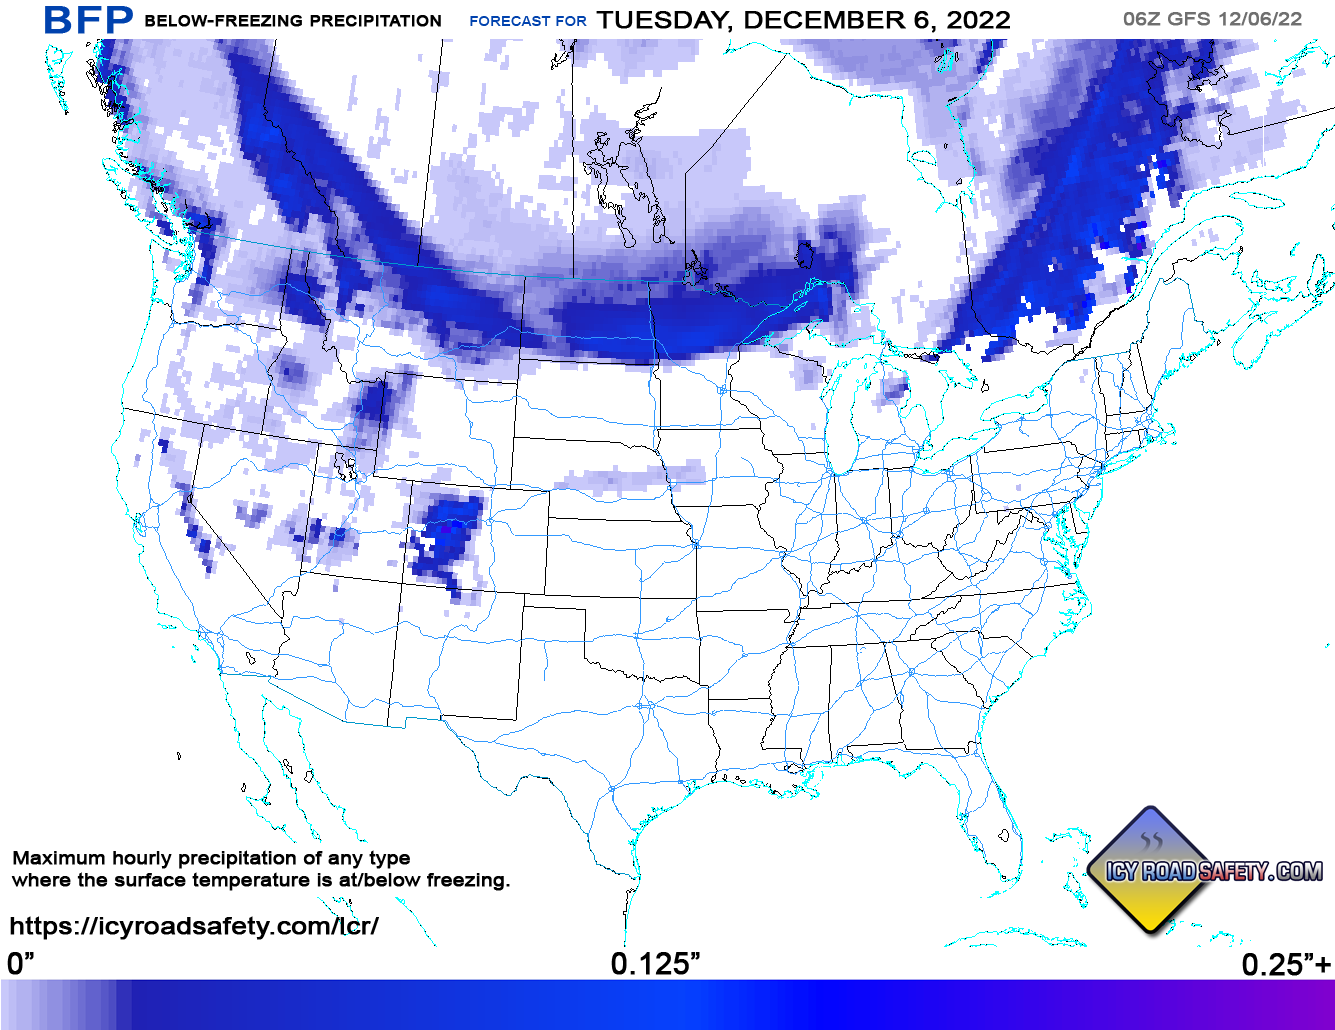
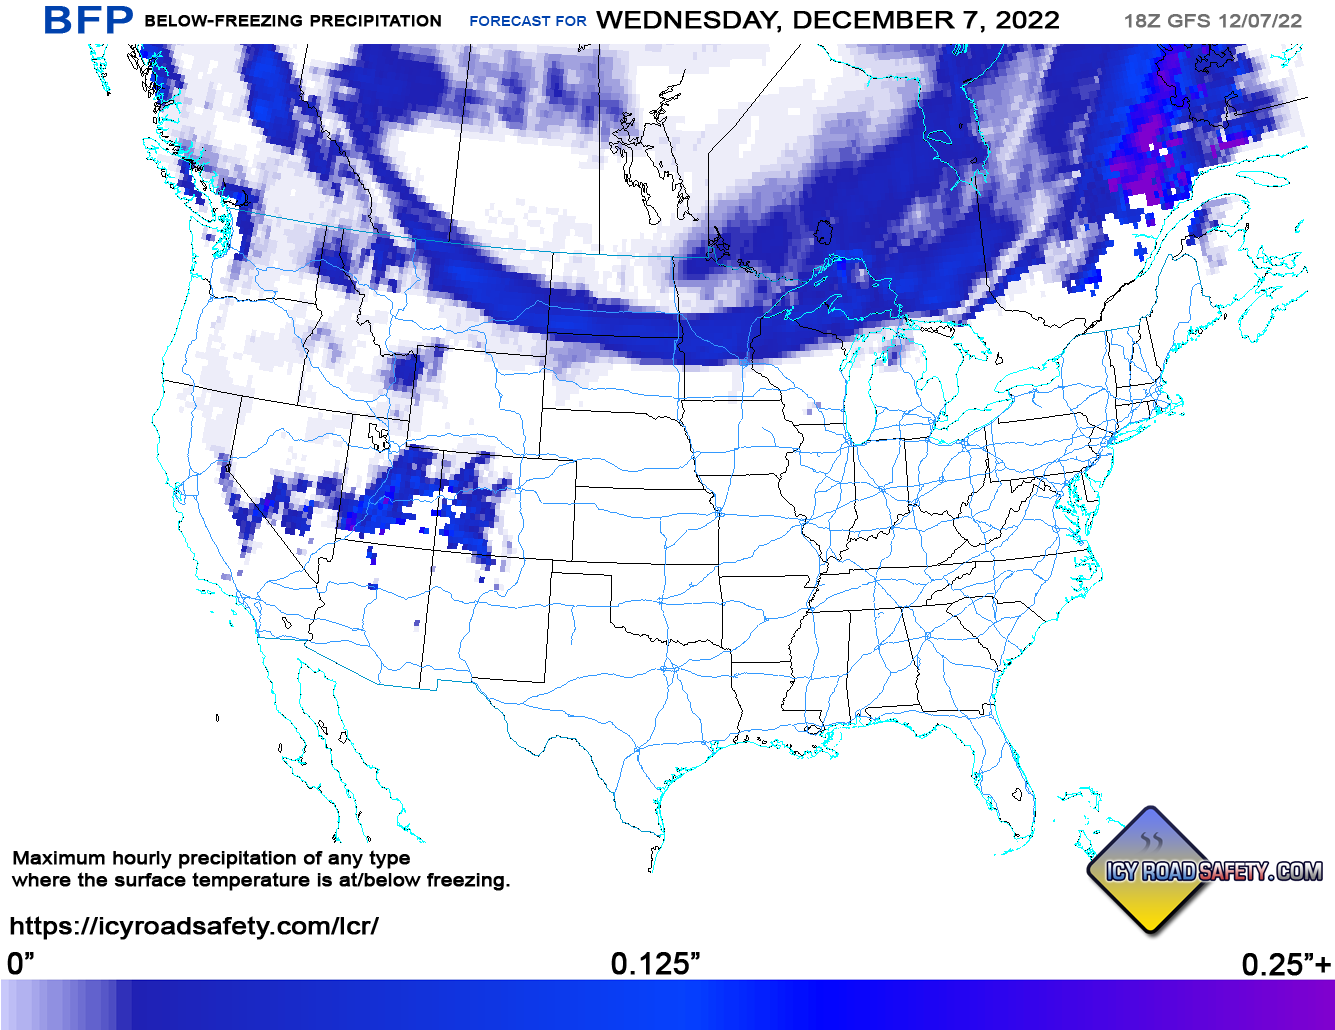
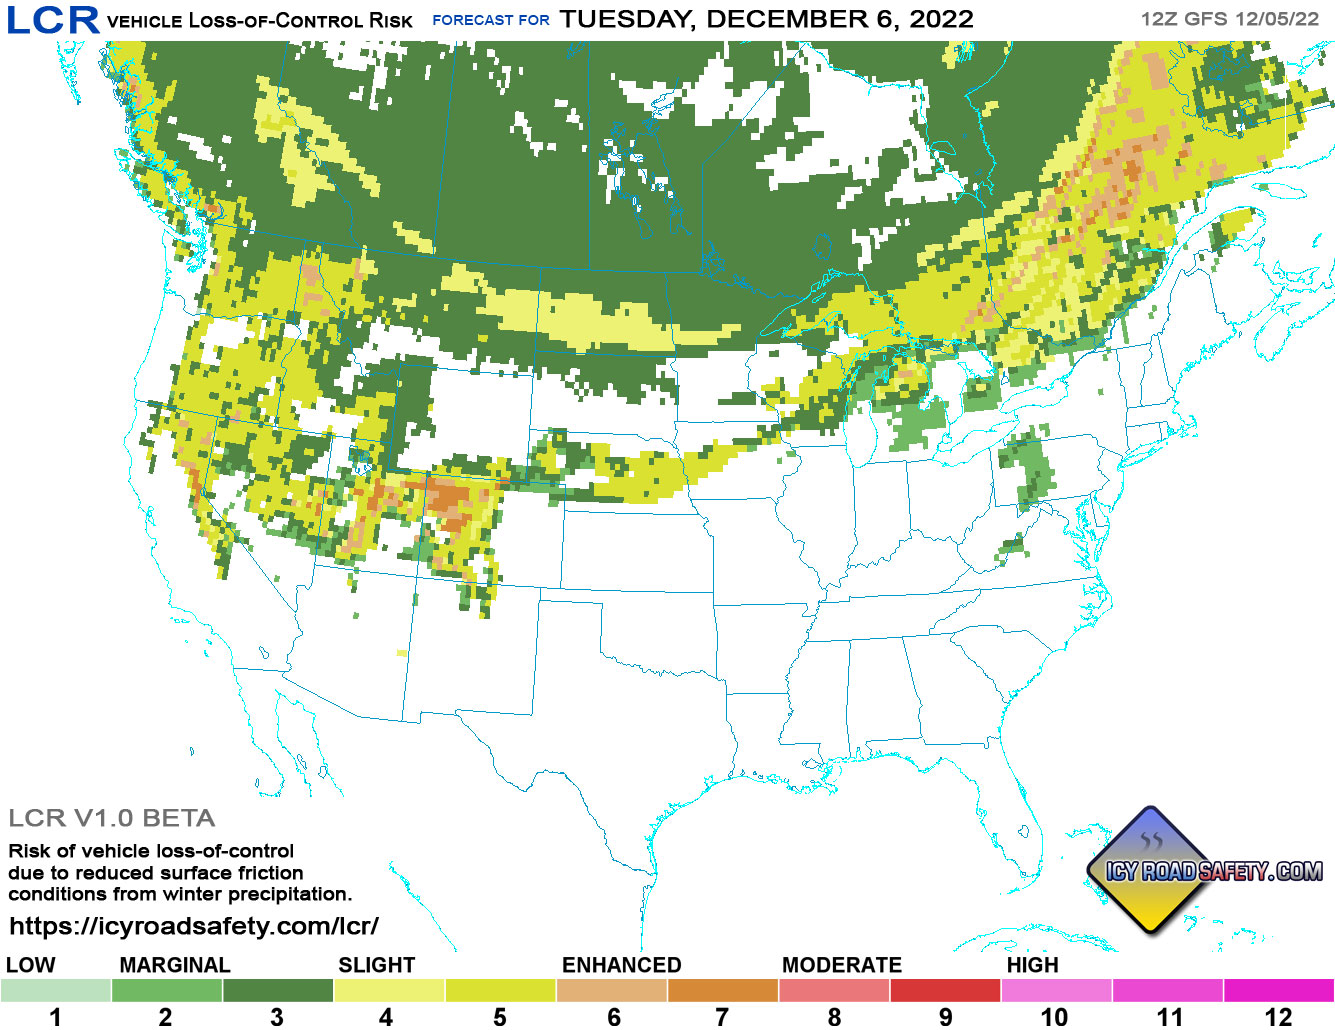
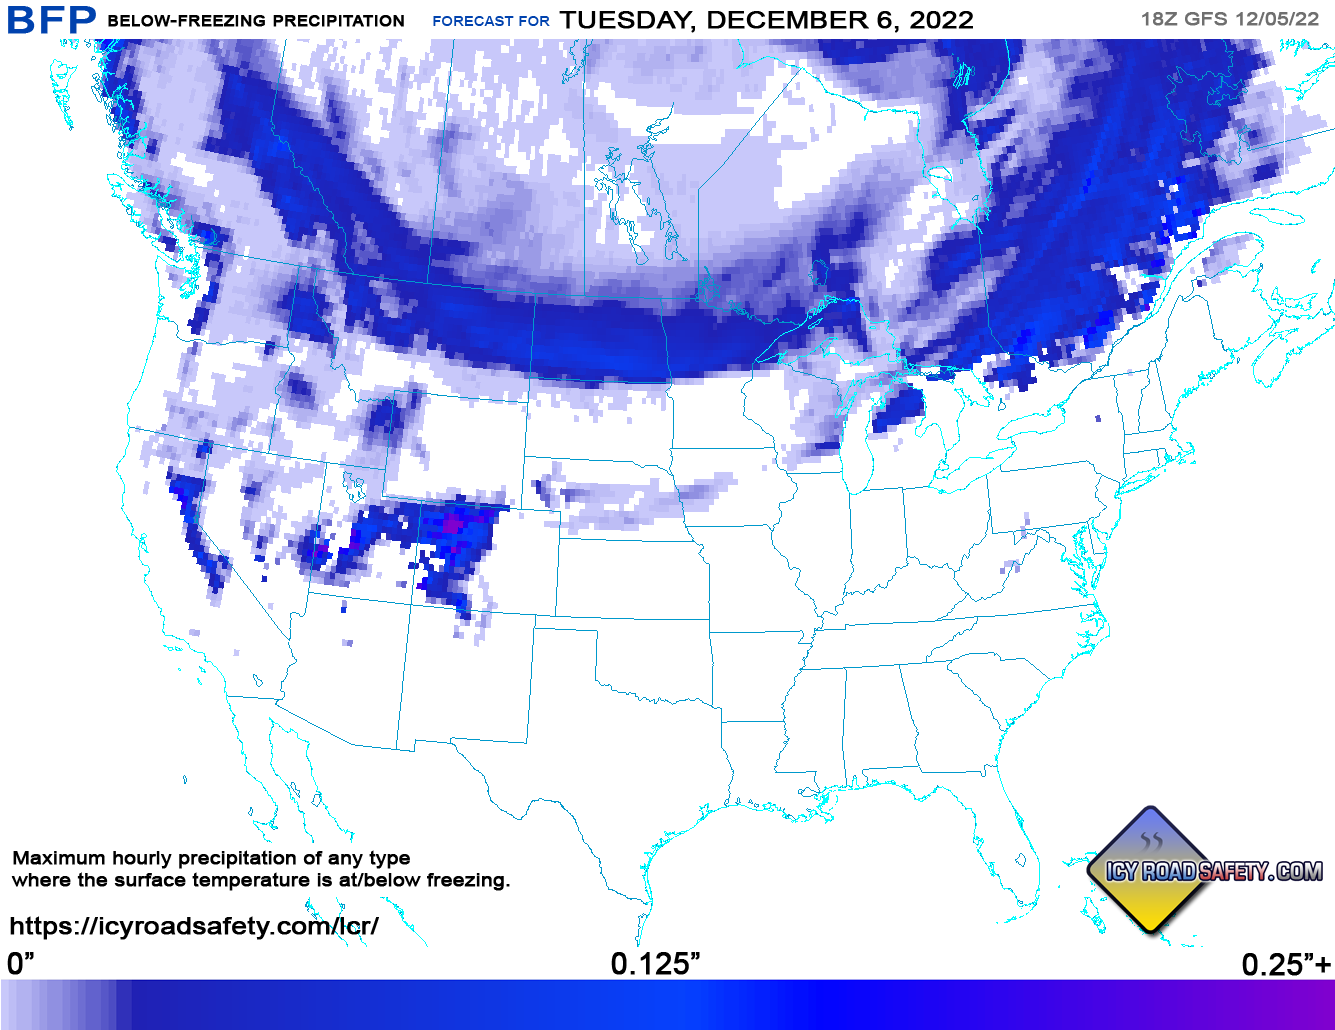
Unless otherwise noted, all charts are Day 1 forecasts that plot the maximum LCR and BFP values for all gridpoints over the first 24-hour period beginning at the model's initialization time. Day 2 charts plot maximum values over the 24-hour period from model hour 24 to hour 48.


