LCR (vehicle Loss-of-Control Risk): A new winter weather parameter and scale (v1.2.2)
 |
By DAN ROBINSON
Editor/Photographer |
|
The LCR scale is a tool for classifying, forecasting and warning the public about hazardous winter driving events. The value of the 15-point scale is calculated from observed or numerical model-derived meteorological data. Charts of LCR values can be plotted from either realtime or model data, allowing quick identification of geographical areas posing the highest risks to drivers. The LCR Scale is a nonprofit project, and the script/code is open source, released under a GPLv3 license.
DISCLAIMER: The LCR project is currently experimental, is independently produced, and is not affiliated with or endorsed by any official government agency, NOAA or the National Weather Service.
View Current Forecast Charts on the New LCR Server Dashboard >
Table of Contents
Example LCR Forecast Charts
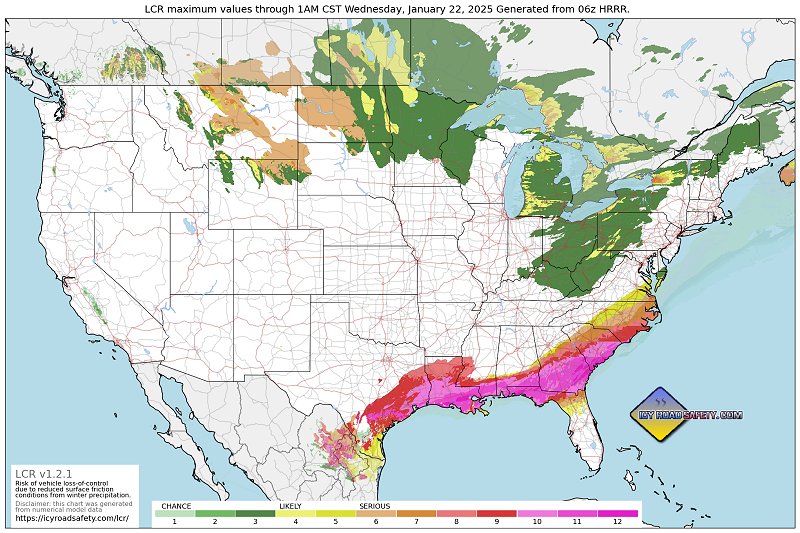
LCR chart for January 4, 2025 freezing rain event in the Great Plains and Midwest:

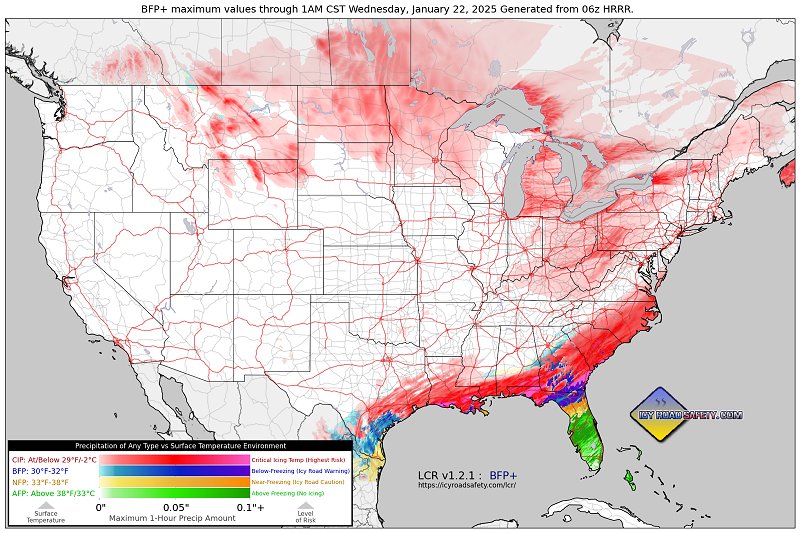
LCR chart for January 21, 2025 historic winter storm along the Gulf coast and Florida:
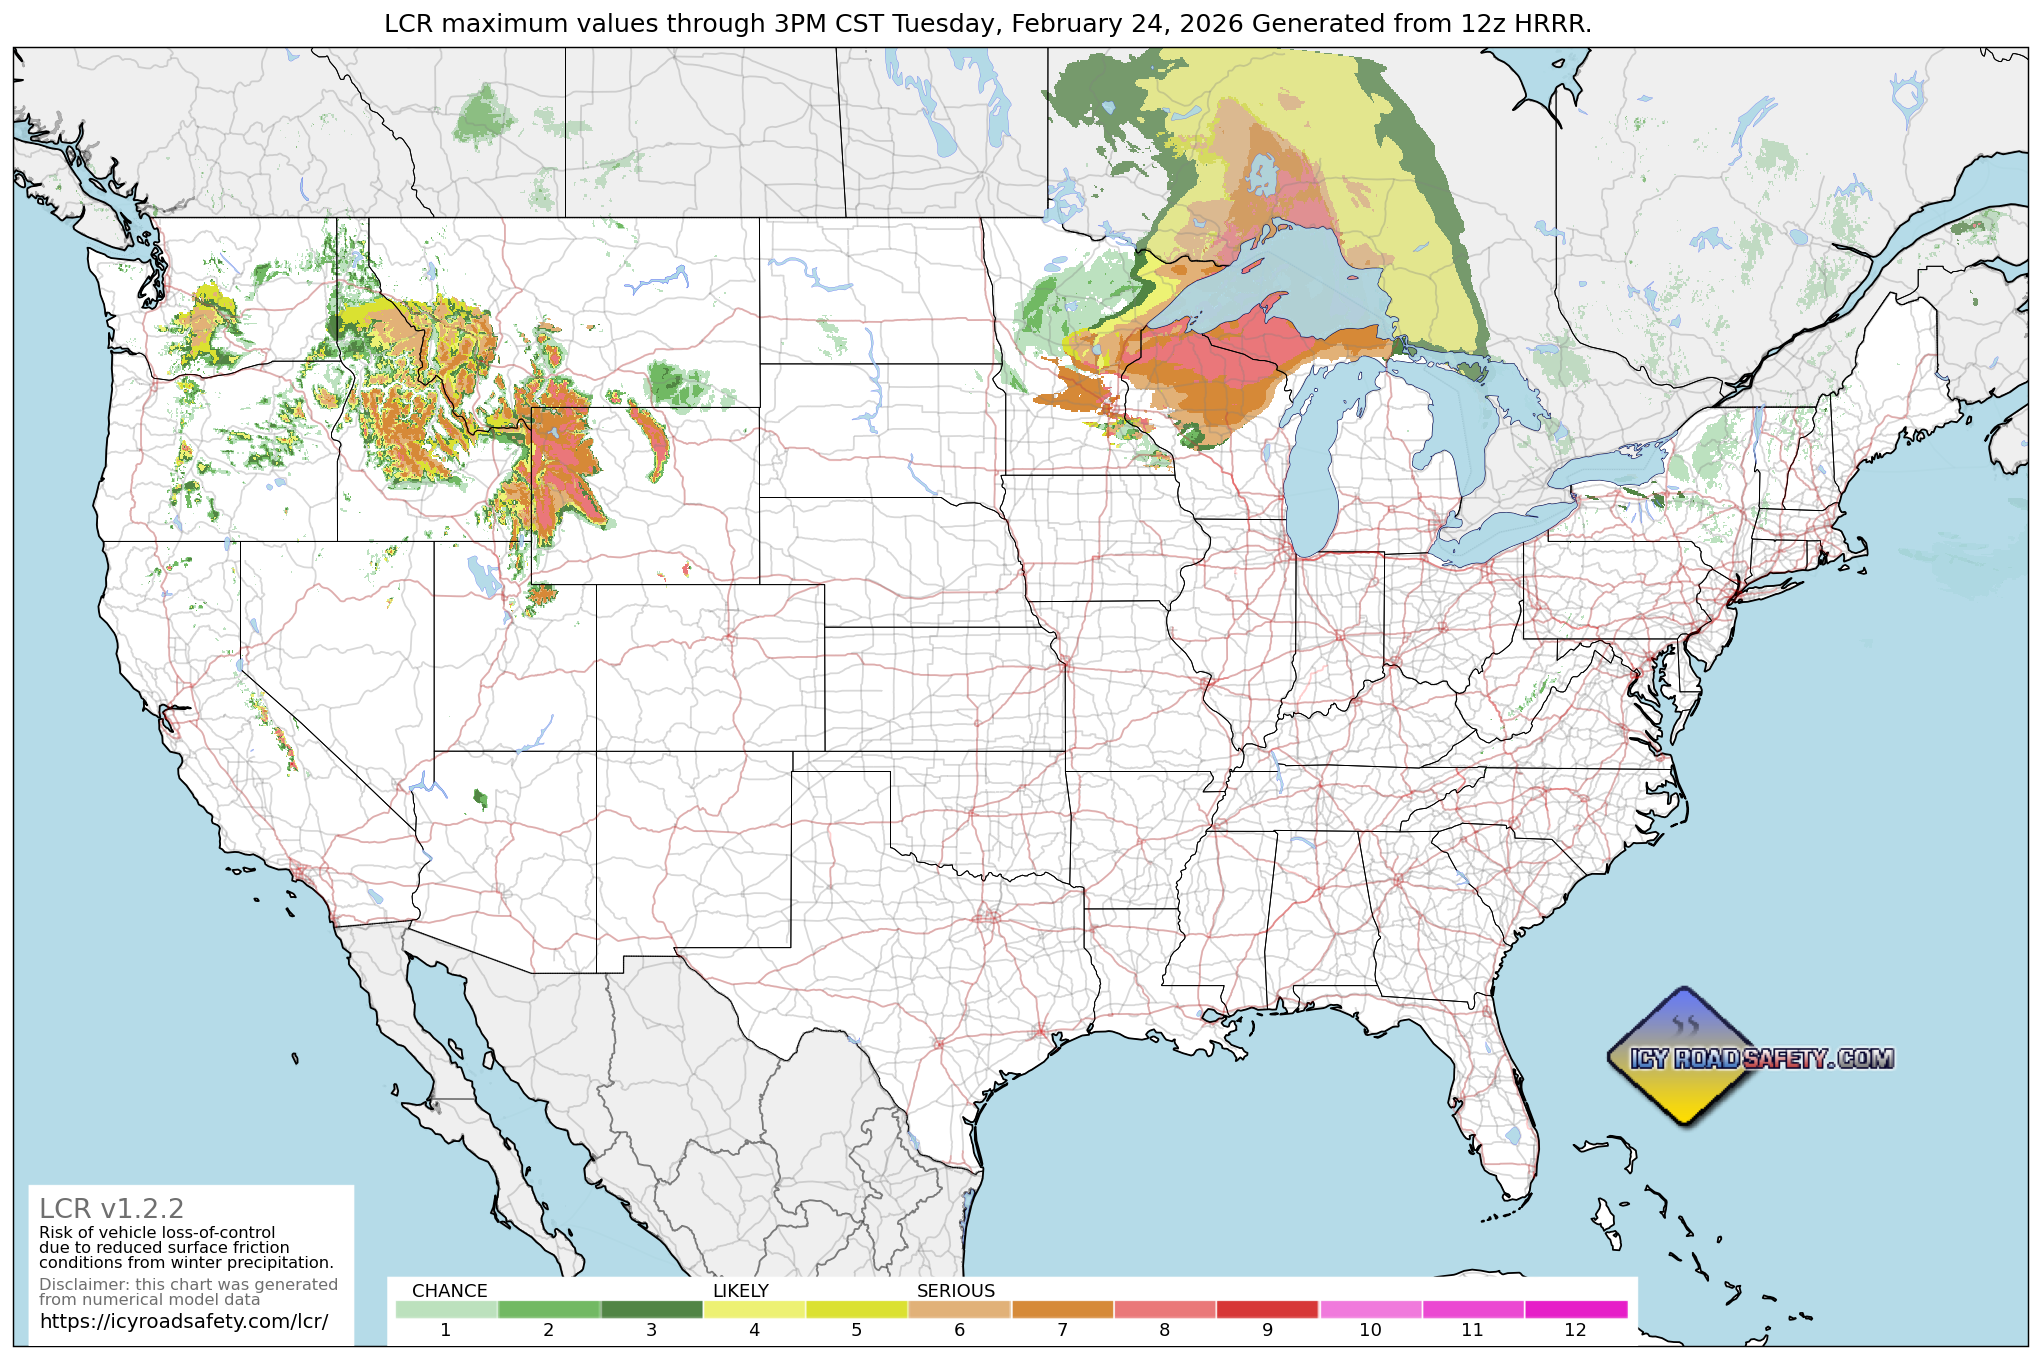
Latest LCR Forecast Chart
|
|
Video Presentation
 Purpose Purpose
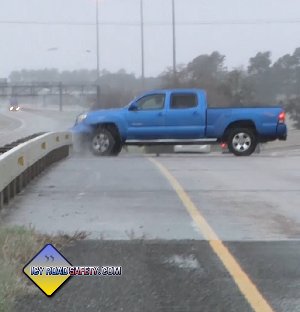
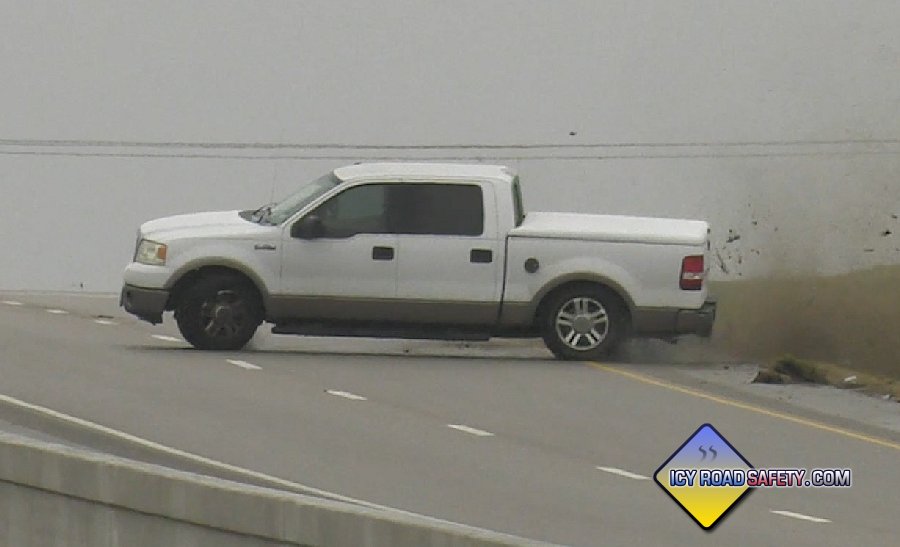
LCR is designed to display the risk of a motor vehicle encountering a hazardous (reduced road surface friction) condition that can lead to a loss of control incident. Higher LCR values indicate a greater risk to a driver, as well as a corresponding increase in the following human impacts:
- Number of accidents
- Number of injuries
- Number of fatalities
- Demand on police/fire/EMS first responders
- Road closures/restrictions
- Property damage losses
- Demand on towing services
- Shipping and commerce impacts
Justification
The forecasting and warning of winter storm hazards has traditionally been based on the total precipitation amounts expected during the event. Accordingly, most National Weather Service watch and warning criteria are based on QPF thresholds being met. However, research increasingly shows that the highest number of vehicle loss-of-control incidents and corresponding injuries, deaths and property damage occur in events that don't meet warning or advisory criteria (for example, in less than 2" of snow).
The majority of hazardous road conditions develop when any type of precipitation falls with a surface temperature at or below the freezing point (32°F / 0°C). There are additional meteorological factors that can increase the risk from this base condition.
A way to visualize this condition has not previously existed in publicly-available forecast tools. For example, discerning the simple condition where precipitation is falling at below-freezing surface temperatures has involved toggling back and forth between QPF (precipitation) and 2m temperature charts:
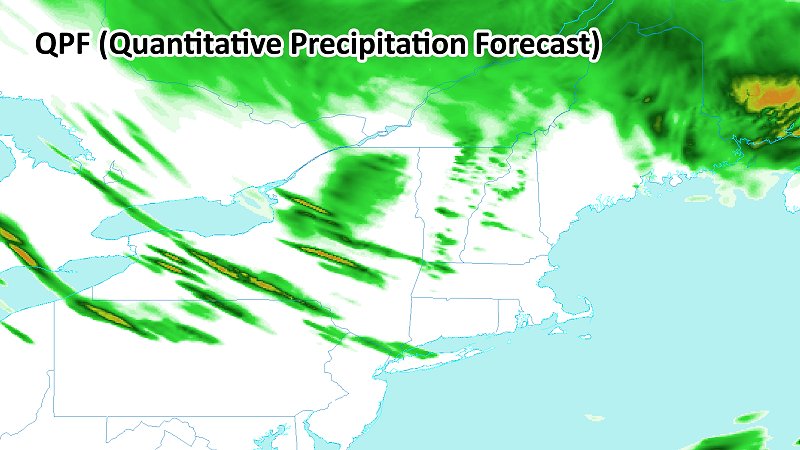
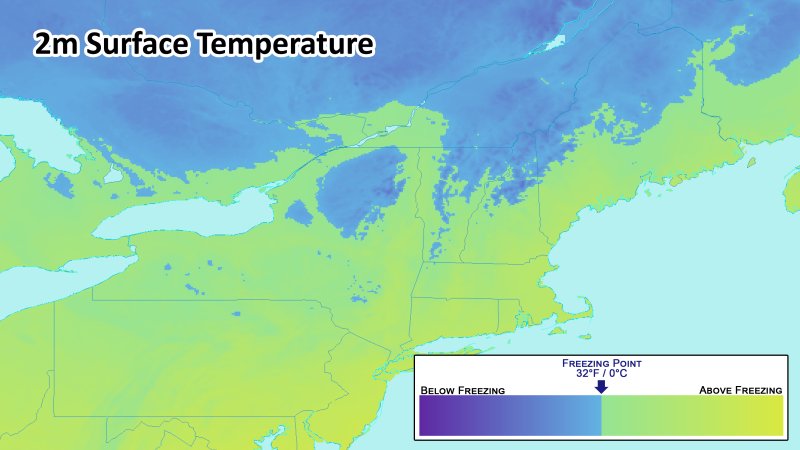
ABOVE: Icy roads are a risk where precipitation overlaps with subfreezing surface temperatures. The forecaster must toggle back and forth between QPF and 2-meter surface temperature charts to attempt to visualize where that overlap is occurring.
Even snowfall charts do not provide this visualization, as many light snow events have large areas where the precipitation is falling into above-freezing temperatures:
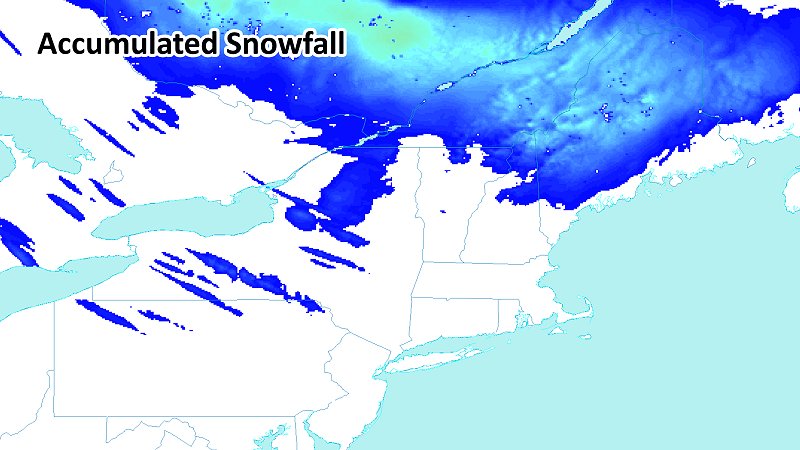
ABOVE: Snow accumulation or snow precipitation type charts do not show the QPF/freezing temperature overlap. Snow often falls into surface temperatures both above and below freezing, and these conditions are not revealed by the snow accumulation charts alone.
The BFP (below-freezing precipitation) chart, the precursor to LCR, was developed to show the precip-freezing temperature overlap:
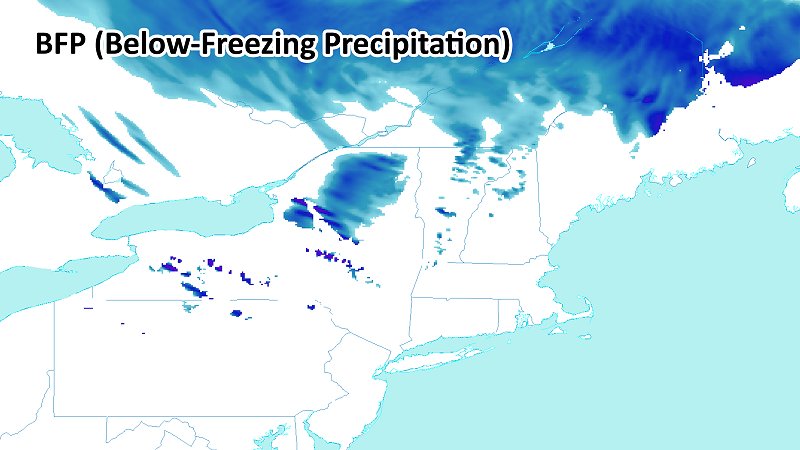
ABOVE: Simple BFP (below-freezing precipitation) chart for the same time as the examples above.
The BFP chart simply showed only the QPF that was occurring at temperatures at or below freezing, visualizing the overlap of these two fundamental ingredients. BFP+ charts show all QPF with three additional temperature categories, each with thier own color scales:
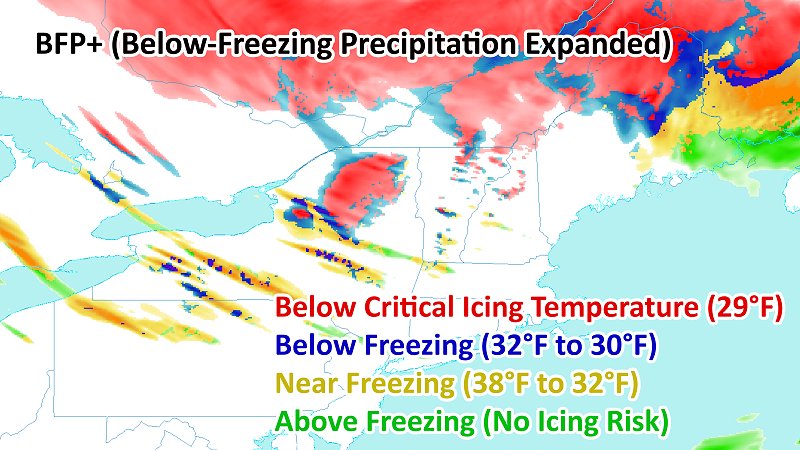
ABOVE: BFP+ chart for the same time as the examples above.
LCR expands on the basic BFP chart, consolidating all of the meteorological factors that produce and increase the hazardous road condition risk into a single, easy-to-understand parameter:
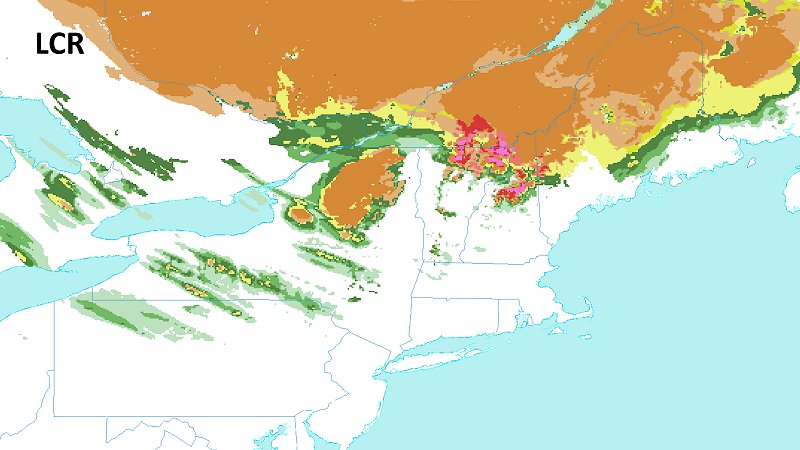
ABOVE: LCR chart for the same time as the previous examples.
It is intended for LCR to be a complement, not a replacement, for other winter weather hazard assessment tools. The Winter Storm Severity Index, for example, is a product that consolidates ALL winter weather hazards such as extreme temperatures, travel impacts, property damage and power outages. LCR is a product that is focused solely on the danger to drivers losing control from a significant reduction in road surface friction. Applications
- LCR charts can be generated from realtime meteorological data
- LCR forecast charts can be generated from numerical model data
- LCR can be easily manually calculated for any in-progress event at a given location
- LCR can be manually calculated for past events at a given location
- LCR charts for past events can be generated from meteorological data archives
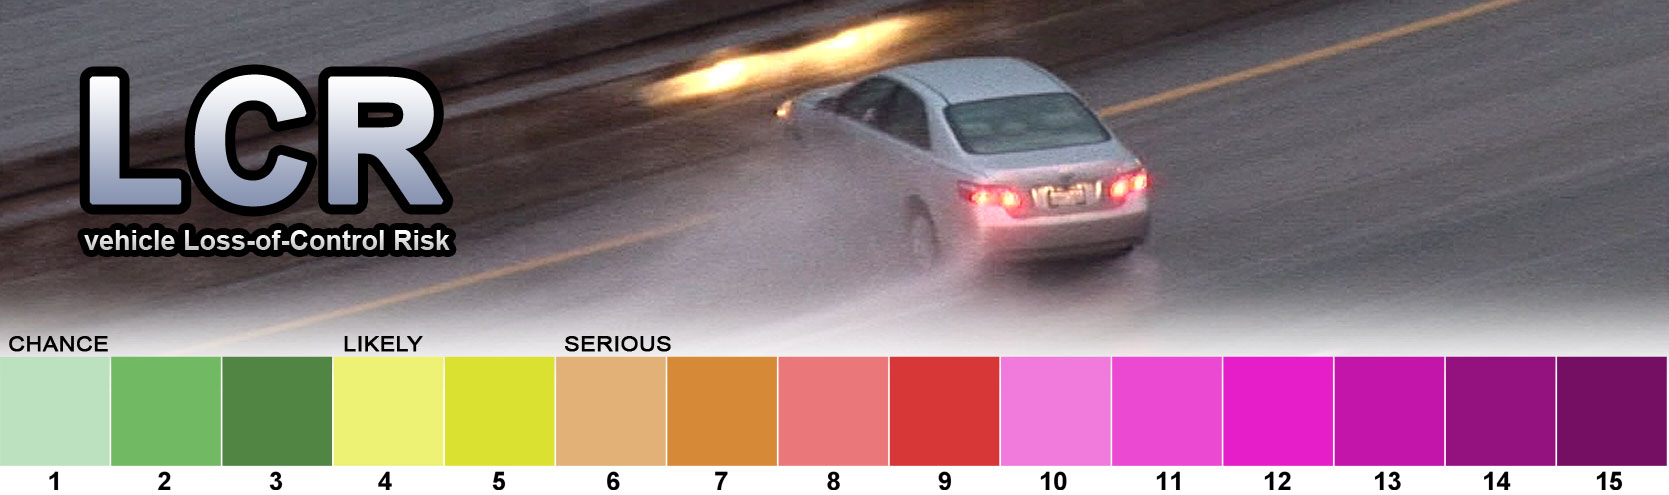
LCR Scale and approximate human impacts (v1.2.2)
| Chance |
1 |
Isolated incidents, mainly involving vehicles traveling at speeds faster than 65mph. |
| 2 |
Scattered incidents, mainly involving vehicles traveling at speeds faster than 65mph. Isolated injury crashes. |
| 3 |
| Likely |
4 |
Elevated number of incidents, mainly involving vehicles traveling at speeds faster than 55mph. Scattered injury crashes. |
| 5 |
| Serious |
6 |
Numerous incidents, mainly involving vehicles traveling at speeds faster than 45mph. Some localized EMS/first responder strain. Multiple injuries. Isolated fatalities. |
| 7 |
| Serious |
8 |
Numerous incidents. Isolated multi-vehicle pileups. Multiple road closures. Regional EMS/first responder strain. Numerous injuries, multiple fatalities. Towing bans placed in effect. |
| 9 |
| 10 |
Widespread incidents. Major multi-vehicle pileups. Widespread road closures. EMS/first responders overwhelmed. Numerous injuries and fatalities. Travelers stranded. Shipping, commerce and other economic impacts. Towing bans placed in effect. |
| 11 |
| 12 |
| 13 |
| 14 |
| 15-17 |
|
Methodology
LCR is calculated using a series of conditional statements that apply pre-set values in a cumulative (additive) fashion. LCR is intended to be an hourly value for a given location. 6, 12 and 24-hour period LCR maximum charts can also be derived from the hourly values.
Prerequesite data
LCR requires the following data for each gridpoint (latitude/longitude):
For numerical model data forecast charts:
- 2m temperature
- 2m dewpoint
- 2m relative humidity
- 6-hour 2m temperature history
- Hourly QPF
- Hourly QPF (freezing rain/drizzle)
- Surface categorical snow
- Surface categorical freezing rain
- Average cloud cover
- Surface wind gust velocity
For realtime analysis:
- Latitude/longitude
- ASOS or AWOS observations of:
- 2m temperature
- 6-hour 2m temperature history
- 2m dewpoint
- 2m relative humidity
- Precipitation rate/type
- NWS-issued winter watch/warning/advisory in effect (yes/no):
- winter weather advisory
- winter storm watch
- winter storm warning
- freezing rain advisory
- freezing fog advisory
- ice storm warning
- blizzard warning
- snow squall warning
The LCR script code contains a function to calulate the 2m wet bulb temperature with a standard formula using 2m temperature, 2m dewpoint and 2m surface pressure.
Base LCR (v1.2.2)
Non-activated gridpoints have a LCR value of zero (0). LCR is activated at a gridpoint where precipitation of any type (hourly QPF above zero) is falling where both of the following conditions are present:
- 2m temperature at or below 38°F (if precip type is snow) 36°F (all other precip types) AND
- 2m wet bulb temperature at or below 36°F (if precip type is snow) 34°F (all other precip types)
If the above conditions are met for a gridpoint, the base LCR value is set as follows:
- For hourly liquid-equivalent QPF of more than 0.003" and less than 0.05" (or netween 0.05" and 0.3" of snow) LCR is set to 1.
- For hourly liquid-equivalent QPF of more than 0.05" and less than 0.1" (or between 0.3" and 0.8" of snow), LCR is set to 2.
- For hourly liquid-equivalent QPF of more than 0.1" and less than 0.25" (or between 0.8" and 1.5" of snow), LCR is set to 3.
- For hourly liquid-equivalent QPF of 0.25" or more (or 1.5" of snow or above), LCR is set to 4.
For realtime LCR analysis, if ASOS/AWOS observations indicate:
- Light precipitation, LCR is set to 1.
- Moderate precipitation, LCR is set to 2.
- Heavy precipitation, LCR is set to 3.
Factors that increase LCR (v1.2.2)
Each of the following condition factors, when true, add to the base LCR value. The script does not apply these factors if the base LCR is zero (a no-QPF condition).
- Below-freezing factor: If the 2m temperature is at or below freezing (32.9°F), the gridpoint's LCR value is increased by 1. Justification: Well-bonded ice layer begins forming on road surfaces when temperatures fall below freezing.
- Below-freezing temperature history factor: If the average 2m temperature of the previous 6 hours is below freezing, the gridpoint's LCR value is increased by 1. Justification: A longer period of below-freezing temperatures allows road surfaces to cool enough to support the efficient development of hazardous conditions.
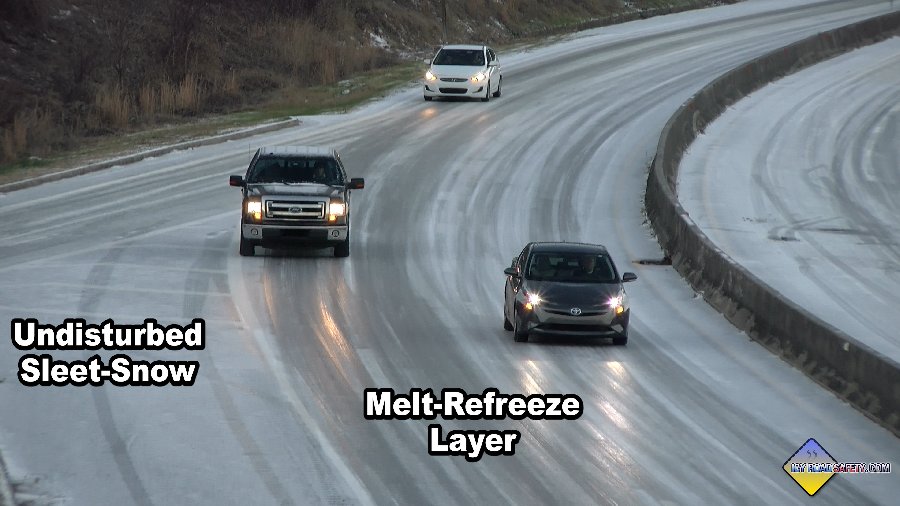
- Critical Icing Temperature factor: If the 2m temperature is between 20°F and 29.9°F, the gridpoint's LCR value is increased by 2. Justification: It has been consistently observed that road conditions worsen dramatically once temperatures fall to 29°F. A more solid bonding of an ice layer to a road surface occurs during temperatures below 29°F. With temperatures between 20°F and 29°F, vehicle traffic introduces a melting-refreezing cycle of falling/fallen precipitation on a road surface. The result is a uniform, well-bonded ice layer that is significantly more hazardous to drivers. NOTE: the 20°F lower bound is not used if the precipitation type is freezing rain.
- Freezing rain/freezing drizzle factor: If the precipitation type is freezing rain or freezing drizzle, the gridpoint's LCR value is increased by 2. Justification: Freezing rain and freezing drizzle produce a treacherous road surface lacking in visual cues for drivers.
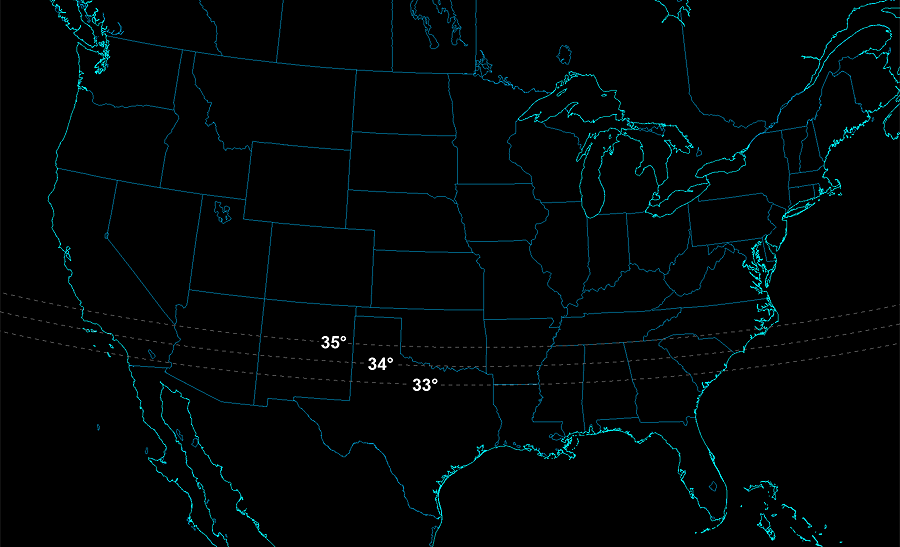
- Regional de-icing capacity factor: If the gridpoint's location is at or south of the 35° latitude, the LCR value is increased by 1. If the gridpoint's location is at or south of the 34° latitude, the LCR value is increased by 2. If the gridpoint's location is at or south of the 33° latitude, the LCR value is increased by 3. Justification: Due to the relative infrequency of winter precipitation with southward extent in the southern third of the USA, de-icing capacity is significantly decreased in these regions. These regions with reduced de-icing capacity suffer the greatest and most widespread hazardous conditions during subfreezing precipitation. The driving public in these regions is also much less experienced with hazardous winter driving conditions.
- Surprise event factor (realtime analysis only): If the gridpoint's location has not been under an active winter weather watch/warning/advisory for at least 3 hours, the gridpoint's LCR value is increased by 3. Justification: Short-fuse "surprise" events suffer from fewer available de-icing crews and equipment, resulting in greater and more widespread hazardous conditions as well as reduced preparedness from the public. This factor is not applied to LCR forecast charts derived from model data, therefore model charts will have a maximum LCR value of 12.
- Wind factor: If the maximum surface wind gusts are over 20mph and LCR is 5 or greater (after all other factors have been applied), LCR is increased by 1. Justification: during the more treacherous icing conditions, wind gusts alone can trigger loss of control by pushing vehicles laterally. Higher-profile vehicles like tractor-trailers, box trucks, vans, buses, RVs and vehicles with trailers are the most susceptible.
Freezing fog is indicated when QPF is zero (LCR-zero condition), 2m temperature is at or below 32.9°F and 2m relative humidity is 90 percent or greater. Freezing fog LCR values are not applied if QPF is greater than zero (the main LCR calculation assigns LCR values if QPF is present). At this time, the Regional de-icing capacity factor and Pre-existing winter weather watch/warning/advisory factor are not applied to a freezing fog LCR value.
Numerical models:
- For 2m RH at or greater than 90% and temperature at or below 32.9°F, LCR is set to 1.
- For 2m RH at or greater than 93% and temperature at or below 29°F, LCR is set to 2.
- For 2m RH at or greater than 97% and temperature at or below 32.9°F, LCR is set to 2.
- For 2m RH at or greater than 96% and temperature at or below 29°F, LCR is set to 3.
- For 2m RH at or greater than 98% and temperature at or below 27°F, LCR is set to 4.
Realtime analysis: ASOS/AWOS reporting heavy fog or freezing fog and:
- the temperature is at or below 31°F and relative humidity is 90% or above, LCR is set to 1.
- the temperature is at or below 29°F and relative humidity is 93% or above, LCR is set to 2.
- the temperature is at or below 27°F and relative humidity is 96% or above, LCR is set to 3.
- the temperature is at or below 27°F and relative humidity is 98% or above, LCR is set to 4.
The maximum LCR value is 17, which would occur during the following conditions:
- 0.25" or greater of freezing rain in one hour
- 6-hour average 2m temperature below freezing
- 2m temperature between 20°F and 29°F
- Surface wind gusting to greater than 20mph
- Occurring at or south of the 33° latitude (as in the far southern US)
- Surprise event (No NWS winter watch, warning or advisory in effect for at least 3 hours)
The color/impact scale maxes out at LCR-15. Charts plot LCR-16 and LCR-17 values at the same color as LCR-15. Since model forecast charts do not incorporate the "pre-existing NWS watch/warning/advisory in effect" factor, the maximum possible LCR value on model charts is 14 (which would occur during the same set of above conditions).
LCR values for select past events
- February 11, 2021 - Fort Worth, Texas: LCR = 10
- December 16, 2016 - St. Louis, MO: LCR = 10
- February 15, 2021 - Houston, Texas: LCR = 10
- January 6, 2017 - Birmingham, AL: LCR = 10
- January 18, 2015 - New Brunswick, NJ: LCR = 9
- November 27, 2021 - Dubuque, IA: LCR = 8
- November 1, 2021 - North Platte, NE: LCR = 4
Summary of LCR calculation (v1.2.2)
At a gridpoint, LCR is zero unless all of the following conditions are true:
- 2m temperature at or below 38°F (if precip type is snow) 36°F (all other precip types)
- 2m wet bulb temperature at or below 36°F (if precip type is snow) 34°F (all other precip types)
- Precipitation of any type (QPF) is greater than zero
If those conditions are true for a gridpoint, then LCR is:
| Base LCR |
| Hourly liquid-equivalent QPF |
Hourly snowfall (Kuchera or asnowsfc) |
LCR Base Value |
| Greater than 0.003" and less than 0.05" |
Greater than 0.05" and less than 0.3" |
1 |
| Equal to or greater than than 0.05" and less than 0.1" |
Equal to or greater than than 0.4" and less than 0.8" |
2 |
| Equal to or greater than 0.1" and less than 0.25" |
Equal to or greater than 0.8" and less than 1.5" |
3 |
| 0.25" or more |
1.5" or more |
4 |
| Freezing fog-based LCR assignment if no QPF is present |
2m RH |
2m Temp |
LCR Value |
| At or greater than 90% |
At or below 32.9°F |
1 |
| At or greater than 93% |
At or below 29°F |
2 |
| At or greater than 97% |
At or below 32.9°F |
2 |
| At or greater than 96% |
At or below 29°F |
3 |
| At or greater than 98% |
At or below 27°F |
4 |
| LCR Increments |
| Condition |
increases LCR by |
| 2m temperature at/below freezing (32.9°F) |
1 |
| Average of 2m temperatures over past 6 hours is below freezing |
1 |
| 2m temperature between 20°F and 29.9°F |
2 |
| Ptype is freezing rain or freezing drizzle |
2 |
Location with reduced deicing capability:
At/south of 35° latitude: +1
At/south of 34° latitude: +2
At/south of 33° latitude: +3 |
1,2 or 3 |
Surprise event - No NWS advisory or warning in effect for 3 hours
(not used in model forecasts of LCR) |
3 |
| Surface wind gusts are greater than 20mph |
1 |
| LCR Limit Factors |
| Cloud cover is less than 10 percent (clear skies) |
LCR limited to 3 |
| Ptype is snow in central/northern USA, wind gusts lower than 20mph |
LCR limited to 7 |
|
Color scale values (v1.2.2)
| LCR |
Hex |
RGB |
| 1 |
BCE1BF |
188,225,191 |
| 2 |
71B963 |
113,185,99 |
| 3 |
518543 |
81,133,67 |
| 4 |
EDF274 |
237,242,116 |
| 5 |
DAE131 |
218,225,49 |
| 6 |
E2B177 |
226,177,119 |
| 7 |
D68937 |
214,137,55 |
| 8 |
EA777A |
234,119,122 |
| 9 |
D73737 |
215,55,55 |
| 10 |
F17BDC |
241,123,220 |
| 11 |
EB49D2 |
235,73,210 |
| 12 |
E61EC9 |
230,30,201 |
| 13 |
C315AA |
195,21,170 |
| 14 |
94127F |
148,18,127 |
| 15 |
740e64 |
116,14,100 |
BFP and BFP+ (Below-Freezing Precipitation)
The LCR script also generates the BFP+ data set, which allow the creation of QPF (liquid-equivalent precip) charts color-coded for the surface temperature environment. BFP stands for Below-Freezing Precipitation, which is a parameter showing the amount of precipitation (QPF) of any type occurring only where 2-meter temperatures are at or below freezing. These two ingredients are the basic conditions present during the vast majority of hazardous winter road conditions.
BFP Plus is an enhancement of BFP that includes three additional data sets: NFP (Near-Freezing Precipitation), AFP (Above-Freezing Precipitation) and CIP (Precipitation at/below Critical Icing Temperature). On a BFP+ chart, the BFP, NFP, AFP and CIP data sets are all plotted together to show the areas at risk of icy roads within the context of all areas of precipitation.
- CIP (Precipitation at/below Critical Icing Temperature): The amount of precipitation (QPF) of any type occurring where surface temperatures are at or below 29.9°F. This is the condition that produces the highest-impact icy road events. CIP areas are plotted on the BFP+ charts with a red gradient color scale. CIP represents a "enhanced warning" area for road icing. Drivers within CIP-shaded zones should expect hazardous road conditions, as the weather conditions are favorable for the rapid and efficient development of road icing during the time period represented on the chart.
- BFP (Below-Freezing Precipitation): The amount of precipitation (QPF) of any type occurring where surface temperatures are at or below freezing (32.9°F). This is the basic condition that produces the vast majority of high-impact icy roads. BFP areas are plotted on the BFP+ charts with a blue (turquiose-to-purple) gradient color scale. BFP represents a "warning" area for road icing. Drivers within BFP-shaded zones should be on high alert for hazardous road conditions, as the weather conditions are favorable for the development of road icing during the time period represented on the chart.
- NFP (Near-Freezing Precipitation): The amount of precipitation (QPF) of any type occurring where surface temperatures are between 32 and 38 degrees Fahrenheit. NFP areas are plotted on the BFP+ charts with an orange gradient color scale. NFP represents a "caution" or "watch" area for road icing during the time period represented on the chart. Drivers should be aware that conditions favorable for road icing could develop within NFP-shaded areas if temperatures fall more than expected and/or if the rate of sleet/snow falling is heavy enough. Essentially, NFP areas are close to, and can become, BFP areas. Drivers in mountainous terrain within NFP-shaded areas should remain vigilant for unexpected conditions with changes in elevation or when exiting tunnels.
- AFP (Above-Freezing Precipitation): The amount of precipitation (QPF) of any type occurring where surface temperatures are above 38 degrees Fahrenheit. AFP areas are plotted on the BFP+ charts with a green gradient color scale. AFP represents a "no high-impact road icing expected" area of precipitation during the time period represented on the chart. Drivers within AFP-shaded zones should exercise the normal cautions necessary for safe operation of a vehicle in rain and on wet roads. Be aware that hail can occur within AFP areas in thunderstorms. If heavy enough, hail is capable of accumulating on roads and creating a hazard even in an AFP area.
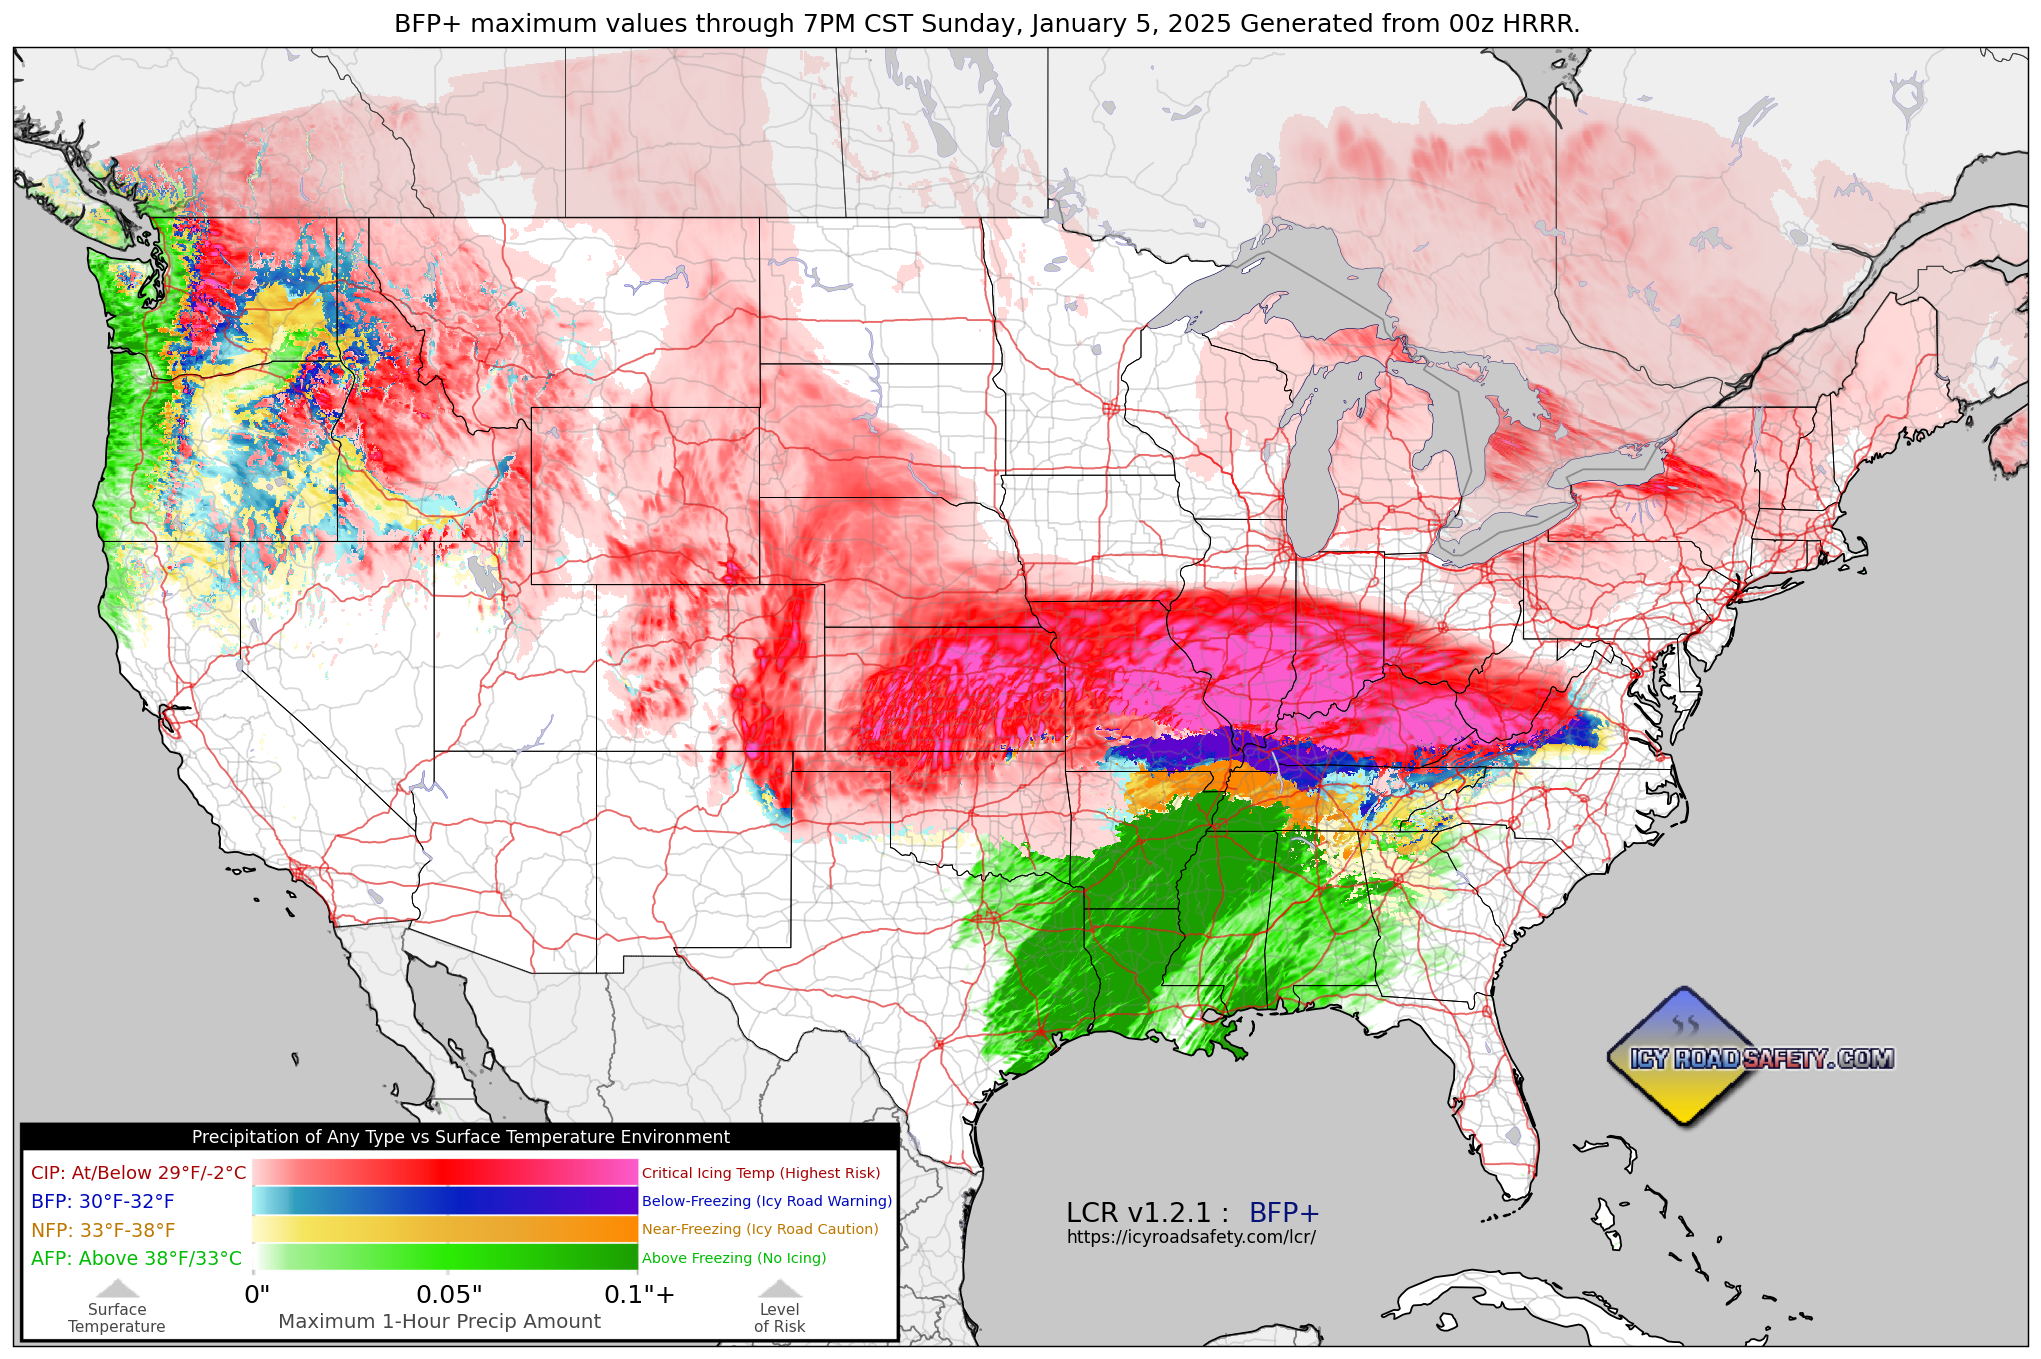
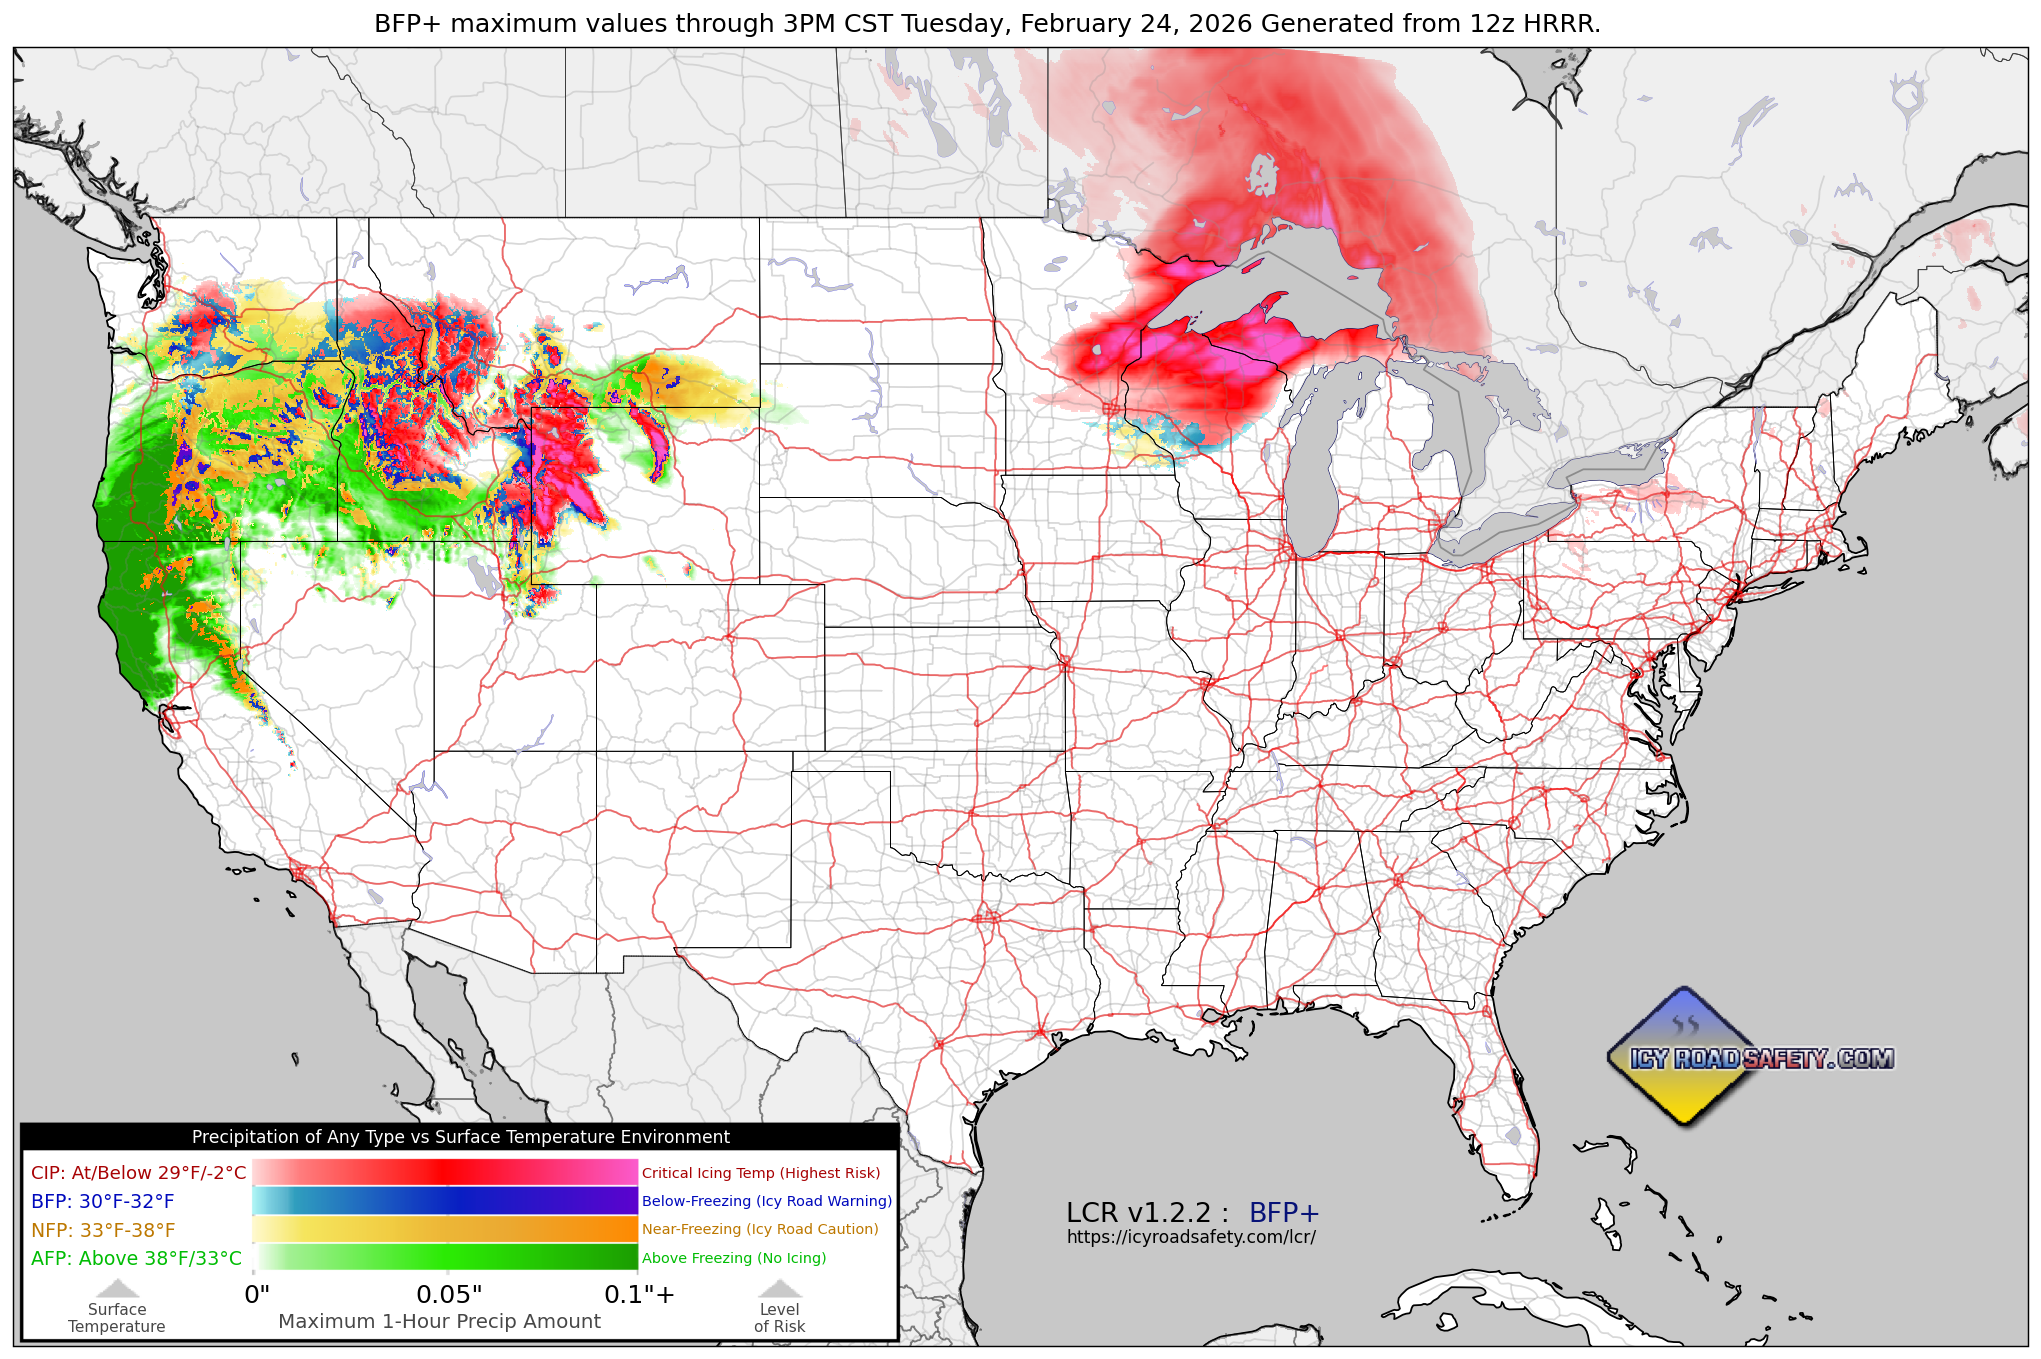
Below are examples of BFP+ charts. The sensitivity of the BFP and BFP+ chart color scales (zero to 0.1" and above) is highly amplified due to the fact that it only takes very light amounts of precipitation to create hazardous road conditions. (A simple BFP-only chart can be plotted on a map using the BFP and CIP variables together.)
BFP+ chart for January 4, 2025 freezing rain event in the Great Plains and Midwest:

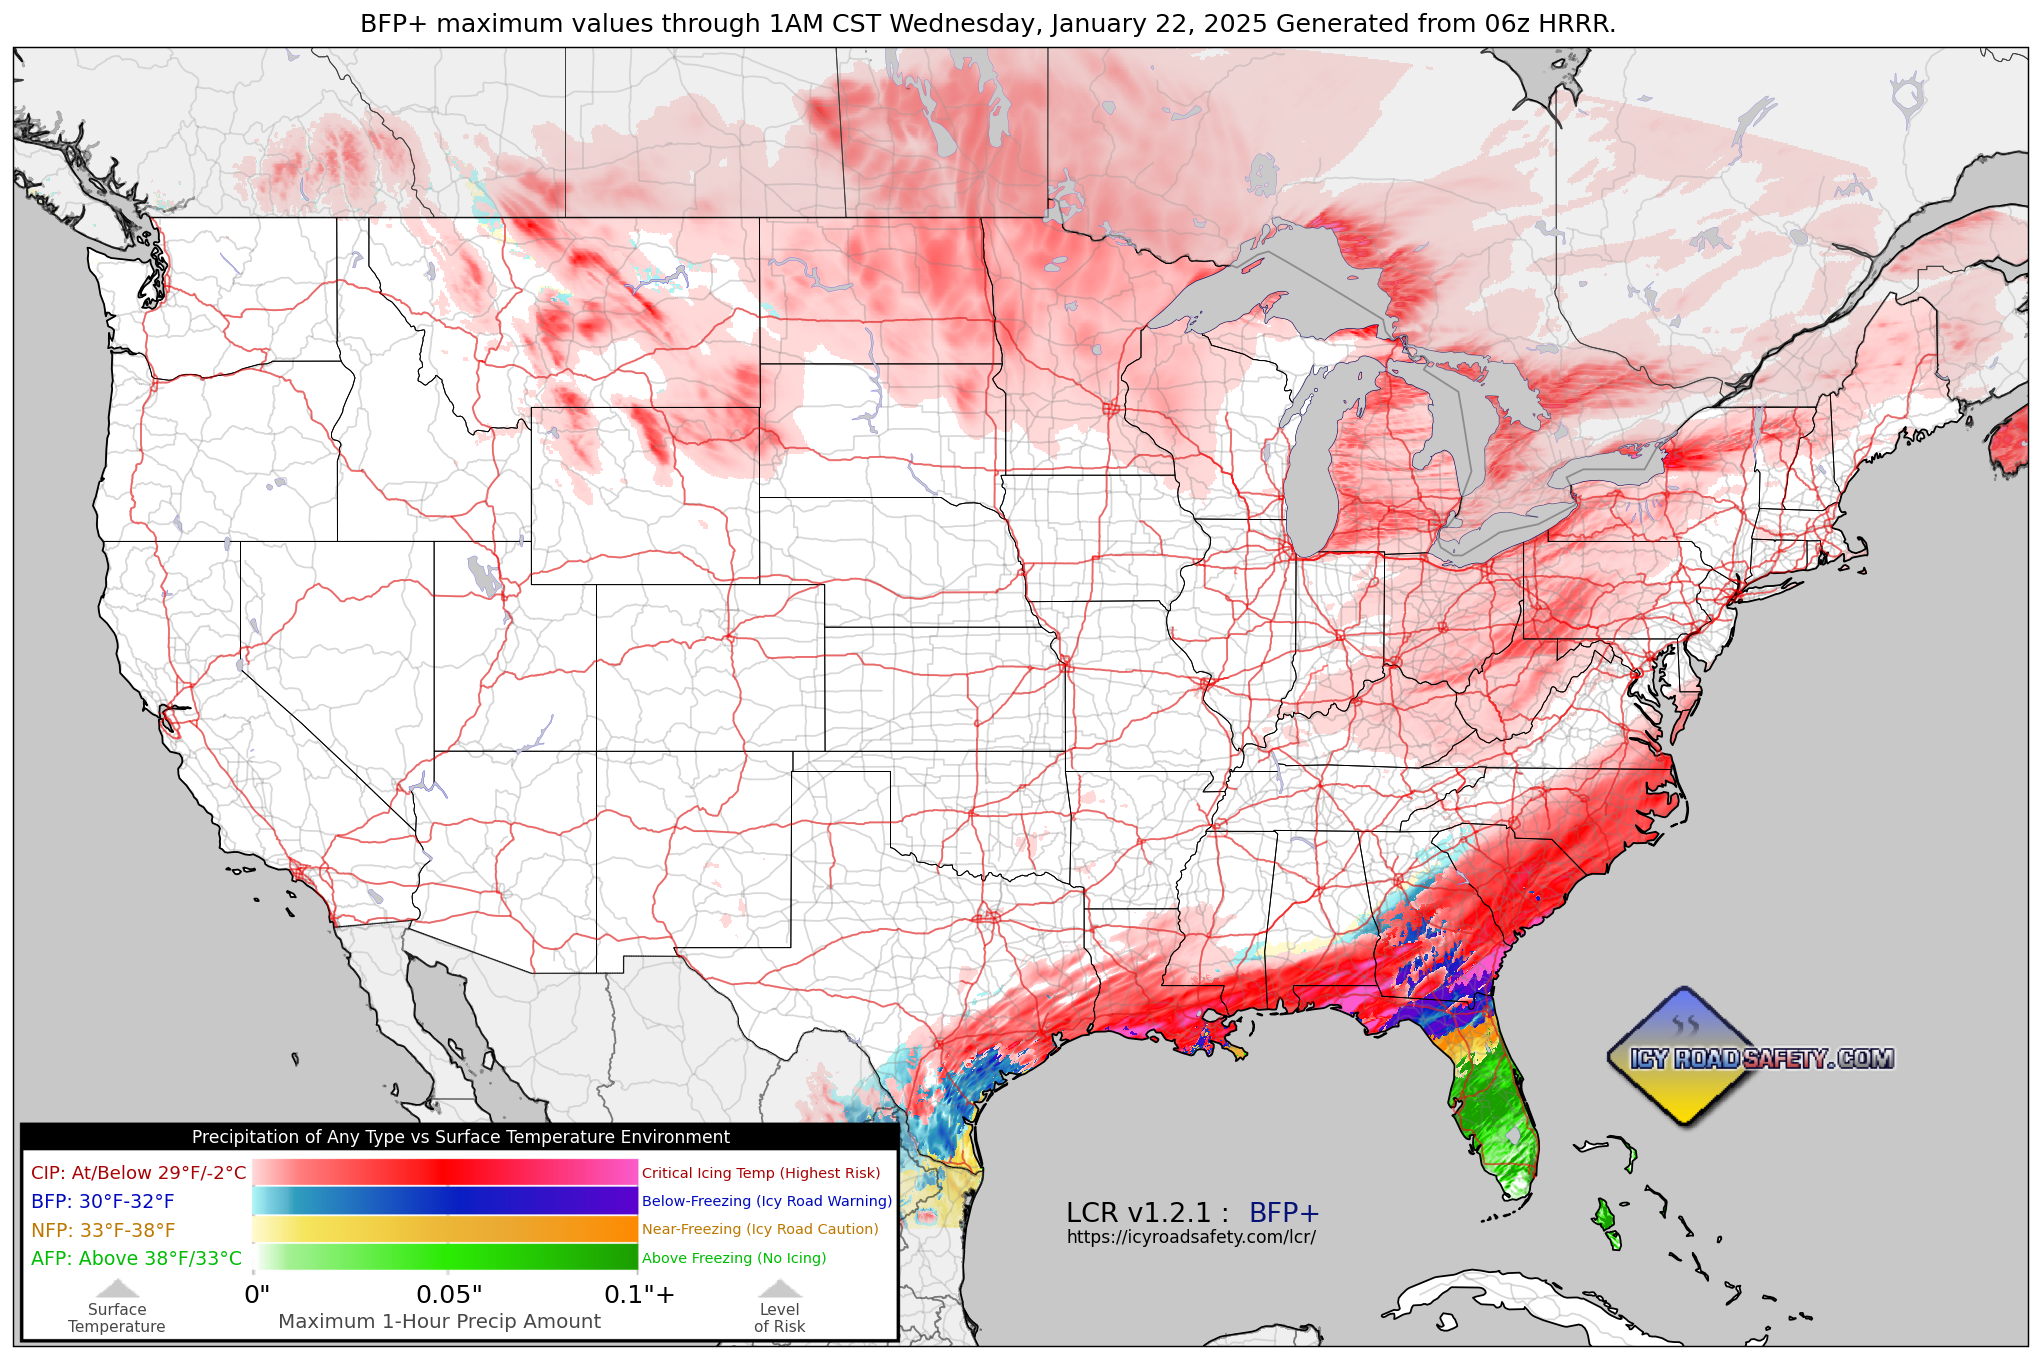
BFP+ chart for January 21, 2025 historic winter storm along the Gulf coast and Florida:
Latest BFP+ chart:
|
Script Downloads & Development
LCR v1.2.2 (Updated November 19, 2025)
The LCR scripts are designed to run in the NCO toolkit. The scripts are being released under a GNU license.
Current Version 1.2.2
Generating LCR forecasts requires these two NCO script files and at least one of the Linux shell script files in the next section.
To download, right-click on the following files and choose "Save As".
- lcr-v-1-2-2.nco
Download to your Linux installation with the following command:
wget https://icyroadsafety.com/lcr/lcr-v-1-2-2.nco
- kuchera.nco
Download to your Linux installation with the following command:
wget https://icyroadsafety.com/lcr/kuchera.nco
|
Shell scripts for specific models: In addition to the two nco script files listed above, you will need one or more of the following Linux shell scripts to run LCR forecasts (view instructions on how to run). Use the one that corresponds to the model you wish to use to generate the LCR forecast.
To download, right-click on the following files and choose "Save As".
- hrrr.sh - Uses the HRRR model to produce high-resolution CONUS LCR forecasts with 24-hour daily maximum data for days 1 and 2. Warning: this script will download approximately 4.5GB of required model data from the NOAA NOMADS server each time the script is run.
Download to your Linux installation with the following command:
wget https://icyroadsafety.com/lcr/hrrr.sh
- namnest.sh - Uses the NAM NEST model to produce CONUS LCR forecasts with 24-hour daily maximum data for days 1 and 2. Warning: this script will download approximately 1.8GB of required model data from the NOAA NOMADS server each time the script is run.
Download to your Linux installation with the following command:
wget https://icyroadsafety.com/lcr/namnest.sh
- gfs-conus-2day.sh - Uses the GFS model to produce CONUS LCR forecasts with 24-hour daily maximum data for days 1 and 2. Warning: this script will download approximately 500MB of required model data from the NOAA NOMADS server each time the script is run.
Download to your Linux installation with the following command:
wget https://icyroadsafety.com/lcr/gfs-conus-2day.sh
- gfs-conus-4day.sh - Uses the GFS model to produce CONUS LCR forecasts with 24-hour daily maximum data for days 1 through 4. Warning: this script will download approximately 750MB of required model data from the NOAA NOMADS server each time the script is run.
Download to your Linux installation with the following command:
wget https://icyroadsafety.com/lcr/gfs-conus-4day.sh
|
When generating charts, you can import the following color table files:
| To download, right-click on the following files and choose "Save As".
Color table files:
BFP+ Color Table Files: You will need these four color tables to plot BFP+ charts:
**Please note that GEMPAK TBL files do not support transparency. The zero (0) value in the BFP, NFP and CIP color tables must be fully transparent (Alpha of 0) for the final BFP+ map to display correctly. You will need to set this manually in whatever mapping utility you are using. McIdas XML color table files have transparency built-in and do not require that additional step.
BFP+ data sets should be layered in this order, with their respective color tables applied to each:
CIP: Top layer
BFP: Second layer
NFP: Third layer
AFP: Bottom layer
|
Archived Older Versions of the LCR NCO script
| To download, right-click on the following files and choose "Save As".
|
You can also download the script from Github.
Notes
- Numerical model chart script (Phase I): The first functional LCR script for numerical model charts was released in December 2022. This code is being made available under a standard GNU license to any and all outlets that display numerical model data charts.
- Realtime analysis script (Phase II): Realtime LCR chart generation will be possible using METAR (surface) observations and mesonets. Development of this code is scheduled, but no date of completion has been set. Mesoanalysis charts can be generated using the numerical model data script.
Running the LCR script on model data
The LCR script runs using NCO Toolkit commands in Linux. To run the script, you will need a Linux machine (or a virtual machine running Linux in Windows or Mac). Both the NCO Toolkit and Ubuntu Linux are free and open-source. You can use the free Windows Subsystem for Linux (WSL) to install and run Ubuntu Linux within Windows (you will need to enable virtualization both in Windows and in your BIOS).
- Install the NCO toolkit and related functions in Linux. From a fresh Linux install, type and run the following commands in sequence:
sudo apt-get update
sudo apt-get install nco
sudo apt-get install netcdf-bin
sudo apt-get install cdo
- Download the LCR script to your Linux installation using the links above or with wget commands.
- Download model data and run the scripts: There are two ways to do this: using shell (bash) scripts or using manual commands.
Using bash scripts: The LCR v1.2 script is designed to run as part of a series of commands performed in sequence with the Linux shell (bash) scripts (download links above or use the wget command). These shell scripts automate the downloading of the model data, execute the LCR script and create the Day 1 and Day 2 data files. Follow these instructions to run the bash scripts:
- Download each .sh file into Linux (links above or using the wget command). These need to be downloaded into the same Linux folder as the LCR and Kuchera nco script files.
- chmod each .sh file to 755 by typing the following command and pressing enter:
chmod 755 scriptname.sh
- Edit the date and model run time in each script. The date format is YYYYMMDD and the model run times are HHz.
- Run the bash script by typing the following command and pressing enter:
./scriptname.sh
- Download model data with the ncks command. The following two commands run in sequence will download the necessary parameters in model output from the NOAA Nomads server:
ncks -v tmp2m,dpt2m,rh2m,apcpsfc,
cfrzrsfc,csnowsfc,tcdcclm,gustsfc OpenDap-Model-URL modeldata.nc
If doing the Kuchera ratio caluclations, you will need to next download the required upper air data with this command:
ncks -d lev,500.0,1000.0 -v tmpprs OpenDap-Model-URL outputfile.nc time
OpenDap-Model-URL is the location of the OpenDAP data file on the NOMADS server. This will be different for each model. Go to the NOMADS home page and click the OpenDAP link for the model you need.
Constrain data by latitude/longitude: You may want to limit the download of data to a specific region like the CONUS or an even smaller geographic area. For example, the full global GFS data download for the LCR-required variables will be over 2GB. To save time and limit the data download to CONUS gridpoints only, use the following:
ncks -d lat,20.0,60.0 -d lon,210.0,310.0 -v tmp2m,dpt2m,rh2m,apcpsfc,
cfrzrsfc,csnowsfc,tcdcclm,gustsfc OpenDap-Model-URL outputfile.nc
- If you are using the Kuchera snow ratio calculations, next run the following command to calculate Kuchera ratio from the downloaded upper air data (make sure the resulting file is named kuchera.nc):
ncap2 -4 -S kuchera.nco downloaded-upper-air-data-file.nc kuchera.nc
downloaded-upper-air-data-file.nc is the outputfile.nc from the upper air download step.
- If you are using the Kuchera snow ratio calculations, next merge the kuchera.nc file with the rest of the downloaded model data parameters (modeldata.nc shown above, you can name it whatever you want):
cdo merge modeldatafile.nc kuchera.nc modeldatafile-merged.nc
- Run the LCR script on the downloaded model data file. Run the following command to calculate LCR and BFP from the downloaded data.
ncap2 -4 -S lcr-v-1-2.nco downloaded-model-data-file.nc outputfile-lcr.nc
downloaded-model-data-file.nc is the modeldata.nc from the previous download step (use the merged file if using Kuchera snow ratios), outputfile-lcr.nc here is the final file containing the LCR and BFP calculations.
- Generate 24-hour maximum charts: The ncwa command can generate a new .nc file containing maximum LCR or BFP values over a specified time period.
ncwa -v lcr -d time,startframe,endframe -a time -y max inputfile-lcr.nc outputfile-lcrmax.nc
Replace startframe with the time step number where you want the maximum value calculation to begin, replace endframe with the time step number where you want it to end.
For 1-hour models like the HRRR, there are 24 timesteps in a day. For models like the GFS which use 3-hour time steps, there are 8 timesteps in a day. If you wanted to perform a maximum calculation for the 00z HRRR for the 24-hour period ending at 00z the following day, the startframe would be 1 and the endframe would be 24. For the same situation with the 00z GFS, the startframe would be 1 and the endframe would be 8. If you wanted to do a "Day 2" forecast for tomorrow (00z tonight through 00z tomorrow) from the 18z HRRR, you would make the startframe 6 and the endframe 30.
Example: 24-hour maximum LCR chart from the 00z HRRR:
ncwa -v lcr -d time,1,24 -a time -y max inputfile-lcr.nc outputfile-lcrmax.nc
Example: Day 2 24-hour maximum BFP chart from the 18z HRRR:
ncwa -v bfp -d time,6,30 -a time -y max inputfile-bfp.nc outputfile-bfpmax.nc
- Copy the final LCR data files to Windows (in WSL): Type the following command to open the Linux directory in a Windows File Explorer window (note the space and period after exe):
explorer.exe .
You can drag-and-drop or copy the .nc data files over to Windows this way. This folder also does not auto-refresh, you'll need to manually refresh it to see new/changed Linux files. Note: This file transfer menthod only works in one direction, Linux > Windows. Files copied from Windows to Linux this way are often not readable in Linux.
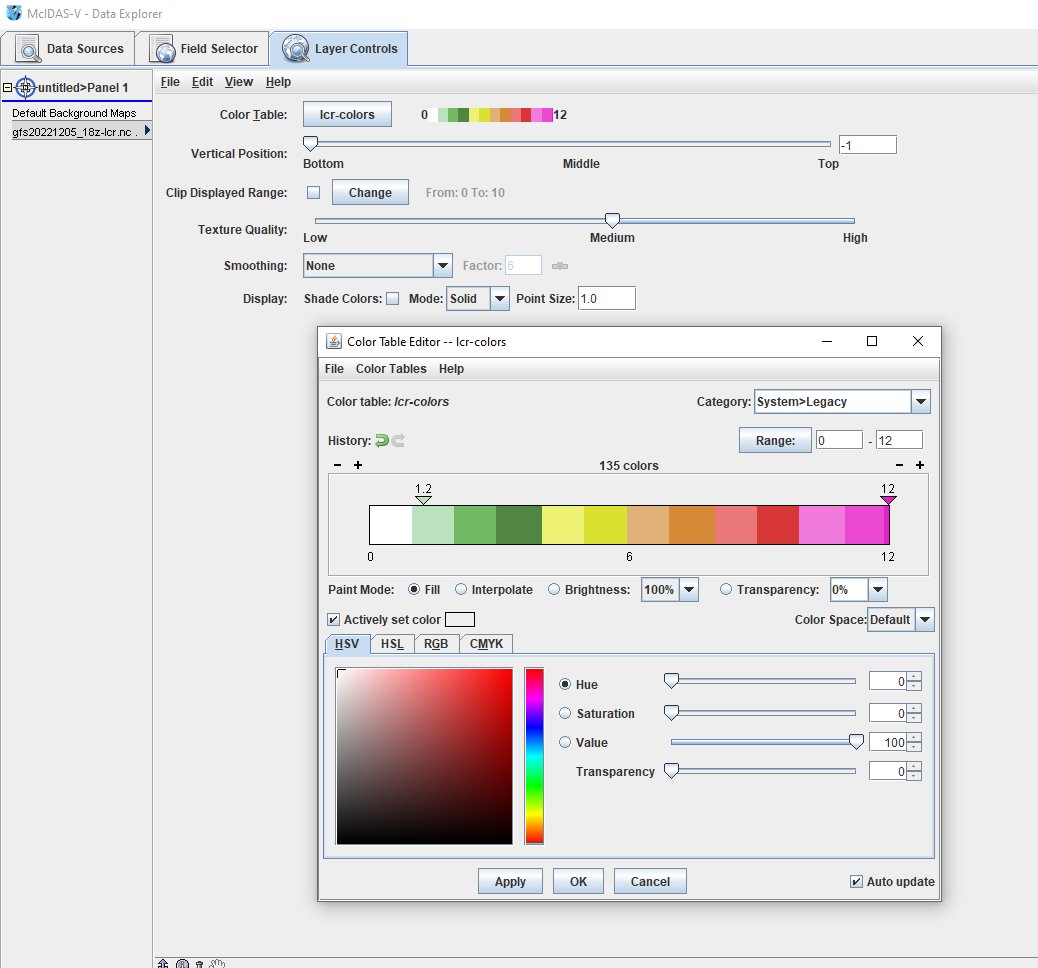
- Use the data viewer of your choice to generate charts from the resulting files. The free software McIDAS-V is a good way to generate charts of the resulting data. Choose the "color shaded plan view" and download the XML files to import the color scale for LCR or BFP, and set the scale range from 0 to 12 for LCR or 0 to 0.1 for BFP.
Script Version Notes
Version 1.2.2
- Refined QPF threshold values for base LCR assignments.
- Lowered the main threshold temperature of liquid precipitation to 36°F and wet-bulb temperature of 34°F. (Snow threshold remains at 38°F and wet-bulb temperature of 36°F)
- Added lower bounds for all base LCR value assignments (see tables above).
- Added lower bound of 0.003" for all BFP+ variables.
- Added function to turn off QPF decumulation for the HRRR model, which already has hourly values at each timestep.
- Added a LCR limit of 7 when precip type is snow outside of the southern USA (north of 35° latitude) and wind gusts are less than 20mph. The reason this was done is to preserve values 9 and above for only freezing rain/drizzle events in the central and northern USA. LCR-7 events will be asssigned LCR-8 only when high winds are present during those snow events.
Version 1.2
- For models without asnowsfc, the Kuchera ratio is now used to calculate the one-hour snowfall amounts used to set base LCR. Because calculating Kuchera ratio requires a significant increase in model data variables, the required NOMADS OpenDap data download size for each run has increased. The included companion script kuchera.nco handles this portion of the calculation.
- The precipitation criteria for base LCR have been lowered. base LCR is now set as follows if precip type is snow: 0" to 0.1": LCR-1; greater than 0.1" to 0.6": LCR-2; greater than 0.6" to 1.3": LCR-3; greater than 1.3": LCR-4. base LCR is now set as follows if precip type is liquid: 0" to 0.05": LCR-1; greater than 0.05" to 0.1": LCR-2; greater than 0.1" to 0.25": LCR-3; greater than 0.25": LCR-4. These changes were implemented to better match impacts observed.
- A single script now processes data from any model, including both asnowsfc and non-asnowsfc inclusive models.
- The lower bound for the temperature "sweet spot" factor has been lowered from 24°F to 20°F, increasing the range of temperatures for which this factor will trigger.
- The at-or-below freezing threshold has been increased to 32.9°F in order to ensure triggering of the factor when temperatures are right at the freezing point.
- The script now uses the variable tcdcclm (total cloud cover percentage) to limit LCR to 3 when skies are clear (cloud cover percentages less than 10). This was done because models frequently depict clear-sky freezing precipitation during frost conditions. These conditions very rarely produce impactful icing, yet were frequently resulting in LCR values of 7 being depicted on charts.
- Added a new surface wind LCR incremental factor that looks at the model variable gustsfc (maximum surface wind gust). While the windspeed thresholds will likely require some future adjustments, they are being initially set to the following: If maximum surface wind gusts are greater than 8.9 m/s (17.4kts or 20mph) and LCR is at 5 or above, LCR is increased by 1. Justification: Strong winds (crosswinds in particular) increase the risk of losing control on icy roads, particularly for high-profile vehicles like tractor-trailers, vans and RVs. Wind alone can cause lateral slides/fishtails for higher profile vehicles without any driver steering input.
- Scale labels have been simplified. LCR 1 through 3 are labeled as Chance, LCR 4-5 are labeled as Likely and LCR from 6 and up are labeled as Serious. The scale's colors remain the same.
- Color scale updates: Updated the BFP color scale to a better turqiouse-blue-purple gradient. Added GEMPAK TBL format downloads for all color scales.
- Added BFP+ chart functionality: Version 1.2 of LCR creates the new BFP Plus data set. BFP+ is a bundle of four parameters, each with their own period maximum .nc file: CIP (Precipitation at/below Critical Icing Temperature), BFP (Below-Freezing Precipitation), NFP (Near-Freezing Precipitation) and AFP (Above-Freezing Precipitation). BFP-only charts can be plotted standalone in the same way previous versions. BFP+ charts are plotted by overlaying AFP (bottom layer), NFP (third layer), BFP (second layer) and CIP (top layer) using your data visualization ot mapping software of choice such as McIdas. Make sure you download the new BFP+ color scale files and apply each to their respective data set.
Version 1.1.8/1.1.7
- Corrected a significant error with the base LCR assignment code. The LCR-3 base condition was actually assigning a value of 2 instead of 3. v1.1.7 has the same correction for models without asnowsfc.
- v1.1.7 only (models without asnowsfc): Added a function to set base LCR based on snow amounts using the 10:1 ratio. This is another measure to help ensure that heavy snow events will attain more appropriate LCR values. It assigns LCR values from 1 to 4 based on 10:1 ratio snow amounts if the precipitation type is snow, using the same thresholds as models with asnowsfc. This new function requires the additional variable csnowsfc for each gridpoint. Freezing rain will remain using the liquid thresholds.
Version 1.1.6/1.1.5
- Increased the wet bulb temperature threshold for base LCR by 1 degree: At or below 34°F for LCR-1 and at or below 33°F for LCR-2 through LCR-4. This was done so that a greater number of heavy snow events in above-freezing 2m temperatures can attain values up to LCR-4. v1.1.5 has the same modification for models without asnowsfc.
Version 1.1.4 (asnowsfc-inclusive models only)
- Added a 4th base LCR value for heavy snow events. This assigns a base LCR value of 4 for events with 3 inches or greater snowfall in 1 hour (asnowsfc models only) and/or liquid-equivalent 1-hour precipitation of 0.5" or greater. This ensures that heavy snow events will attain a value of at least LCR-4, even if 2m temperatures are above freezing. v1.1.3 is for models without asnowsfc (meaning only the liquid-equivalent precipitation factor is used).
Version 1.1.2 (asnowsfc-inclusive models only)
- Added snowfall thresholds to the base LCR value functions. The liquid-equivalent thresholds for base LCR remain the same, but now the script looks at the 1-hour snowfall (decumulated asnowsfc variable) and assigns LCR-1 for snowfall from greater than 0 to 1 inch, LCR-2 for snowfall between 1 and 2 inches, and LCR-3 for snowfall above 2 inches.
This change was necessary because impactful events with high snow ratios (meaning very low liquid-equivalent precipitation) were sometimes not assigned base LCR values higher than 1. This resulted in events that should be LCR-4 or LCR-5 ending up at only LCR-3.
Since the asnowsfc variable is not available in all models, version 1.1.4 of the script can only be used with models that include that variable (such as the HRRR). Deriving hourly snowfall in models without the asnowsfc variable will involve additional development to incorporate Kuchera snow ratio (to be completed at a future time).
Version 1.1.1
- Removed the lower temperature bound of the "sweet spot" range for freezing rain events. The script will now apply the 2-point "sweet spot" increase for all temperatures at 29°F and below if the precipitation type is freezing rain. This is because there is no decrease in the hazard level of freezing rain road icing occurring at temperatures below 24°F.
Version 1.1
- Fixed an error with the temperature history factor variable not converted to Fahrenheit. Since the threshold of this factor is 32, the value being in Celsius meant that it would always trigger the temperature history factor LCR increment. This caused LCR to be 1 point higher everywhere on the map and causing all LCR-activated gridpoints to start at 2 instead of 1.
- Rewrote the LCR processing section to add the lcron variable as the "master" control in the conditional factor "where" statements. This ensures the incremental factors don't activate at a gridpoint when LCR is zero.
- Increased the temperature threshold of LCR-1 to 38°F and a wet bulb temp of 33°F. This should help ensure that the vast majority of above-freezing heavy snow events trigger LCR at a gridpoint.
- Lowered the relative humidity thresholds for the freezing fog factors to 92 percent for LCR-1 and 98 percent for LCR-2. This should help to catch more of the lower-end freezing fog events that can initiate at lower RH levels.
- Added freezing rain precipitation type to the below-freezing temperature factor. This is meant to maintain increased LCR for freezing rain events occuring at temperatures above freezing.
Future Development Goals
Planned updates to the LCR data processing script include:
- De-Icing Capacity refinements. Currently, the 35°, 34° and 33° latitudes are used as proxies for demarcating regions of adequate vs reduced de-icing capacity (salt/brine trucks, plows and crews). Future plans call for a detailed county-by-county database of de-icing capacity across the US that can be used to apply a granular GIS-based De-Icing Capacity factor in LCR calculations. This data will also allow for a multiple-step grading of de-icing capacity that will allow application of this factor in an incremental manner.
- RWIS integration. Current realtime analysis will use AWOS/ASOS observations. Later editions of the script will include RWIS (Roadway weather information systems) data, where available.
- Radar integration. The possibility of using radar reflectivity for realtime LCR calculations is being investigated. Radar may be used to augment or replace the QPF/precipitation rate factor for realtime LCR analysis.
Limitations
LCR does not address lingering hazardous road impacts. Several factors can cause a hazardous road condition to persist for some time after the event is over. These include:
- Temperatures remaining below freezing with no road treatment applied. As long as roads remain untreated and temperatures remain below freezing, the hazardous condition will remain at is previous LCR maximum until either of those factors has changed. It will remain possible for LCR values calculated in the time following an event to not show this ongoing hazard.
- Temperatures rising above freezing immediately following a high-LCR event. Road surfaces can remain hazardous for an interval of time even if temperatures rise above freezing immediately afterward.
Significant accumulations (snowstorms) and blizzards: LCR does not consider non-road-surface-friction hazards from significant winter storms (cold temperatures, blowing snow, reduced visibility), nor road impassability due to large snow accumulations or drifts. In other words, LCR does not consider the risk of a vehicle getting stuck. Such hazards are already well-covered by the current watch, warning and advisory products. Vehicle loss-of-control incidents are also less of a factor during significant snowfall events (+5") due to these accumulations inherently limiting vehicles' top speeds.
LCR does not take into account rain (wet road) impacts. Rain does correlate with an increase in accident rates, but only at a marginal level compared to the increase during winter precipitation conditions. Rain, a very common condition in most locations, rarely results in the acute, widespread impacts that winter precipitation produces. The presence of precipitation during the warm season is already well-represented using radar and model QPF charts. In addition, including rain in the LCR equation would create unneccessary noise in the data. These all influenced the decision to not include a LCR factor for rain.
Known issues
The following are known issues that need work. Feedback and ideas are welcome!
- False freezing precipitation areas: Many models, including the HRRR, produce broad swaths of light freezing precipitation in areas they should not, for reasons unknown. The QPF values in these areas are generally lower than 0.008", and rarely verify with observed icing or impacts. Actual freezing precipitation can produce high impacts with very low (trace) amounts, so placing a lower bound risks LCR missing high-impact light icing events (mainly freezing drizzle events). However, having no lower bound for freezing precipitation results in high LCR values being plotted across these broad areas of false values.
Lower QPF bounds for freezing precipitation of 0.01" and 0.008" were tested for several weeks at a time. These resulted in LCR missing multiple high-impact freezing drizzle events. Currently, a compromise lower bound value of 0.003" is in place on the freezing rain/freezing drizzle factor in version 1.2.2.
Since most of the trace/light icing events occur in areas of broad-scale lift, the tcdcclm (cloud cover) variable has shown some success in filtering out part of these false freezing precipitation areas by limiting LCR to 3 where cloud cover is at or less than 10%. This function is also active in v1.2.2.
The false freezing precipitation issue is a model problem and not necessarily an LCR problem, and may require further workarounds to completely eliminate.
- QPF accumulation/decumulation issues: The various models each handle precip accumulation differently. Some do not accumulate QPF, while others accumulate either at set intervals or through the entire forecast period. Some have demonstrated irregular/random accumulation patterns. For example, the NAM NEST model produces accumulation in a 3-timestep interval, but occasionally will accumulate in seemingly random 2-timestep intervals with no apparent pattern. Since the script needs single-timestep QPF values to calculate LCR for that timestep, any accumulated QPF needs to be decumulated using a set formula.
v1.2.2 assumes entire-forecast-period QPF accumulation and has a function to decumulate values by subtracting the previous timestep value from the current timestep value. The exception is the HRRR model, for which the script does not decumulate precipitation values.
Complete model precipitation accumulation behavior profiles will need to be added to the script to ensure that single-timestep values are processed before LCR is calculated.
- Regional de-icing capacity factor: There has been feedback about the way the regional de-icing capacity is represented for the increase in risk in the southern USA. Since this factor uses latitude and LCR is an integer scale, this results in the increased values plotted in uniform lines across the map. These lines look out of place on any kind of weather map. The latitude is a good approximation of the actual increase in risk with southward extent, so the issue here isn't so much with the values themselves, just the unnatural way they appear on the final charts.
A GIS layer with county-by-county de-icing capacity may be needed that can replace the generalized latitude factor. Unless that sort of data already exists somewhere, it's going to be quite the undertaking to compile it - and it's not apparent if the end result would be much more useful than the current method.
GNU License Info
The LCR script and supporting files are Copyright (C) 2025 Dan Robinson and are released inder a GNU GPLv3 license:
- This program is free software: you can redistribute it and/or modify it under the terms of the GNU General Public License as published by the Free Software Foundation, version 3.
- This program is distributed in the hope that it will be useful, but WITHOUT ANY WARRANTY; without even the implied warranty of MERCHANTABILITY or FITNESS FOR A PARTICULAR PURPOSE. See the GNU General Public License for more details.
- You should have received a copy of the GNU General Public License along with this program. If not, see https://www.gnu.org/licenses/.
Collaboration
Assistance in development, refining and implementation of the LCR Scale would be welcome! Please email Dan Robinson at [email protected].
Special Thanks To
Henry Butowsky - NCO/bash script programming, server configuration and technical assistance
Ula Vera - Python Cartopy/Matplotlib map script programming
Educational Winter Driving Videos - Watch for Free:
Home | Risk | Stats | Accident Video | Icy Bridges | Tips | Warning Signs | If You Slide | If You Wreck
1,836
Average annual
deaths in the US
from icy roads
136,309
Average annual
injuries in the US
from icy roads
[ More Statistics ]
|
|
|