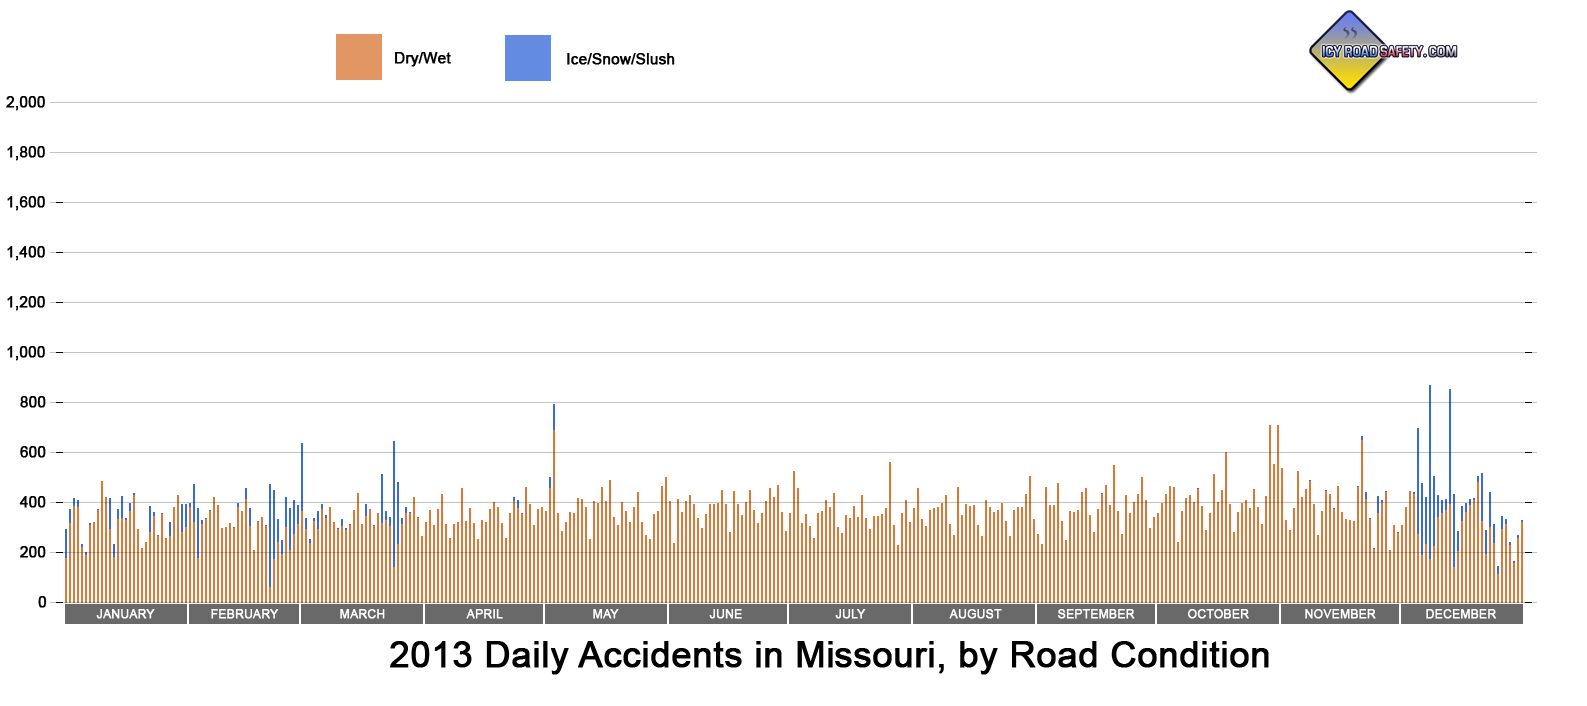
Accidents by Road Surface Condition - Missouri, 2013
| Road Condition |
Accidents |
% |
| Ice |
3,194 |
37.5% |
| Snow |
4,583 |
53.8% |
| Slush |
737 |
8.7% |
|
Accidents by Time of Day - Missouri, 2013
| Time |
Accidents |
% |
| Daytime |
5,292 |
62.1% |
| Night |
3,145 |
36.9% |
|
Accidents by Vehicle Type - Missouri, 2013
| Type |
Vehicles |
% |
| Total Vehicles |
13,112 |
|
| Passenger Vehicles |
11,941 |
91.1% |
| Commercial Vehicles |
889 |
6.8% |
| Cars |
6,205 |
47.3% |
| SUVs |
2,531 |
19.3% |
| Pickups |
2,593 |
19.8% |
| Vans |
595 |
4.5% |
| Cargo Vans |
38 |
0.3% |
| 9+ Passenger Vans |
7 |
0.05% |
| Trucks, all |
729 |
5.6% |
| Semi trucks, all |
431 |
3.3% |
| Semi trucks, single trailer |
403 |
3.1% |
| Semi trucks, double trailer |
15 |
0.01% |
| Semi trucks, triple trailer |
1 |
0.07% |
| Semi trucks, no trailer |
12 |
0.09% |
| Single-Unit Trucks, 2 axles |
170 |
1.3% |
| Single-Unit Trucks, 3+ axles |
61 |
0.5% |
| Heavy Trucks - Other |
67 |
0.5% |
| Buses, all |
97 |
0.7% |
| Large Buses |
84 |
0.6% |
| Small Buses |
13 |
0.09% |
| Construction Equipment |
17 |
0.1% |
| Farm Equipment |
6 |
0.04% |
| Motor Homes |
10 |
0.07% |
| Motorcycles |
2 |
0.01% |
| Bicycles |
1 |
0.01% |
| ATVs |
6 |
0.04% |
| Limousines |
2 |
0.01% |
| Other |
273 |
2.1% |
|
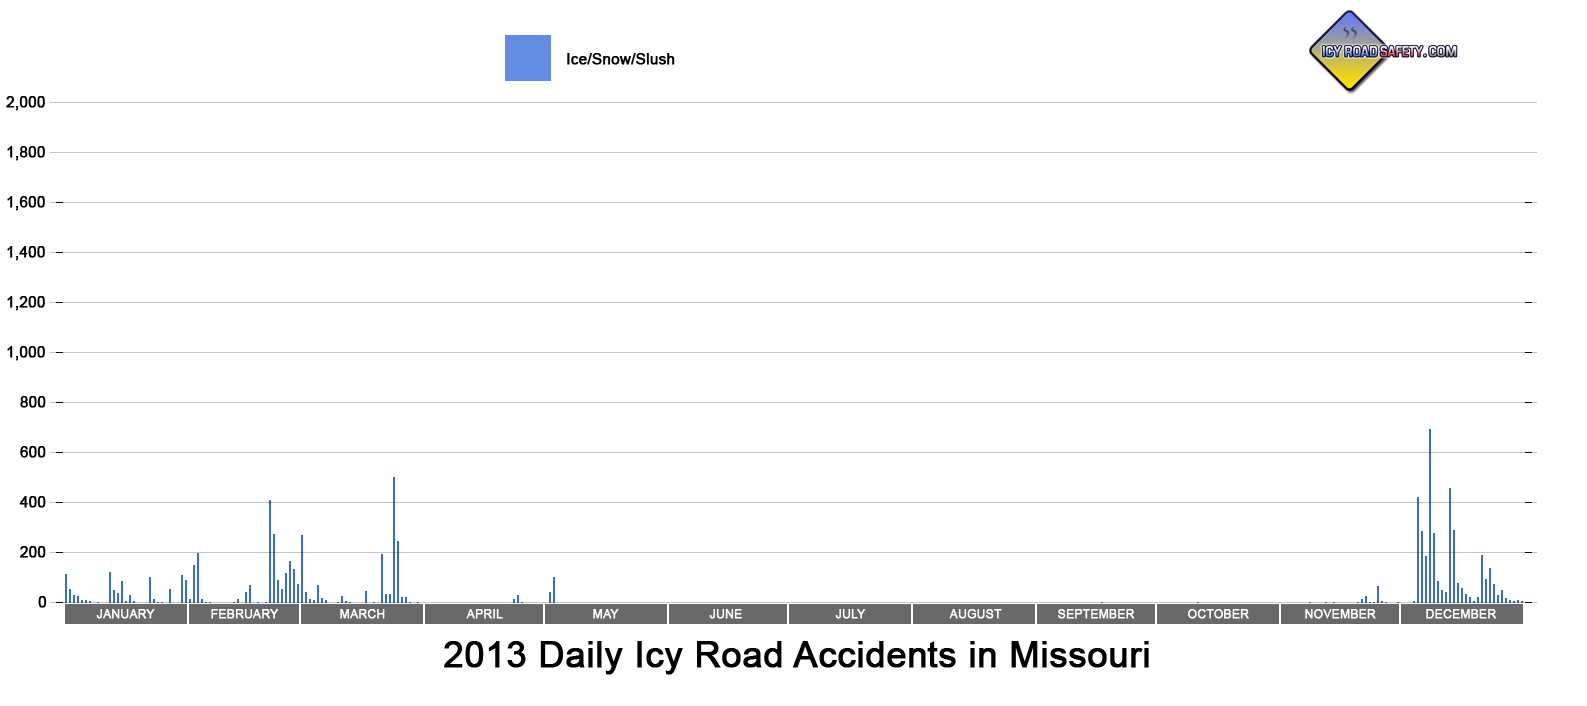
Highest-Impact Events - Missouri, 2013
| Event |
Accidents |
Deaths |
Injuries |
December 5-8 Snow
Southern MO |
1,607 |
4 |
450 |
| December 13-15 Freezing Rain/Snow |
775 |
6 |
211 |
| February 21-23 Snow |
769 |
1 |
159 |
| March 24-25 Snow |
725 |
1 |
189 |
| December 21 Freezing Rain/Snow |
285 |
1 |
84 |
|
Accident Vehicle Occupants - Missouri, 2013
| Injury Severity |
| Total persons involved |
18,300 |
% |
| Fatalities |
31 |
0.2% |
| Seriously Injured |
200 |
1.1% |
| Injured (minor) |
2,097 |
11.5% |
| Not injured |
15,972 |
87.3% |
|
| Seat Belts |
| Seat Belt Used |
13,443 |
73.5% |
| Child Restraint Used |
540 |
3% |
| Belt available but not used |
663 |
3.6% |
| No seat belt available |
590 |
3.2% |
|
This table shows the impact of seat belt use:
| Restraint |
Fatalities |
Serious
Injuries |
Minor
Injuries |
No
Injuries |
| Seat Belts |
11 |
103 |
1,628 |
11,674 |
| Child Restraints |
1 |
2 |
41 |
494 |
| Belt available but not used |
15 |
66 |
237 |
343 |
| No seat belt available |
1 |
6 |
30 |
551 |
|
| Drivers |
| Total Drivers |
12,033 |
% |
| Male |
7,001 |
58.2% |
| Female |
4,472 |
37.2% |
| Age: under 18 |
537 |
4.5% |
| Age: 18-24 |
2,536 |
21.1% |
| Age: 25-39 |
3,646 |
30.3% |
| Age: 40-54 |
2,646 |
22% |
| Age: 55-69 |
1,568 |
13% |
| Age: 70+ |
382 |
3.2% |
|
|