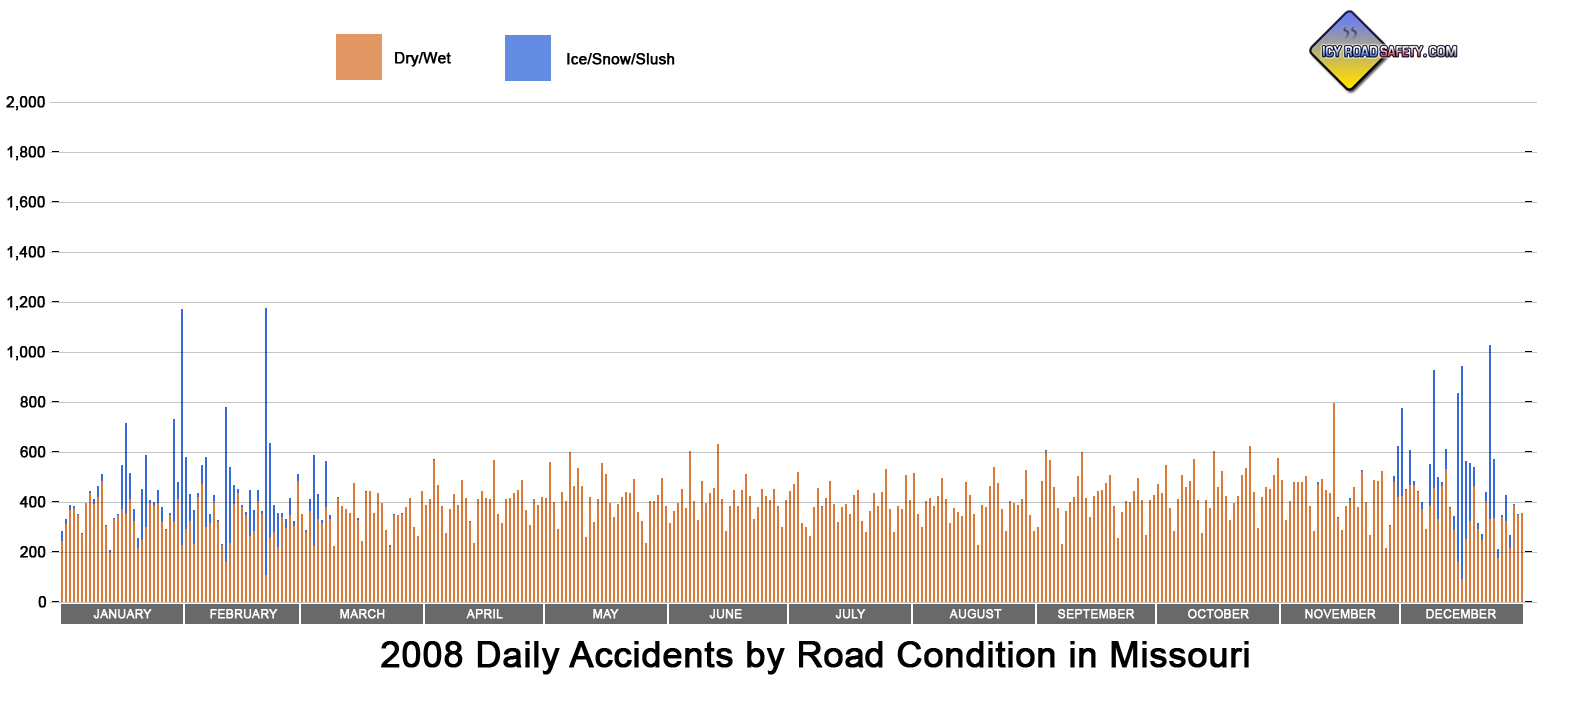
Accidents by Road Surface Condition - Missouri, 2008
| Road Condition |
Accidents |
% |
| Ice |
6,113 |
46.7% |
| Snow |
6,185 |
47.2% |
| Slush |
793 |
6.1% |
|
Accidents by Time of Day - Missouri, 2008
| Time |
Accidents |
% |
| Daytime |
8,572 |
65.5% |
| Night |
2,620 |
32.5% |
|
Accidents by Vehicle Type - Missouri, 2008
| Type |
Vehicles |
% |
| Total Vehicles |
20,327 |
|
| Passenger Vehicles |
18,743 |
92.2% |
| Commercial Vehicles |
1,294 |
6.4% |
| Cars |
9,666 |
47.6% |
| SUVs |
3,738 |
18.4% |
| Pickups |
3,940 |
19.4% |
| Vans |
1,396 |
6.7% |
| Trucks, all |
1,075 |
5.3% |
| Semi trucks, all |
585 |
2.9% |
| Semi trucks, single trailer |
537 |
2.6% |
| Semi trucks, double trailer |
30 |
0.1% |
| Semi trucks, triple trailer |
0 |
0% |
| Semi trucks, no trailer |
18 |
0.09% |
| Single-Unit Trucks, 2 axles |
304 |
1.5% |
| Single-Unit Trucks, 3+ axles |
112 |
0.6% |
| Heavy Trucks - Other |
74 |
0.4% |
| Buses, all |
201 |
1% |
| Large Buses |
148 |
0.7% |
| Small Buses |
53 |
0.3% |
| Farm Equipment |
7 |
0.03% |
| Construction Equipment |
6 |
0.03% |
| Limousines |
5 |
0.02% |
| ATVs |
4 |
0.02% |
| Bicycles |
3 |
0.01% |
| Motorcycles |
3 |
0.01% |
| Motor Homes |
3 |
0.01% |
| Other |
280 |
1.4% |
|
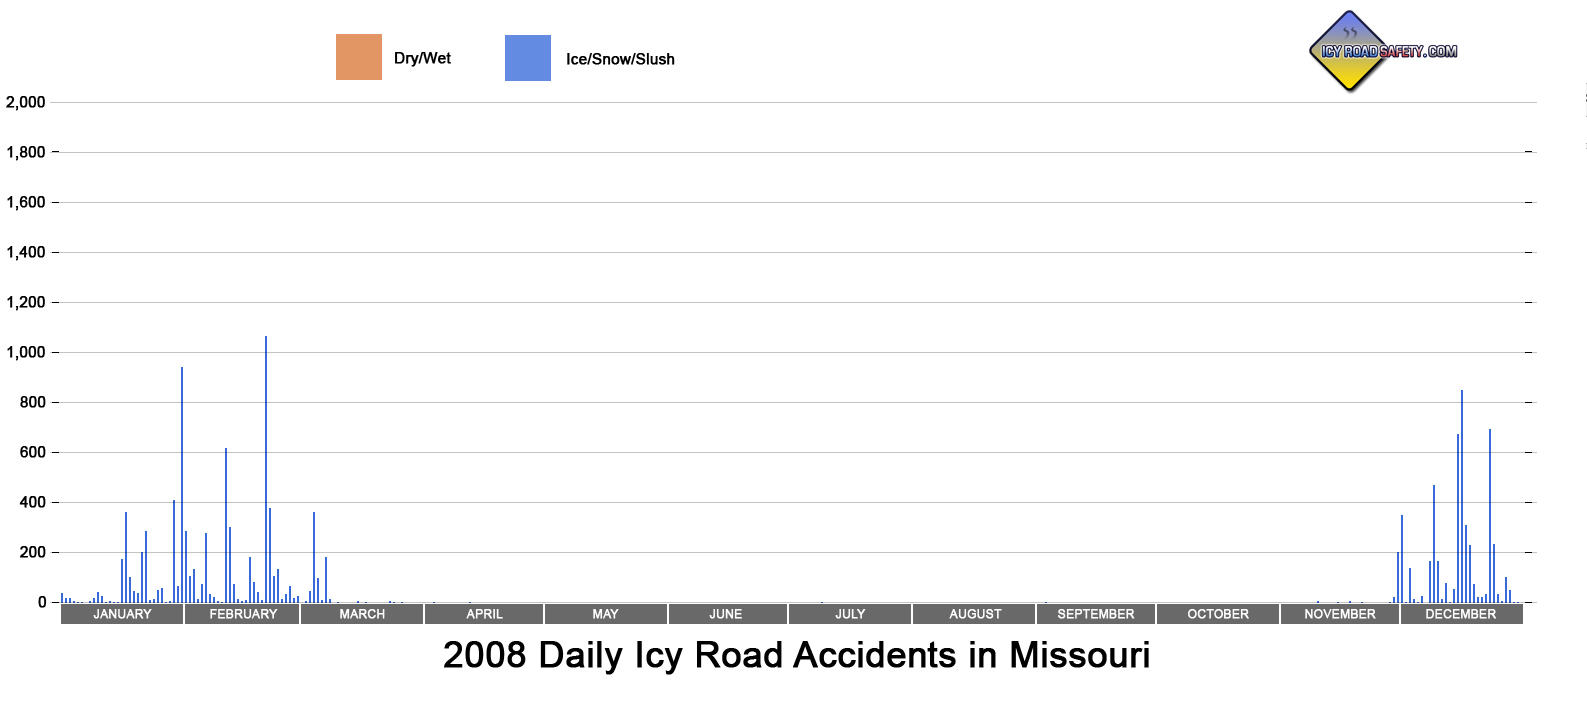
Highest-Impact Events - Missouri, 2008
| Event |
Accidents |
Deaths |
Injuries |
| December 15-17 Freezing Rain/Snow |
1,900 |
4 |
470 |
| February 21-22 Ice Storm |
1,479 |
6 |
405 |
| January 31-February 2 Snow |
1,246 |
2 |
348 |
| December 23-24 Freezing Rain |
933 |
7 |
299 |
| February 11-12 Freezing Rain |
924 |
3 |
315 |
| January 17-18 Freezing Rain to Snow |
598 |
3 |
171 |
| December 9 Snow |
475 |
2 |
115 |
|
Accident Vehicle Occupants - Missouri, 2008
| Injury Severity |
| Total persons involved |
27,460 |
% |
| Fatalities |
45 |
0.2% |
| Seriously Injured |
402 |
1.5% |
| Injured (minor) |
3,196 |
11.6% |
| Not injured |
21,250 |
77.4% |
|
| Seat Belts |
| Seat Belt Used |
19,949 |
72.6% |
| Child Restraint Used |
828 |
3% |
| Belt available but not used |
921 |
3.6% |
| No seat belt available |
1,074 |
4.2% |
|
This table shows the impact of seat belt use:
| Restraint |
Fatalities |
Serious
Injuries |
Minor
Injuries |
No
Injuries |
| Seat Belts |
15 |
244 |
2,471 |
17,127 |
| Child Restraints |
0 |
6 |
68 |
745 |
| Belt available but not used |
24 |
101 |
328 |
462 |
| No seat belt available |
2 |
15 |
91 |
957 |
|
| Drivers |
| Total Drivers |
18,127 |
% |
| Male |
10,415 |
57.5% |
| Female |
7,704 |
42.5% |
| Age: under 18 |
853 |
4.7% |
| Age: 18-24 |
3,813 |
21% |
| Age: 25-39 |
5,741 |
31.7% |
| Age: 40-54 |
4,626 |
25.5% |
| Age: 55-69 |
2,085 |
11.5% |
| Age: 70+ |
493 |
2.7% |
|
|