Icy Road Accident Statistics
The USDOT Federal Highway Administration data lists an average of 1,836 deaths and 136,309 injuries per year due to snowy and icy roads [1]. These figures represent the 10 year average between 2005 and 2014.
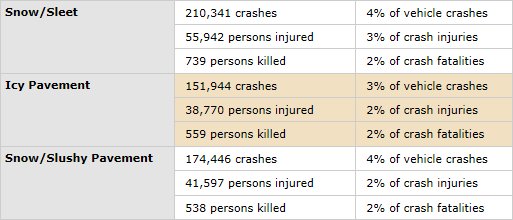
USDOT FWHA Statistics [1]
Currently, icy road deaths are not included in the official NOAA/National Weather Service weather fatalities statistics. This NOAA graphic shows the various types of weather hazards that are presently counted in official data [2]:
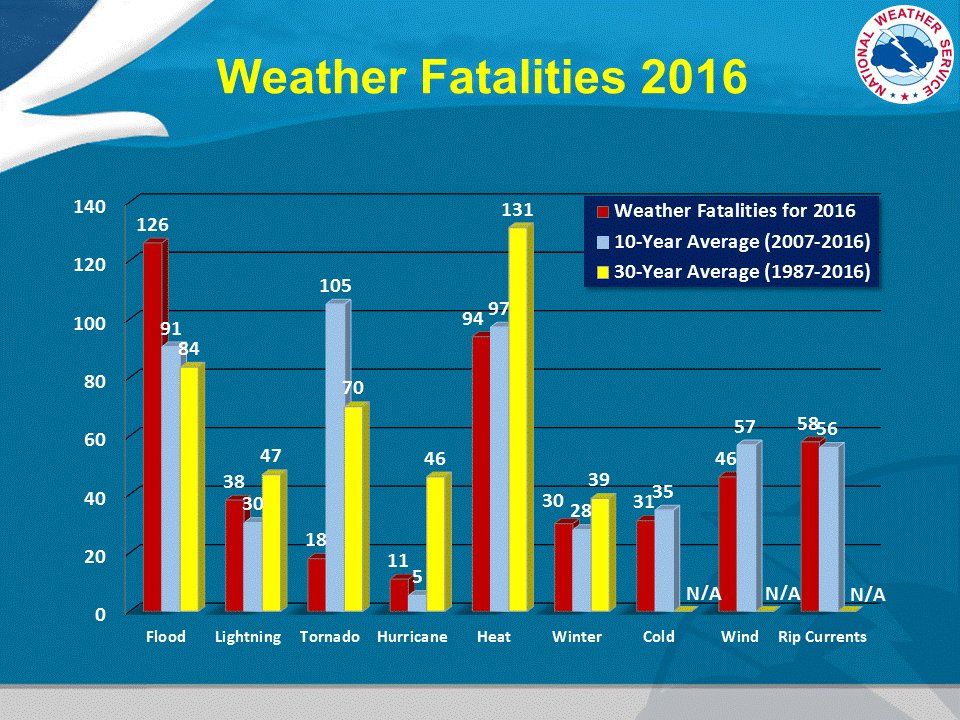
The average icy road fatality count is 3.6 times the total deaths from all other weather hazards combined (507, the 10 year average). If the above NOAA graphic were to include the deaths from icy and snowy roads, it would look like this (note that this second graphic was edited by icyroadsafety.com and is not officially endorsed by NOAA/NWS).
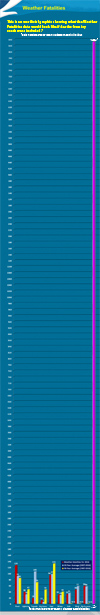
Click to enlarge
The reasons to count icy road deaths as weather-related are compelling.
Consider that most flood deaths, which are counted as weather-related in official NOAA statistics, involve people who knowingly drove their vehicles into flooded roads. A widely accepted cause of these incidents is the fact that many people do not understand the danger of even small amounts of water flowing over a road. Icy roads are a hazard that, at minimum, is identical in terms of a deficient public perception of the danger. Furthermore, icing created by supercooled liquid precipitation (freezing rain and freezing drizzle) goes far beyond this, taking drivers by complete suprise by virtue of its near-complete invisibility on road surfaces.
Rainy weather and dry weather accidents
A frequent question is about the fact that there are more fatal accidents recorded overall during rainy and dry weather. The key distinction is the overall direct impact from the conditions and the accident rate within a given amount of time during the conditions. Dry weather and rainy weather are very common conditions across most of the USA, and their impacts to the population at large are minimal to non-existent. Accident-per-hour rates during dry conditions and rain are very low. Icy road conditions, by contrast, are present only a handful of times a year in most US regions, yet they produce acutely high accident rates in those short amounts of time. Road icing also brings significant impacts to affected areas on a level not experienced during rainy conditions. For example, rainy days never produce hundreds of wrecks across a metro area or thousands of crashes across a state within a few hours' time as icy road events tend to do. Freezing rain can shut down roads and highways across entire regions within minutes, something not seen during many hours or even days of ordinary rain.
The implications of this as a motorist is that you are far more likely to have an accident when driving during an icy road condition than an equivalent amount of time driving during rainy or dry weather.
Media-sourced icy road fatality statistics
From 2008 to 2010, icyroadsafety.com compiled media-sourced crash reports on a daily basis through the two winter seasons. Data derived from this method is incomplete, as not all fatal crashes are reported in newspapers and television (the USDOT figures above provide a more thorough data set). However, the media-sourced stats can give us an idea of the distribution of crashes on a state-by-state basis as well as some other details such as seat belt usage and the type of winter precipitation that was responsible for creating the road conditions.
Maps of Media-Sourced Accidents
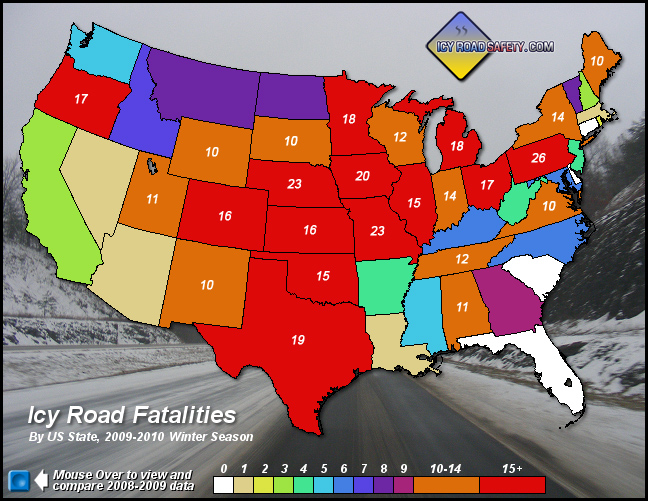
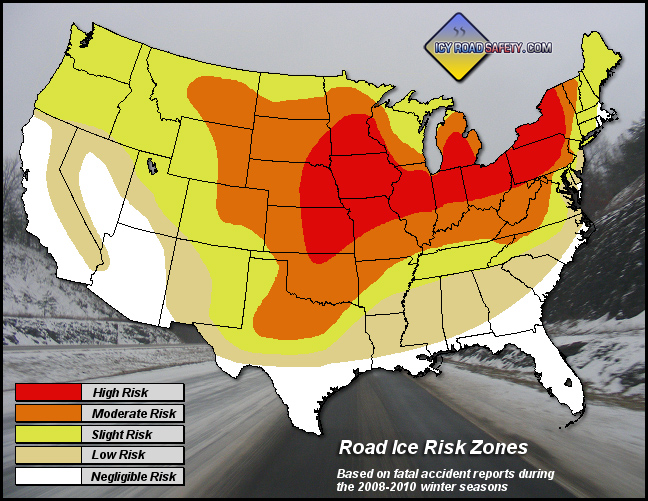
Risk Zones: The map above shows where fatal icy road crashes are most likely to occur based on two seasons of data (2008-2010). Fatal crashes can occur anywhere icing occurs, however - even in the deep South! The data shows that the Midwestern and Plains states have the highest incidence of road ice-related deaths. These are regions that traditionally place the majority of their weather awareness on convective severe weather (hail, tornadoes and high winds) that inflict comparitively much less human casualties:
| Comparing 2008-2009 Average Annual Fatalities from Tornadoes [4] and Road Ice [3] |
| State |
Tornado
Fatalities [4] |
Road Ice
Fatalities [3] |
| Oklahoma |
7 |
15 |
| Kansas |
2 |
14 |
| Texas |
0 |
19 |
| Iowa |
6 |
22 |
| Missouri |
11 |
20 |
| Minnesota |
1 |
27 |
|
Sources: [3] icyroadsafety.com, based on published media reports; [4] NOAA data (2008, 2009)
Probable explanations for the Plains/Midwest region's higher road ice fatality numbers are the fact that travel often takes place on rural highways at high speeds, the average trip/errand requires more mileage (increasing the risk of ice encounters), and all travel must be done by automobile (public transportation or walking/biking is not an option). In addition, unlike in northern states, icing events in the Midwest/Plains tend to be intermittent and widely spaced in time rather than season-long. Intermittent icing events cause more deaths because motorists are caught unprepared. In general, the fewer road icing events a location sees per winter, the greater the rate of fatalities per event results.
Areas where roads are snow and ice covered most of the winter (such as the Rockies and the Upper Midwest region) tend to have a lower concentration of road ice deaths due to the population being well-adjusted to the hazard. Most road ice fatalities in the Rockies, for instance, occur with out-of-state travelers passing through on the major highways. Major urban areas - such as Chicago and much of the New England region - also tend to have lower fatality rates, most likely due to shorter distances on the average trip/errand, available public transportation and slower speed limits on most roadways.
Data Tables
| Top Ten States for Icy Road Fatalities - 2009-2010 season [3] |

# |
State |
Fatalities |
Notes |
| 1 |
Pennsylvania |
26 |
Pennsylvania: 7 deaths on 12/13, freezing rain event |
| 2 |
Nebraska
Missouri |
23
23 |
Missouri: 10 deaths in 3 days, including two 4-fatality crashes on 12/26 and 12/27 |
| 3 |
Iowa |
20 |
|
| 4 |
Texas |
19 |
|
| 5 |
Michigan |
18 |
|
| 6 |
Minnesota
Ohio
Oregon |
17
17
17 |
Oregon: 9 deaths in 13 days (November 8-21) |
| 7 |
Colorado
Kansas |
16
16 |
|
| 8 |
Illinois
Oklahoma |
15
15 |
|
| 9 |
Indiana
New York |
14
14 |
|
| 10 |
Tennessee
Wisconsin |
12
12 |
|
| Download Excel file of full 2009-2010 state-by-state data - See full 2009-2010 accident list |
|
| Deadliest Winter Storms for Icy Roads - 2009-2010 season [3] |
| # |
Event |
Fatalities |
Notes |
| 1. |
December 22-27, 2009 Midwest/Plains blizzard/snow/icing |
35 |
Accidents in KS, NE, TX, OK, IL, MN, NM, CO, MO, AR |
| 2. |
January 6-8, 2010 Midwest/Eastern US snowstorm |
15 |
Accidents in MO, IL, IN, OH, KY, GA, IA |
| 3. |
December 13, 2009 freezing rain event |
13 |
7 deaths in Pennsylvania, 2 in OH, 1 each in WV, MD, IL, NY |
| January 28-31, 2009 winter storm |
13 |
Deaths in MS, AL, GA, NC, TN, MO, OK |
| 4. |
December 25-27, 2009 Missouri/Illinois light snow |
12 |
10 deaths in Missouri, including two quadruple fatal crashes and two secondary crashes |
| 5. |
December 8-9, 2009 Midwest/Plains blizzard/snow/icing |
11 |
Accidents in NM, MI, TX, IA, MO, MN |
| 6. |
December 3-4, 2009 Upper Midwest Winter Storm |
9 |
6 deaths in Wisconsin, including triple fatal crash |
|
Sources
Educational Winter Driving Videos - Watch for Free:
Home | Risk | Stats | Accident Video | Icy Bridges | Tips | Warning Signs | If You Slide | If You Wreck
1,836
Average annual
deaths in the US
from icy roads
136,309
Average annual
injuries in the US
from icy roads
[ More Statistics ]
|
|